Abstract
This study utilized a multi-stage constant current (MSCC) charge protocol to identify the optimal current pattern (OCP) for effectively charging lithium-ion batteries (LiBs) using a Dandelion optimizer (DO). A Thevenin equivalent circuit model (ECM) was implemented to simulate an actual LiB with the ECM parameters estimated from the offline time response data obtained through a hybrid pulse power characterization (HPPC) test. For the first time, DO was applied to metaheuristic optimization algorithms (MOAs) to determine the OCP within the MSCC protocol. A composite objective function that incorporates both charging time and charging temperature was constructed to facilitate the use of DO in obtaining the OCP. To verify the performance of the proposed method, various algorithms, including the constant current-constant voltage (CC-CV) technique, formula method (FM), particle swarm optimization (PSO), war strategy optimization (WSO), jellyfish search algorithm (JSA), grey wolf optimization (GWO), beluga whale optimization (BWO), levy flight distribution algorithm (LFDA), and African gorilla troops optimizer (AGTO), were introduced. Based on the OCP extracted from the simulations using these MOAs for the specified ECM model, a charging experiment was conducted on the Panasonic NCR18650PF LiB to evaluate the charging performance in terms of charging time, temperature, and efficiency. The results demonstrate that the proposed DO technique offers superior charging performance compared to other charging methods.
1. Introduction
Recently, the climate problem has emerged as a significant issue, primarily caused by the greenhouse effect stemming from the mass consumption of fossil fuels. In response, renewable energy sectors such as wind and solar energy have been developed to replace fossil fuels. Additionally, electric vehicles are being promoted as alternatives to fossil fuel-based internal combustion engines along with advancements in energy storage devices designed to store renewable energy. Lithium-ion batteries (LiBs) are widely utilized in energy storage systems and electric vehicles due to their compact size, high energy density, long lifespan, low self-discharge rate, high discharge current tolerance, and absence of memory effect. However, LiBs are sensitive to overcharging, over-discharging, and ambient temperatures and variations, leading to issues such as rapid increases in charging temperature, low charging efficiency (CE), and reduced lifespan. Consequently, ongoing research aims to address these challenges. Generally, battery performance is determined primarily by the selection of battery materials and the manufacturing process technology. Once the battery is manufactured, its performance is influenced by the effectiveness of the battery management system (BMS) and the operating conditions determined by the user. Among these factors, the most critical aspect of the BMS is that the battery charging technology significantly impacts overall battery performance. Efficient charging technology is essential for several performance factors, including fast charging speed, lower charging temperature, extended battery life, and improved CE.
By utilizing an effective battery charging algorithm, charging times can be reduced. An elevated charging temperature can induce thermal stress within the battery, which is linked to safety concerns such as rapid performance degradation, battery expansion, and fire hazards. Implementing appropriate charging technology can alleviate the increases in charging temperature. Improved battery charging technology can mitigate temperature increases during charging. Enhanced battery charging technology can also prolong battery lifespan by alleviating the decline in the state of health (SOH) associated with the number of charge/discharge cycles. Furthermore, increased energy loss during the charging process can diminish CE, thereby reducing overall energy transfer efficiency. Therefore, optimal charging technology can significantly enhance the performance of lithium-ion batteries when integrated with BMS.
The constant current-constant voltage (CC-CV) charging method [1,2] is a commonly used technique that initially charges the battery using constant current (CC), gradually increasing the battery voltage until it reaches the upper limit of 4.2 V. At this point, the charging method switches to constant voltage (CV), and the charging current begins to decrease until it reaches the minimum set value. The CC-CV method combines the advantages of both CC and CV methods and is relatively simple and easy to implement, making it the most widely used charging technology to date. However, the CV charging stage requires a lengthy charging time, which extends the overall charging duration. Additionally, it does not allow for direct control of the increase in charging temperature, leading to reductions in battery life and charging efficiency (CE). To address these issues, there has been significant research in improving charging time and CE while managing charging temperature. One such advancement is the modified CC-CV method known as the boost charging (BC) CC-CV method, which enhances charging speed compared to the traditional CC-CV approach [3,4]. The BC method differentiates itself from the standard CC-CV by incorporating a high CC or a constant power cycle during the charging process. In this approach, a current pump is utilized in the CC mode, while a pulse current is applied in the CV mode. Experimental results indicate that the BC method achieves a higher and consistent CE while maintaining a total charging time similar to that of the traditional CC-CV method.
The pulse charging technique has been proposed by various researchers to reduce the charging time and temperature rise, and extend the lifespan of lithium-ion batteries (LiBs) [5,6,7,8]. There are several types of current pulses, characterized by their frequency, amplitude, and duty cycle. Numerous pulse-charging patterns have been suggested in the literature as alternatives to the traditional CC-CV charging method. Pulse charging relies on periodic variations in current pulses with adjustable current speeds and directions. During the charging process, the charging current can be paused, increased, decreased, or replaced with short discharge pulses for a specific duration. This technique can significantly enhance the charging performance when appropriate parameter settings and operating conditions are applied; however, it often requires complex controllers and incurs high implementation costs.
Finally, the multistage constant current (MSCC) charging method offers advantages such as easy implementation, low temperature rise, and high CE compared to conventional CC-CV-based charging and pulse charging methods. Unlike traditional methods, the MSCC charging approach does not include a CV mode, which imposes constant stress on the battery, thereby helping to extend battery life. Instead of using the CV mode, MSCC employes multiple CC stages with varying current values. In this method, the charging current profile consists of multiple CC stages with different current amplitudes, where the current at each stage is applied to the battery until a specific criterion is met. The stage transition points in the MSCC charging method can be determined using the state of charge (SOC) or cut-off battery terminal voltage. An MSCC charging strategy using the SOC values as the current transition threshold was proposed in [9,10,11,12,13]. In this approach, the SOC values facilitate the transition from one constant current stage to another. The process can be uniformly divided into ten stages [11], three stages [12], or optimized to four stages [13], which is then applied to LiBs to evaluate the charge time, charge efficiency, charge and discharge capacities, and temperature rise during charging. The SOC-based MSCC method can reduce charge time, improve charge efficiency, enhance charge/discharge capacities, reduce temperature rise, and extend the life of LiBs compared to the CC-CV method. However, because the SOC value, which is crucial for intermediate current transfer at each stage, cannot be directly measured, various methods such as Coulomb counting [14], Kalman filtering [15], extended Kalman filtering [16], and unscented Kalman filtering [17] have been utilized. Despite these techniques, SOC estimation remains challenging due to significant variations in battery parameters such as voltage, current, and operating temperature. Errors can arise from aging and nonlinear behavior during the battery’s operation life. Moreover, the SOC-based step transition method incurs computational costs and complexity due to the numerous parameters involved in LiB operation. Consequently, applying SOC-based transitions in practical applications can be challenging, as they rely on SOC parameters that are difficult to measure directly.
Therefore, in this study, the cut-off voltage was utilized as the transition criterion or the CC charging technology. This approach simplifies the implementation of the MSCC charging method, as the cut-off voltage can be easily measured during the charging process. The cut-off voltage-based criterion is the most commonly used criterion for transitioning from one stage to the next and is typically determined in advance by the battery manufacturer. For cobalt-based LiBs, this is generally set at 4.2 V. In this method, when the cut-off voltage is reached during charging, the current is reduced, and the charging continues until the cut-off voltage is reached again. This process is repeated until a predefined number of stages is completed, making the implementation straightforward. Each CC stage can be executed in various configurations, including four stages [18,19,20], five stages [21,22,23,24,25,26,27,28,29], and ten stages [30], to evaluate the life and performance of the LiB. However, dividing the charging process into five stages has been reported to be optimal in terms of computational efficiency and performance [23]. The MSCC charging strategy has been shown to improve CE, shorten charging time, enhance charge and discharge capacities, reduce temperature rise, and extend the lifespan of LiBs compared to the traditional CC-CV method. Additionally, the cut-off voltage-based criterion is simpler and easier to implement than other SOC-based methods.
The performance indicators of the MSCC charging method, including total charging capacity, charging time, and CE, depend on the selection of current values for each stage. Thus, it is crucial to adopt an efficient method to determine the optimal charging pattern (OCP) to enhance the performance of the MSCC charging method. While mathematical techniques such as the Taguchi method [21,24] and Bayesian optimization [26] have been employed to identify the optimal OCP, these methods necessitate experimental verification of candidate charging patterns, which can be time-consuming and significantly increase the time and cost associated with finding the optimal solution. In [21], a Thevenin equivalent circuit model (ECM) was implemented, which does not require extensive experimentation and time cost for lithium-ion batteries. In this study, the OCP was derived by differentiating a charging time equation consisting of mathematically derived current and voltage variables. This approach allows for easy implementation without using the CV mode to charge the battery to its maximum capacity. However, it is important to note that this method is primarily optimized, neglecting various performance indicators such as temperature rise and charging loss.
Metaheuristic optimization algorithms (MOAs) simulate the movements of plants and animals in search of food or survival, as well as the physical chaos phenomena of nature. They have been widely applied to optimization problems due to their advantages, including few parameters, ease of implementation, and the ability to achieve a balance between exploration and exploitation during the optimization process. To explore the OCP in the MSCC method, the particle swarm optimization (PSO) algorithm [31] was utilized in [18,23,28], the grey wolf optimization (GWO) algorithm [32] was employed in [27], and the jellyfish search algorithm (JSA) [33] was applied in [28]. Furthermore, charging time (CT) and charging loss were selected as objective functions for each optimization of the performance indicators of the MSCC charging method [27,28]. However, CT, which is a key objective of OCP, and the charging loss indicator have an indirect relationship, complicating the optimization process. Additionally, calculating the charging loss during the optimization is complex.
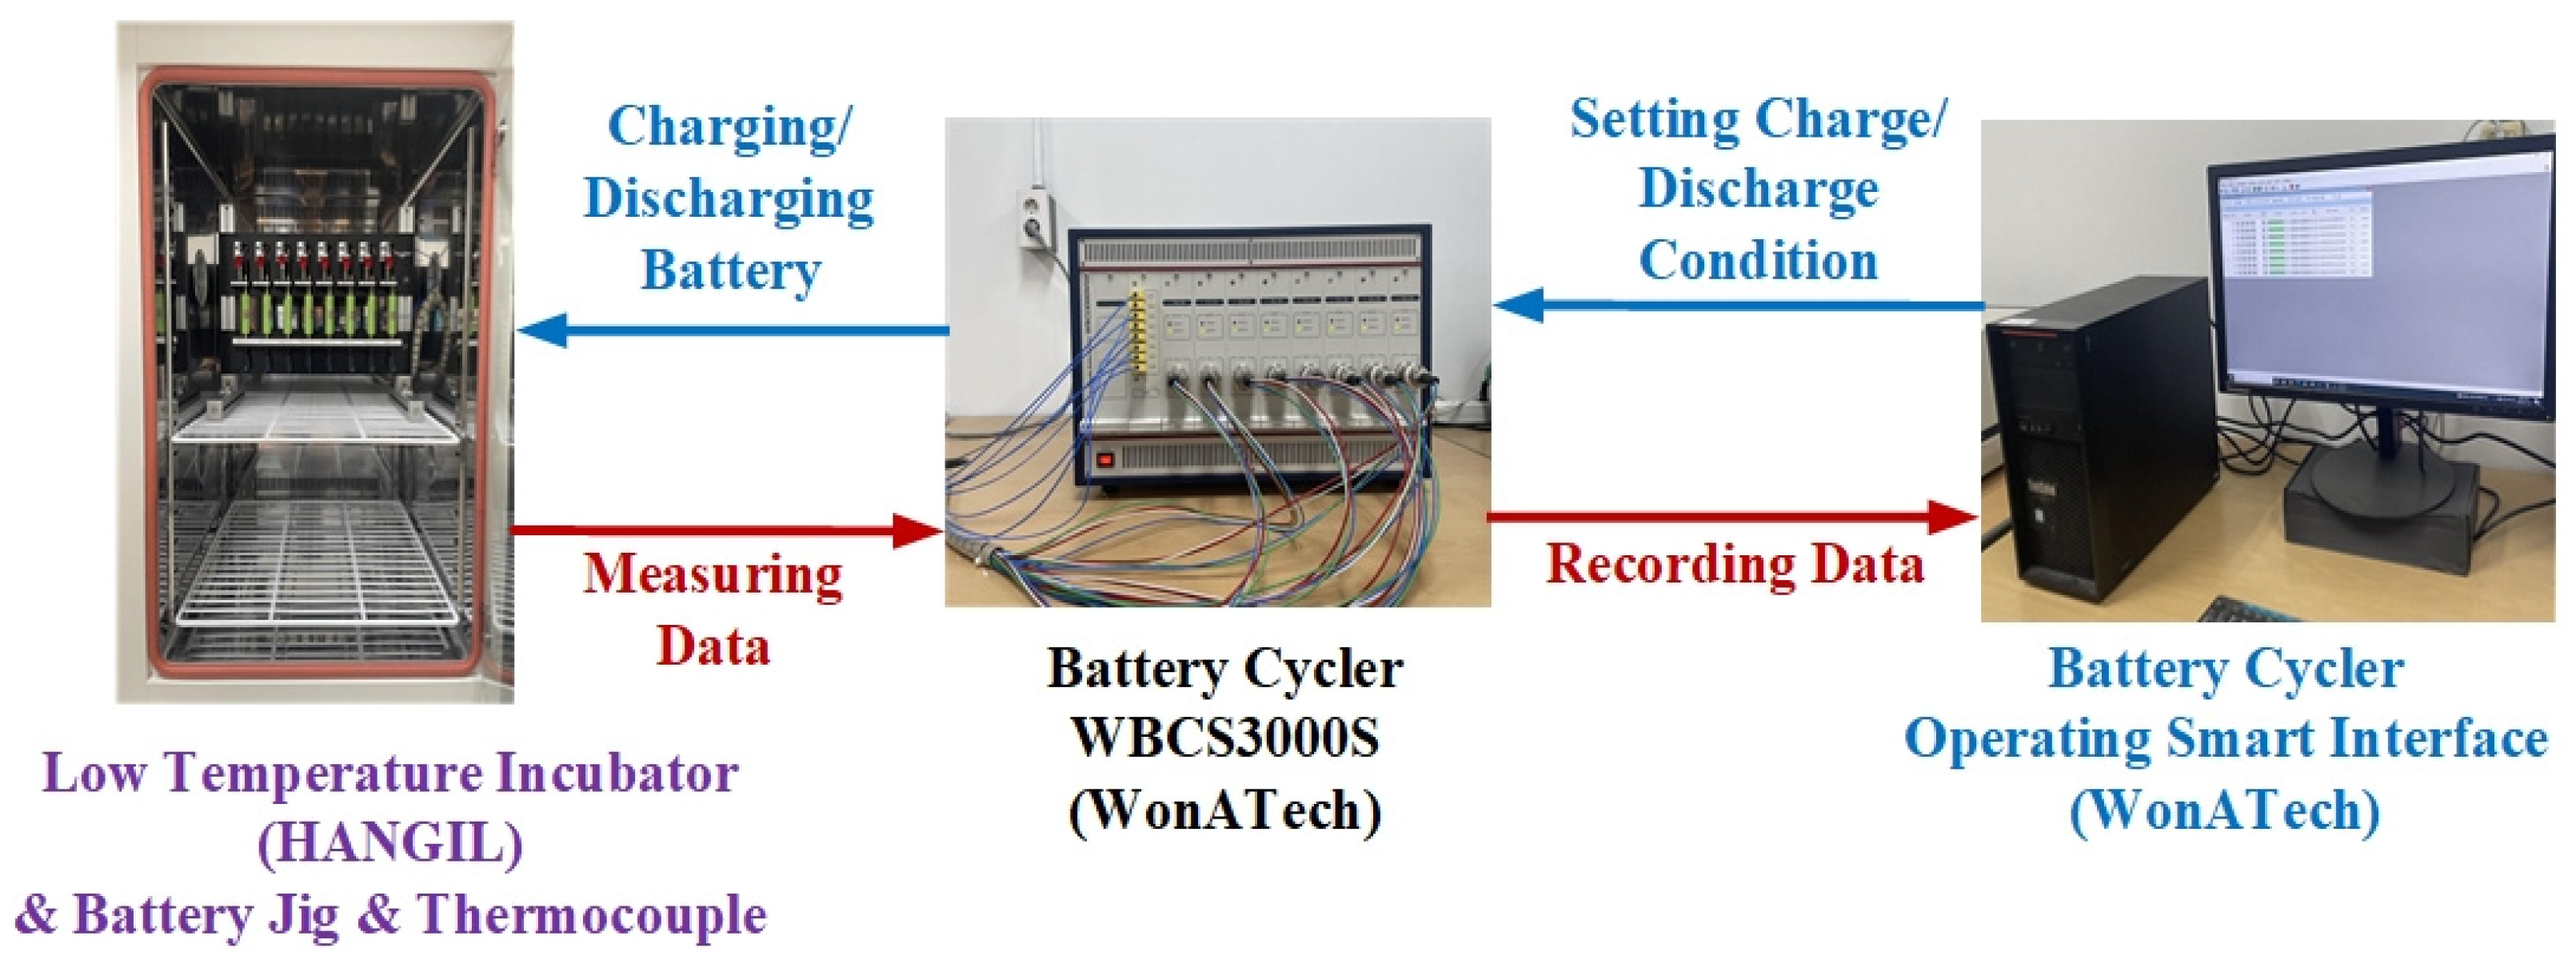
To implement an accurate ECM, electrochemical impedance spectroscopy (EIS) is conducted to derive the internal resistance, polarization resistance, polarization capacity, and time constant values of the model. Since the cycler experimental equipment for battery charging and discharging only measures the charging voltage, current, and temperature, a separate and costly potentiostat equipment is required to perform EIS analysis on the LiBs.
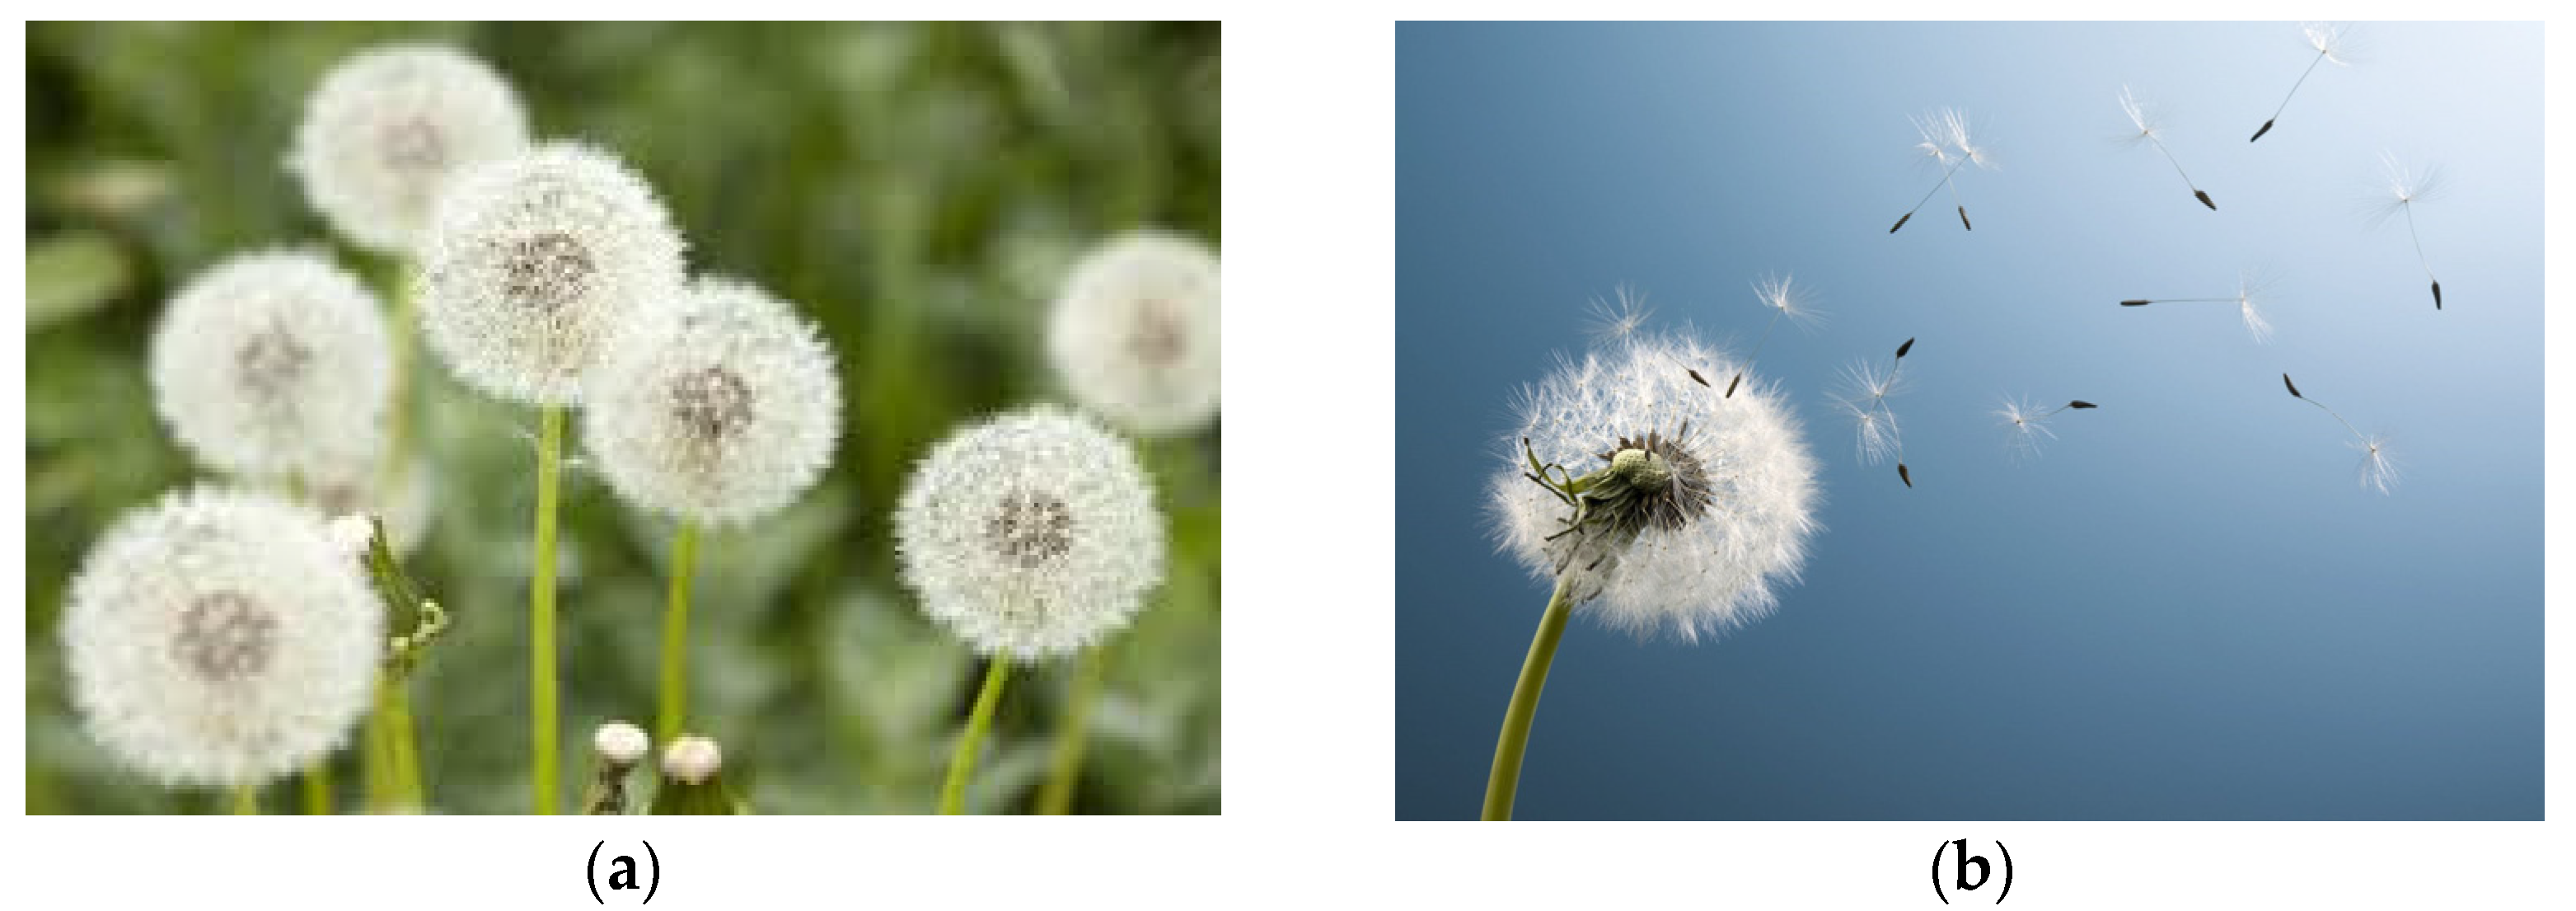
Based on the aforementioned background, this study adopted the ECM of lithium-ion batteries with the Dandelion optimizer (DO) algorithm [
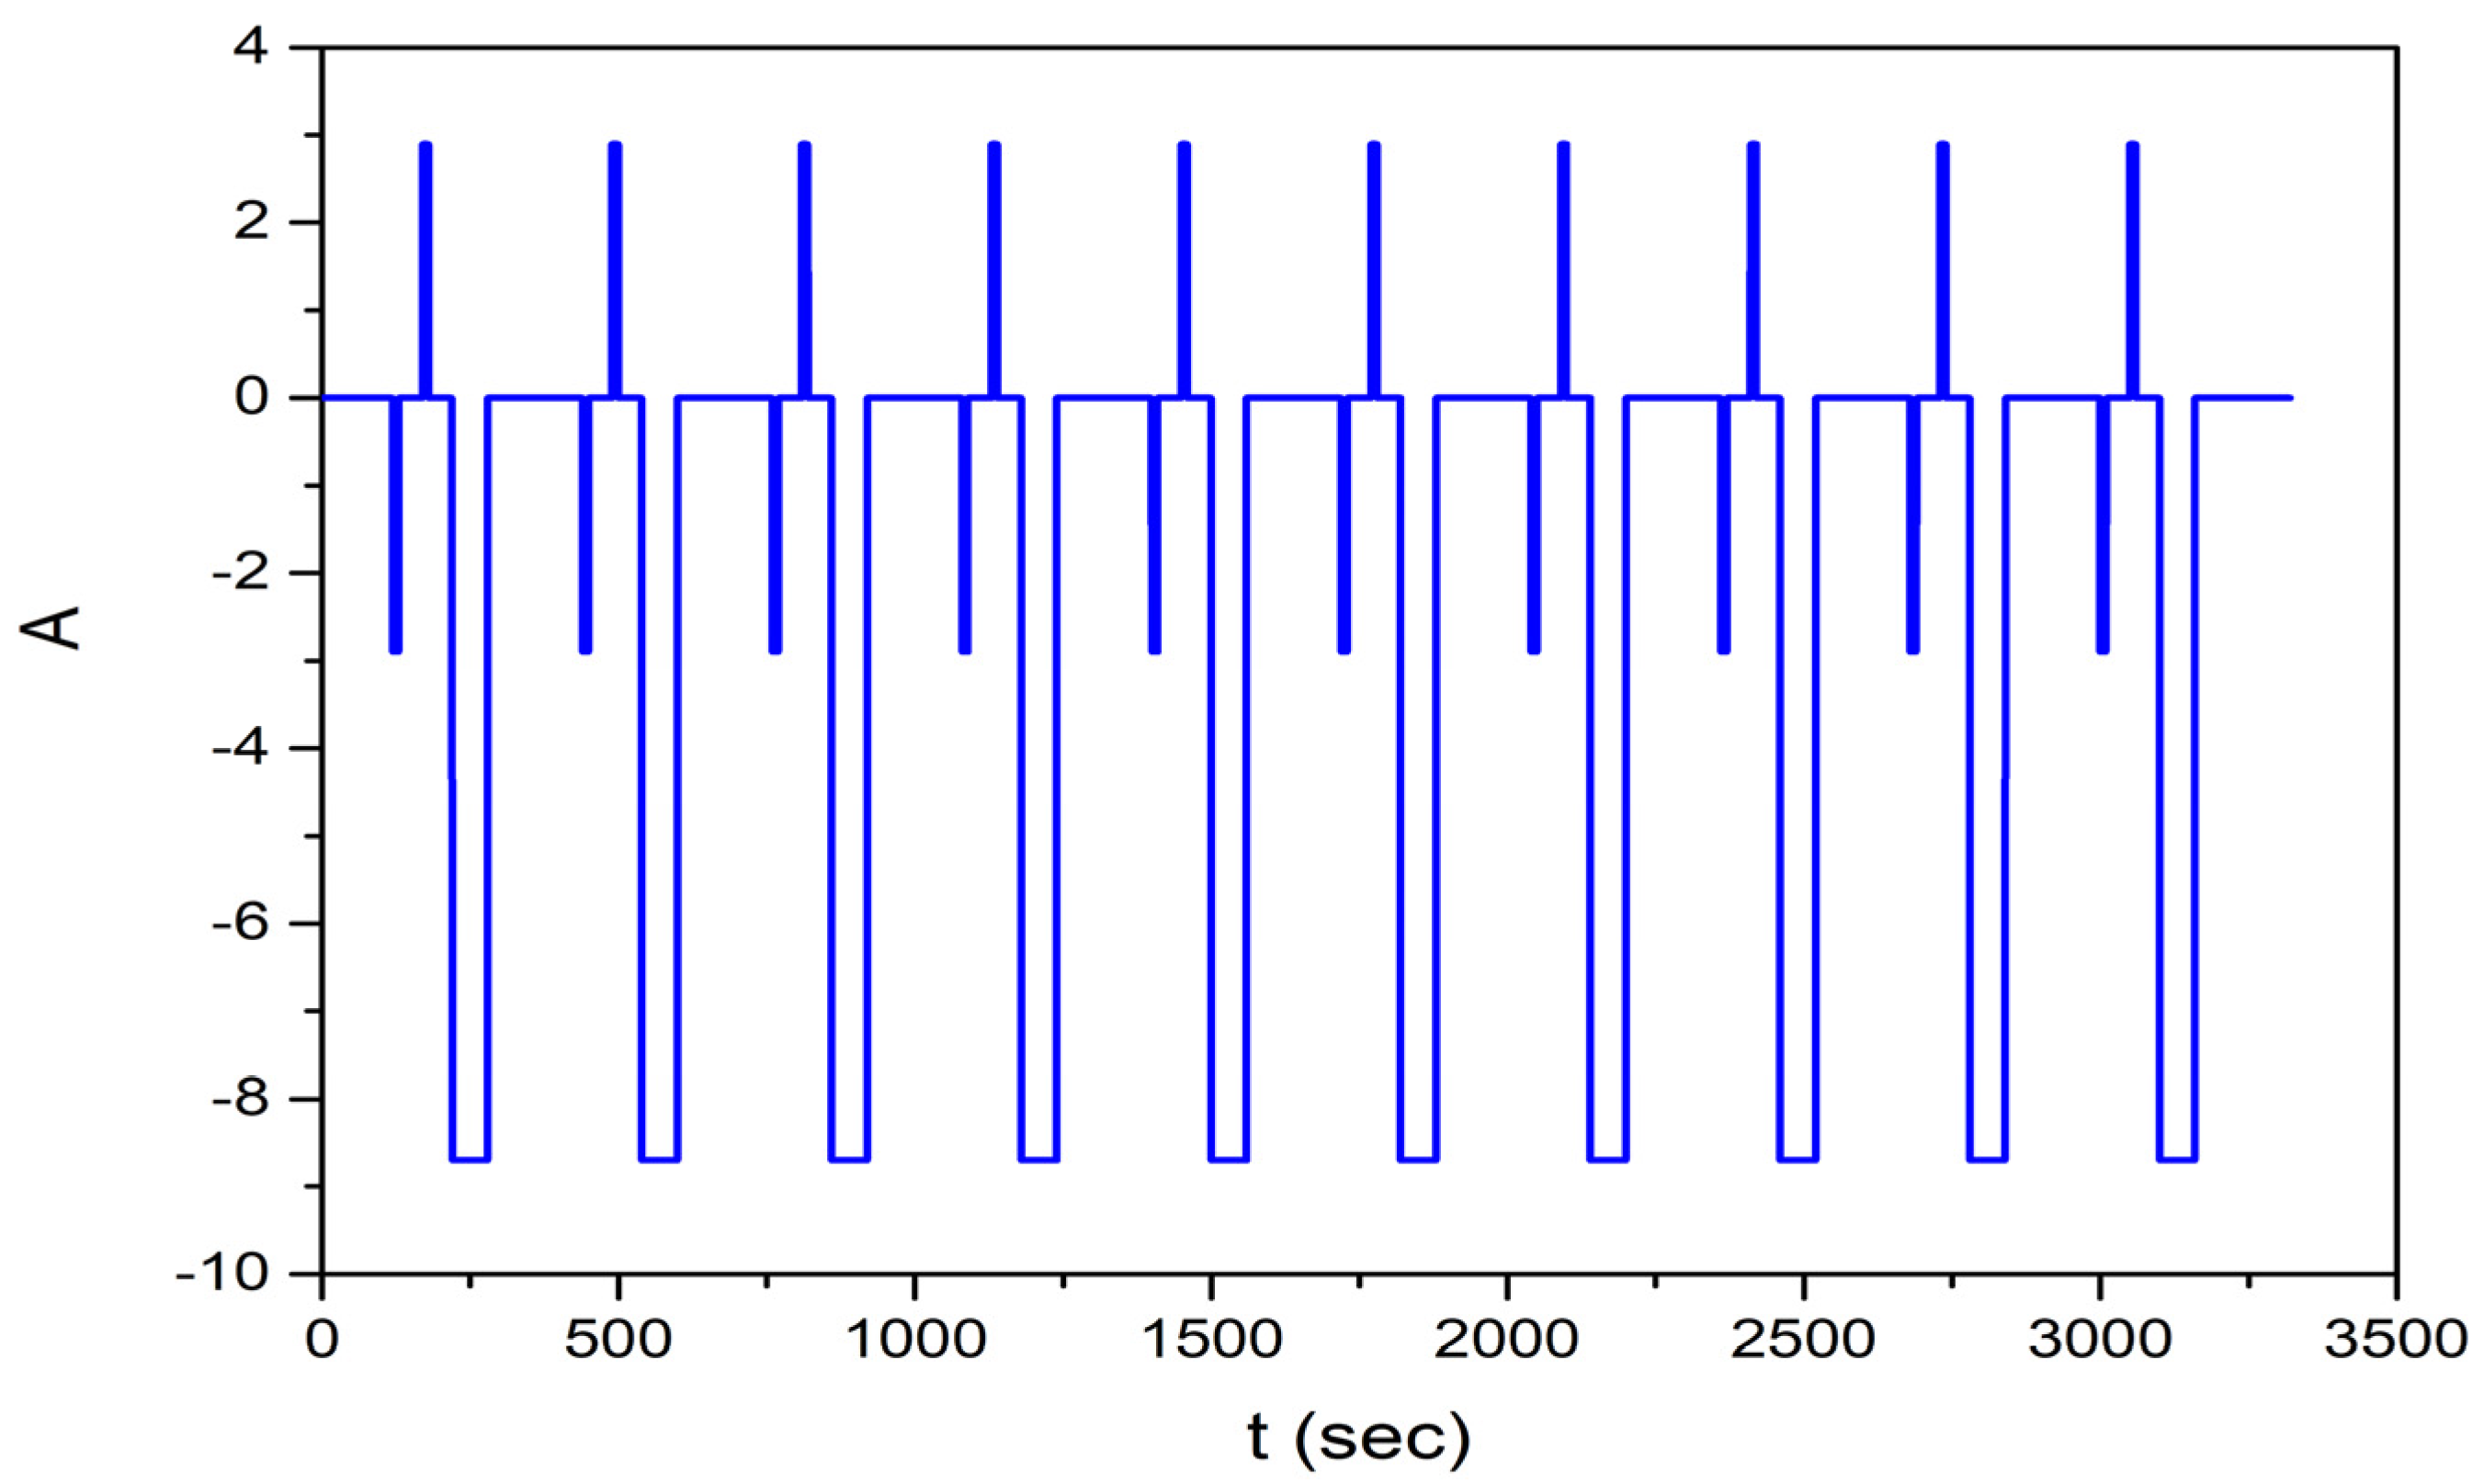
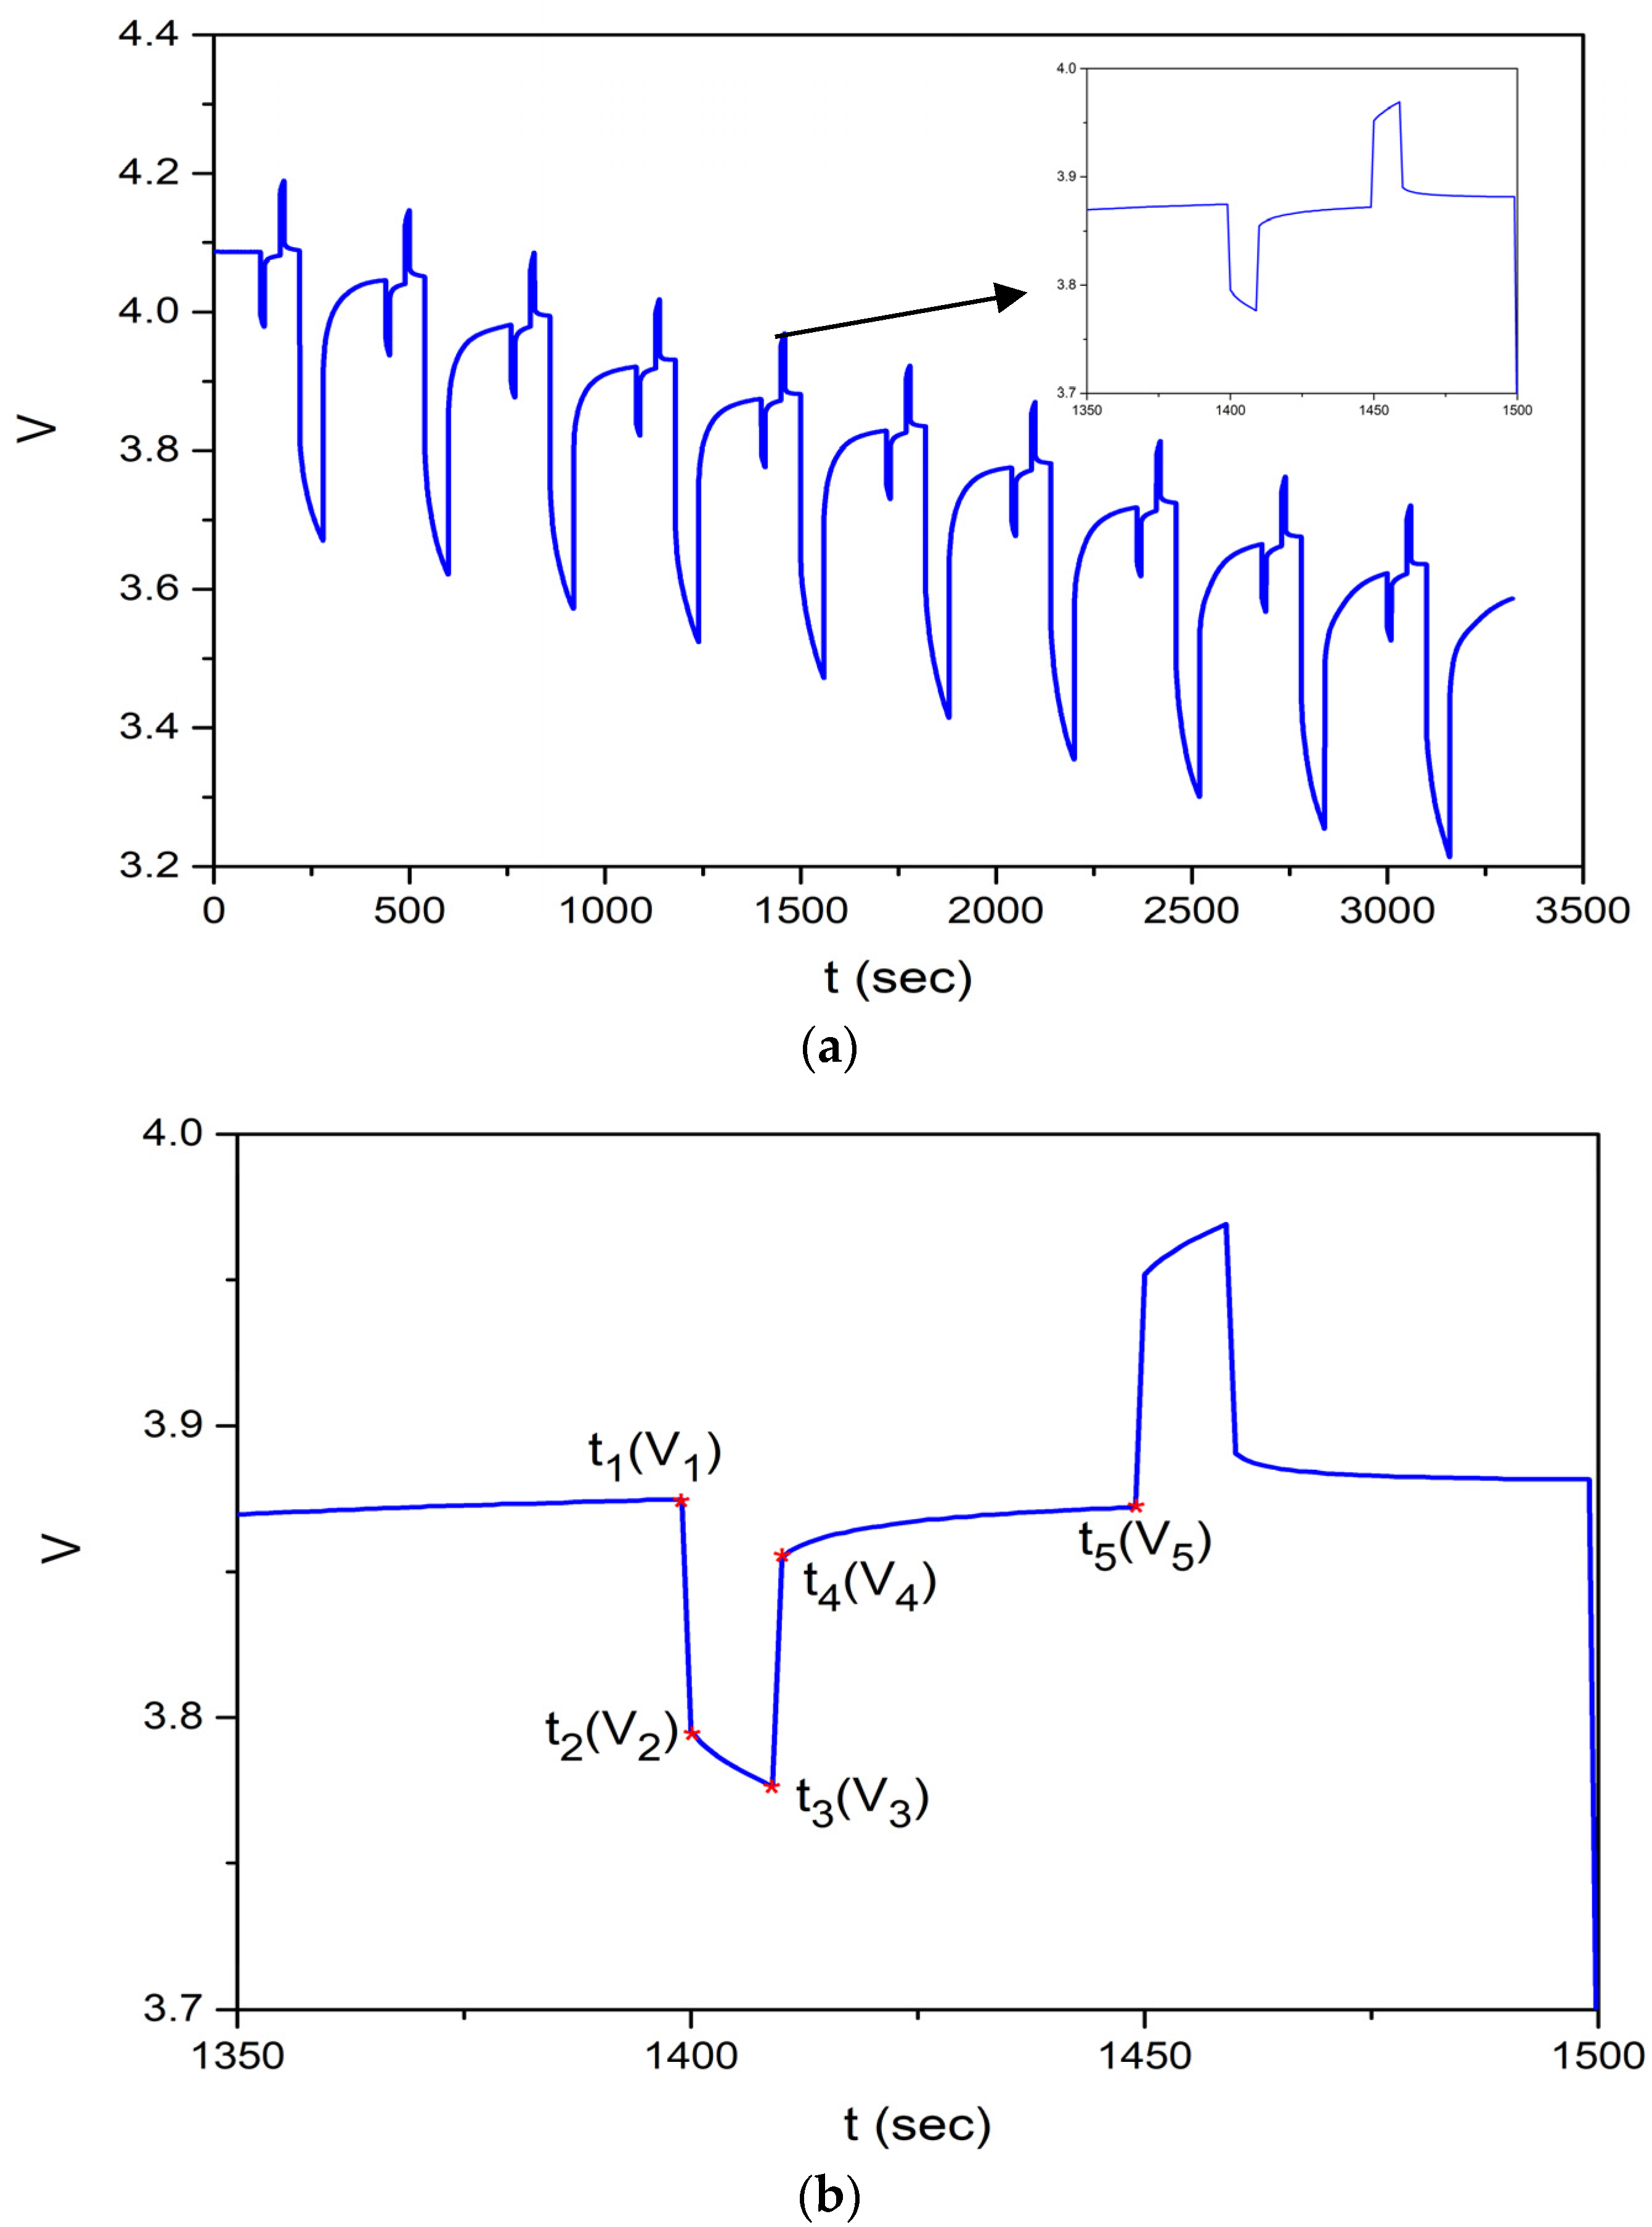
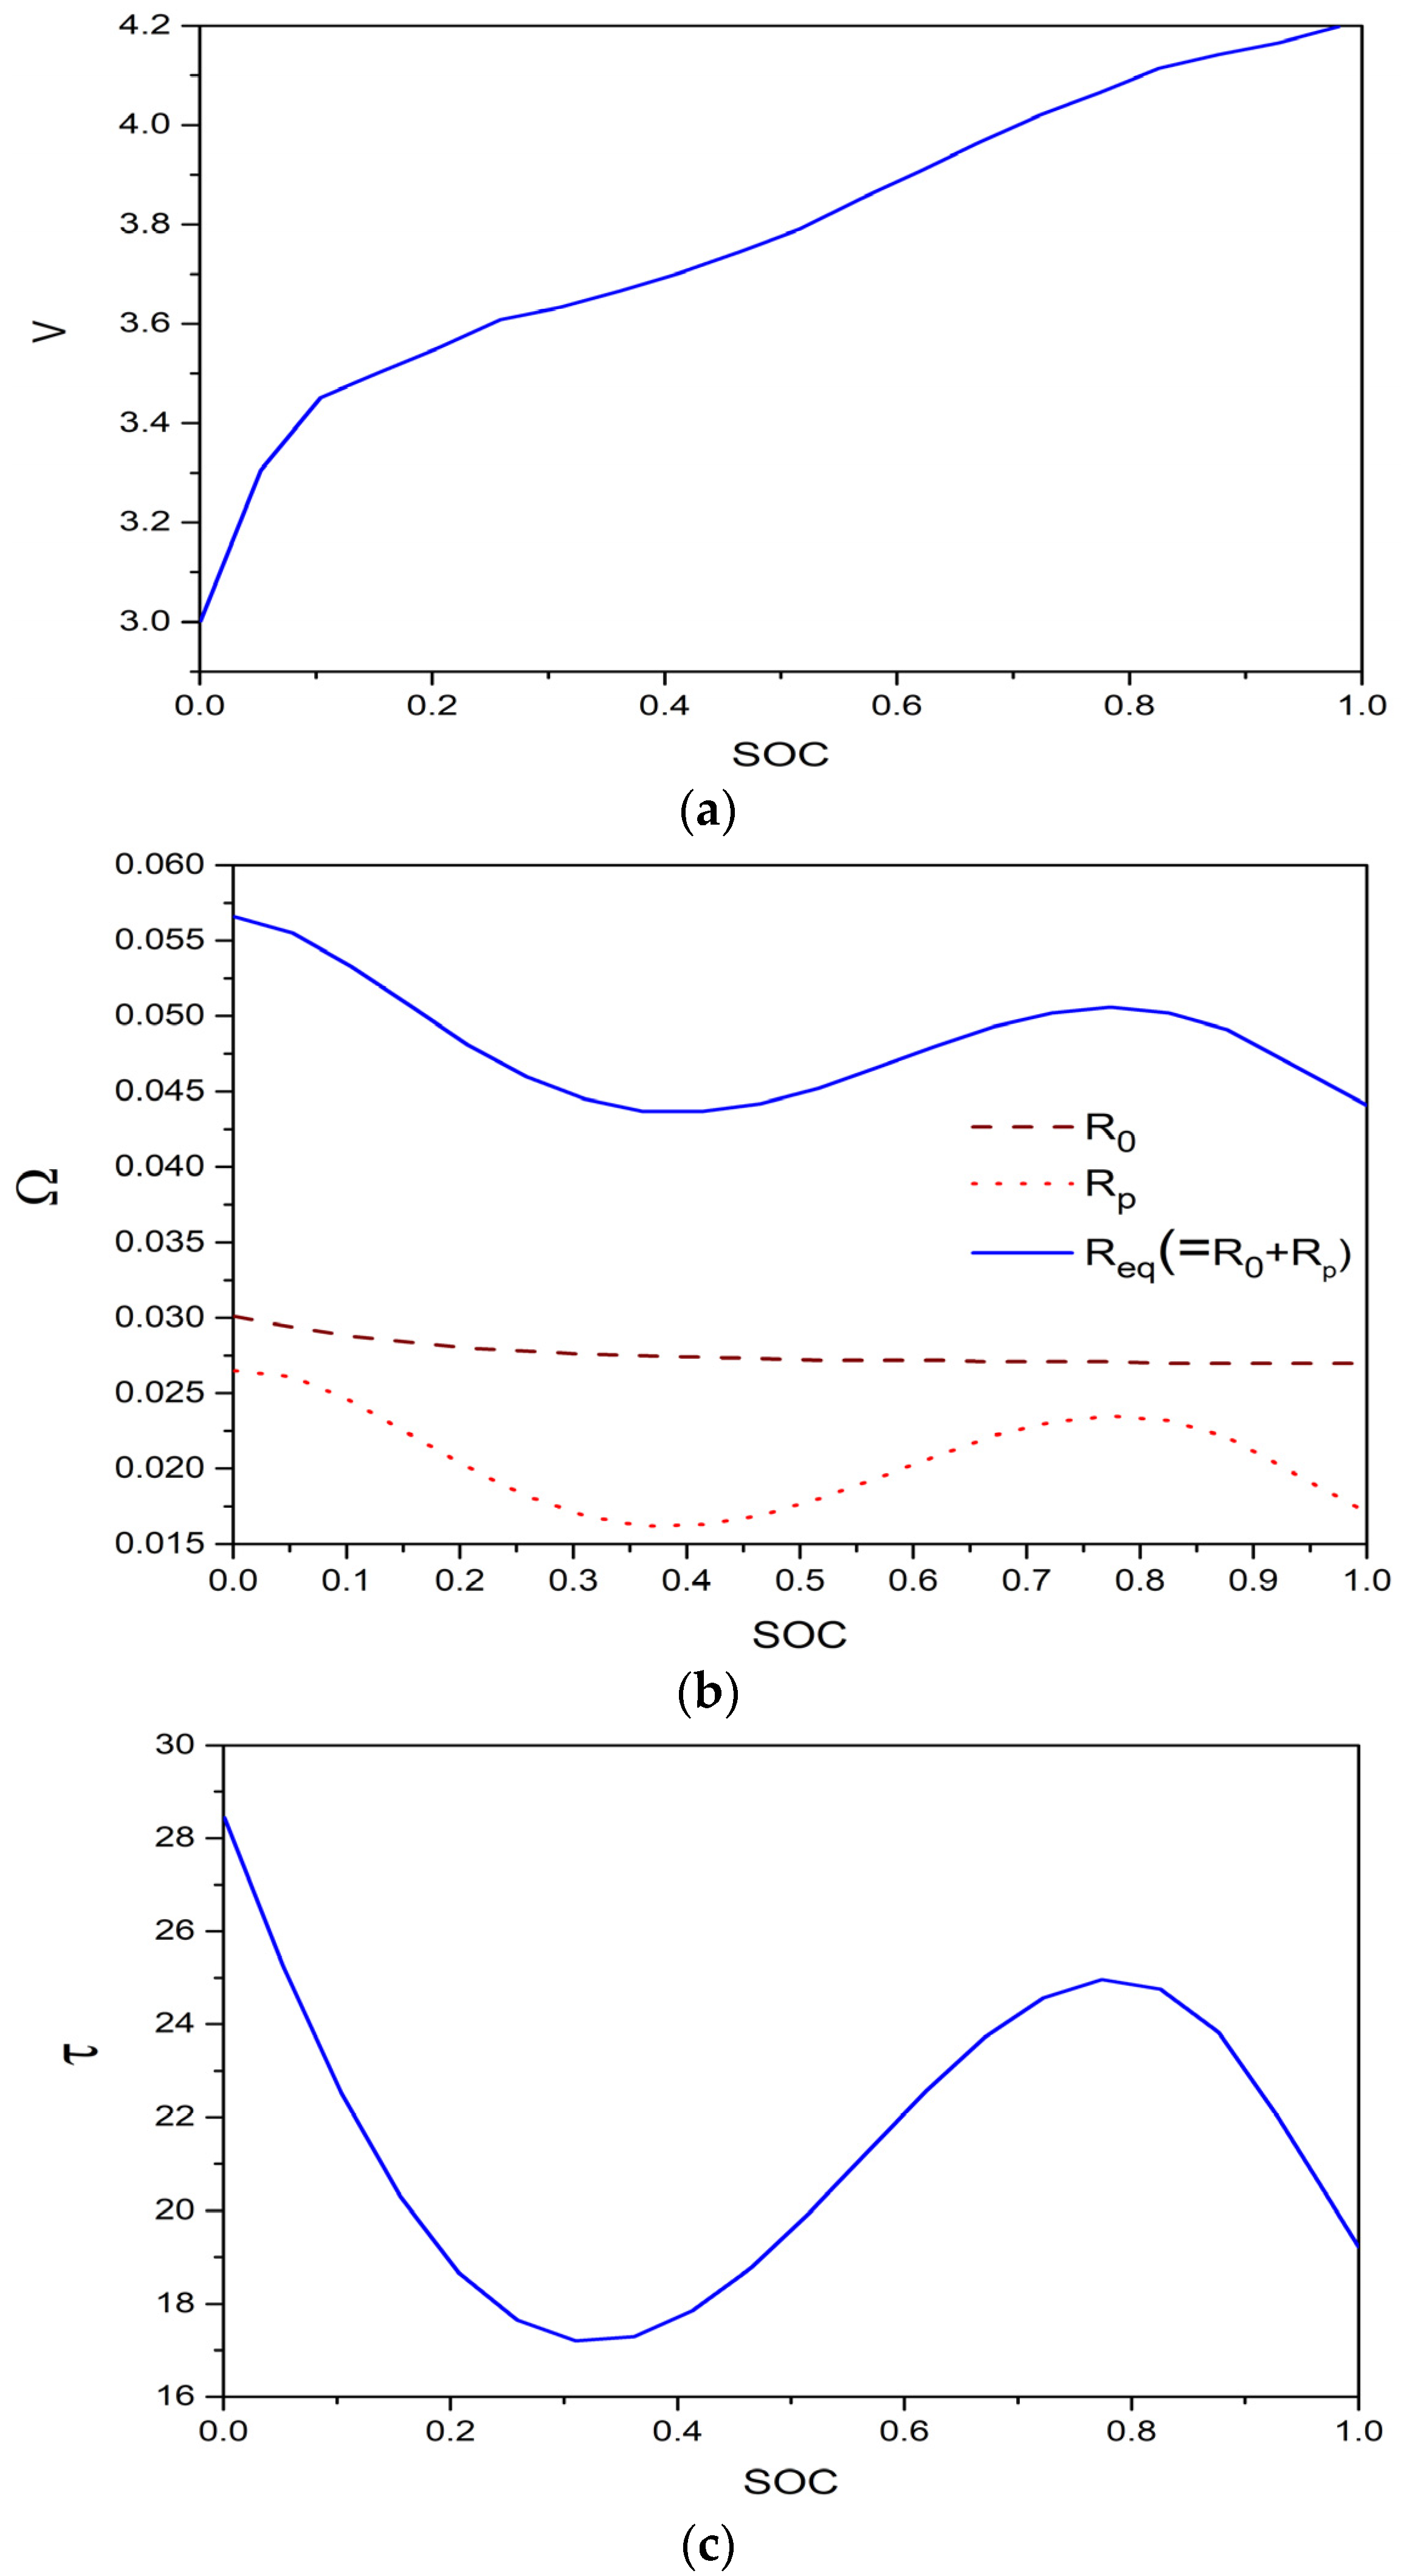
34], a type of MOA. The OCP of the MSCC charging method simultaneously considers the performance indices of charging time and charging temperature. Unlike previous research methods, this study first estimated the ECM model parameters offline, such as internal resistance, polarization resistance, polarization capacity, and time constant, based on voltage measurements obtained using the hybrid pulse power characterization (HPPC) test [35,36,37] in the time domain. In this test, pulse charge/discharge current is applied, and only the output voltage is measured, allowing for a simpler and more cost-effective implementation of the ECM model compared to the EIS method. Second, charging time and temperature were selected as the objective functions for optimizing the performance indices of the MSCC charging method. Consequently, the charging temperature and the optimization objective function were directly related, simplifying the calculation process since the charging temperature was measured directly during optimization. Third, among the recently studied metaheuristic algorithms, including PSO, GWO, and JSA, we selected other algorithms such as the war strategy optimization (WSO) algorithm [38], beluga whale optimization (BWO) algorithm [39], levy flight distribution algorithm (LFDA) [40], and African gorilla troops optimizer (AGTO) algorithm [41], which have been relatively frequently cited. We compared these with the DO algorithm applied in this study and evaluated their charging performance indices. By utilizing the DO, the OCP search could be conducted rapidly through application to the ECM-based platform without requiring numerous lengthy experimental processes.
The remainder of this paper is organized as follows: Section 2 provides a detailed description of the basic concepts of the proposed charging technique, including the construction of the battery ECM, estimation of ECM parameters using the HPPC in the time domain, derivation of the mathematical relations for the proposed MSCC charging method, formulation of the optimization problem, and definition of the objective function. Section 3 describes the DO algorithm. Comparative simulations and experimental results against several existing methods are presented in Section 4, demonstrating that the proposed method is more valid and effective than the current alternatives. Finally, Section 5 concludes this study.
2. Equivalent Circuit Modeling of the Lithium-Ion Batteries
2.1. Modeling of the Equivalent Circuit Model and Parameter Identification of the Lithium-Ion Battery
In general, the Thevenin ECM parameters of LiBs are identified through EIS analysis and time-domain extraction using the HPPC test. The impedance of the Thevenin ECM is obtained by applying a small-amplitude sine waveform of the AC voltage and current to the electrodes. In the AC impedance method, the impedance parameters are identified by generating Nyquist plots based on the EIS data measured with a potentiostat. However, this method necessitates additional equipment, specifically a potentiostat, alongside a charge-discharge cycler. In contrast, the time-domain-based Thevenin ECM method utilizes voltage and current time-series data. This approach is advantageous because it eliminates the need for costly impedance measurements using a potentiostat. Furthermore, battery cells, packs, and modules can be characterized and modeled directly based on the data collected solely with batter charge-discharge cycler equipment. The Thevenin ECM is illustrated in Figure 1.
Figure 1.
Thevenin equivalent circuit model, where denotes the internal resistance, and represent the polarization resistance and capacitance, respectively, which characterize the rapid electrode reaction to the battery, and indicates the battery capacitance. The equivalent internal resistance is defined by .
In this study, the utilized LiB was the Panasonic NCR18650PF LiB with the specifications listed in Table 1.
Table 1.
Specifications of the Panasonic NCR18650PF LiB.
The experimental battery charging/discharging cycler system is shown in Figure 2. The WBCS3000S battery cycler and its operating software is Smart Interface software Ver. 1.8, which were manufactured by WonATech Corp. (Seoul, Republic of Korea). The charging temperatures of the battery were measured using thermocouples attached to the battery, which was fixed in a low-temperature chamber. The desired charging and discharging conditions were regulated by Smart Interface software installed on a desktop computer. The measured voltage, current, and temperature of the battery were transferred to the desktop via the battery cycler.
Figure 2.
Experimental battery platform.
The single HPPC test involved a cycle 1C discharge/charge current held for 20 s, followed by a 3C discharge current held for 60 s. Ten cycles were spaced at 1.0, 0.9, 0.8, …, 0.2, and 0.1 of the SOC, as depicted in Figure 3.
Figure 3.
Current pulse charge/discharge variations.
The corresponding curve of the HPPC experimental voltage variation for the current pulse input variation is shown in Figure 4. Ten open-circuit voltage values corresponding to the SOC values from 1.0 to 0.1 could be obtained directly, as illustrated in Figure 4a. The analysis in Figure 4b provided the following four features: (1) As the discharge started at , the terminal voltage of the battery dropped suddenly from to because of the voltage change caused by the resistance of the battery. (2) From to , the terminal voltage of the battery decreased slowly from to due to the battery’s polarization effect. (3) From to , the terminal voltage of the battery rose suddenly from to because of the voltage changes caused by the internal resistance of the battery. (4) The terminal voltage of the battery increased slowly from to for to , which represents the discharge process of the polarization capacitance through the polarization resistance. To obtain the internal resistance, the sudden change in the battery terminal voltage at the time points of discharge and cessation had to be analyzed, both of which were caused by the internal resistance. The internal resistance value can be calculated as
Figure 4.
HPPC experimental voltage curves. (a) Pulse power tests. (b) A single pulse power test.
The time constant is obtained as follows:
After obtaining the time constant , the polarization resistance can be calculated as follows:
The polarization constant can be obtained using the following relationship:
The parameter identification results are presented in Figure 5. The simulation model for the Thevenin ECM was constructed using the Simscape and Simulink packages of the MATLAB software R2024b. The thermal model is constructed as follows:
where denotes the convective heat, represents the heat transfer coefficient, indicates the cell area, and refers to the temperature increase. The charging temperature was set to . The CC-CV charging results at 1C for the Panasonic NCR18650PF LiB based on the identified parameters are shown in Figure 5. The root mean square errors (RMS) for the charging current, voltage, and temperature rise between the constructed model and the real battery were calculated as 1.3%, 2.2%, and 22%, respectively. The RMS value of the temperature rise was relatively high, but since the maximum charging temperature was more critical for the battery performance, this deviation was acceptable.
Figure 5.
Identified characteristic curves. (a) OCV vs. SOC. (b) , and vs. SOC. (c) vs. SOC.
2.2. Mathematical Description of the MSCC Charging Method
The charging time, charging cost, and charging capacity of the MSCC charging method for the Thevenin ECM of the LiB were derived by analyzing the electrical relationships. Based on Kirchhoff’s voltage law for the circuit shown in Figure 1, the terminal voltage can be expressed as
where . Figure 6 illustrates a conceptual diagram of the MSCC method, showing the typical battery charging voltage and current shapes corresponding to varying SOC. Previous work [23] demonstrated that a five-stage CC approach is efficient. Although increasing the number of current stages can reduce charging time, it also increases the complexity and implementation costs. From Figure 5, the charged battery capacity of each state is given by
where denotes the charging current of the previous stage and represents the increased OCV of each state compared to the OCV of the previous stage. From (7), the charging time required in the charging stage can be calculated as follows:

Figure 6.
CC-CV charging curves. (a) Charging voltage (b) Charging current. (c) Charging temperature.
The OCV in stage s, can be expressed as
where denotes the cut-off voltage of each current transition point and represents the charging current of each stage.
In the MSCC charging method illustrated in Figure 7, the current at each stage is selected constantly like the CC mode of the CC-CV technique: in the CC stage, the voltage increases to the cut-off voltage, where once the voltage reaches the cut-off, the current decreases exponentially, like the current behavior in the CV mode, with the voltage drop determined by the following equation; in the next stage, the voltage increases again according to the selected CC value. The charge current rate at each stage is constrained to be lower than the previous stages for better charging efficiency, which is defined as the ratio of the discharge capacity to the capacity charged in the battery during the charging process.
Figure 7.
Conceptual diagram of the MSCC charging method.
Based on (4), the voltage drop at each stage can be expressed as
where denotes the charging current of stage. The current amplitude of the final stage was calculated to charge the battery to 100% capacity as follows:
Therefore, the total charging time can be obtained by summing the times of the MSCC charging stage as follows:
The energy loss (EL) was calculated by integrating the ohmic loss of each CC stage as follows:
2.3. The Objective Function Formulation for OCP
Defining and designing the objective function is essential for applying an optimization algorithm before utilizing a metaheuristic optimization approach. The fitness values of each particle were calculated by minimizing the value of the objective functions through the iterative process with random initial conditions for each particle. In previous studies [27,28], charging time and energy loss were selected as the physical quantities of the objective function to achieve the dual benefits of reducing both charging time and temperature rise. While the charge time is closely related to the charging current at each stage, the direct relationship between charge temperature and energy loss, as expressed by (15), remains unclear. The energy loss function is primarily linked to the charging current, which may not directly correspond to variations in charging temperature. Thus, in this study, we consider the charge temperature parameter instead of energy loss as the objective function. This approach allows for a direct optimization of the charge temperature. To construct the fitness value function, the maximum and minimum values of the charge time and charge temperature were determined using the CC-CV charging method. A charging current range of 0.5C to 2C was applied within the Thevenin ECM-developed Simulink and Simscape platforms on MATLAB software. The values obtained are summarized in Table 2.
Table 2.
Data obtained by the CC-CV charge method.
The objective function in this study is proposed as follows:
where and denote the charge time and charge temperature, respectively, represent the charging current values, and indicates the weighting index between the charge time and the charge temperature. The optimization problem for obtaining the optimal charge currents in each charge state can be formulated as follows:
where denotes the set of all feasible charging patterns, and and represent the allowable maximum charging current and voltage values. These parameters are set at 5.8 A and 4.2 V, respectively.
3. Metaheuristic Optimization Algorithm for the OCP Searching Protocol
3.1. Inspiration for MOA
Searching for the optimal charge current in the MSCC process is challenging when employing a trial-and-error approach that solves evaluating every possible combination of charging values. This method can be both time consuming and costly. To address these issues, MOAs have demonstrated significant effectiveness in various studies and applications. In this study, MOAs are employed to optimize the charging current values for the ECM derived from the time-domain identification process. The objective function is designed to minimize the charging time and temperature of the selected LiB cell. The ECM, constructed using the measured battery parameters, is synthesized with the Simscape utility in MATLAB. Owing to the limitations of current cycler equipment, it is impractical to construct online experiments for directly identifying the OCP on a real LiB cell. Therefore, the MOA is applied to the synthesized ECM platform instead. This approach allows for an extensive search for the OCP within a virtual ECM framework, enabling effective exploration of a wide range of potential charging patterns while ensuring that the optimization process is both efficient and reliable.
3.2. Overview of the Dandelion Optimization Algorithm
3.2.1. Inspiration
The dandelion shown in Figure 8 [42,43], an herbaceous perennial in the Asteraceae family, reaches heights of over 20 cm and is distinguished by its wind-pollinated seeds. Dandelion is a typical wind-pollinated plant. These seeds are dispersed by the wind, aided by a crown of hair that allows them to float for extended durations and travel over vast distances, often covering tens of kilometers under optimal conditions. The seeds fall slowly due to two symmetrical vortices created overhead and stabilized by the crown’s porous structure. The seeds’ travel behavior changes based on wind velocity and weather conditions, unfolding in three main stages. In the rising stage, a vortex appears above the seeds, significantly increasing the drag under sunny and windy conditions, while rain prevents vortex formation. During the descending phase, the seeds gradually descend after reaching a certain height. Finally, in the landing stage, the seeds disperse randomly, depending on local wind and weather conditions, where they may establish new plants.
Figure 8.
Dandelions in nature. (a) Dandelion growths. (b) Dandelion floating in the wind.
3.2.2. Mathematical Model
The mathematical model of the DO can be segmented into three primary stages: the rising or exploration stage, the descending or exploitation stage, and the landing stage [34].
Rising Stage
During the rising stage, dandelion seeds must reach a certain height to separate from their parent plant. Weather conditions influence how many seeds rise, with wind speed and humidity acting to increase the number of seeds. For simplicity, weather conditions can be divided into two categories:
Case 1 (clear day): Wind speeds on clear days have a lognormal distribution along the Y-axis, resulting in a greater spread of random numbers, which increases the chance for dandelion seeds to travel distances. As a result, there is the chance for the dandelion seeds to be randomly scattered across various locations based on wind conditions within the search space. The wind speed determines the height which a seed can rise; higher wind speeds lead to increased flight height and wider dispersion of seeds. The wind also constantly modulates the vortices above the seeds, allowing them to ascend in a spiral motion. The seeds’ motion is expressed as follows:
In (18), denotes the position of the dandelion seeds at the iteration index t; represents the randomly selected position in the search space at the iteration index t; and , where is a random number, denote the lift component coefficients of a dandelion caused by the separated eddy action; denotes a lognormal distribution subject to the mean ; and the variance , which is expressed as
where denotes the standard normal distribution, and is an adaptive random perturbation, which is expressed as
and eventually approaches 0 with an increase in iteration. enables the algorithm to concentrate on global search during the early stages and then transition to local search in the later stages, after completing a full-stage search.
Case 2 (rainy day): Air resistance, humidity, and other environmental factors prevent the dandelion seeds from rising, leading them to remain within local neighborhoods. This localized exploitation is described by the following expression:
where is a parameter used to regulate the local search domain of a dandelion expressed by
This exhibits a downwards convex fluctuation. As the number of iteration increases, the value of gradually approaches 1, ensuring that the population eventually converges to the optimal search agent.
Descending Stage
In this stage, exploration is emphasized in this stage as the dandelion seeds steadily descend to a specific height. Brownian motion is employed to simulate the movement behavior of the dandelions. The normal distribution of Brownian motion enables individuals to traverse multiple search communities during the iterative update process. Average position information is utilized to reflect the stability of the dandelion descent, allowing the population to develop as a cohesive unit within promising communities. This behavior is expressed as follows:
where denotes a random number of standard Brownian motions and represents the average position of the population in the th iteration. The information regarding the average population position directly influences the evolutionary direction of the individuals through iterative updates. The irregular Brownian movement, driven by a global search, increases the likelihood of the search agent escaping local extrema and compels the population to seek areas near the global optimum.
Landing Stage
Exploitation is emphasized at this stage. The dandelion seeds are randomly selected landing sites based on the information from the previous stages. As the iterations progress, the DO algorithm converges to the global optimal solution. Consequently, the optimal solution is considered as the approximated best position where the dandelion seeds can thrive. To achieve accurate convergence to the global position, search agents leverage information about the current elite for exploitation within their local neighborhoods. As the position evolves throughout the iteration process, the global optimal solution can be attained from the behavior expressed as follows:
where denotes the optimal position of the dandelion seed in the th iteration, represents the Levy flight function, and indicates a linearly increasing function. To prevent excessive exploitation, a linearly increasing function was applied to individuals. The Levy flight coefficient was utilized to simulate the movement step size of the agents, enabling them to make significant strides to other positions with a high probability under a Gaussian distribution. This approach effectively generates more local search areas while requiring fewer iterations.
4. Simulation and Experiment Results and Discussion
4.1. Computing Parameter Setting
The LiB parameters, and the maximum and minimum values of the charge time and temperature required for the fitness value function are listed in Table 1 and Table 2, respectively. The weighting index in (16) was set to 0.5, indicating an equivalent significance in the FC assigned to both the charge time and charge temperature. Each current (), set between and , affects the charging time and temperature. The cut-off voltage (), set as 4.2 V, determines the transition threshold. The ranges of the five objective current parameter values are listed in Table 3. To verify the efficacy and feasibility of the various MOAs, eight MOA methods were considered, in addition to the formula method: PSO, WSO, JSA, GWO, BWO, LFDA, and AGTO. The key considerations for selecting these MOAs include their up-to-date versions, high citation indices among various MOAs, and their applications in other MSCC studies. Most of the chosen MOAs are recent developments. The simulation parameters for each MOA are provided in Table 4.
Table 3.
Range setting of the objective current parameter.
Table 4.
Selected parameter values of the applied MOAs.
4.2. Simulation Results
The ECM was constructed using the Simscape Battery and Simulink toolboxes within the MATLAB package, as illustrated in Figure 9. In the MOAs, the current values began at random starting points to prevent the solutions from becoming trapped in local optima. This randomness contributed to variations in the best solutions due to the random fluctuations in the parameters. Consequently, the average MSCC values for each MOA were computed ten times over 100 iterations. The conventional CC-CV method was also included for comparison with the MSCC results obtained through the MOA protocols.
Figure 9.
ECM model for simulation.
The simulation results are presented in terms of four charging performance evaluation indicators (CPEIs): the best FC (FCbest), charge time (CT), maximum charge temperature (MCT), and EL. The results are summarized in Table 5 and Table 6. According to the CPEI results in Table 5, the FC value was the highest for the CC-CV method and the lowest for the DO method. Regarding CT, the FM produced the smallest value; however, due to FM’s inability to manage temperature increases, its CT value was relatively high. Although the CT value for DO was higher than that of FM, it remained the smallest compared to the other MOAs. Furthermore, the MCT value for DO was the lowest, and the EL value for DO was also the lowest, indicating that it was the most efficient method. Selected MSCC values are presented in Table 6.
Table 5.
Simulation CPEI results.
Table 6.
Simulation OCC results.
4.3. Experimental Results
The MSCC experiments were conducted using the experimental setup depicted in Figure 2. Both the simulation and the experiment were conducted based on the five-step current values selected through the simulation, as detailed in Table 6. The results for voltage, current, and charge capacity were obtained using the CC-CV method, and each algorithm is illustrated in Figure 10, Figure 11, Figure 12, Figure 13, Figure 14, Figure 15, Figure 16, Figure 17 and Figure 18, where the label V of the y-axis denotes the charge voltage and the label A of the x-axis denotes the charge current for each stage. For the current, the simulation and experimental values were found to be similar. The voltage waveform also showed a close resemblance between the simulation and experimental results. The experimental results for charge temperature are presented in Figure 19, indicating that the FM, WSO, and CC-CV methods exhibited the highest maximum charge temperatures, while the DO method resulted in the lowest maximum charge temperature.
Figure 10.
Charging configuration of FM. (a) Simulation. (b) Experiment.
Figure 11.
Charging configuration of PSO. (a) Simulation. (b) Experiment.
Figure 12.
Charging configuration of WSO. (a) Simulation. (b) Experiment.
Figure 13.
Charging configuration of JSA. (a) Simulation. (b) Experiment.
Figure 14.
Charging configuration of GWO. (a) Simulation. (b) Experiment.
Figure 15.
Charging configuration of BWO. (a) Simulation. (b) Experiment.
Figure 16.
Charging configuration of LFDA. (a) Simulation. (b) Experiment.
Figure 17.
Charging configuration of AGTO. (a) Simulation. (b) Experiment.
Figure 18.
Charging configuration of DO. (a) Simulation. (b) Experiment.
Figure 19.
Experimental results for the charging temperature.
The experimentally obtained CPEIs are summarized in Table 7. The FC value was largest for the CC-CV method, and was smallest for DO, consistent with the simulation results, showing a reduction of 27% compared to the CC-CV method. The CT value was the smallest for FM, followed by DO, while the CC-CV method had the largest CT value. Regarding MCT, DO exhibited the lowest temperature and FM showed the highest temperature value, mirroring the simulation results. The EL value, which indicates the charging efficiency, revealed the largest loss for the CC-CV method and the smallest for DO, reflecting an 18% reduction compared to the CC-CV method. Table 8 lists the MSCC values obtained from the experiments, which closely aligned with the simulation results. Table 9 displays the normalized CPEI values presented in Table 7, including the results for each normalized CPEI. In Table 9, the normalized CE values were derived from the reciprocal of the EL value, as all values were normalized against the EL value of DO. Higher normalized CE values signify lower EL. The individual values and the total sum of the normalized CPEI values are illustrated in Figure 20. In Figure 20, excluding the CT value where DO ranked second, DO achieved the highest values among the three indices. The results for the overall performance sums are shown in Figure 20e. As depicted in Figure 20e, the CC-CV method produced the lowest performance score, while the PSO, JSA, GWO, BWO, and LFDA algorithms exhibited similar performance levels. In contrast, the performance scores for FM and WSO were relatively low. Notably, DO achieved the highest overall score compared to the other methods, with an 18% higher score than that of the CC-CV method.
Table 7.
Experimental CPEI results.
Table 8.
Obtained experimental OCC values.
Table 9.
Normalized score of the charging performance for each method.
Figure 20.
Bar charts of the performance indicators. (a) FC. (b) CT. (c) MCT. (d) EL. (e) Total score.
5. Conclusions
This study investigated charging performance by applying the DO algorithm for the first time to obtain the OCP for MSCC charging of LiBs. The ECM was configured for the NCR18650PF LiB, and a HPPC test was conducted to generate the time-domain data and estimate the model parameters. To optimize using the DO algorithm, an objective function was constructed that considered both the charging time and the charging temperature. Several recently studied MOA techniques were introduced to validate the charging performance of the proposed DO approach. The OCPs were obtained by conducting simulations that applied the CC-CV method, various MOA techniques, and the proposed DO to the implemented ECM. These OCPs were subsequently utilized in charging experiments on actual LiBs to compare the charging time, charging temperature, and charging efficiency. Analysis of the results from these comparative charging experiments demonstrated that the proposed DO method exhibits the most efficient charging performance when compared to other comparative methods.
Funding
This research was funded by the National Research Foundation of Korea (NRF), funded by the Korean government (MSIT) (NRF-2022R1A2C1003137).
Data Availability Statement
The original contributions presented in the study are included in the article, further inquiries can be directed to the corresponding author.
Acknowledgments
This research was supported by the Basic Science Research Program through the National Research Foundation of Korea (NRF), funded by the Korean government (MSIT) (NRF-2022R1A2C1003137).
Conflicts of Interest
The author declares no conflicts of interest.
References
- Fleury, X.; Noh, M.H.; Geniès, S.; Thivel, P.X.; Lefrou, C.; Bultel, Y. Fast-charging of lithium iron phosphate battery with ohmic-drop compensation method: Ageing study. J. Energy Storage 2018, 16, 21–36. [Google Scholar] [CrossRef]
- Wassiliadis, N.; Schneider, J.; Frank, A.; Lin, X.; Jossen, A.; Lienkamp, M. Review of fast charging strategies for lithium-ion battery systems and their applicability for battery electric vehicles. J. Energy Storage 2021, 44, 103306. [Google Scholar] [CrossRef]
- Notten, P.H.; Op Het Veld, J.H.G.; van Beek, J.R.G. Bosstcharging Li-ion Batteries: A challenging new charging concept. J. Power Sources 2005, 145, 89–94. [Google Scholar] [CrossRef]
- Keil, P.; Jossen, A. Charging protocols for lithium-ion batteries and their impact on cycle life-an experimental study with different 18650 high-power cells. J. Energy Storage 2016, 6, 125–141. [Google Scholar] [CrossRef]
- Amanor-Boadu, J.M.; Guiseppi-Elie, A.; Sanchez-Siencio, E. The impact of pulse charging parameters on the life cycle of Lithium-ion ploymer batteries. Energies 2018, 11, 2162. [Google Scholar] [CrossRef]
- Fang, H.; Depcik, C.; Lvovich, V. Optimal pulse-modulated lithium-ion battery charging algorithm. J. Energy Storage 2018, 15, 359–367. [Google Scholar] [CrossRef]
- Gao, Y.; Zhang, X.; Cheng, Q.; Guo, B.; Yang, J. Classification and review of the charging strategies for commercial Lithium-ion batteries. IEEE Access 2020, 7, 43511–43524. [Google Scholar] [CrossRef]
- Kannan, D.R.R.; Weatherspoon, M.H. The effect of pulse charging on commercial lithium nickel cobalt oxide (NMC) cathode lithium-ion batteries. J. Power Sources 2020, 479, 229085. [Google Scholar] [CrossRef]
- Vo, T.T.; Chen, X.; Shen, W.; Kapoor, A. New charing stragegy for lithium-ion batteries based on the integration of Taguchi method and state of charge estimation. J. Power Sources 2015, 273, 413–422. [Google Scholar] [CrossRef]
- Lee, A.H.; Chen, M.Y.; Hsu, C.H.; Jiang, J.A. Implementation of a SOC based four stage constant current charger for Li-ion batteries. J. Energy Storage 2016, 18, 528–537. [Google Scholar] [CrossRef]
- Zhang, Y.; Xu, S.; Wu, T. Multi-stage constant current charging strategy considering SOC intervals and voltage thresholds. Glob. Energy Interconnect. 2022, 2, 143–163. [Google Scholar] [CrossRef]
- Lee, C.H.; Wang, X.J.; Lin, K.Y.; Jiang, J.A. Experiment-based determination of the optimized current level to achieve multiple constant current charging for Lithium-ion batteries. IEEE Trans. Aserosp. Electron. Syst. 2023, 59, 2648–2657. [Google Scholar] [CrossRef]
- Huang, Q.Y.; Liu, Y.J.; Chen, G.J.; Luo, Y.F.; Liu, C.L. Optimization of the SOC-based multi-stage current constant current charging strategy using coyote optimization algorithm. J. Energy Storage 2024, 77, 109867. [Google Scholar] [CrossRef]
- Zhao, L.; Lin, M.; Chen, Y. Least-squares based Coulomb counting method and its application for state-of-charge (SOC) estimation in eletric vehicles. Inter. J. Energy Res. 2016, 40, 1389–1399. [Google Scholar] [CrossRef]
- Li, Y.; Wang, C.; Gong, J. A combination Kalman filter approach for state of charge estimation of lithium-ion battery considering model uncertainlty. Energy 2016, 109, 933–946. [Google Scholar] [CrossRef]
- Yong, S.; Zilin, M.; Gongyou, T.; Zheng, C.; Nong, Z. Estimatoin method of state-of-charge for lithium-ion battery used in hybrid electric vehicles based on variable structure extended Kalman filter. Chin. J. Mech. Eng. 2016, 29, 717–726. [Google Scholar]
- He, Z.; Chen, D.; Pan, C.; Chen, L.; Wang, S. State of charge estimation of power Li-ion batteries using a hybrid estimation algorithm based on UKF. Electrochim. Acta 2016, 211, 101–109. [Google Scholar]
- Lee, C.H.; Chang, T.W.; Hsu, S.H.; Jiang, J.A. Taguchi-based PSO for searching an optimal four-stage charge pattern of Li-ion battries. J. Eenergy Storage 2019, 21, 301–309. [Google Scholar] [CrossRef]
- Li, Y.; Li, K.; Xie, Y.; Liu, B.; Liu, J.; Zheng, J.; Li, W. Optimization of charging strategy for lithium-ion batery packs based on complete battery pack model. J. Energy Storage 2021, 37, 102466. [Google Scholar] [CrossRef]
- Li, Y.; Li, K.; Xie, Y.; Liu, J.; Fu, C.; Liu, B. Optimized charging of lithium-ion battery for electric vehicles: Adaptive multistage constant current-constant voltage charging strategy. Renew. Energy 2020, 46, 2688–2699. [Google Scholar] [CrossRef]
- Liu, Y.H.; Luo, Y.F. Search for an Optimal rapid-charging pattern for Li-ion batteries using the Taguchi approach. IEEE Trans. Industrial Electr. 2010, 57, 3963–3971. [Google Scholar] [CrossRef]
- Khan, A.B.; Choi, W. Optimal charge pattern for high-performance multistage constant current charge method for the Li-ion batteries. IEEE Trans. Energy Convers. 2018, 33, 1132–1140. [Google Scholar] [CrossRef]
- Wang, S.C.; Liu, Y.H. A PSO-based fuzzy-controlled searching for the optimal charge pattern of Li-ion batteries. IEEE Trans. Industrial Electr. 2015, 62, 2983–2993. [Google Scholar] [CrossRef]
- Jiang, L.; Li, Y.; Huang, Y.; Huang, Y.; Yu, J.; Qiao, X.; Wang, Y.; Huang, C. Optimization of multi-stage constant current charging pattern based on Taguchi method for Li-ion battery. Appl. Energy 2020, 259, 114148. [Google Scholar] [CrossRef]
- Alhaider, M.M.; Ahmed, E.M.; Aly, M.; Serhan, H.A.; Mohamed, E.A.; Ali, Z.M. New temperature-compensated multi-step constant-current charging method for reliable operation of battery energy storage systems. IEEE Access 2020, 8, 27961–27972. [Google Scholar] [CrossRef]
- Atta, P.M.; Grover, A.; Jin, N.; Severson, K.A.; Markov, T.M.; Liao, Y.H.; Chen, M.H.; Cheong, B.; Perkins, N.; Yang, Z.; et al. Closed-loop optimization of fast-charging protocols for batteries with machine learning. Nature 2020, 578, 392–402. [Google Scholar] [CrossRef]
- Chen, G.J.; Liu, Y.H.; Wang, S.C.; Luo, Y.F.; Yang, Z.Z. Searching for the optimal current pattern based on grey wolf optimizer and equivalent circuit model of Li-ion batteries. J. Energy Storage 2021, 33, 101933. [Google Scholar] [CrossRef]
- Wang, S.C.; Zhang, Z.Y. Research on optimum charging current profile with multi-stage constant current based on bio-inspired optimization algorithms for Lithium-ion batteries. Energies 2023, 16, 7641. [Google Scholar] [CrossRef]
- Kumar, K.; Pareek, K. Fast charging of lithium-ion battery using multistage charging and optimization with Grey relational analysis. J. Energy Storage 2023, 68, 107704. [Google Scholar] [CrossRef]
- Mathieu, R.; Briat, O.; Gyan, P.; Vinassa, J.M. Fast charging for electric vehicles applications: Numerical optimization of a multi-stage charging protocol for lithium-ion battery and impack on cycle life. J. Energy Storage 2021, 40, 102756. [Google Scholar] [CrossRef]
- Mirjahili, S.; Lewis, A.; Sadiq, A.S. Automous particles groups for particle swam optimization. Arab. J. Sci. Eng. 2015, 39, 4683–4697. [Google Scholar] [CrossRef]
- Mirjalili, S.; Mirjalili, S.M.; Lewis, A. Grey wolf optimizer. Adv. Eng. Softw. 2014, 69, 46–61. [Google Scholar] [CrossRef]
- Chou, J.S.; Truong, D.N. A novel metaheuristic optimizer inspired by behaviior of jellyfish in ocean. Appllied Math. Comp. 2021, 389, 125535. [Google Scholar] [CrossRef]
- Zhao, S.; Zhang, T.; Ma, S.; Chen, M. Dandelion optimizer: A nature-inspired methaheuristic algorithm for engineering applications. Eng. Appl. Artif. Intell. 2022, 114, 105075. [Google Scholar] [CrossRef]
- Hentunen, A.; Lehmuspelto, T.; Suomela, J. Time-domain parameter extraction method for Thevenin-equivalent circuit battery models. IEEE Trans. Energy Convers. 2014, 29, 556–558. [Google Scholar] [CrossRef]
- Takyi-Aninakwa, P.; Wang, S.; Zhang, H.; Appiah, E.; Bobobee, E.D.; Fernadez, C. A strong tracking adaptive fading-extended Kalman filter for the state of charge estimation of lithium-ion batteries. Eneregy Res. 2022, 46, 16427–16444. [Google Scholar] [CrossRef]
- Yuthanava, T.; Khomfoi, S.; Phophongviwat, T. Modeling Li-ion battery using measurement data. Third Inter. Symp. Instrumen. Control Artif. Intell. Robot. Thail. 2023, 131–134. [Google Scholar]
- Ayyarao, T.S.L.V.; Ramakrishna, N.S.S.; Elavarasan, R.M.; Polumanthi, N.; Rambabu, M.; Saini, G.; Khan, B.; Alatas, A.B. War strategy optimization algorithm: A new effective metheuristic algorithm for global optimization. IEEE Access 2022, 10, 25073–252105. [Google Scholar] [CrossRef]
- Zhong, C.; Li, G.; Meng, Z. Beluga whale optimization: A novel nature-inspired methaheuristic algorithm. Knowdge-Based Syst. 2022, 251, 109215. [Google Scholar] [CrossRef]
- Houssein, E.; Saad, M.R.; Hashim, F.; Shalban, H.; Hassaballah, M. Levy flight distribution: A new metaheuristic algorithm for solving engineering optimization problems. Eng. Appl. Artif. Intell. 2020, 94, 103731. [Google Scholar] [CrossRef]
- Abdollahzadeh, B.; Gharehchopogh, F.S.; Mirjalili, S. African vultures optimization algorithm: A new nature-inspired metaheuristic algorithm for global optimizaion problems. Comput. Ind. Eng. 2021, 158, 107408. [Google Scholar] [CrossRef]
- Available online: https://gardenerspath.com (accessed on 25 October 2024).
- Available online: https://treehugger.com (accessed on 25 October 2024).
Disclaimer/Publisher’s Note: The statements, opinions and data contained in all publications are solely those of the individual author(s) and contributor(s) and not of MDPI and/or the editor(s). MDPI and/or the editor(s) disclaim responsibility for any injury to people or property resulting from any ideas, methods, instructions or products referred to in the content. |
© 2024 by the author. Licensee MDPI, Basel, Switzerland. This article is an open access article distributed under the terms and conditions of the Creative Commons Attribution (CC BY) license (https://creativecommons.org/licenses/by/4.0/).