1. Introduction
The prevalence of knee osteoarthritis (OA) is on the rise as modern society ages. According to the HIRA Big Data Open Portal, the prevalence of knee osteoarthritis among patients aged 50 years and older is continuously increasing [
1]. Osteoarthritis of the knee is a chronic disease that continues to be costly to treat and manage, and various studies are being conducted to reduce this cost. Among these studies, the Knee Adduction Moment (KAM) is widely used as an important indicator of knee osteoarthritis development. KAM is a mathematical model that calculates the load on the medial knee joint during walking, and the lower the KAM, the slower the progression of knee osteoarthritis and the less severe the symptoms [
2]. KAM is measured in Newton-meters (
), which represents the rotational force applied at a distance from the knee joint. One
is defined as the torque produced by a one Newton force applied at a one meter distance.
Therefore, accurately and cost-effectively measuring KAM is an important challenge in the management of knee osteoarthritis. Recently, there have been several studies that utilize wearable sensors and machine learning algorithms to predict KAM values [
3,
4,
5,
6,
7,
8,
9,
10,
11,
12,
13,
14,
15,
16,
17,
18,
19].
In this work [
3], Inertial Measurement Unit (IMU) sensors and machine learning algorithms were used to measure KAM in everyday walking and to try reduce its cost. Wang proposed a KAM prediction solution for three different gait patterns using a fully connected artificial neural network (FCNN) and extreme gradient boosting (XGBOOST) [
20], and the model was built by training all of the data together. However, this study mainly focused on mild and moderate OA patients, and there were limited data on severe OA patients. This limits the accuracy of KAM prediction for OA patients and may limit the prediction for patients with a wider range of KAM values due to the application of fewer gait patterns.
The following work [
4] combined wearable sensors and machine learning techniques to develop an assistive device for OA patients. The study aimed to develop an artificial neural network (ANN) to estimate the Knee Flexion Moment (KFM) and KAM during different walking tasks using two wearable sensors. IMU signals were collected from seven participants performing six different gait tasks, which were used to train an ANN to estimate the KFM and KAM time series. However, while the KFM estimation showed a high accuracy, the KAM estimation showed a relatively low accuracy. This highlights the limitations of using only two IMUs to consistently estimate KAM.
Other studies have explored various machine learning methods to enhance KAM prediction accuracy. For example, Kwon et al. [
5] developed a diagnostic model associated with OA severity using the random forest regression method, while Boswell et al. [
6] used 3D fully connected neural networks to predict KAM based on anatomical landmarks extracted from 2D video analysis. Brisson et al. [
7] focused on correlating knee contact force with cartilage loss over time using random forest regression models, and Akiba et al. [
8] employed a deep learning algorithm using convolutional layers to estimate KAM from a single IMU sensor. Additionally, Snyder et al. [
13] combined deep learning models, including feed-forward, convolutional, and recurrent neural networks, with instrumented insoles for real-time KAM prediction, while Giarmatzis et al. [
16] applied a feed forward network to predict joint forces based on motion capture data. Each study demonstrates unique approaches, but they often lack the ability to account for the full diversity of gait patterns in daily life, which is a significant factor in enhancing the robustness and accuracy of gait analysis systems.
The problem with existing studies is that they do not fully reflect the variety of walking patterns, and they often suffer from an insufficient number of IMU sensors, limiting the ability to capture comprehensive gait features. People have different walking patterns in daily life, and the lack of adequate sensor data hinders the accuracy of gait analysis. Therefore, using multiple IMU sensors to capture rich feature data and dividing the process into classification and regression steps could lead to improved results and more accurate predictions.
In comparison with previous studies, our approach introduces a Multi-model Gait-based KAM Prediction System that utilizes a two-step method. First, it classifies gait patterns based on IMU sensor data, and then applies a specific regression model tailored to each classified gait pattern. Unlike the single-model approach employed in studies such as Wang et al. [
3], our method improves prediction accuracy by integrating classification and regression processes, which allow the system to adapt its prediction model based on specific gait characteristics. By capturing these gait-specific nuances, our model achieves superior accuracy in KAM prediction, particularly when compared with a single-model system that does not account for gait pattern variation.
In this study, we used a Long Short-Term Memory (LSTM) RNN model to predict KAM. LSTM-RNN is a type of Recurrent Neural Network (RNN) that has the advantage of effectively learning long-term dependencies from long sequence data. Previous studies have mainly used artificial neural networks or XGBoost for KAM prediction [
3], but LSTM-RNN has been shown to have a higher prediction accuracy for temporally continuous data [
21]. For this reason, this study proposes a KAM prediction model utilizing LSTM-RNN.
The main contributions of this study are as follows: First, we developed a Multi-model Gait-based KAM Prediction System that classifies gait patterns before KAM prediction, resulting in significantly improved prediction accuracy across varied gait types. Next, we integrated IMU sensors with an LSTM-RNN model to create a cost-effective and efficient KAM prediction system, enabling non-invasive and continuous monitoring of knee joint load in real-world settings. Finally, by combining classification and regression processes, we demonstrated that accurate gait pattern classification can enhance regression performance, leading to a higher accuracy in KAM predictions.
2. Materials and Methods
First, in the simultaneous measurement phase and the data acquisition and processing phase, the reference KAM data and data from the IMU sensor required for training are collected simultaneously and integrated into a single trainable dataset through the RAW dataset construction phase. After that, the RAW data are pre-processed to make it favorable for learning, and then the LSTM-RNN model is used for learning and prediction. This process is illustrated in
Figure 1, which shows the overall flowchart of the system.
2.1. Collecting Data in Parallel
To predict KAM, accurate and reliable baseline data are required. Baseline KAM data are data that accurately reflect the loads on the knee joint and their distribution, which is essential to ensure the accuracy and reliability of model training. Without accurate ground truth, the model may learn incorrect patterns, which can lead to inaccurate predictions. Reliable ground truth data are essential for machine learning models to accurately reflect real-world situations. To obtain this data, baseline KAM data are collected through systematic measurements using motion and pressure sensors.
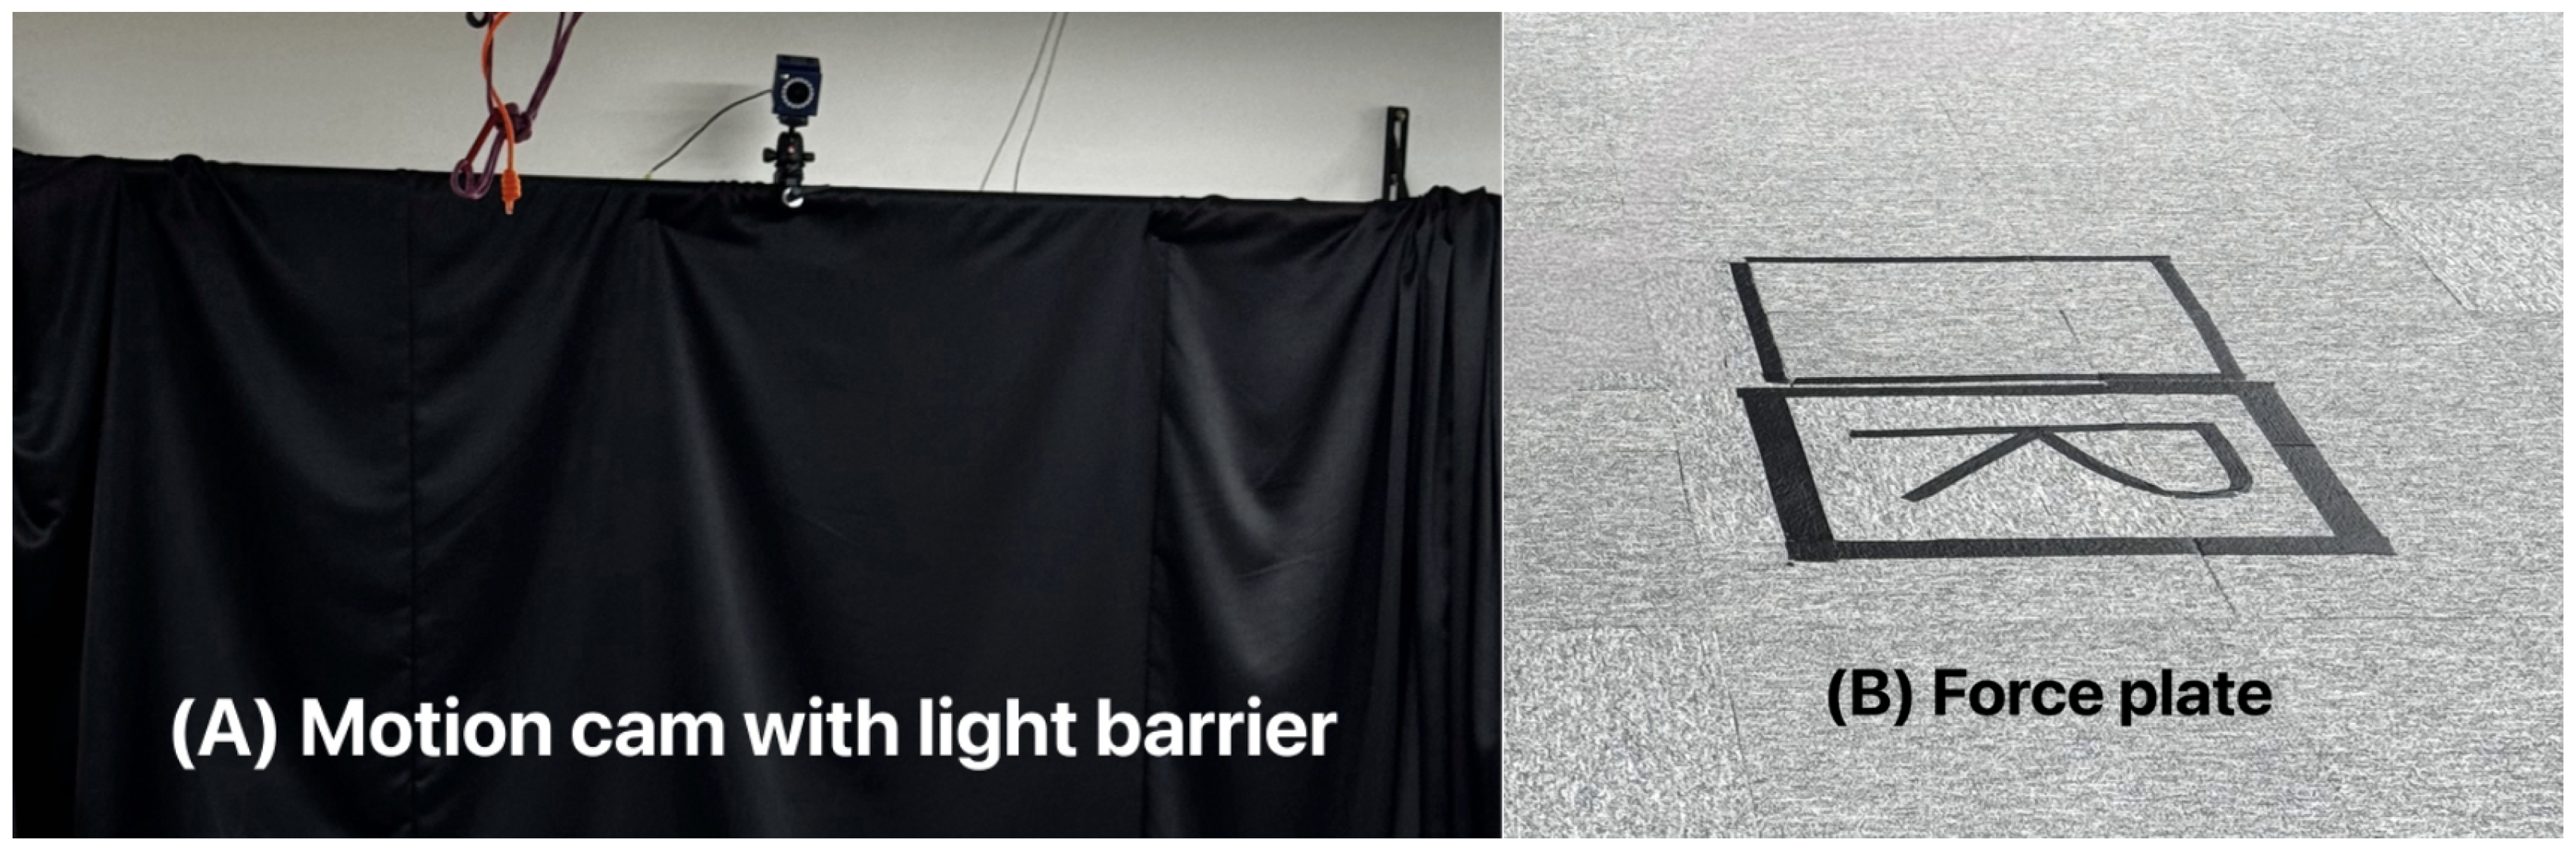
Figure 2 shows a lab environment for collecting baseline KAM data. The lab is equipped with a camera (A) to track motion and a force plate (B) to measure Ground Reaction Forces (GRFs). The study involves participants wearing sensors to collect data. The participants attache 29 spherical markers to fixed locations on the body and perform a linear reciprocating motion at regular intervals in the lab. The pressure data after the participant steps on the force plate and the data obtained from the motion camera are synthesized to measure the reference standard value of the KAM acting on the knee joint. The data obtained through this process serve as an accurate and reliable reference for the machine learning model to predict the knee load moment.
At the same time as measuring KAM, the participant wears the IMU sensors at the prescribed attachment points to collect data from the IMU sensors. A total of nine IMU sensors are used, all from Delsys’ Trigno Avanti Sensor. Four of the sensors include acceleration and angular velocity for the X, Y, and Z axes, and the remaining five sensors include only acceleration for the X, Y, and Z axes.
Figure 3 shows the IMU sensor attachment locations for the participant. Sensors 1, 2, 3, and 4 are 6-axis sensors, attached to the knee, collecting data from the knee. Sensors numbered 5, 6, 7, 8, and 9 are 3-axis sensors and collect ankle and thigh data.
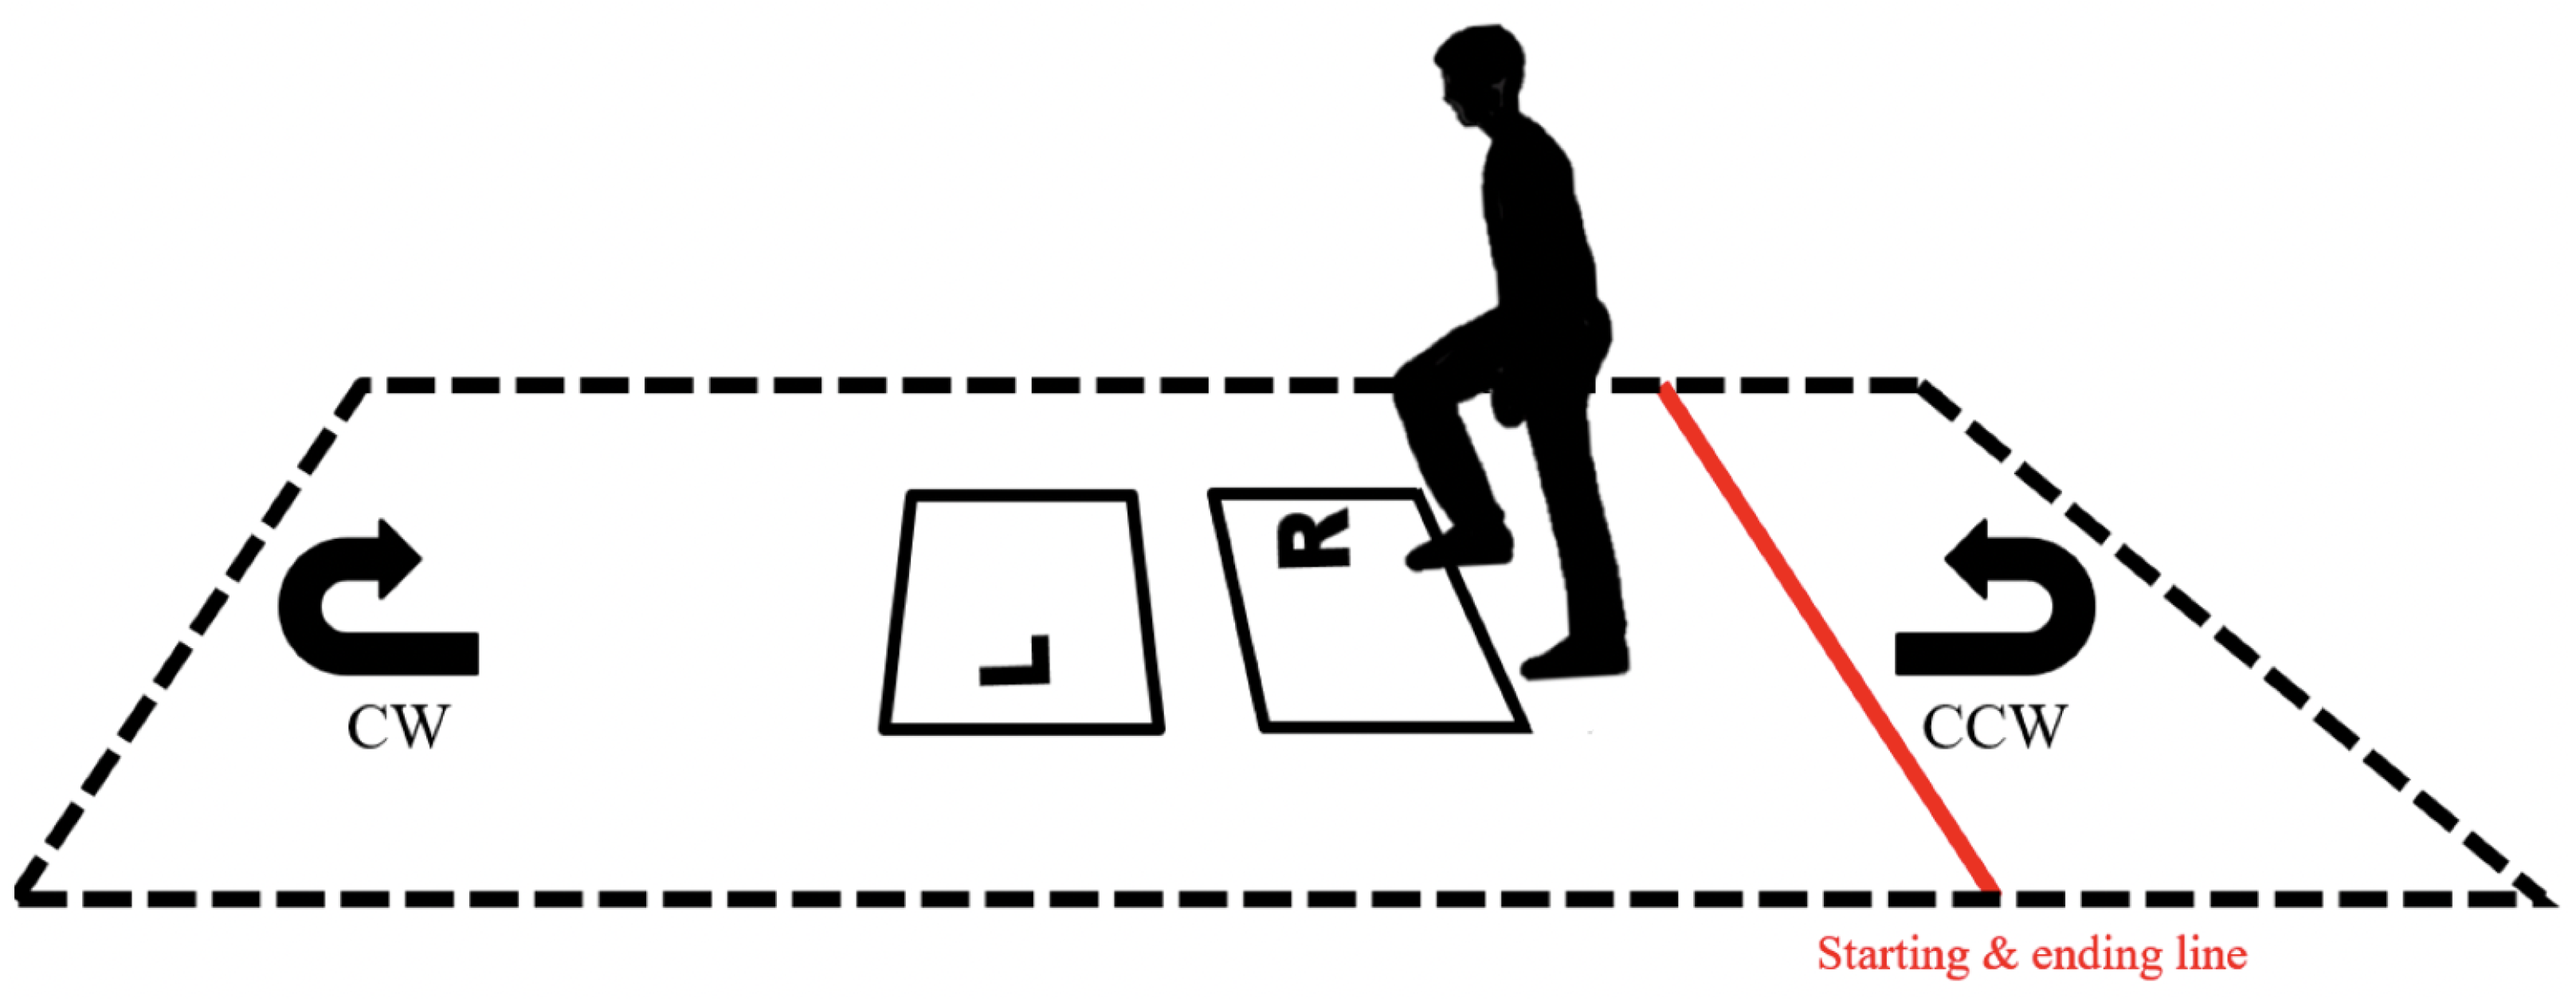
As shown in
Figure 4, the experimenter steps on the two pressure plates with the right foot and then the left foot to collect sensor data, and then turn around and does the same thing to generate and collect KAM data.
2.2. Building a RAW Dataset
IMU sensor data required inter-sensor calibration due to the use of different types of IMU sensors: 3-axis and 6-axis. As the 3-axis sensor had a measurement frequency of 180 Hz, and the 6-axis sensor had a frequency of 380 Hz, the data were converted to 450 Hz. This conversion involved interpolation to ensure temporal alignment, and the processed data were included in the RAW dataset. Additionally, for the KAM measurement, motion lab data were incorporated into the RAW Dataset, including both motion sensor and pressure plate data. The RAW dataset was structured to predict KAM as the target variable, using IMU sensor data as the input. Furthermore, the interpolated data were merged and synchronized with the KAM measurement data to align with the time series accurately. The structure of the dataset used for the final training and learning is shown in
Table 1.
2.3. Learning and Prediction
The LSTM-RNN model was trained and implemented for KAM prediction under OS Ubuntu 20.04.5 LTS, CPU Intel Xeon W-2245, GPU NVIDIA Quadro RTX 5000, RAM 128 GB, Python 3.8.8, and PyTorch 2.0.1 [
22]. Although Recurrent Neural Networks are used to identify patterns or meanings in sequential data, we chose LSTM layers to overcome the limitations of RNNs in effectively learning long-term dependencies in long sequence data, which can improve the prediction accuracy for temporally continuous data, such as KAM values that change with the gait cycle.
As LSTM-RNNs operate on sequential data, a sliding window function is used to convert consecutive data points into overlapping sequences by shifting the window over the data one step at a time. This method allows the model to capture continuous patterns effectively and improve generalization. The transformed data are then converted to PyTorch tensors and utilized for model training via PyTorch’s DataLoader, which handles batching and shuffling of the data to optimize the training process [
22]. To facilitate training, the data are scaled using StandardScaler from scikit-learn [
23], which normalizes the features based on the training data, adjusting all features to have a mean of 0 and a standard deviation of 1.
To compare the predictive accuracy of the models, we evaluated two systems: a multi-model system that includes both a classification model and a regression model, and a single-model system that includes only a regression model. The multi-model system first classifies the input IMU sensor data into one of five gait pattern types: normal gait, toe-in gait, toe-out gait, trunk lean, and knee thrust. Once the pattern is classified into one of these five types, the IMU sensor data are then passed as the input to a KAM regression model that is specifically trained for that gait pattern to make the final prediction. A detailed description of each gait type, along with the encoding methods used for the gait types, can be found in Table 3.
2.4. Multi-Model Gait-Based KAM Prediction System
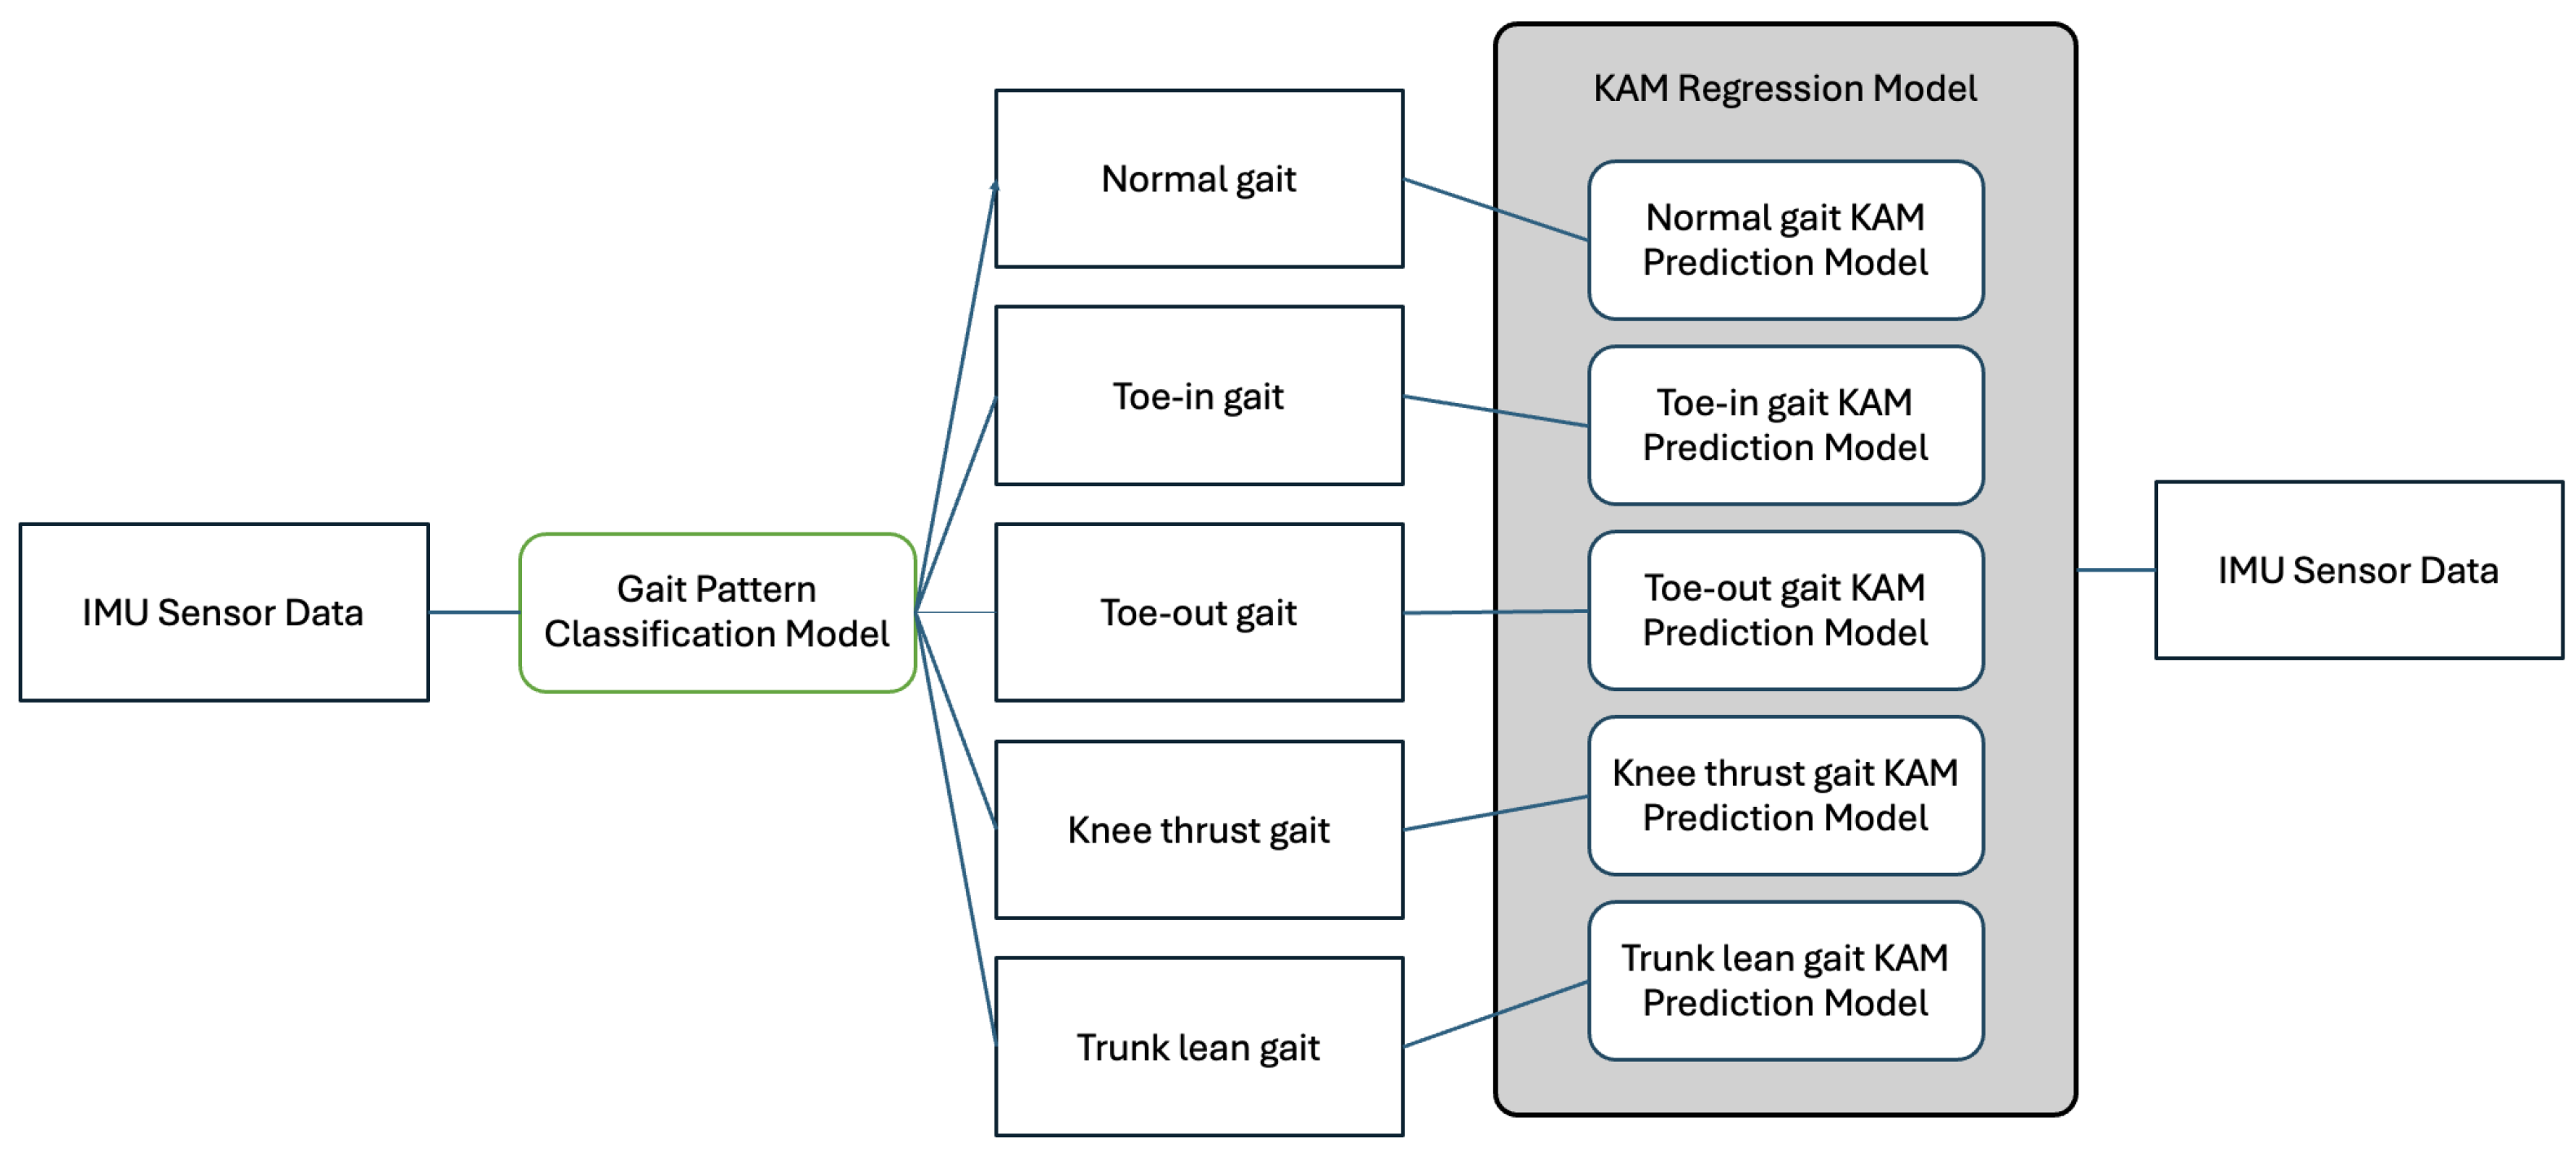
Figure 5 illustrates the Multi-model Gait-based KAM Prediction System. Initially, the system receives IMU sensor data as the input to the gait pattern prediction model. After predicting the gait pattern from the input data, the system selects a prediction model tailored to the identified gait pattern. Finally, it predicts the KAM using this specific model. The classification model and regression model both use LSTM-RNN and have the same number of layers.
The first step in the system is the classification model. By classifying a particular gait pattern based on the input gait data, the model predicts what kind of gait pattern it belongs to. The model is trained using the Cross-Entropy Loss function, which is commonly used in classification tasks to measure the difference between the predicted class probabilities and the actual class labels by penalizing inaccurate predictions. The loss function is described by Equation (
1), where
B is the batch size,
C is the number of classes,
is the actual class label for sample
i, and
represents the predicted probability of class
C for sample
i.
The structure of the gait pattern prediction model of the Multi-model Gait-based KAM Prediction System is shown in
Table 2. First, the Input Layer receives 39 features, which is the number of IMU sensors, along with the batch size and timestep, and passes through two LSTM layers. Each layer has 32 nodes, and the final output is the gait data. The gait data values are numerically encoded and represented and used as shown in
Table 3.
The second step in the system is the regression model. By combining the output of the classification model with the original input data, the regression model predicts the KAM value. The regression model takes both the classified gait pattern and the gait data as the inputs, enabling a more accurate prediction of the KAM value. This model minimizes the error between the predicted KAM value and the actual KAM value using the Mean Squared Error (MSE) loss function. The loss function is described by Equation (
2), where
B is the batch size,
is the actual KAM value for sample
i, and
is the KAM value predicted by the model for sample
i.
The hyperparameter settings for the KAM prediction model of the Multi-model Gait-based KAM Prediction System are shown in
Table 4.
The final loss function used in the Multi-model Gait-based KAM Prediction System is defined by combining the loss functions of the classification model and the regression model. Training is conducted in the direction of minimizing the losses of both models, which allows us to simultaneously optimize the performance of the gait pattern classification and KAM prediction. The final loss function is shown in Equation (
3).
3. Performance Evaluations
To evaluate the performance of the Multi-model Gait-based KAM Prediction System, we use the Single-model KAM Prediction System as a comparison. The Single-model KAM Prediction System is a simple structure that trains all patterns into a single model and outputs KAM with data from IMU sensors as the input, regardless of the gait pattern. This model is composed of the same structure as the regression model of the Multi-model Gait-based KAM Prediction System.
3.1. Performance Evaluation Metrics
Before evaluating the performance of our models, we defined key metrics to assess their accuracy and robustness. We chose Accuracy and F1 Score as the primary performance metrics for evaluating the LSTM-RNN model in the Multi-model Gait-based KAM Prediction System. This choice aligns with our goal of improving KAM prediction accuracy by accurately classifying individual gait patterns.
Accuracy is defined as the percentage of correct predictions made by the model over the entire dataset, providing a broad measure of the model’s general predictive capability. It is calculated by Equation (
4), where
,
,
,
, and
represent the true positives for each gait pattern: knee thrust, normal, toe-in, toe-out, and trunk lean, respectively, and
N is the total number of samples. Here,
is defined as the cases where the actual gait pattern
matches the predicted gait pattern
. A high Accuracy score indicates that the model is effective in generalizing across diverse gait patterns, minimizing misclassifications.
F1 Score, the harmonic mean of Precision and Recall, is useful for unbalanced class distributions, as it balances the trade-off between Precision (the correctness of positive predictions) and Recall (the completeness of capturing actual positives). It is calculated by Equation (
5), with Precision and Recall defined in Equations (
6) and (
7). Here,
represents the number of false positives, where the model incorrectly predicts a positive class, and
represents the number of false negatives, where the model fails to detect an actual positive class. F1 Score highlights the model’s ability to handle both frequent and infrequent gait patterns accurately, which is crucial in our study where certain gait patterns may appear more frequently than others.
For KAM prediction, we use the Mean Absolute Percentage Error (MAPE) and Root Mean Square Error (RMSE) to evaluate regression accuracy. MAPE measures the error between predicted and actual values as a percentage, providing an intuitive sense of the model’s accuracy relative to the actual data scale. MAPE is calculated by Equation (
8), where
is the actual KAM value and
is the predicted KAM value for each index
t in the dataset of size
n. MAPE is particularly useful in this study as it allows for comparing error rates across different KAM values, facilitating a normalized understanding of prediction performance.
RMSE, shown in Equation (
9), calculates the square root of the mean squared differences between the actual and predicted KAM values, making it sensitive to larger errors. In RMSE,
represents the actual KAM value, while
denotes the predicted KAM value. RMSE is particularly valuable in this context as it captures the model’s robustness against large deviations, reflecting the overall predictive accuracy of the KAM prediction model.
By combining these metrics, we achieve a comprehensive view of the model’s performance: Accuracy and F1 Score evaluate classification reliability, while MAPE and RMSE assess regression accuracy for KAM prediction. Additionally, a Confusion Matrix visualizes classification accuracy across the five gait patterns, enabling intuitive interpretation of the per-pattern model performance.
3.2. Evaluating the Performance of Multi-Model and Single-Model Gait-Based KAM Prediction Systems
The Multi-model and Single-model Gait-based KAM Prediction Systems were evaluated to compare their classification performance and predictive accuracy across multiple gait patterns.
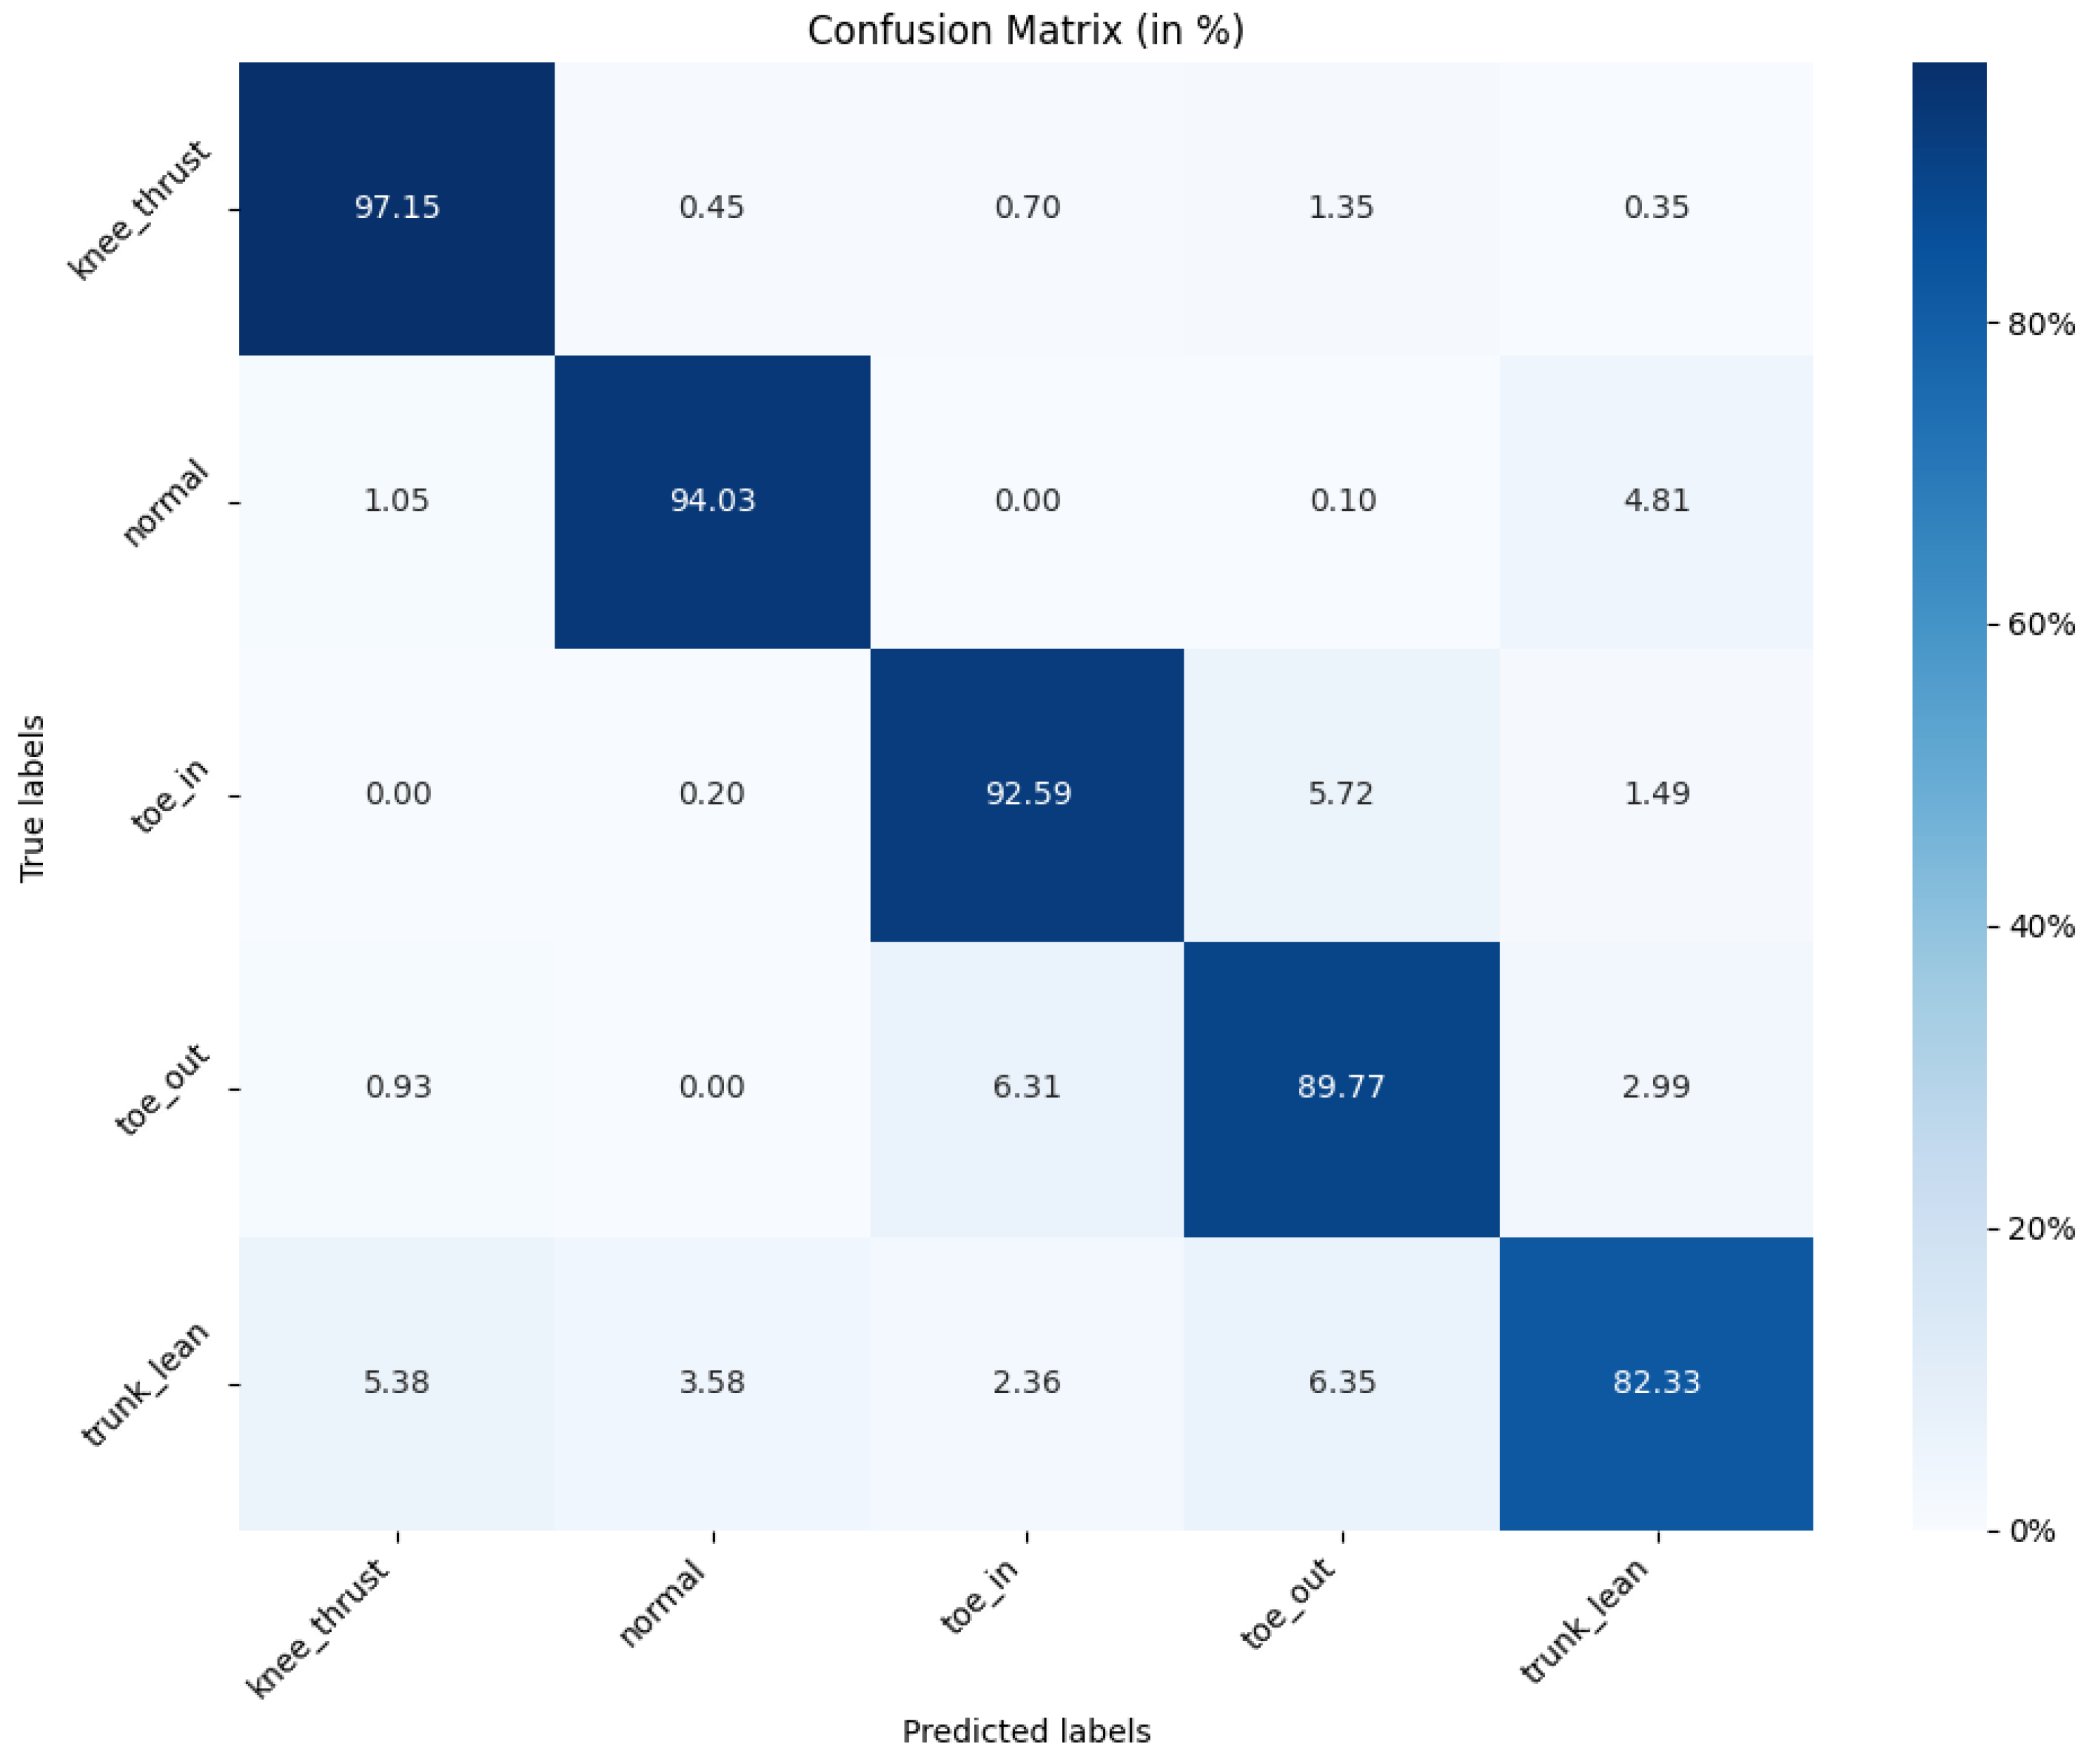
Figure 6 shows the Confusion Matrix for the Multi-model Gait-based KAM Prediction System. This matrix visualizes how the model predicted each actual gait pattern and highlights the classification accuracy for each specific pattern. As shown in the graph, the normal (94.03%), toe in (92.59%), and toe out (89.77%) patterns, which have clear and consistent characteristics, are predicted accurately. However, the trunk lean pattern, which exhibits irregular and complex characteristics, is predicted with a lower accuracy (82.23%) compared to the other patterns. This suggests that while the model effectively captures the stable features of certain gait types, it has more difficulty with variable patterns like trunk lean. Based on these results, we calculated the overall Accuracy and F1 Score, as shown in
Table 5, both of which are around 0.9 or higher.
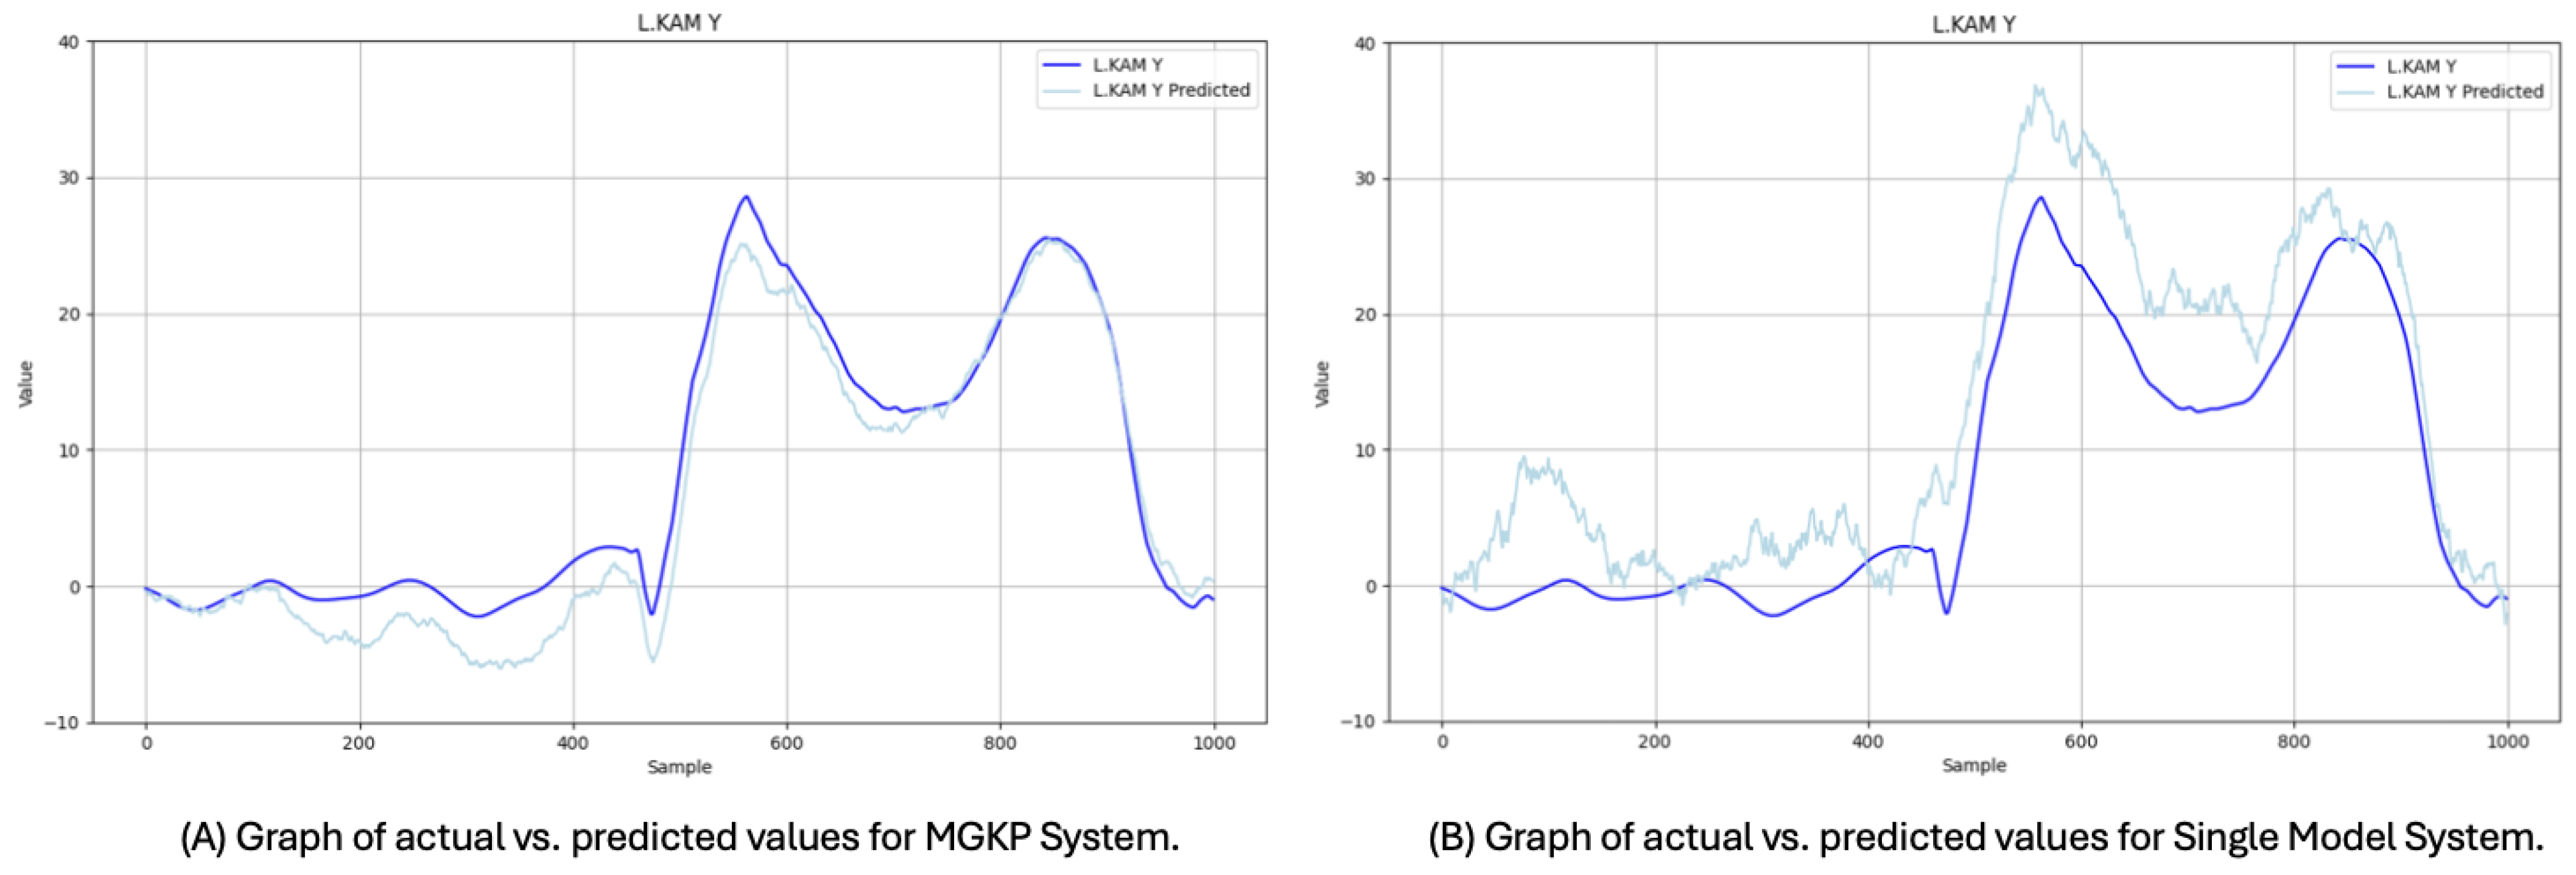
Figure 7 shows a comparison of the actual versus predicted KAM values for both systems, demonstrating that the Multi-model system’s predictions more closely align with the actual measurements than the Single-model system. This alignment signifies the Multi-model system’s robustness in predicting KAM values across diverse gait patterns, as it leverages gait classification to adjust predictions according to specific gait patterns. In contrast, the Single-model system, which does not incorporate prior gait pattern classification, exhibits a larger prediction error and less alignment with the actual values.
Further analysis of the predictive accuracy is shown in
Figure 8, which plots the actual KAM values against the predicted values for both systems. In this comparison, the closer clustering of data points along the
line in the Multi-model system demonstrates its ability to handle diverse gait patterns more accurately, whereas the Single-model system shows greater deviation from the ideal line. This comparison underscores the advantage of the Multi-model approach, which incorporates pattern-specific classification steps before KAM prediction, allowing for more precise KAM estimation across the varied gait types.
3.3. Results of Performance Evaluations
The Single-model KAM Prediction System, which directly inputs the data into the KAM prediction model without prior gait pattern classification, achieves an average prediction error of 8.82
and a MAPE of 12.95%. In comparison, the Multi-model Gait-based KAM Prediction System, which first classifies input data by gait pattern before predicting KAM, achieves a significantly lower average prediction error of 6.84
and a MAPE of 8.47%. These results represent the best performance achieved by each system and can be seen in
Table 6.
These results indicate that the Multi-model system offers more than a 25% improvement in prediction accuracy compared with the Single-model system. By classifying gait patterns prior to KAM prediction, the Multi-model system can better capture the pattern-specific characteristics, leading to more precise predictions. Specifically, the 4.48% reduction in MAPE reflects the Multi-model system’s advantage in minimizing percentage-based prediction errors, which is critical for accurately assessing KAM levels across different gait patterns.
The improvement in average prediction error and MAPE demonstrates that the Multi-model approach effectively addresses the limitations of a one-size-fits-all model by providing tailored predictions based on distinct gait patterns. This capability is particularly important in applications involving diverse movement patterns, as the system can adapt to specific variations in gait, such as the biomechanical differences between toe-in, toe-out, and trunk lean patterns. Such adaptability enhances the model’s utility in real-world applications, where capturing subtle variations in KAM across varied gait types is essential for accurate and actionable predictions.
In summary, the Multi-model Gait-based KAM Prediction System demonstrates a robust improvement over the Single-model system by leveraging gait pattern classification to enhance predictive accuracy. This distinction in performance metrics underscores the value of integrating pattern-specific processing steps for models aimed at predicting biomechanical measures like KAM.
4. Discussion
The results of this study demonstrate that pre-classifying gait patterns and integrating them with LSTM-RNN models significantly enhances the predictive power for temporally continuous data, such as the KAM. Specifically, the Multi-model Gait-based KAM Prediction System showed a marked improvement over the Single-model KAM Prediction System, achieving an average prediction error of 6.84 and a Mean Absolute Percentage Error of 8.47%, compared with the Single-model system’s average prediction error of 8.82 and MAPE of 12.95%.
The approach of pre-classifying gait patterns using IMU sensor data before predicting KAM proved effective in enhancing prediction accuracy. These findings underscore the potential of combining wearable technology with advanced machine learning techniques to develop cost-effective, efficient, and accurate monitoring systems for knee joint health. This method offers a practical alternative to traditional KAM measurement techniques, which require complex laboratory equipment and significant time and cost investments.
However, this study has certain limitations that warrant attention. First, the sample size was relatively small, and the gait patterns were limited to five types, which may affect the generalizability of the findings. Future research should focus on expanding the dataset to include a broader range of participants and gait patterns, such as stair climbing and inclined walking, to improve the robustness and applicability of the models. Future research will also incorporate a broader range of gait patterns and environmental conditions to enhance model applicability. Additionally, further model architecture improvements will aim to reduce computational complexity and enable real-time KAM prediction, enhancing the system’s practicality for real-world applications.
Advancements in this area are expected to contribute significantly to the prevention and treatment of knee osteoarthritis. By providing an accessible and cost-effective method for continuous monitoring of the knee joint load, this system has the potential to improve patient outcomes and reduce healthcare costs associated with osteoarthritis management.
5. Conclusions
This study highlights that integrating wearable IMU sensors with LSTM-RNN models in a multi-model framework significantly enhance the accuracy of KAM prediction. The Multi-model Gait-based KAM Prediction System, which classifies gait patterns and applies tailored regression models, demonstrated a superior performance, achieving an average prediction error of 6.84 and a MAPE of 8.47%. This represents an improvement over the Single-model system’s 8.82 average error and 12.95% MAPE. The approach leverages LSTM-RNN’s capability to capture long-term dependencies in sequential data, underscoring its effectiveness in diverse gait types.
This methodology extends beyond KAM prediction, offering the potential for other applications requiring precise regression based on unique data patterns. The approach may benefit fields where customized pattern classification can improve the predictive accuracy, broadening the impact of multi-model regression techniques.
Future research will expand the dataset to include more diverse gait patterns and conditions, improve the model architecture for real-time KAM prediction, and enhance system practicality. These efforts will boost predictive accuracy and support cost-effective, continuous knee osteoarthritis monitoring, benefiting clinicians and patients.


