Abstract
Due to the scale effect, tip vortex cavitation (TVC) is the earliest type of cavitation that occurs on real ship propellers. As a result, experts in the ship field have been paying close attention to the accurate prediction of propeller TVC inception for a long time. The motion and growth of the microscopic nuclei in the water have a significant influence on TVC inception. However, the minimum pressure coefficient method—a common method at present—based on the traditional Eulerian framework, neglects the influence of microscopic nuclei and therefore cannot accurately predict the cavitation inception. Moreover, the numerical prediction method for cavitation inception, which is based on bubble dynamics models and considers the influence of nuclei, has not established a set of unified and specific discrimination criteria applicable to propeller cavitation inception. In order to make up for the shortcomings of traditional prediction models and the existing methods based on bubble dynamics in the prediction of TVC inception, we propose a new discrimination method for propeller TVC inception based on bubble dynamics in this paper. The comparison with experimental results demonstrates that our proposed method allows us to predict propeller TVC inception more accurately. In addition, the effect mechanism of tip vortex flow characteristics on nuclei evolution is further investigated, and it is found that when approaching the low-pressure region at a vortex core under the influence of tip vortex suction, nuclei grow explosively under the continuous action of the low pressure at the vortex core until they reach their maximum sizes and then collapse rapidly.
1. Introduction
Cavitation, a common fluid mechanics phenomenon, refers to the microbubbles’ (also known as nuclei) explosive growth resulting from liquid evaporation caused by local low pressure (i.e., the pressure is lower than the saturated vapor pressure at the corresponding temperature) in a liquid flow system, which is particularly common among various hydraulic turbines, pumps, and ship propellers [1,2,3]. Tip vortex cavitation, the earliest type of cavitation that occurs on real ship propellers due to the scale effect [4], will lead to significant pulsating pressure and strong radiation noise, degrading the ship’s stealth performance significantly [5,6]. Studies [7,8,9,10] have shown that constant saturated vapor pressure alone cannot be used as a discrimination criterion, because the motion and growth of nuclei in the water have a considerable influence on the occurrence of TVC. Therefore, research on the discrimination method for propeller TVC inception based on the bubble dynamics models that take into account the effect of nuclei is of great significance in accurately predicting the TVC inception of warships.
In [11,12,13], the authors determined propeller TVC inception mainly by visual observation during experiments, that is, they use means such as high-speed cameras and stroboscopes to capture the transient behavior of cavitation inception and made an intuitive judgment on cavitation inception through image acquisition with high temporal–spatial resolution. However, this method is heavily dependent on the observer’s own experience because the faint TVC usually cannot be detected by the naked eye. Experimental results show that the inceptive cavitation number obtained using visual discrimination methods tends to be lower than that obtained using the acoustics criterion [14]. Moreover, the explosive growth and rapid contraction collapse processes of microscopic nuclei, which are difficult to observe and generate strong pulse acoustic pressure, tend to occur before the cavitation is observed. Such impulsive acoustic signals are also difficult to measure due to the limitations in the accuracy of experimental measurement instruments and the background noise. Therefore, the experimental prediction method for propeller cavitation inception is not only expensive but also tends to underestimate the occurrence of cavitation to a certain extent.
In recent years, with the rapid development of high-performance computers, there has been an increasing number of studies investigating propeller TVC inception with the help of computational fluid mechanics (CFD) [15,16,17]. At present, the most common numerical prediction method for cavitation inception is the minimum pressure coefficient method based on the Eulerian framework, which predicts the cavitation number of cavitation inception based on the minimum pressure of a global flow field [18,19]. However, the occurrence of cavitation is caused by the interaction between nuclei and the local pressure field in essence; this method obviously neglects the influence of the growth and collapse effect of nuclei on cavitation inception and only can make a relatively accurate prediction for the weak water with larger-sized nuclei (approximately 400 μm in diameter), but cannot make a relatively accurate prediction for the strong water with smaller nuclei [15]. Furthermore, existing experimental measurement results show that the size of nuclei in the water is mainly distributed between 40 μm and 60 μm, which is closer to the strong water. Therefore, the traditional minimum pressure coefficient method is incapable of making an accurate prediction. Hsiao’s research team [20] investigated the cavitation inception mechanism of a ducted propeller—David Taylor Propeller 5206—through experiments and found that TVC inception did not occur in a minimum pressure region, and the occurrence of cavitation at early stage might be caused by the strong interaction between vortexes. Subsequently, the team performed numerical calculations for the cavitation inception of this ducted propeller with the minimum pressure coefficient method, and found that the calculated incipient cavitation number and inception position differed greatly from the experimental results [21,22,23,24]. It further indicates that the rationality of making a prediction for propeller TVC inception with the minimum pressure coefficient method needs further discussion. Moreover, the minimum pressure coefficient method is heavily dependent on the local grid resolution at the tip vortex, and grid quality and refinement influence the prediction accuracy directly [24,25]. Therefore, it is necessary to develop a new numerical prediction method for TVC inception so as to accurately predict and investigate propeller TVC inception.
In order to overcome the limitations of the above methods, many researchers have set about modeling microbubbles. In recent years, the numerical prediction method for cavitation inception with the combination of the Lagrangian framework and the Eulerian framework based on bubble dynamics theory has developed rapidly. Reynolds [26] was the first to undertake research into nuclei and observed the generation of nuclei in a narrow duct and the collapse of nuclei in a downstream high-pressure region. The theoretical analysis of nuclei, originally carried out by Rayleigh [27], is the foundation of modern research on cavitation and bubble dynamics. Rayleigh solved the flow problem of an infinite flow field that has a spherical cavity with a vacuum or constant internal pressure based on the law of conservation of energy and proposed an ordinary differential equation (i.e., Rayleigh equation) that neglected the compressibility, surface tension and viscosity to describe the evolution process of bubbles. Plesset [28] derived the well-known Rayleigh–Plesset equation (i.e., R-P equation) by incorporating the surface tension and viscous effect into the Rayleigh model and replacing the constant internal pressure of liquid with the ambient pressure of the actual flow varying with time, promoting the development of bubble dynamics greatly. Subsequently, Trilling et al. [29] considered the compressibility of liquid on the basis of the R-P equation and derived the Herring–Trilling equation by modifying the R-P equation. Gilmore [30] introduced the Kirkwood–Bethe hypothesis [31] and put forward a bubble dynamics equation that took into account the compressibility and dealt with the effect of liquid compressibility more successfully. However, this model is only applicable to the operating condition with a high drive pressure, and it is difficult to obtain an analytical solution in a complex flow field directly [32]. Ivany [33,34], Ivany and Hammitt [35], Hammitt [36] and Mitchell [37,38] considered the compressibility of liquid while reckoning in the surface tension and viscous effect of liquid, which further improved the bubble dynamics theory. With the continuous improvements of relevant theories, bubble dynamics has been applied to a wide range of physical scenarios, such as gas diffusion, heat transfer, and the magnetic field effect. The most representative one is the SAP spherical bubble model, proposed by Chahine and Hsiao that is based on single bubble dynamics, which was applied to the prediction of propeller cavitation inception [39,40,41,42,43,44,45,46]. This model solves for flow field trajectories and boundary conditions with the Eulerian equation, which is followed by releasing microbubbles in the corresponding characteristic region of a flow field, and obtains the growth and movement states of bubbles by solving the Rayleigh–Plesset equation and Lagrangian equation, thus implementing an accurate prediction of TVC inception. Chahine’s team conducted a lot of research work on the numerical simulation of the TVC, with the research objects being ellipse hydrofoils, conventional propellers, and ducted propellers, and mainly explored the cavitation number, Reynolds number, nucleus size, nuclei spectrum distribution, bubble transformation, turbulence simulation method, etc. The team published a summary report on numerical research into cavitation inception in a complex flow field based on their research work and plentiful achievements [47].
A large number of prediction results indicate that the numerical prediction method for cavitation inception with the combination of the Lagrangian framework and the Eulerian framework based on bubble dynamics theory is capable of adapting to various water quality, being more practical and accurate. There are two sets of discrimination criteria in the numerical simulation research based on this method: the optics criterion and acoustics criterion. The optics criterion refers to determining cavitation inception based on the nucleus size; if a nucleus grows to a specific size, it is determined as cavitation inception. For example, the specific size is set at 1 mm, which can be observed with the naked eye, and if a nucleus’s diameter grows to 1 mm, the nucleus is determined as cavitation inception [39]. However, for the case of different initial nucleus sizes, there is not a definite and unified standard in this criterion that can be used to determine cavitation inception. The acoustics criterion refers to determining cavitation inception using acoustic pressure pulse signals. However, the acoustics criterion is seldom used owing to its complicated calculation and inconsistency with the conventional experimental theory. In summary, the current cavitation inception numerical prediction method based on bubble dynamics has not established a set of unified and specific discrimination criteria applicable to propeller cavitation inception. This method is mainly used for verifying rather than predicting cavitation inception. Therefore, if we have the intention of discriminating cavitation inception accurately, it is essential to establish a set of reliable cavitation inception numerical discrimination methods with definite physical significance.
In view of this, we proposed a new discrimination method for TVC inception appli-cable to propellers based on the Eulerian–Lagrangian framework in this research to com-pensate for the deficiencies in existing cavitation inception numerical prediction methods based on bubble dynamics. Using the commercial program ANSYS-FLUENT, the stress-blended eddy simulation model (SBES) was used to accurately predict the TVC inception of the PPTC propeller, and the prediction results were compared to experimental results and prediction results obtained using the minimum pressure coefficient method. Moreover, with the aim of offering a reference for the accurate numerical prediction of propeller TVC inception, we further investigated the effect mechanism of tip vortex flow characteristics on nuclei evolution.
2. Numerical Calculation Model
2.1. Governing Equation
The governing equation is an incompressible Reynolds averaged Navier–Stokes equation consisting of a continuous equation and a momentum equation:
where ρ is the fluid density, fi is the body force, ui represents the velocity in direction i, and μt and μ are the turbulence viscosity and dynamic viscosity, respectively.
2.2. Turbulence Model
In recent years, the dynamic hybrid RANS-LES method (HRL), a hybrid simulation method, has been widely used. The concept of this method is that the whole flow field is partitioned into several regions, and then the turbulence boundary layer flow is solved in near wall regions using the Reynolds averaged Navier–Stokes (RANS) turbulence model method, and the large-scale turbulence structure is solved in the far field using the large eddy simulation (LES) method with a higher accuracy. The HRL method, combining the respective advantages of RANS and LES, reduces calculational complexity significantly and improves calculational efficiency while ensuring accuracy.
The stress-blended eddy simulation model (SBES), the most advanced hybrid simulation calculation model to date, can implement a fast and automatic switch between RANS and LES by refining the length and scale of definition grids compared with the traditional detached-eddy simulation (DES) model and delayed detached-eddy simulation (DDES) model. This method has greater advantages but no apparent grid dependence in dealing with the turbulence problem with a larger geometric curvature of the boundary wall, and is more applicable to the capture of the flow details of a propeller tip vortex [48,49,50]. The SBES model is the reconstruction of the hybrid function based on DES and a divergence term is added into the equation. This model implements a fast and automatic switch from RANS to LES by combining the stresses in RANS and LES using the fSBES screen function, as depicted in Equation (3):
where , and are the stress tensors of SBES, RANS and LES, respectively.
2.3. Discrete Bubble Model
TVC inception is mainly influenced by the coupling effect of cavitation nuclei, the low pressure action at a vortex core and the action time of the low pressure [51]. In the process of TVC inception, nuclei gather towards vortex core low-pressure regions under the action of the pressure gradient of a flow field. They commence to expand and grow explosively when the pressure reaches a certain level and collapse rapidly when the pressure rises again. Therefore, it is necessary to fully consider the growth and collapse effects of nuclei. However, the minimum pressure coefficient method based on the traditional Eulerian framework cannot solve for nuclei’s motion and growth states, thus neglecting their significant influences on cavitation inception. In this paper, we use a discrete spherical bubble model to describe the motion state of the nuclei under the action of forces and the growth–collapse behavior of the nuclei in a tip vortex flow.
A discrete spherical bubble model is adopted to describe the motion and dynamics of nuclei. The motion trajectory of a nucleus that is subject to forces is decided by Newton’s second law given by Equations (4) and (5):
where x, ub, and mb represent the position, velocity, and mass of a bubble, respectively. The force F consists of all kinds of forces imposing on a bubble. As for the cavitation inception problem, the drag FD, pressure gradient force FPG, volume change force FV and additional mass force are the main factors affecting the motion trajectory of a nucleus in a flow field. Therefore, we only consider the influences of the four forces mentioned above on a nucleus, and Equation (5) becomes
where FD, FPG, and FV are the drag, pressure gradient force, and volume change force, respectively. Additionally, is the additional mass force. Rb is the nucleus radius, ρ1 is the Eulerian field density, p is the Eulerian field, and CD is the resistance coefficient given by the following empirical formula:
where Reb is the nucleus Reynolds number:
Moreover, nuclei dynamics are another point to note. In order to describe the growth and collapse behaviors of nuclei in a pressure field precisely, the classic Rayleigh–Plesset (R-P) equation is used to solve the nuclei changes in the radial direction. Meanwhile, due to the velocity difference between a moving nucleus and the local fluid, there is an additional pressure term acting on a nucleus surface with the magnitude of (u − ub)2/4. The R-P equation can be denoted as
where R is the nucleus radius, is the velocity of a nucleus wall, is the acceleration of a nucleus wall, Pv is the saturated vapor pressure, and S is the surface tension. The initial pressure of nuclei Pg0 is given by
A previous study [52] shows that the effect of liquid compressibility should not be neglected in the growth and collapse processes of nuclei. Therefore, we adopt the piece-wise Rayleigh–Plesset governing equation in this paper, that is, adopting the traditional R-P equation to control the growth process and the R-P equation considering the effect of liquid compressibility to control the collapse process. Therefore, for the nuclei in a collapse process, the R-P equation can be denoted as Equation (11):
where ε = 1 − ρg/ρl is a constant, C0 is the sound velocity, and is the first derivative of the bubble wall pressure. The specific heat ratio γ takes different values during the growth and collapse processes of nuclei. The growth process is slower compared with the collapse process and can be considered as an isothermal process; hence, γ is set to 1, i.e., γ = 1. A cavitation bubble collapses rapidly and the surface of the bubble contracts inwards at a higher speed when the bubble leaves a low-pressure region and enters a high-pressure region. The entire collapse process lasts for an extremely short time and can be considered an adiabatic process; hence, γ is set to 1.4, i.e., γ = 1.4 [53].
It should be noted that Pencounter is considered as the pressure at the bubble’s center point in a classic bubble model. If the pressure of the flow field at a vortex core is lower than the saturated vapor pressure, the bubble radius obtained based on this simplified model will infinitely increase, which is inconsistent with the practical laws of physics. To this end, we replace the pressure at the bubble’s center point with the average pressure acting on the bubble surface in this paper. In order to improve the accuracy of the numerical calculation, we adopt a four-order Runge–Kutta discrete format to solve the discrete phase differential equation, and solve for the discrete phase information of the Lagrangian framework after each Eulerian time step ends. The Lagrangian time step adopted in this paper is much smaller than the Eulerian time step, with a difference reaching four orders of magnitude, so as to update the discrete phase information in time [54].
3. Numerical Calculation Settings
3.1. Propeller Model
The numerical calculation model adopted in this paper is based on the PPTC model propeller of Potsdam Pool in Germany, which was used as a benchmark propeller in the 2nd and 4th International Symposia on Marine Propulsors (SMP ’11 and ’15). There are numerous open water and cavitation experimental data and numerical calculation results available [55]. The main parameters of the PPTC propeller model are given in Table 1, where AE is the expanded area of a propeller, AO is the propeller disk area, and D is the propeller diameter. The geometric model is shown in Figure 1.

Table 1.
Main parameters of propeller PPTC.
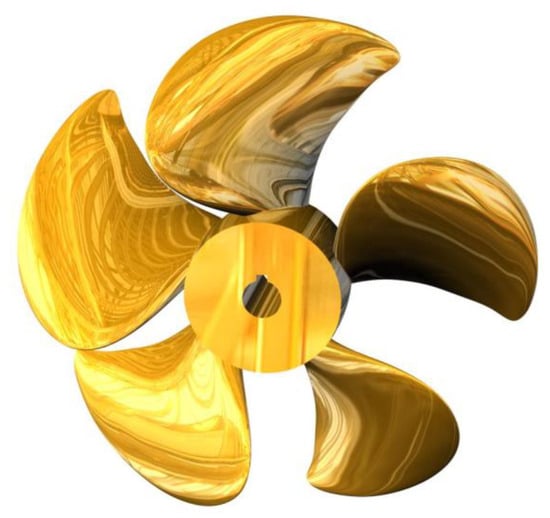
Figure 1.
Geometric model of propeller PPTC.
3.2. Calculation Domain and Grid Settings
Before carrying out the prediction for propeller TVC inception based on the aforementioned models, we need to determine the size of entire calculation domain and perform the appropriate calculation setup. The calculation domain is a cylinder coaxial with the propeller, as illustrated in Figure 2, where the left is the velocity inlet boundary and the right is the pressure outlet boundary. The blade surface adopts non-sliding wall conditions and other wall surfaces adopt free wall conditions. The distance from the propeller disk surface to the velocity inlet and the pressure outlet are 4D and 10D, respectively, and the distance between the side boundary and the propeller center is 2.5D. We divide the calculation domain into two parts—a stationary domain and a rotational domain—using sliding grids. Moreover, the low pressure and larger radial pressure gradient at the tip vortex core concern the suction, growth, and collapse processes of bubbles. Therefore, it is necessary to conduct a grid refinement in the tip vortex region to reduce the numerical discrete error effectively and simulate the low pressure and the larger radial pressure gradient at the tip vortex core accurately. Finally, the number of grids is set to 13,000,000, and the details of grids are shown in Figure 3. With the aim of ensuring the stability of bubble dynamics iterations, the time step of the unsteady calculation is set to the time taken for each 0.2° rotation of the propeller.
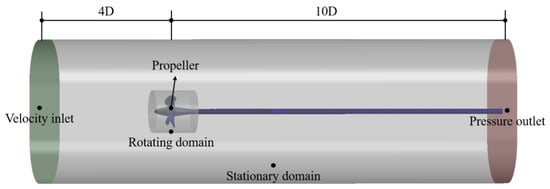
Figure 2.
Definition of the calculation zone and boundary conditions.
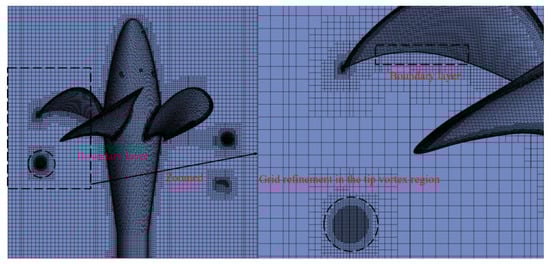
Figure 3.
Sketch of a mesh grid.
3.3. Nuclei Distribution Settings
The initial sizes of nuclei have significant influences on the prediction of tip vortex cavitation inception, as a nucleus with larger size is prone to be captured by a tip vortex and grows to an incipient cavitation bubble [56], leading to a higher predictive value of the incipient cavitation number. The literature [57] argues that the initial radius of a nucleus R = 100 μm can be used as the maximum nucleus radius in the practical calculation of a cavitation tunnel. In the literature [58], nuclei with three different initial diameters are selected for the calculation, and it is found that the initial radius of a nucleus R = 50 μm can satisfy the discrimination criterion of cavitation inception in engineering applications. The existing experimental measurement results indicate that the diameters of nuclei in the water are mainly distributed between 40 μm and 60 μm. In summary, in order to eliminate the influence of the nucleus initial size and make the proposed cavitation inception discrimination method based on bubble dynamics in this paper more applicable, the nucleus initial diameter selected in this paper is a fixed value of 50 μm by referring to the nuclei spectrum given by the experiments in [55]. There are 14,040 nuclei in total, which are released randomly in an annular region 0.2R–1.0R away from the upstream of the propeller disk surface. The initial release region of nuclei is shown in Figure 4.
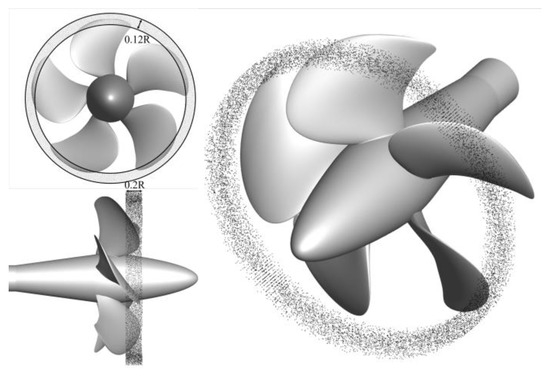
Figure 4.
Diagram of the nuclei release position.
4. Discussion and Analysis of Results
4.1. Verification of Calculation Model Reliability
An open water experiment refers to an experiment conducted on a propeller model in a uniform inflow, and the hydrodynamic performance of the propeller obtained using direct and indirect measurements in an open water experiment is called propeller open water performance. The simulation accuracy of propeller open water performance reflects the rationality of the selected calculation model and grid settings. In this paper, we conduct a prediction for the open water performance of the PPTC propeller, select an advance coefficient range of 0.1334~1.0683, and compare the predicted results with the experimental results [55]. The thrust coefficient KT and torque coefficient KQ are respectively given by Equations (12) and (13):
We plot in Figure 5 the curves of the calculated open water performance and official experimental data. It can be observed from Figure 5 that both the propeller thrust and torque decrease significantly with the increase in the advance coefficient, and the relative errors between the simulation results of the thrust coefficient and experimental results are less than 5%, as are the relative errors between the simulation results of the torque coefficient and experimental results. This shows that the numerical simulation of the Eulerian flow field based on this set of grids is relatively accurate and reliable, laying a foundation for the subsequent calculations of discrete bubble models. The verification of the discrete bubble model has been detailed in previous studies [54]; therefore, we will not further elaborate here.
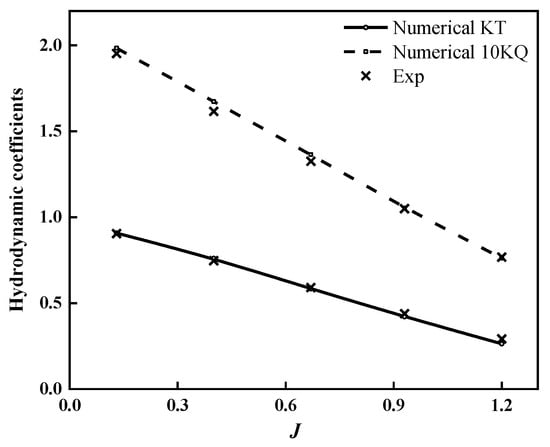
Figure 5.
Open water characteristics curves of the PPTC propeller.
In real-world engineering applications, the optics criterion used for observing whether tiny cavities occur at a tip vortex through model experiments is usually used to determine cavitation inception. Therefore, in order to verify the reliability of a bubble dynamics method in a propeller cavitation inception numerical simulation, it is necessary to compare simulation results with the results of the traditional Eulerian cavitation model and experiment using the optics criterion. We conduct a Eulerian flow field simulation on the operating condition of tip vortex cavitation inception, the advance coefficient of the cavitation inception operating condition is J = 0.9983, σn = 6.39, and the rotational speed is 1259.1 rpm, i.e., n = 1259.1 rpm. The inlet and outlet boundary conditions are respectively given by Equations (14) and (15):
The calculation results are shown in Figure 6. Figure 6a shows the photo taken during the experiment. Figure 6b shows the results obtained by adopting our proposed numerical prediction method based on the Eulerian–Lagrangian framework in this paper, and Figure 6c shows the isosurface with a vapor volume of 0.1 calculated based on the traditional ZGB cavitation model under the Eulerian framework. To facilitate observation, the bubbles in Figure 6b are magnified ten times their actual diameters. The bubble diameter is characterized by the color of the bubble, and the redder the color, the larger the bubble diameter.
It can be clearly observed that the position and morphology of the incipient cavitation predicted by the numerical prediction method proposed in this paper are highly consistent with the results illustrated in the photo taken in experiments under the same operating conditions. In addition, it is worth mentioning that the morphology of the inceptive tip vortex cavitation bubble obtained with the simulation based on the methods proposed in this paper is slightly shorter compared with that obtained from experiments, which is closely related with the initial release position and initial concentration of nuclei. In contrast, the cavitation models under the traditional Eulerian framework cannot predict this incipient cavitation process accurately, and this is sufficient to indicate that the method proposed in this paper is accurate and reliable for the prediction of propeller cavitation inception, and has obvious advantages.
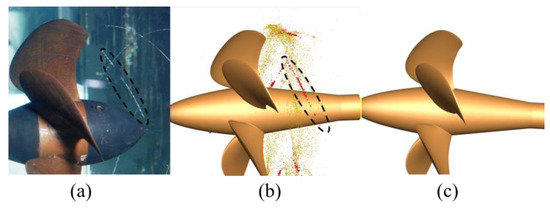
Figure 6.
Comparison of the cavitation distribution with experimental results [55]. (a) Experimental result; (b) Numerical result obtained by proposed numerical prediction method based on the Eulerian-Lagrangian framework; (c) Numerical result based on the traditional ZGB cavitation model under the Eulerian framework.
4.2. A Discrimination Criterion for Propeller Cavitation Inception Based on the Bubble Dynamics Model
The comparative verification between the aforementioned calculation results and experimental results merely illustrates the reliability of this numerical method and is not yet sufficient to implement a numerical prediction for propeller cavitation inception. If we have the intention of using this method to conduct a cavitation inception prediction instead of verification, it is necessary to establish a set of discrimination criteria applicable to propeller TVC inception. However, most of existing studies based on microscopic bubbles only mention the specific size to which a nucleus needs to grow to be determined as incipient cavitation and do not specify a quantity threshold for incipient cavitation bubbles used to determine the cavitation inception. Therefore, if we have the intention of implementing a numerical prediction for propeller TVC inception, it is necessary to establish a set of discrimination criteria for the propeller TVC inception based on bubble dynamics through associating incipient cavitation bubbles with cavitation inception.
That is, it is necessary to specify a diameter threshold that is used to determine whether a nucleus is an incipient cavitation bubble to allow for an accurate prediction of propeller TVC inception. The definition of an incipient cavitation bubble has been given in many experimental studies [59], that is, a nucleus grows to a size threshold. For example, as early as the last century, Hsiao et al. [39] argued that if a nucleus grows to 1 mm, which can be observed with the naked eye, it can be defined as an incipient cavitation bubble. In this paper, we respectively count up the nuclei growing to 1 mm, 2 mm, 3 mm, and 4 mm under different cavitation numbers in the TVC inception operating condition (advance coefficient J = 0.9983), as shown in Figure 7.
It can be observed that, although under the circumstance of the same cavitation number, the larger the diameter used for defining an incipient cavitation bubble, the fewer the incipient cavitation bubbles, the variation trends of the number of incipient cavitation bubbles obtained under different definition criteria with the cavitation number are identical, which indicates that although the number of incipient cavitation bubbles obtained by adopting different definition criteria under the circumstance of the same cavitation number are different, the variation trends of the number of incipient cavitation bubbles with the cavitation number are identical. In order to be consistent with the optics criterion adopted in previous studies, we select the size of 1 mm as the discrimination criterion for an incipient cavitation bubble, that is, as long as the diameter of a nucleus increases to 1 mm, the nucleus will be determined as an incipient cavitation bubble.
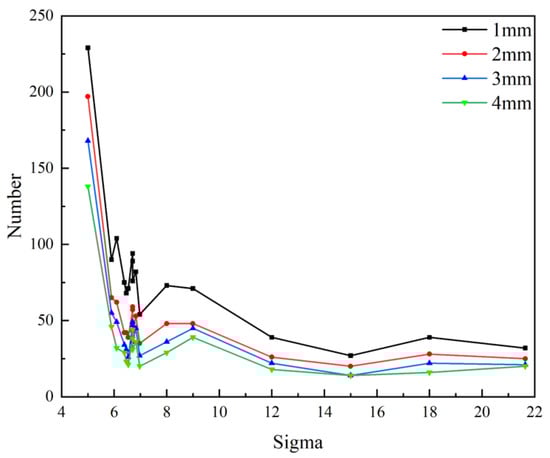
Figure 7.
Curves of the number of incipient cavitation bubbles with different diameters.
In order to better reflect the variation trend of the number of incipient cavitation bubbles with the cavitation number, we count up all incipient cavitation bubbles under the circumstance of different cavitation numbers, respectively, and fit them with an exponential function curve, as shown in Figure 8. The scatter points in Figure 8 are the results calculated with numerical simulations, and the curve is the fitting result. The R-Square value of the curve fitting is 0.957, which indicates that the fitting has a higher confidence level and can fully reflect the variation trend of scatter points. It should be noted that although the number of incipient cavitation bubbles presents an upward trend with the decrease in the cavitation number on the whole, the numbers within different cavitation number ranges are not the same.
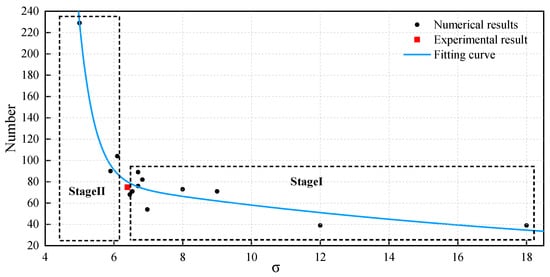
Figure 8.
The curve of the number of incipient cavitation bubbles with different cavitation numbers (J = 0.9983).
As shown in Figure 8, at stage I, with the decrease in the cavitation number, the number of incipient cavitation bubbles does not increase significantly, but presents a slow upward trend on the whole with a small absolute value of the slope. The reasons are as follows: the cavitation number is larger at this stage, although part of nuclei are suctioned into the tip vortex core, and there are not many nuclei growing explosively to an incipient cavitation bubble due to the higher pressure at the vortex core. However, at stage II, with the further decrease in the cavitation number, the number of incipient cavitation bubbles increases significantly and the absolute value of the slope increases dramatically, which contrasts sharply with stage I. This is because the vortex core pressure decreases with a further decrease in the cavitation number and more nuclei captured by the tip vortex grow explosively to incipient cavitation bubbles, resulting in cavitation on propellers at this moment. Once combined with the variation regulations of the number of incipient cavitation bubbles and the physical mechanism of bubble generation in stages I and II, it indicates that with the decrease in the cavitation number, the ‘inflection point’ of the slope in the transition from stage I to stage II can be considered as a cavitation inception point. It is worth noting that the experimental incipient cavitation number σ = 6.389 is exactly around the ‘inflection point’ of the slope. This means that the incipient cavitation number under this advance coefficient can be obtained by counting up incipient cavitation bubbles at different cavitation numbers and finding the ‘inflection point’ of the slope representing the transition of quantity trends; thus, we can implement an effective numerical prediction for the incipient cavitation of propellers, constraining the error within a reasonable range.
In order to further verify the reliability of this method and referring to the incipient cavitation operating conditions in experimental reports, we conduct numerical calculations for the two operating conditions with advance coefficients of J = 0.8964 and J = 0.9725, respectively, count up the incipient cavitation bubbles at different cavitation numbers and obtain the numerical prediction results for incipient cavitation numbers through fitting, which are compared with experimental results. We select 13 operating conditions with different cavitation numbers under each advance coefficient, as shown in Table 2, in which, the experimental incipient cavitation numbers of the two operating conditions with the two advance coefficients mentioned above are σ = 7.859 and σ = 6.2859, respectively.
Table 2.
Calculation cases.
As shown in Figure 9, it can be observed that the number of incipient cavitation bubbles first increases slowly with the decrease in the cavitation number at stage I likewise. However, compared to stage I, it increases sharply with the decrease in the cavitation number at stage II and the absolute value of the slope increases meanwhile. This is in accord with a cavitation vortex strip phenomenon occurring suddenly, as observed during experiments, and further demonstrates the accuracy of this method. It is worth noting that the red dotted line box represents the relative error band of the incipient cavitation number (−10~10%), and it can be observed that the slope ‘inflection point’ of the fitting curve of the number of incipient cavitation bubbles is within this relative error band. This indicates that the relative errors between the experimental results and the prediction results of cavitation inception obtained with this discrimination method for cavitation inception can be constrained within a range of 10%. In contrast, the relative error of the incipient cavitation number obtained with the traditional minimum pressure coefficient method and the same grid settings is obviously larger than 10%, as illustrated in Table 3. This is because the minimum pressure coefficient method requires grids with fairly good quality, whereas the propeller, a complex and distorted unstructured grid for geometric purposes, is bound to have grids with extremely poor quality near the edge, which result in large numerical errors. The bubble dynamics model has low requirements for grid quality and can implement a more accurate prediction under the circumstance of unstructured propeller grids, which further indicates that the numerical calculation method adopted in this paper and the corresponding discrimination criterion for cavitation inception have a higher accuracy compared to the minimum pressure coefficient method.
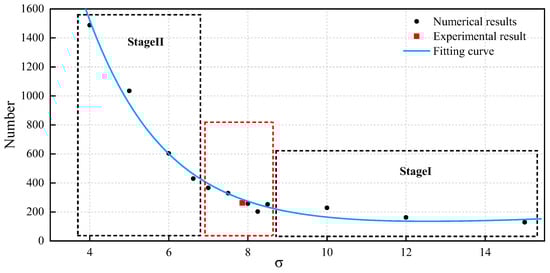
Figure 9.
The curve of the number of incipient cavitation bubbles at different cavitation numbers (J = 0.8649).
The variation trend of the number of incipient cavitation bubbles with the cavitation number under the operating condition with the advance coefficient of J = 0.9725 is identical with that of J = 0.8649, and adopting the same method to determine the range of the incipient cavitation number can effectively constrain the relative error within 10% likewise, as shown in Figure 10. The two relative errors of the incipient cavitation number under the two operating conditions obtained with the traditional minimum pressure coefficient method are obviously larger than 10%, as illustrated in Table 3.
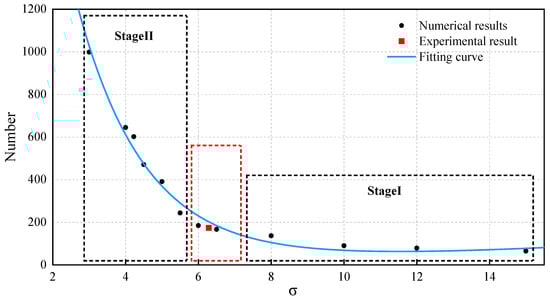
Figure 10.
The curve of the number of incipient cavitation bubbles at different cavitation numbers (J = 0.9725).
Table 3.
Numerical calculation error of the minimum pressure coefficient method.
Table 3.
Numerical calculation error of the minimum pressure coefficient method.
| J | Experimental Result | The Minimum Pressure Coefficient Method | The Relative Error |
|---|---|---|---|
| 0.8649 | 7.859 | 6.712 | −14.6% |
| 0.9725 | 6.285 | 5.292 | −15.8% |
| 0.9983 | 6.389 | 5.265 | −17.6% |
In addition, it is worth noting that although the variation trends of the number of incipient cavitation bubbles with the cavitation number under the two different advance coefficients are identical, the number of incipient cavitation bubbles under the operating condition with an advance coefficient of J = 0.8649 is obviously larger than that of J = 0.9725, which indicates that nuclei are more prone to be suctioned into the tip vortex under the operating condition with a lower advance coefficient. Therefore, it is necessary to investigate in detail the growth and collapse processes of nuclei during the course of nuclei being suctioned and captured from a microscopic perspective.
4.3. The Influence of Tip Vortex Flow on Nuclei Evolution
Figure 11 shows the variation curves of the coefficient of the pressure on the nucleus surface and nucleus radius under the operating condition with an advance coefficient of J = 0.9725. In order to analyze in detail the influence of a tip vortex flow on nuclei evolution in the flow field in which the nuclei are located, we select six representative times—t1, t2, …, t6—in the growth and collapse processes of nuclei under the influence of the tip vortex, presenting the typical process of nuclei being suctioned into the vortex core by the tip vortex, starting to grow, leaving the tip vortex and collapsing, as illustrated in Figure 12. To facilitate observation, the nuclei in the figure are all magnified to eight times their actual sizes for presentation, and the grey semitransparent isosurface represents an isosurface with Q = 240,000 s−2 which is used for characterizing the morphology of the tip vortex.
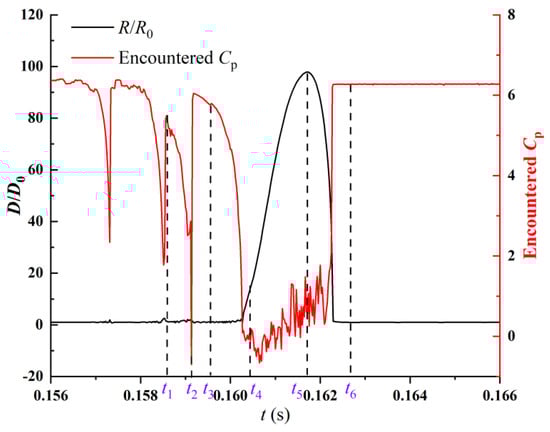
Figure 11.
The variation curves of the coefficient of the pressure on the nucleus surface and nucleus radius.
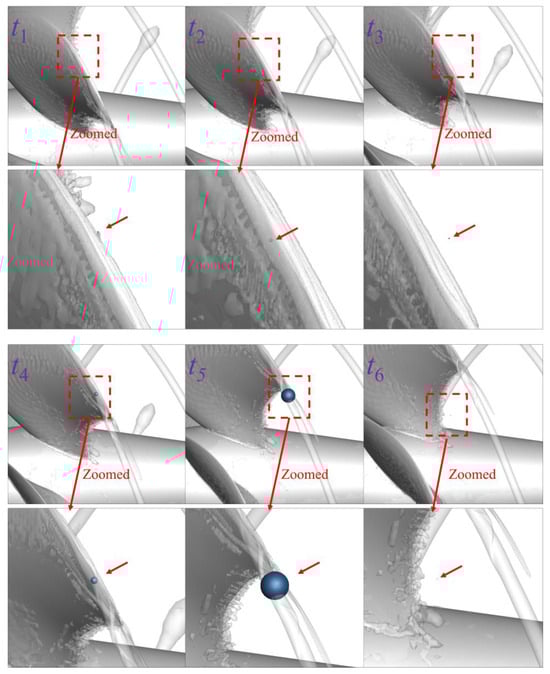
Figure 12.
Relative positions of typical nuclei and a vortex.
It can be observed that around the guide edge of a blade tip, nuclei commence to approach the tip vortex for the first time and the diameters of nuclei fluctuate within a narrow range during the period from time t1 to t2. In this process, the pressure acting on nuclei decreases rapidly and reaches minimum when nuclei are suctioned to the vicinity of the tip vortex edge at time t2. Thereafter, during the period from time t2 to t3, the nuclei are not captured by the region shaped by the tip vortex at the guide edge, but turn away from the tip vortex core once again, and the sizes of nuclei, only fluctuating within a narrow range, do not increase explosively. This is because nuclei approach the tip vortex edge gradually under the influence of the tip vortex suction but do not enter the vortex core low-pressure region. Although the pressure acting on nuclei (illustrated by the red curve in Figure 11) decreases significantly, it rises again soon. The duration of the low pressure is very short, and so the sizes of nuclei do not increase explosively.
Thereafter, during the period from time t3 to t4, nuclei travel downstream and approach the vortex core low-pressure region once again under the influence of the tip vortex radial pressure gradient, and the ambient pressure around nuclei decreases gradually. It is worth noting that the radii of nuclei commence to increase around time t4; however, because the nuclei just enter the vortex core low-pressure region and the action time of the low pressure is short, the sizes of nuclei do not increase significantly. After nuclei enter the vortex core low-pressure region at time t4, the pressure around nuclei fluctuates slightly within a lower range all the time and the nuclei commence to grow explosively under the continuous influence of the vortex core low pressure until reaching their maximum sizes at time t5. Subsequently, the nuclei are thrown out of the tip vortex core low-pressure region rapidly, the pressure around nuclei rises again to the higher initial pressure, which leads to a rapid contraction and collapse of the incipient cavitation bubble. The nuclei are thrown out of the tip vortex core low-pressure region after experiencing an explosive growth; this process is likely to be closely related to the fact that the drag increases with the rapid increase in the size of a nucleus after an explosive growth. From this, it can be observed that nuclei will be influenced by the tip vortex suction as they travel downstream and their motion, growth, and collapse processes are closely related to the tip vortex, which indicates that the flow characteristics of a vortex core have a significant influence on nuclei evolution.
5. Conclusions
In this paper, we implement an accurate numerical prediction for the TVC inception of the PPTC propeller by developing and adopting the numerical prediction method for TVC inception based on bubble dynamics under the Eulerian-Lagrangian framework, and propose a set of cavitation inception discriminating criteria applicable to propellers based on bubble dynamics under the Eulerian–Lagrangian framework.
The main conclusions are as follows:
- (1)
- Adopting the bubble dynamics model based on the Eulerian–Lagrangian framework proposed in this paper allows us to accurately simulate propeller TVC inception and has more advantages compared with the traditional cavitation model simulation method based on the Eulerian framework.
- (2)
- The cavitation inception prediction method based on the bubble dynamics model under the Eulerian–Lagrangian framework has significant advantages compared with the traditional minimum pressure coefficient method. We can accurately predict propeller TVC inception and constrain the relative error within a range of 10% by adopting this method.
- (3)
- The pressure acting on a nucleus fluctuates sharply and briefly as the nucleus approaches a vortex core low-pressure region under the action of the tip vortex suction, and decreases rapidly when the nucleus enters the vortex core low-pressure region. Finally, under the continuous influence of the vortex core low pressure, the nucleus commences to experience explosive growth until it collapses rapidly when reaching its maximum size.
Author Contributions
Conceptualization, J.D.; Methodology, J.D.; Software, J.D.; Validation, J.D.; Formal analysis, J.D.; Investigation, J.D.; Resources, J.D.; Data curation, J.D.; Writing—original draft, J.D.; Writing—review & editing, R.X., L.C., R.L. and Z.Y.; Visualization, J.D., R.L. and Z.Y.; Supervision, R.X. and L.C.; Project administration, L.C., R.L. and Z.Y.; Funding acquisition, R.L. All authors have read and agreed to the published version of the manuscript.
Funding
This research was supported by the National Key Laboratory on Ship Vibration and Noise of China under Grant No. 6142204210706.
Institutional Review Board Statement
Not applicable.
Informed Consent Statement
Not applicable.
Data Availability Statement
The data presented in this study are available on request from the corresponding author. The data are not publicly available because the data also form part of an ongoing study.
Conflicts of Interest
The authors declare no conflicts of interest.
References
- Brandao, F.-L.; Bhatt, M.; Mahesh, K. Numerical study of cavitation regimes in flow over a circular cylinder. J. Fluid Mech. 2020, 885, A19. [Google Scholar] [CrossRef]
- Zhang, Y.-L.; Xu, W.-L.; Zhang, F.-X.; Zhang, Q. Collapsing characteristics of gas-bearing cavitation bubble. J. Hydrodyn. 2019, 31, 66–75. [Google Scholar] [CrossRef]
- Carlton, J.-S. Chapter 9—Cavitation. In Marine Propellers and Propulsion, 4th ed.; Carlton, J.-S., Ed.; Butterworth-Heinemann: Oxford, UK, 2019; pp. 217–260. [Google Scholar]
- Park, K.; Seol, H.; Choi, W.; Lee, S. Numerical prediction of tip vortex cavitation behavior and noise considering nuclei size and distribution. Appl. Acoust. 2009, 70, 674–680. [Google Scholar] [CrossRef]
- Viitanen, V.; Sipila, T.; Sanchez-Caja, A.; Siikonen, T. CFD predictions of unsteady cavitation for a marine propeller in oblique inflow. Ocean Eng. 2022, 266, 112596. [Google Scholar] [CrossRef]
- Wang, Y.-S.; He, C.-H.; Wang, X.-C.; Cheng, H.-Y.; Ji, B. Influence of skew angle on the cavitation dynamics and induced low-frequency pressure fluctuations around a marine propeller. Ocean Eng. 2023, 277, 114302. [Google Scholar] [CrossRef]
- Venning, J.-A.; Pearce, B.-W.; Brandner, P.-A. Nucleation effects on cloud cavitation about a hydrofoil. J. Fluid Mech. 2022, 947, A1. [Google Scholar] [CrossRef]
- Amini, A.; Reclari, M.; Sano, T.; Iino, M.; Dreyer, M.; Farhat, M. On the physical mechanism of tip vortex cavitation hysteresis. Exp. Fluids 2019, 60, 118. [Google Scholar] [CrossRef]
- Peng, X.-X.; Xu, L.-H.; Liu, Y.-W.; Zhang, G.-P.; Cao, Y.-T.; Hong, F.-W.; Yan, K. Experimental measurement of tip vortex flow field with/without cavitation in an elliptic hydrofoil. J. Hydrodyn. 2017, 29, 939–953. [Google Scholar] [CrossRef]
- Zhang, L.-X.; Zhang, N.; Peng, X.-X.; Wang, B.-L.; Shao, X.-M. A review of studies of mechanism and prediction of tip vortex cavitation inception. J. Hydrodyn. 2015, 27, 488–495. [Google Scholar] [CrossRef]
- Aktas, B.; Atlar, M.; Turkmen, S.; Shi, W.; Sampson, R.; Korkut, E.; Fitzsimmons, P. Propeller cavitation noise investigations of a research vessel using medium size cavitation tunnel tests and full-scale trials. Ocean Eng. 2016, 120, 122–135. [Google Scholar] [CrossRef]
- Keller, A.-P. Cavitation Scale Effects-Empirically Found Relations and the Correlation of Cavitation Number and Hydrodynamic Coefficients, Fourth International Symposium on Cavitation; California Institute of Technology: Pasadena, CA, USA, 2001. [Google Scholar]
- Schmidt, H.; Kirschner, O.; Riedelbauch, S. Cavitation measurements on a pump-turbine model. J. Phys. 2015, 656, 012071. [Google Scholar] [CrossRef]
- Higuchi, H.; Arndt, R.; Rogers, M. Characteristics of tip vortex cavitation noise. J. Fluid. Eng. 1989, 114, 495–501. [Google Scholar] [CrossRef]
- Asnaghi, A.; Svennberg, U.; Bensow, R.-E. Analysis of tip vortex inception prediction methods. Ocean Eng. 2018, 167, 187–203. [Google Scholar] [CrossRef]
- Muzaferija, S.; Papoulias, D.; Peric, M. VOF Simulations of hydrodynamic cavitation using the asymptotic and classical Rayleigh Plesset models. In Proceedings of the Fifth International Symposiums on Marine Propulsors, Espoo, Finland, 12–15 June 2017. [Google Scholar]
- Yilmaz, N.; Aktas, B.; Atlar, M.; Fitzsimmons, P.-A.; Felli, M. An experimental and numerical investigation of propeller-rudder-hull interaction in the presence of tip vortex cavitation (TVC). Ocean Eng. 2020, 216, 108024. [Google Scholar] [CrossRef]
- Fang, G.-Q.; Qian, Z.-F.; Jiang, J.-W. Research on sheet cavitation numerical predicted and estimation of tip vortex cavitation inception of ducted propeller with pre-swirl stator. Ship Sci. Technol. 2016, 38, 26–29. [Google Scholar]
- Xin, G.-Z.; Zhou, B.; Liu, D.-C. Numerical analysis of tip clearance vortex cavitation inception discrimination of ducted propeller. In Proceedings of the Ship Hydrodynamics Conference, Ghent, Belgium, 3–5 June 2013; pp. 211–218. [Google Scholar]
- Chesnakas, C.-J.; Jessup, S.-D. Tip-Vortex Induced Cavitation on a Ducted Propulsor. In Proceedings of the Fifth International Symposium on Cavitation CAV, Osaka, Japan, 1–4 November 2003. [Google Scholar]
- Hsiao, C.-T.; Chahine, G.-L. Numerical Study of Cavitation Inception due to Vortex/Vortex Interaction in a Ducted Propulsor. In Proceedings of the 25th Symposium on Naval Hydrodynamics, St. John, NL, Canada, 8–13 August 2004. [Google Scholar]
- Brewer, W.-H.; Marcum, D.L.; Jessup, S.D.; Chesnakas, C.; Hyams, D.G.; Sreenivas, K. An Unstructured RANS Study of TipLeakage Vortex Cavitation Inception. In Proceedings of the ASME Symposium on Cavitation Inception, FEDSM2003-45311, Honolulu, HI, USA, 6–10 July 2003. [Google Scholar]
- Kim, J. Sub-Visual Cavitation and Acoustic Modeling for Ducted Marine Propulsor. Ph.D. Thesis, Department of Mechanical Engineering, The University of Iowa, Iowa City, IA, USA, 2002. [Google Scholar]
- Yang, C.-I.; Jiang, M.; Chesnakas, C.J.; Jessup, S.-D. Numerical Simulation of Tip Vortices of Ducted-Rotor; NSWCCD-50-TR-2003/46; Dynaflow, Inc.: Jessup, MD, USA, 2004. [Google Scholar]
- Spall, R.-E. Numerical study of a wing-tip vortex using the Euler equations. J. Aircr. 2001, 38, 22–27. [Google Scholar] [CrossRef]
- Reynolds, O. On the Dynamical Theory of Incompressible Viscous Fluids and the Determination of the Criterion. Philos. Trans. R. Soc. Lond. 1895. [Google Scholar]
- Rayleigh, L. On the pressure developed in a liquid during the collapse of a spherical cavity. Lond. Edinb. Dublin Philos. Mag. J. Sci. 1917, 34, 94–98. [Google Scholar] [CrossRef]
- Plesset, M.-S. The dynamics of cavitation bubbles. J. Appl. Mech. 1949, 16, 277–282. [Google Scholar] [CrossRef]
- Trilling, L. The collapse and rebound of a gas bubble. J. Appl. Phys. 1952, 23, 14–17. [Google Scholar] [CrossRef]
- Gilmore, F.-R. The Growth or Collapse of a Spherical Bubble in a Viscous Compressible Liquid; Technical Report No. 26-4; California Institute of Technology: Pasadena, CA, USA, 1952. [Google Scholar]
- Kirkwood, J.-G.; Bethe, H.-A. Progress Report on “The Pressure Wave Produced by an Underwater Explosion” I; Technical Report No. 588; Office of Scientific Research and Development: Washington, DC, USA, 1942. [Google Scholar]
- Zhao, X.-T.; Cheng, H.-Y.; Ji, B. The effect of flow speed on the bubble dynamics: A numerical study. Ocean Eng. 2022, 259, 111888. [Google Scholar] [CrossRef]
- Ivany, R.-D.; Hammitt, F.-G. Cavitation bubble collapse in viscous, compressible liquids-numerical analysis. ASME J. Basic Eng. 1965, 87, 977–985. [Google Scholar] [CrossRef]
- Ivany, R.-D. Collapse of a Cavitation Bubble in Viscous, Compressible Liquid-Numerical and Experimental Analyses. Ph.D. Thesis, University of Michigan, Ann Arbor, MI, USA, 1965. [Google Scholar]
- Ivany, R.-D.; Hammitt, F.-G.; Mitchell, T.-M. Cavitation bubble collapse Observations in a venturi. ASME J. Basic Eng. 1966, 88, 649–657. [Google Scholar] [CrossRef]
- Hammitt, F.-G. Cavitation and Multiphase Flow Phenomena; Mcgraw-Hill: New York, NY, USA, 1980. [Google Scholar]
- Mitchell, T.-M. Numerical Studies of Asymmetric and Thermodynamic Effects on Cavitation Bubble Collapse. Ph.D. Thesis, University of Michigan, Ann Arbor, MI, USA, 1970. [Google Scholar]
- Mitchell, T.-M.; Cheesewright, R.; Hammitt, F.-G. Numerical Studies of Asymmetric Bubble Collapse; ASME Cavitation Forum: New Orleans, LA, USA, 1968; pp. 4–5. [Google Scholar]
- Hsiao, C.-T.; Pauley, L.-L. Study of tip vortex cavitation inception using Navier-Stokes computation and bubble dynamics model. J. Fluids Eng. 1999, 121, 198–204. [Google Scholar] [CrossRef]
- Hsiao, C.; Chahine, G.; Liu, H. Scaling effect on prediction of cavitation inception in line vortex flow. J. Eng. 2003, 125, 53–60. [Google Scholar] [CrossRef]
- Hsiao, C.; Chahine, G. Effect of vortex/vortex interaction on bubble dynamics and cavitation noise. In Proceedings of the Fifth International Symposixim on Cavitation CAV 2003, Osaka, Japan, 1–4 November 2003. [Google Scholar]
- Chahine, G. Nuclei effects on cavitation inception and noise. In Proceedings of the 25th Symposium on Naval Hydrodynamics, St. John’s, NL, Canada, 8–13 August 2004. [Google Scholar]
- Hsiao, C.; Chahine, G. Prediction of tip vortex cavitation inception using coupled spherical and nonspherical bubble models and navier-stokes computations. J. Mar. Sci. Technol. 2004, 8, 99–108. [Google Scholar] [CrossRef]
- Hsiao, C.; Chahine, G. Scaling of tip vortex cavitating inception noise with a bubble dynamics model Accounting for nuclei size distribution. J. Funds Eng. 2005, 127, 55–65. [Google Scholar]
- Hsiao, C.-T.; Jain, A.; Chahine, G.-L. Effect of gas diffusion on bubble entrainment and dynamics around a propeller. In Proceedings of the 26th Symposium on Naval Hydrodynamic, Rome, Italy, 17–22 September 2006; National Academy Press: Washington, DC, USA, 2006. [Google Scholar]
- Hsiao, C.-T.; Chahine, G.-L. Scaling of tip vortex cavitation inception for a marine open propeller. In Proceedings of the 27th Symposium on Naval Hydrodynamic, Seoul, Korea, 5–10 October 2008; National Academy Press: Washington, DC, USA, 2008. [Google Scholar]
- Chahine, G.-L.; Hsiao, C.-T.; Choi, J.-K. A Numerical Study of Cavitation Inception in Complex Flow Fields; Dynaflow Inc.: Jessup, MD, USA, 2007. [Google Scholar]
- Liu, C.-B.; Li, J.; Li, Y.; Wang, T.-J. Scale-resolving simulation and particle image velocimetry validation of the flow around a marine propeller. J. Zhejiang Univ.-Sci. A 2019, 20, 553–563. [Google Scholar] [CrossRef]
- Liu, C.-B.; Li, J.; Bu, W.-Y.; Xu, Z.-X.; Xu, D.; Ma, W.-X. Application of scale-resolving simulation to a hydraulic coupling, a hydraulic retarder, and a hydraulic torque converter. J. Zhejiang Univ.-Sci. A 2018, 19, 904–925. [Google Scholar] [CrossRef]
- Menter, F.-R. Stress-Blended Eddy Simulation (SBES)—A New Paradigm in Hybrid RANS-LES Modeling. In Progress in Hybrid RANS-LES Modelling HRLM 2016, Proceedings of the Sixth HRLM Symposium, Strasbourg, France, 26–28 September 2016; Springer Science and Business Media LLC: Cham, Switzerland, 2018; pp. 27–37. [Google Scholar]
- Franc, J.-P.; Michel, J.M. Fundamentals of Cavitation; Springer Science & Business Media: Berlin, Germany, 2006. [Google Scholar]
- Tomita, Y.; Shima, A. On the behavior of a sphere bubble and the impulse pressure in a viscous compressible liquid. Bull. JSME 1997, 20, 1453–1460. [Google Scholar] [CrossRef]
- Peters, A.; el Moctar, O. Numerical assessment of cavitation-induced erosion using a multi-scale Euler-Lagrange method. J. Fluid Mech. 2020, 894, A19. [Google Scholar] [CrossRef]
- Wang, X.-C.; Bai, X.-R.; Cheng, H.-Y.; Bin, J.; Peng, X.-X. Numerical investigation of how gap size influences tip leakage vortex cavitation inception using a Eulerian–Lagrangian method. Phys. Fluids 2023, 35, 012113. [Google Scholar] [CrossRef]
- Heinke, H.-J.; Kröger, W. Potsdam Propeller Test Case (PPTC)—Measurement of the Cavitation Nuclei in the Tunnel Water and Cavitation Observations with the Model Propeller VP1304; Report 3890; SVA: Potsdam, Germany, 2013. [Google Scholar]
- Gao, Z.; Wu, W.-X.; Wang, B. The effects of nanoscale nuclei on cavitation. J. Fluid Mech. 2021, 911, A20. [Google Scholar] [CrossRef]
- Kim, J.; Paterson, E.-G.; Stern, F.-S. RANS simulation of ducted marine propulsor flow including subvisual cavitation and acoustic modeling. J. Fluid. Eng. 2006, 128, 799–810. [Google Scholar] [CrossRef]
- Han, B.-Y.; Xiong, Y.; Ye, J.-M. Prediction of tip-vortex cavitation inception. J. Nav. Univ. Eng. 2011, 23, 27–32. [Google Scholar]
- Ling, S.-C.; Gowing, S.; Shen, Y.-T. The role of microbubbles on cavitation inception on head form. In Proceedings of the Fourteenth Symposium on Naval Hydrodynamics, Ann Arbor, MI, USA, 23–27 August 1982. [Google Scholar]
Disclaimer/Publisher’s Note: The statements, opinions and data contained in all publications are solely those of the individual author(s) and contributor(s) and not of MDPI and/or the editor(s). MDPI and/or the editor(s) disclaim responsibility for any injury to people or property resulting from any ideas, methods, instructions or products referred to in the content. |
© 2024 by the authors. Licensee MDPI, Basel, Switzerland. This article is an open access article distributed under the terms and conditions of the Creative Commons Attribution (CC BY) license (https://creativecommons.org/licenses/by/4.0/).