

Elderly Fall Detection in Complex Environment Based on Improved YOLOv5s and LSTM


Abstract
1. Introduction
2. Related Works
2.1. Fall Detection Based on Sensors
2.2. Fall Detection Based on Video
2.3. Fall Detection Based on WiFi Signals
- (1)
- When the monitoring target is visible, the camera can capture an image of the target. Then, an improved YOLOv5s model is adopted to process the image data and detect the target posture. The following improvements to the YOLOv5s model are made:
- Firstly, adaptive picture scaling technology (Letterbox) is introduced from YOLOv5s to process the images and improve the detection effect.
- Secondly, we add the SE and CA attention mechanisms to the YOLOv5s model Backbone network, and change their activation functions to make the model pays more attention to the detected target and improve the model’s understanding of the input data’s spatial structure.
- Finally, we introduce the BiFPN from the YOLOv5s model Neck network to fuse the information of feature maps of different scales and strengthen the feature information.
- (2)
- When the monitoring target is invisible, the camera cannot capture an image of the target. At this time, an improved LSTM model is adopted to process the collected CSI data and output the target posture. The following improvements to the LSTM model are made:
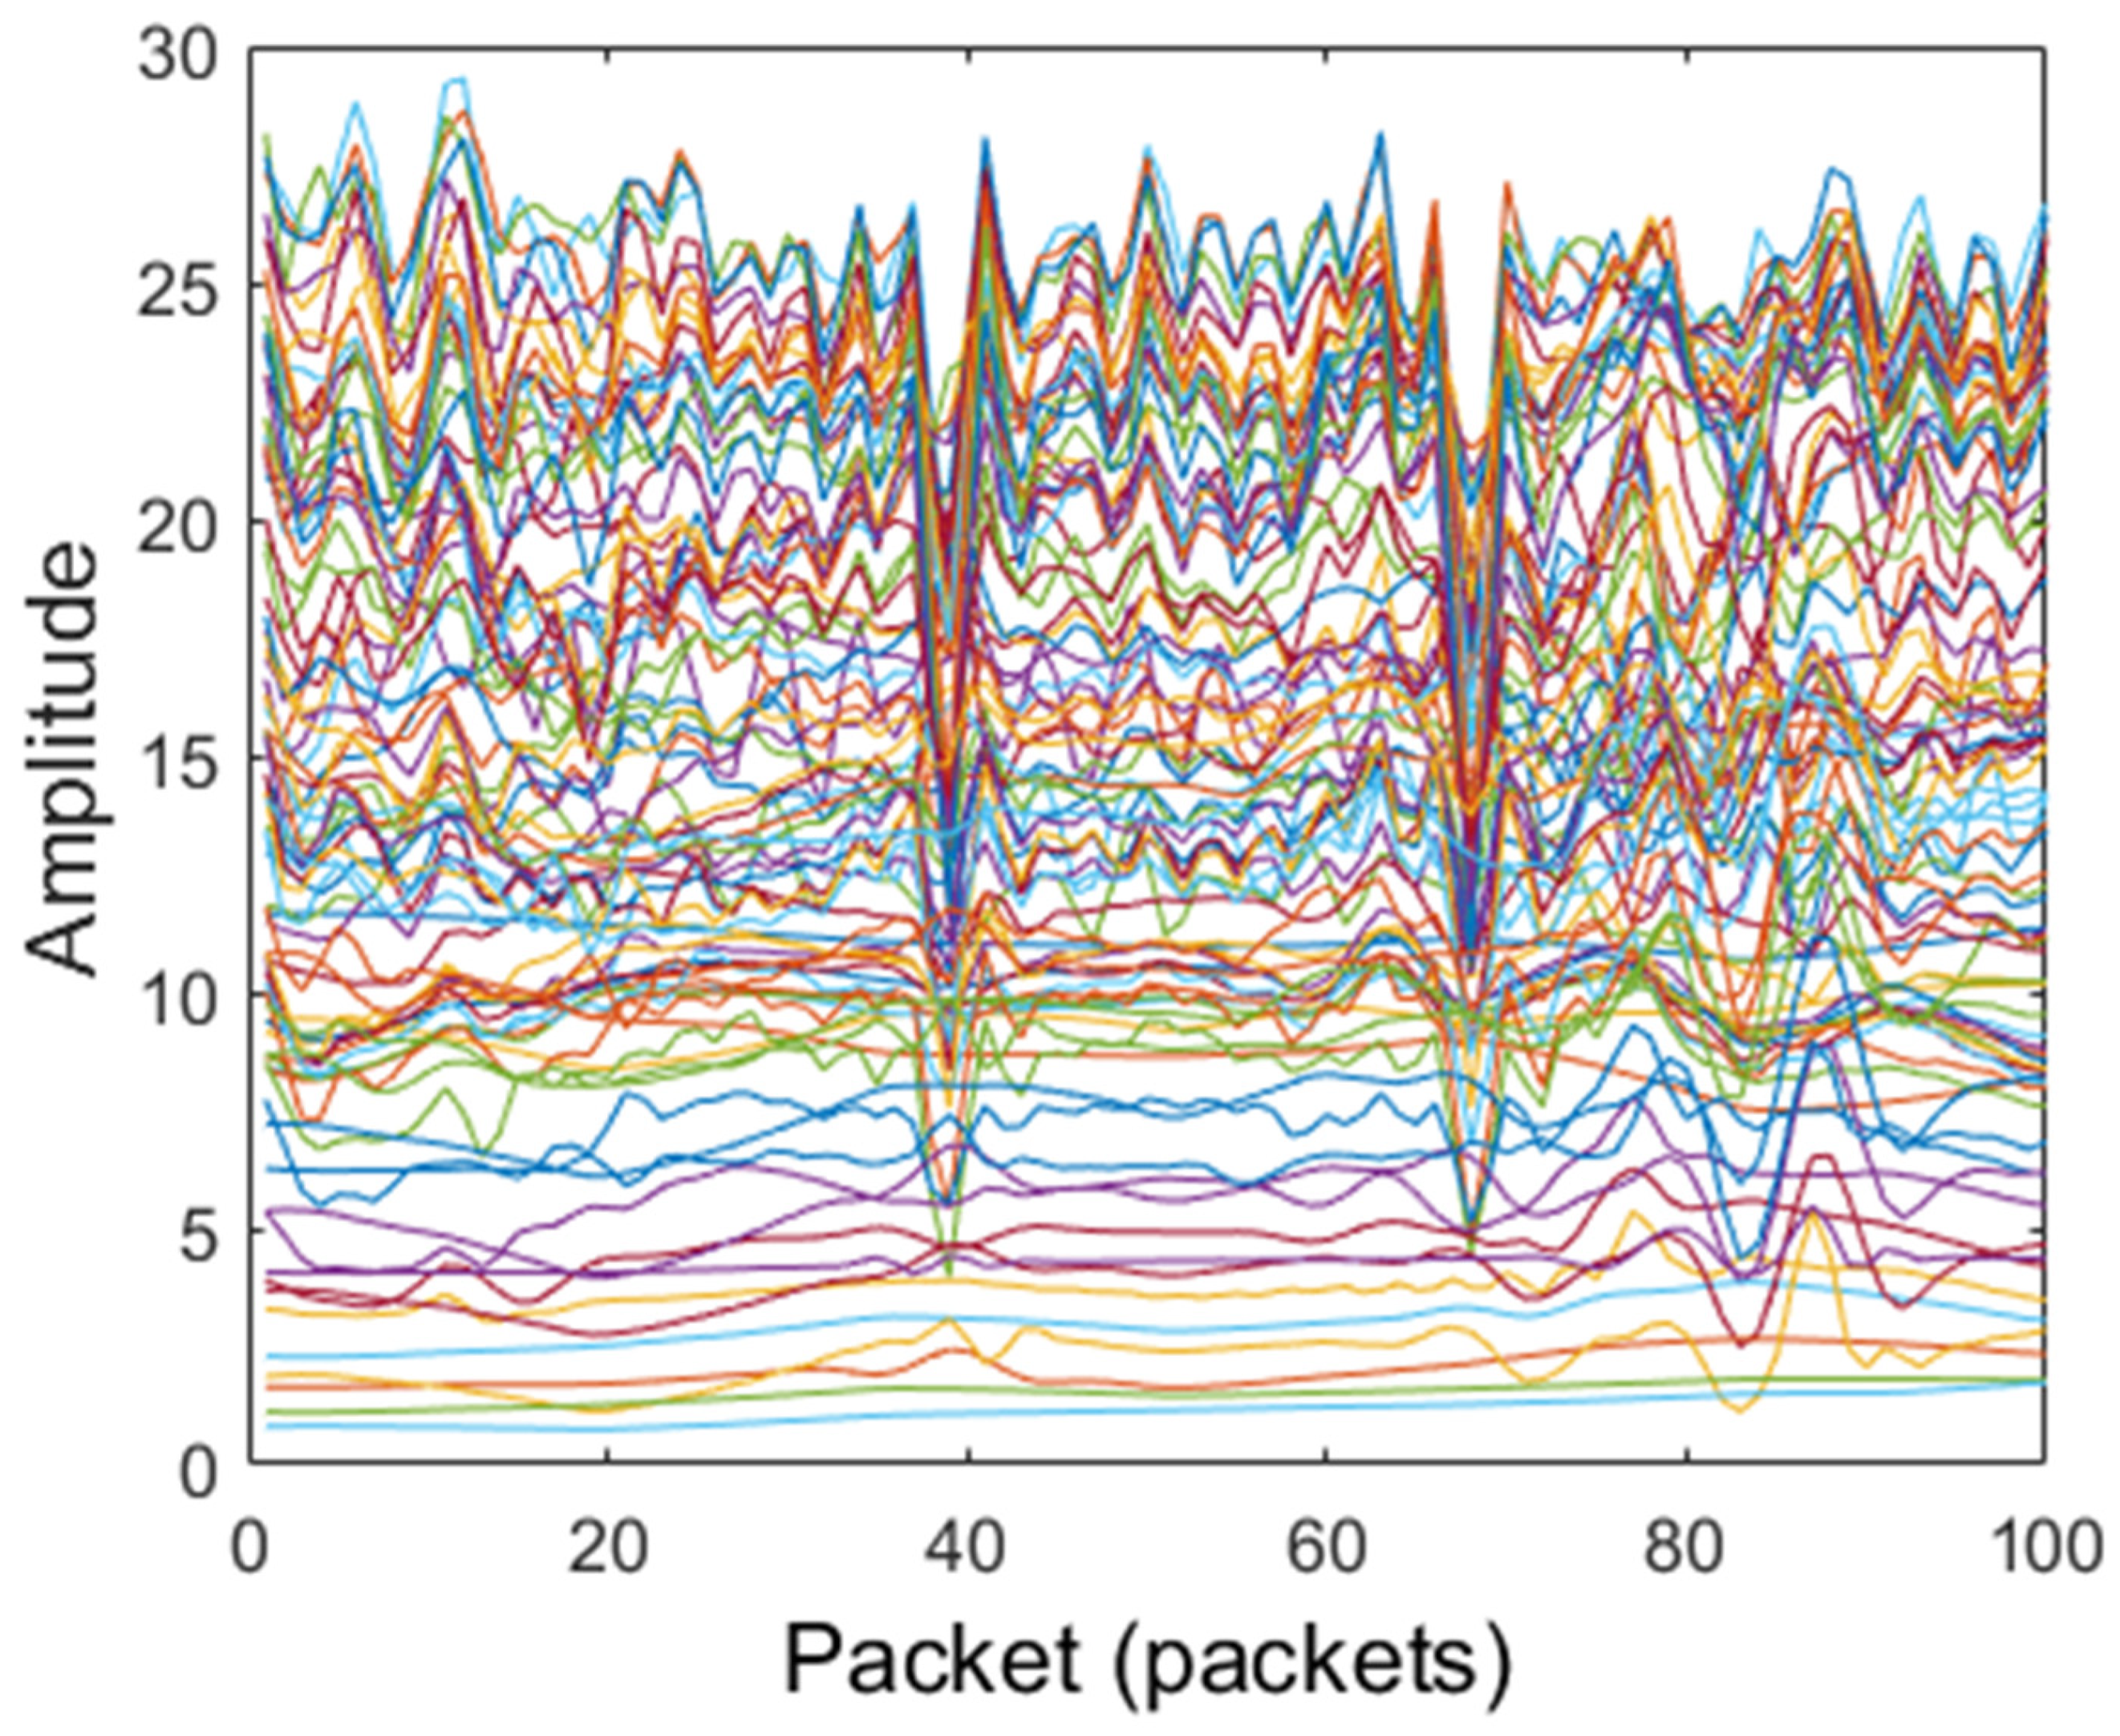
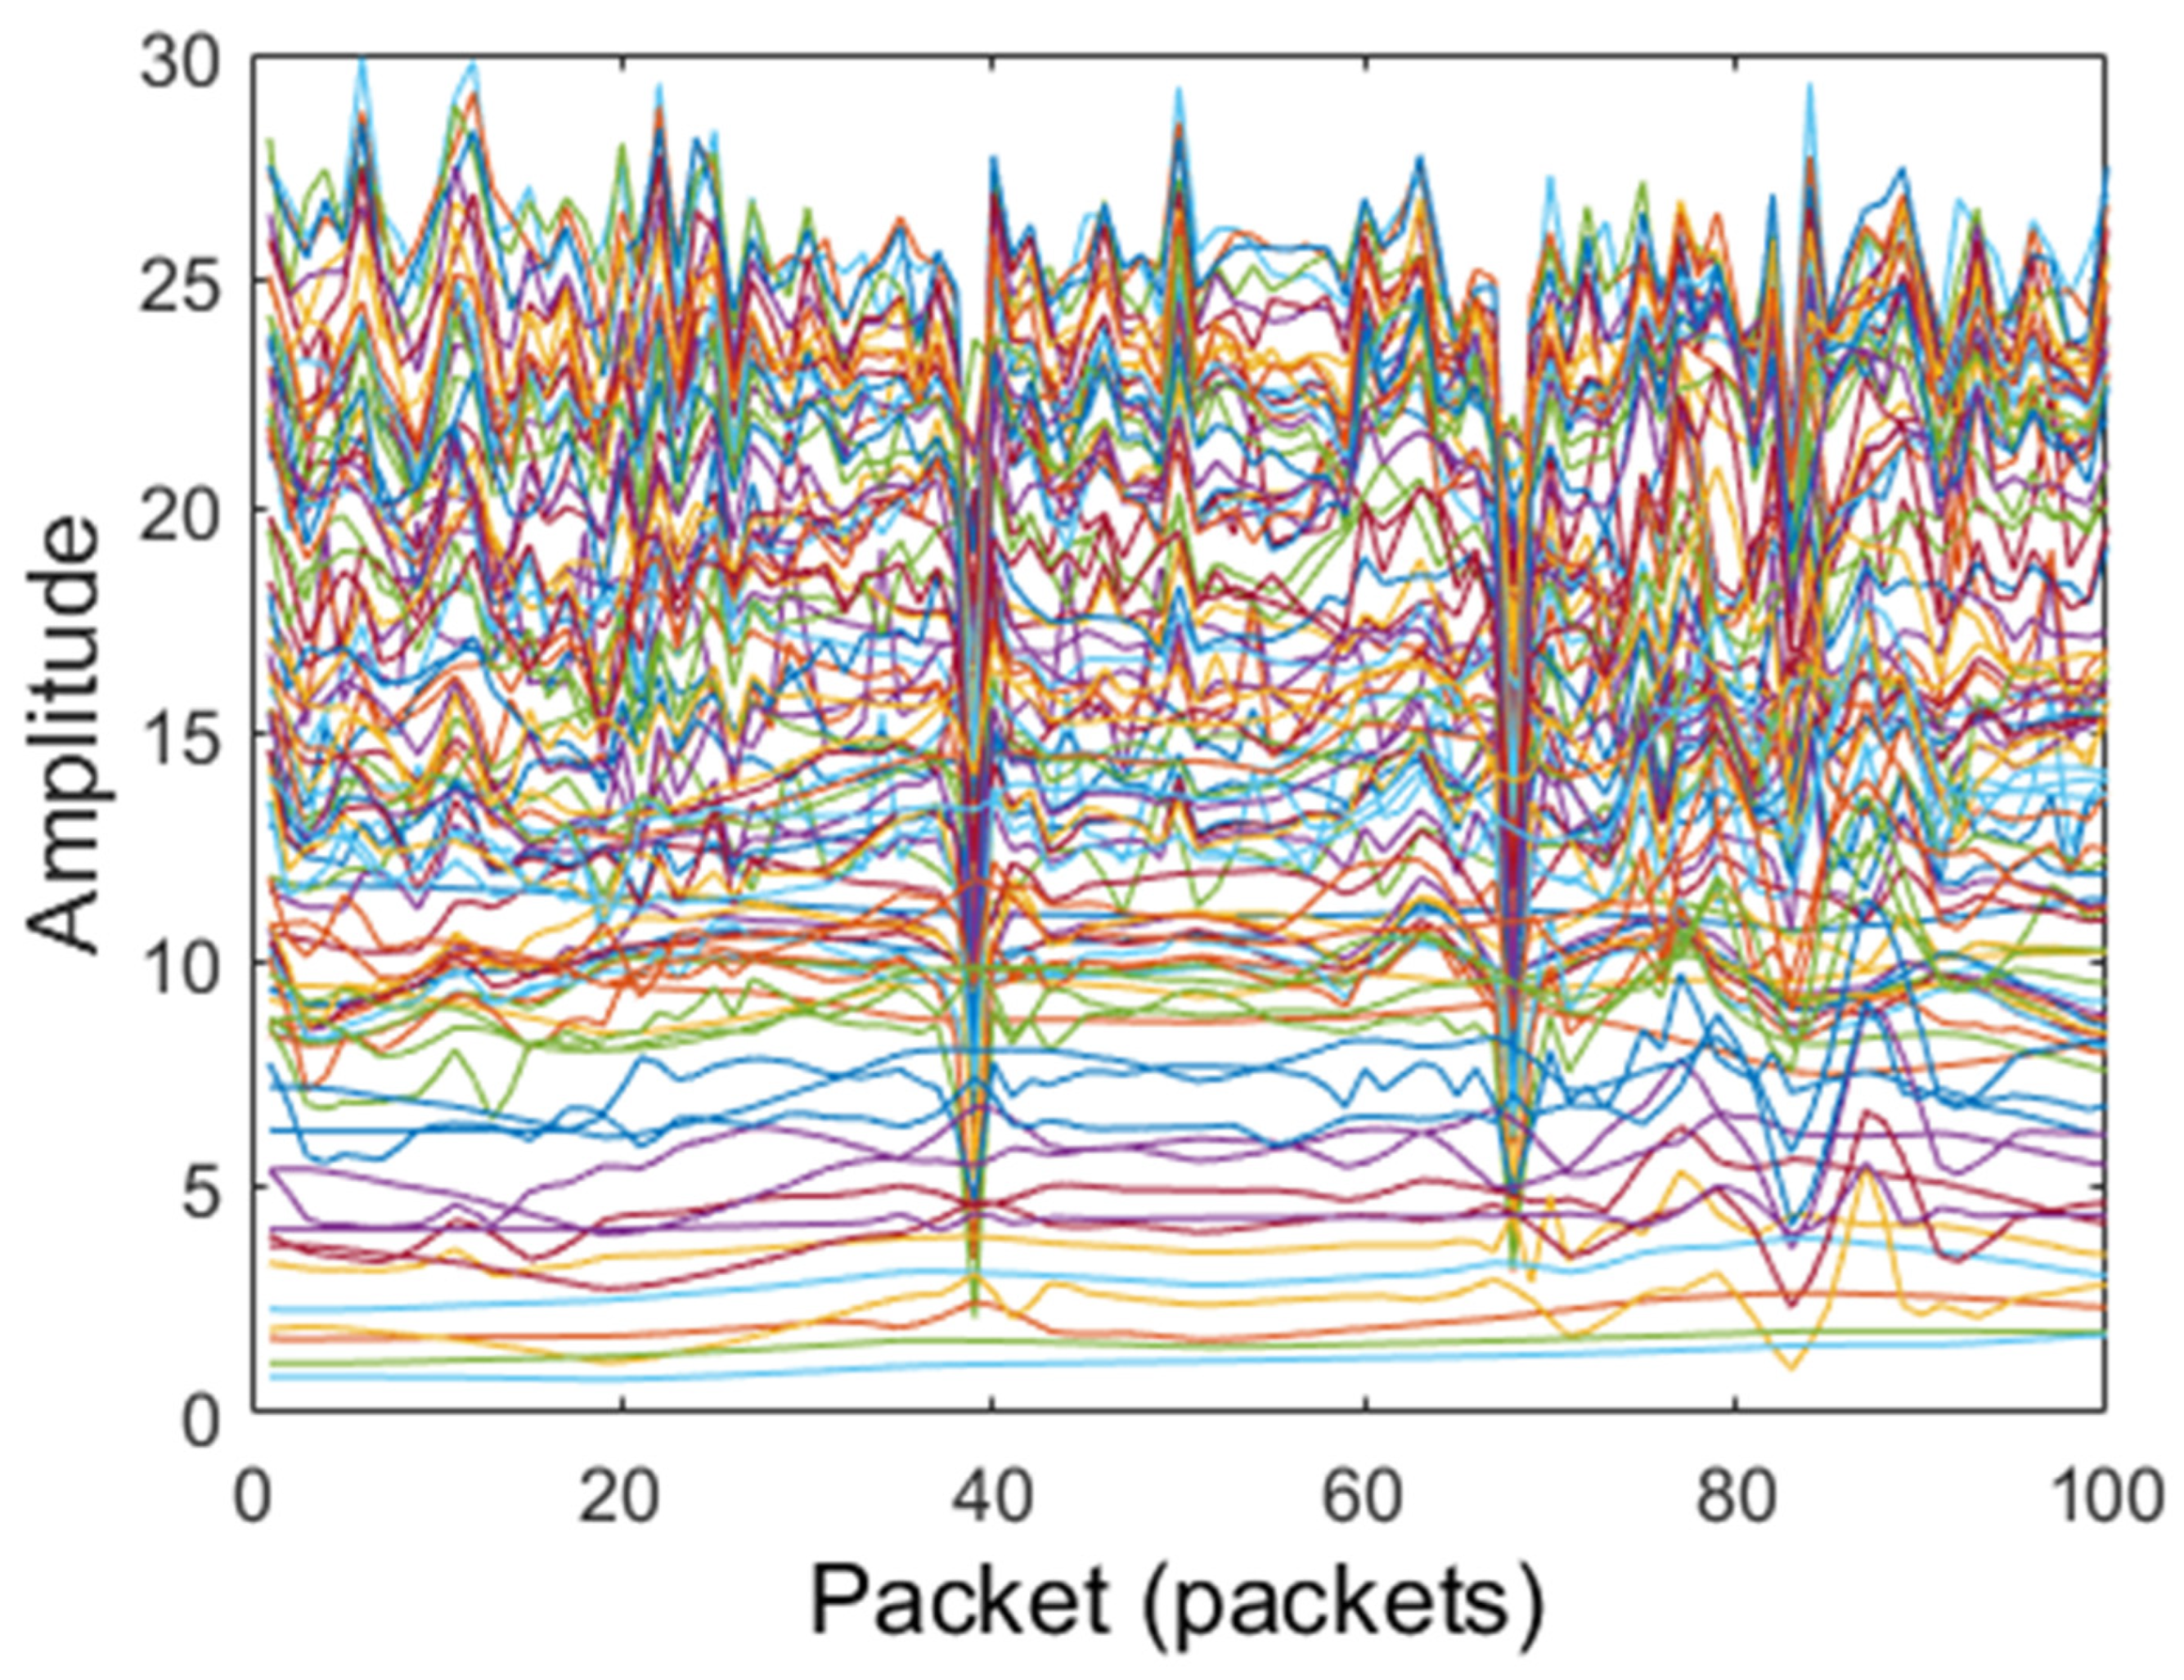
- CSI data noise is eliminated by using the Hampel filter.
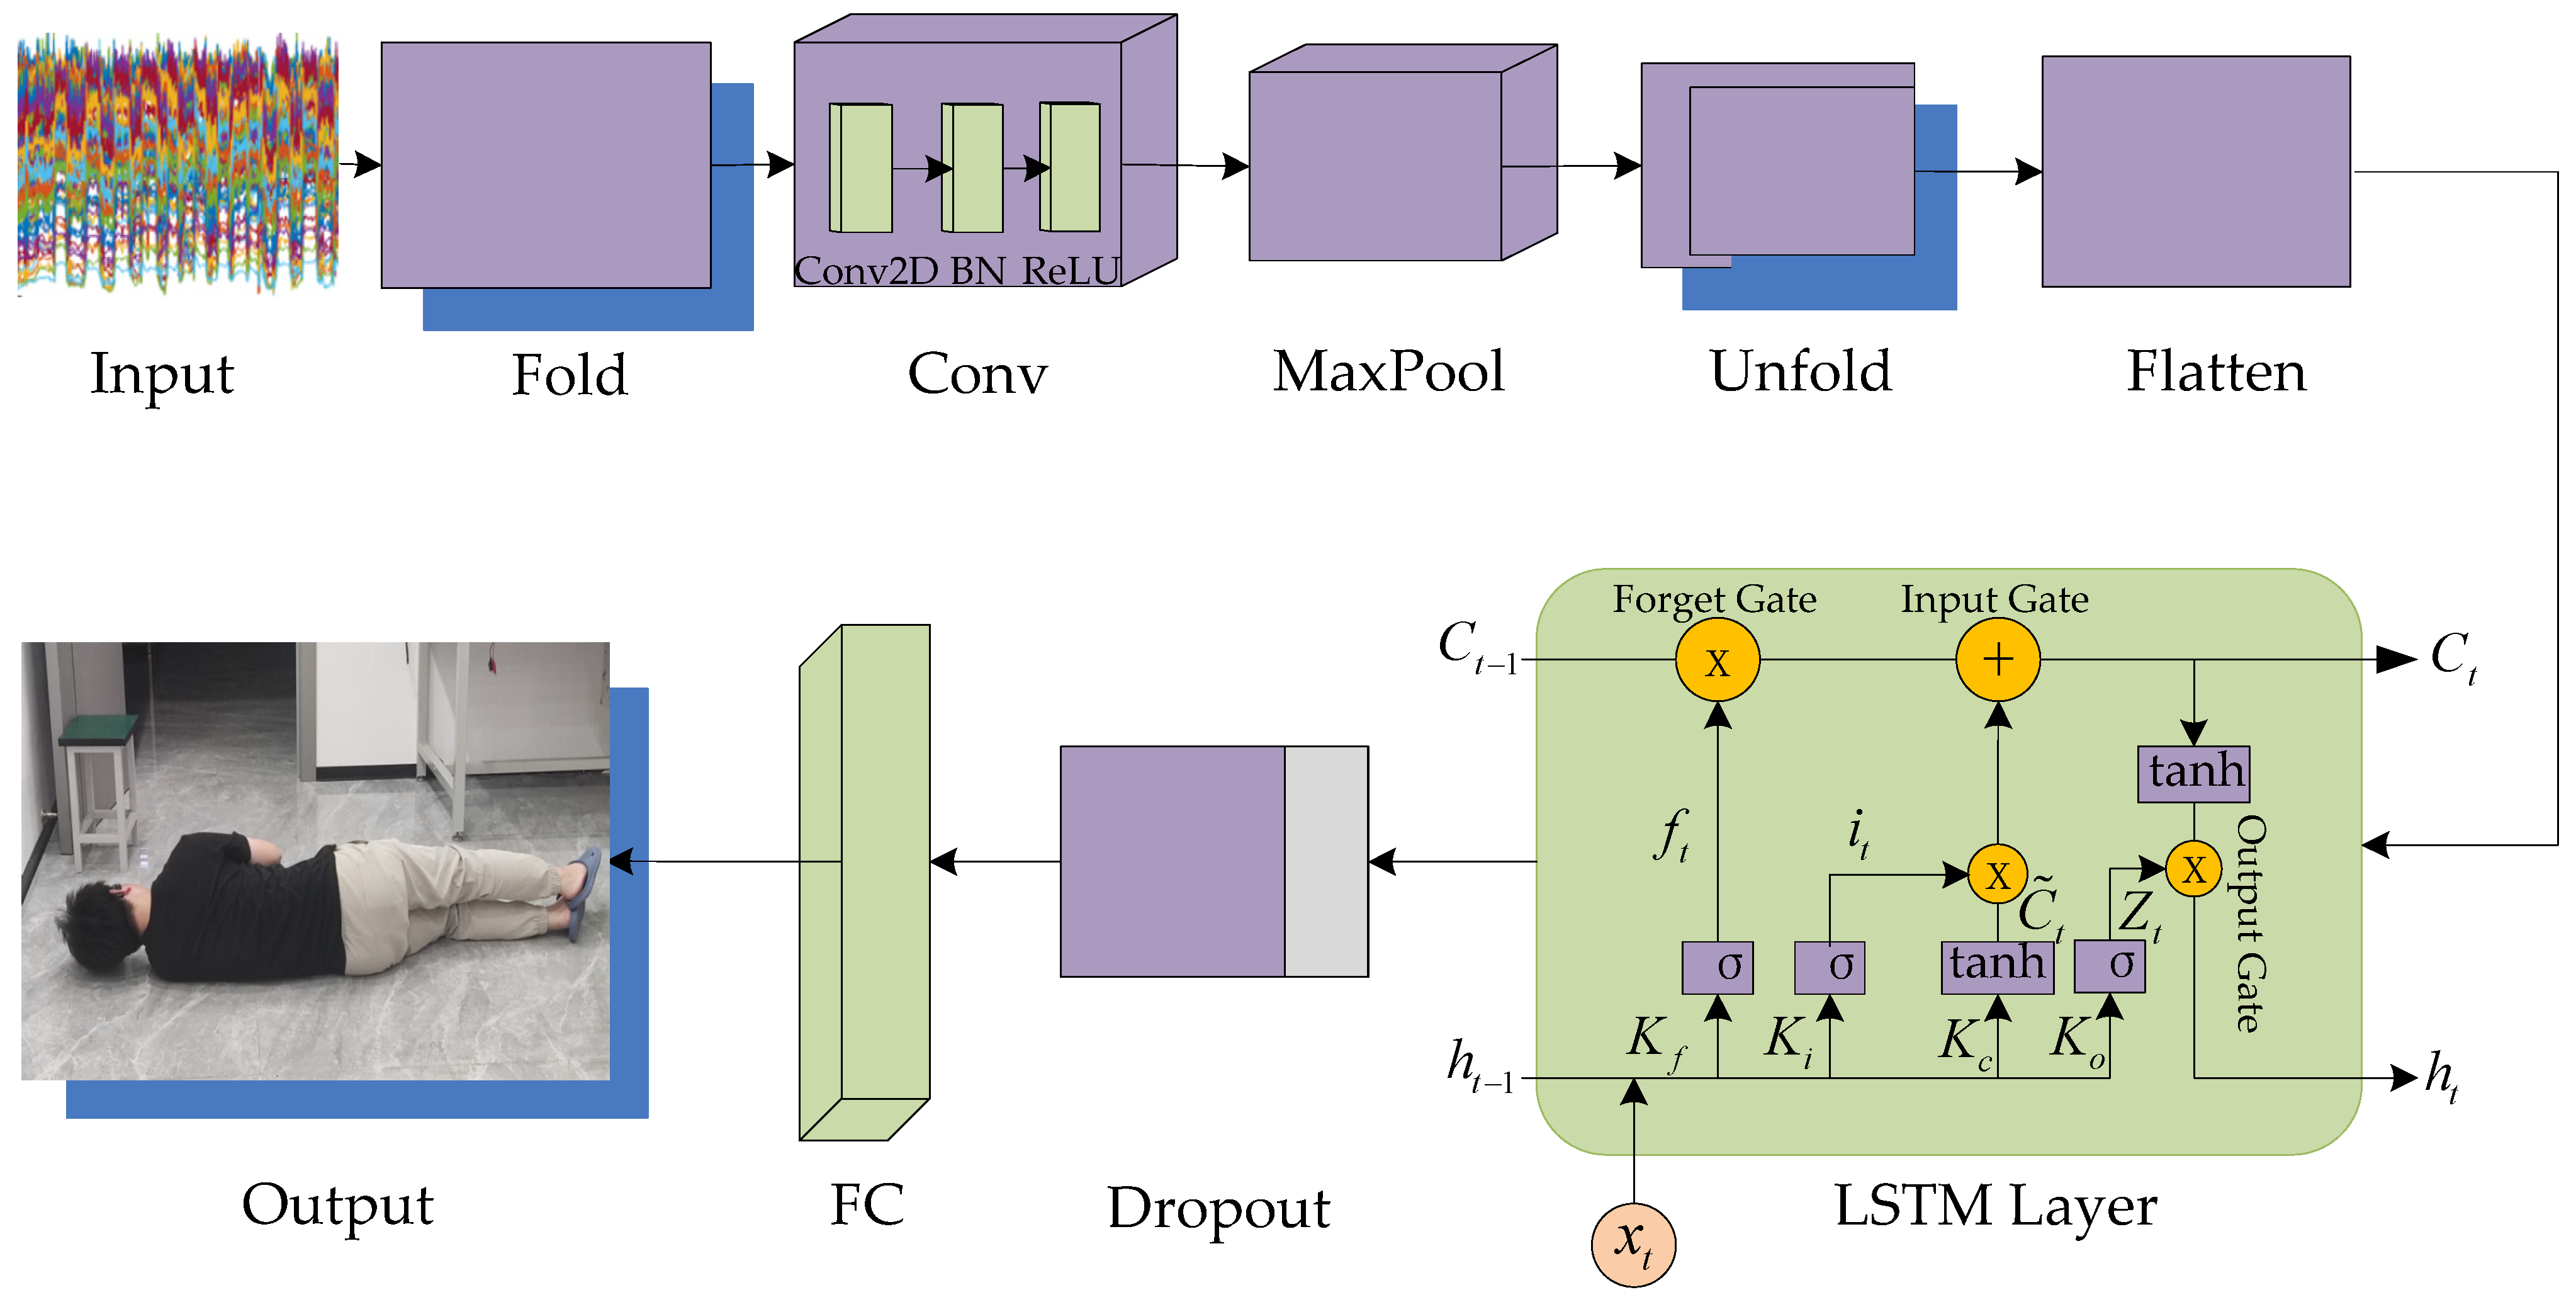
- This paper first combines the CNN model with the short-duration memory neural network architecture of LSTM to improve the LSTM model’s prediction accuracy and reduce the algorithm’s complexity.
- The improved LSTM model’s object is changed to amplitude analysis of 90 CSI signals in the dataset, and the model’s output is changed to the result of determine the corresponding signal’s target posture.
- (3)
- When the target is detected as a fall posture by the improved YOLOv5s or improved LSTM model, a discriminator is designed to improve the accuracy of judgment, which combines the detected result from the models with the physiological data of the target to deliver the final target posture.
- The proposed dual fall detection model can detect the target’s posture whether it is visible or not, simultaneously solving the problem of fall detection in different scenarios.
- A small-scale database suitable for the home environment is established, and YOLOv5s, the most lightweight of the YOLOv5 series, is improved and applied to human fall detection in a home environment, improving detection accuracy and reducing the detection system’s complexity.
- The CNN model and LSTM neural network architecture are combined to process images from CSI human posture data, capturing long-term dependencies in sequence data and effectively extracting local CSI data features, providing a more accurate and stable fall detection model.
- Image data, CSI data, and target physiological data are combined to further improve the fall judgment accuracy and detect the target’s health status in real time, providing elderly people with a healthy and comfortable living environment.
3. Fall Detection Based on the Improved YOLOv5s
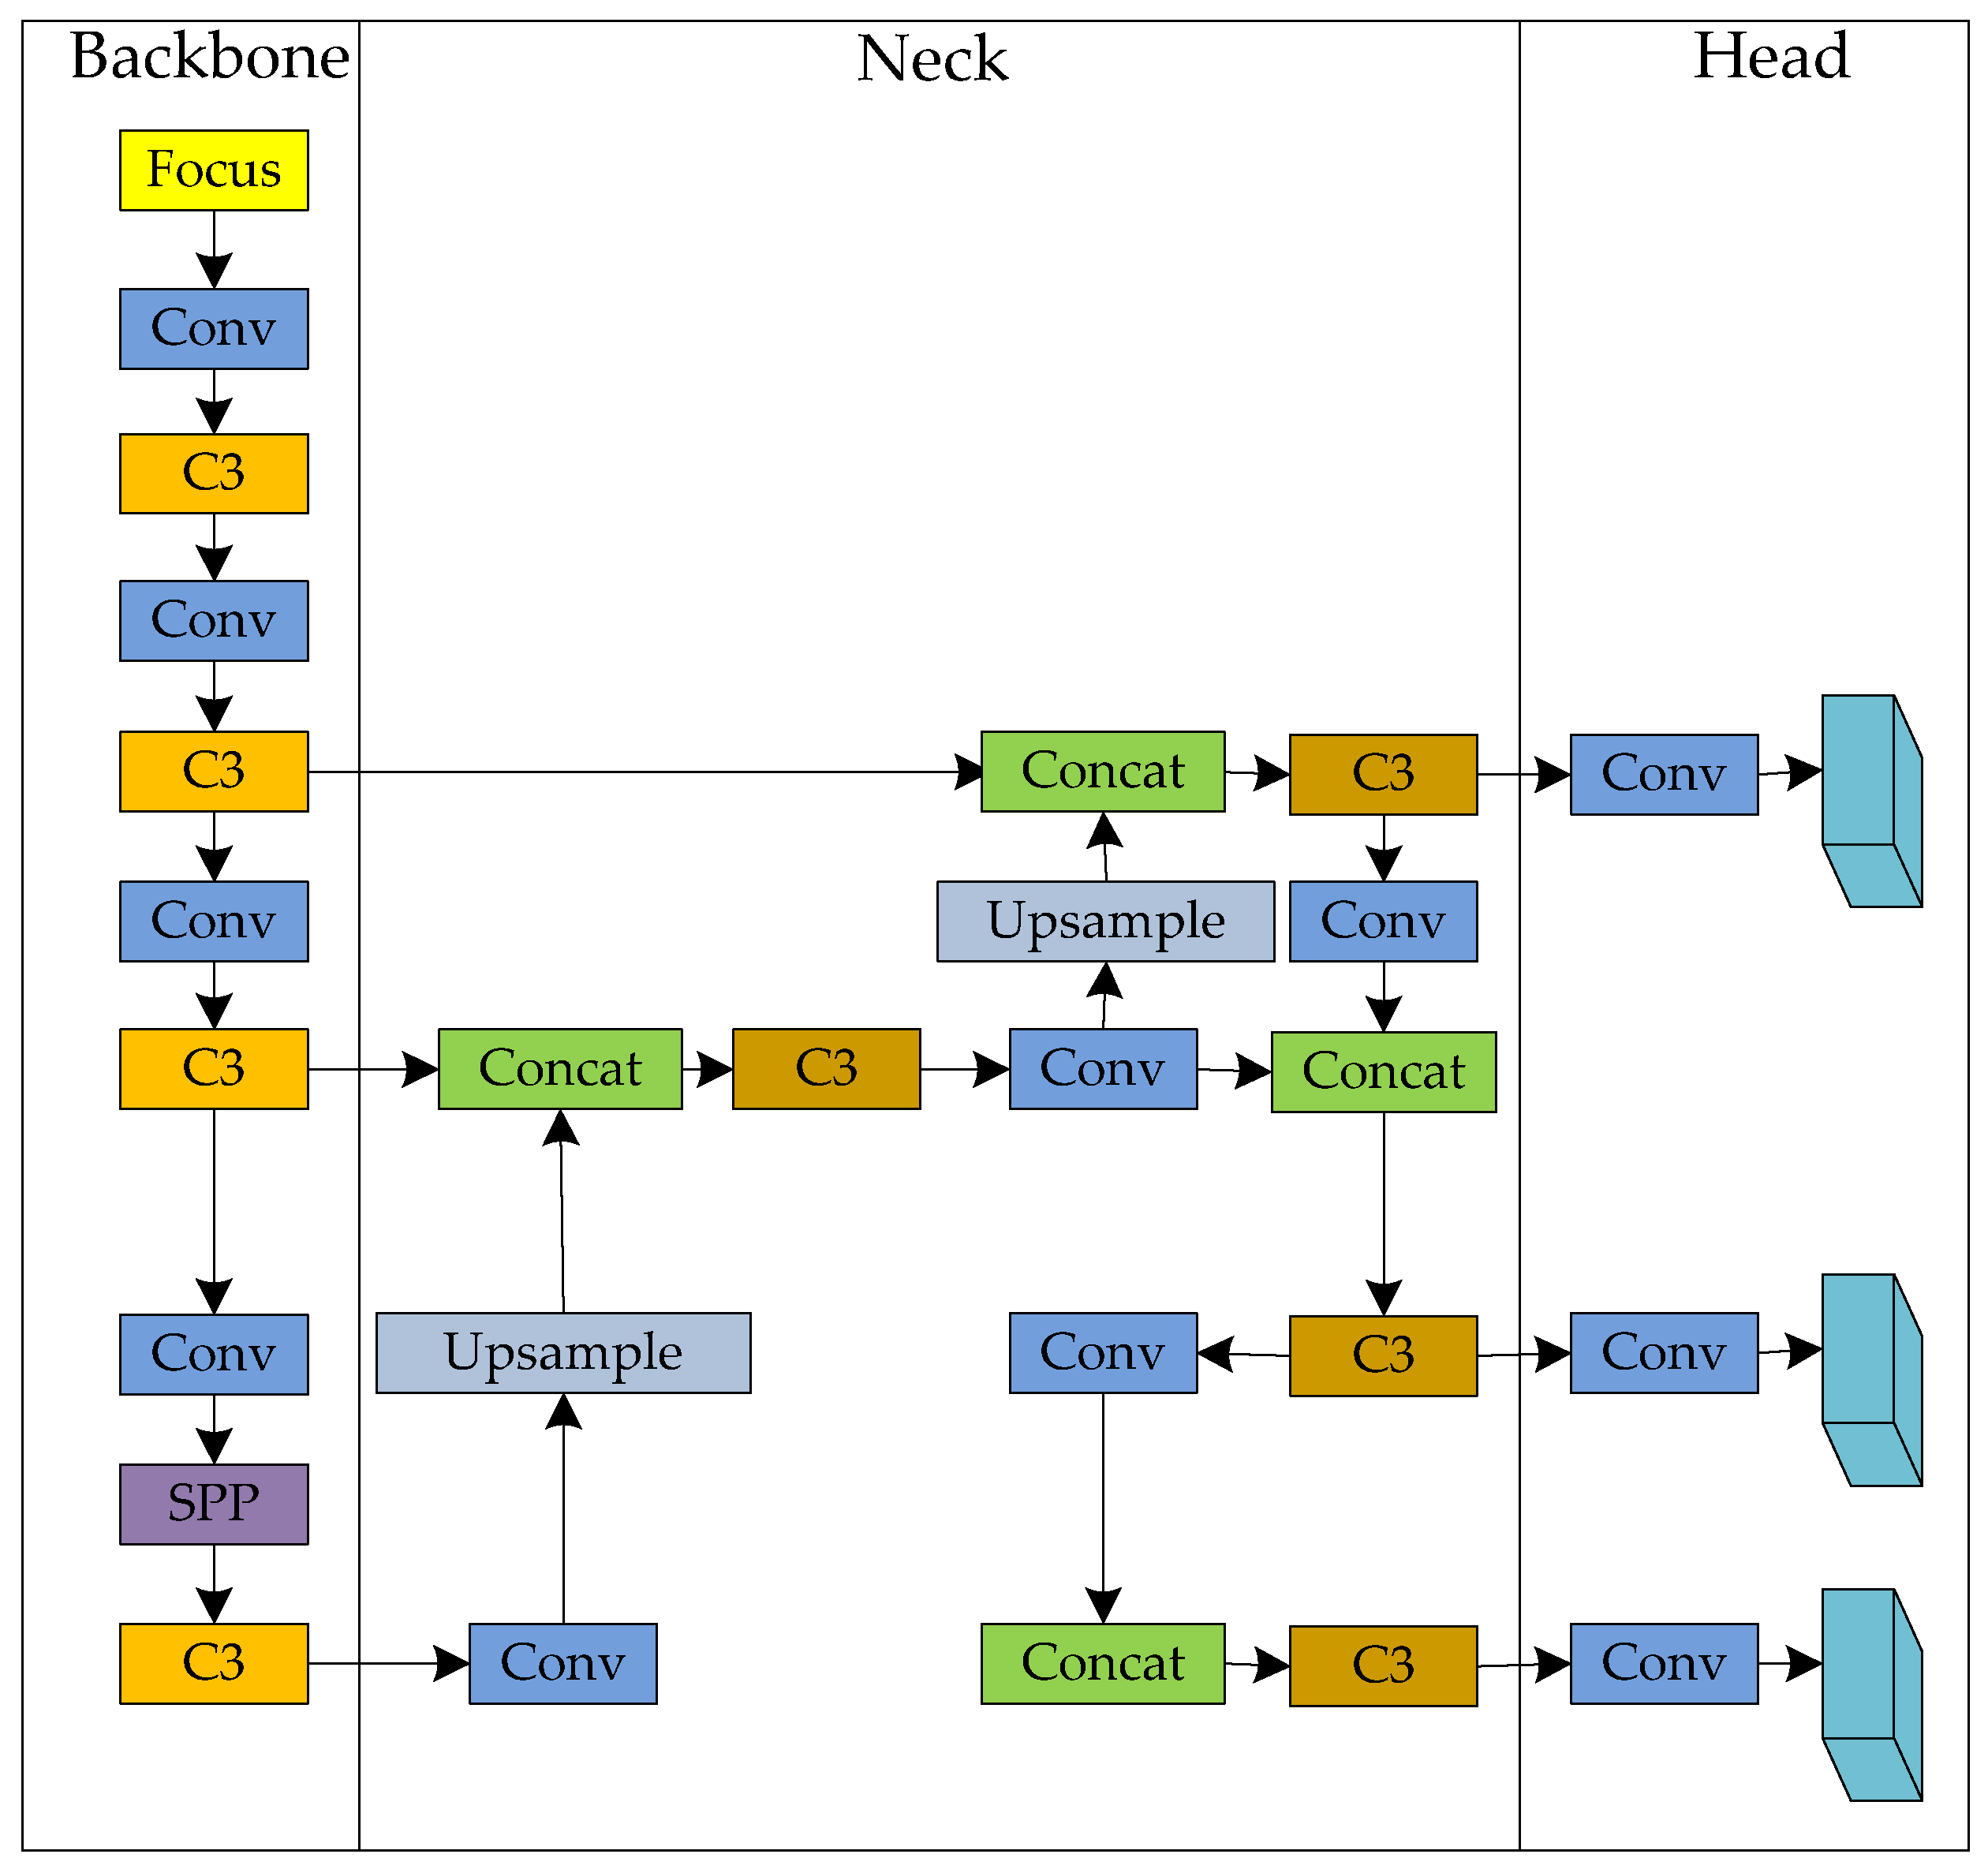
3.1. Introduction of the YOLOv5s Model
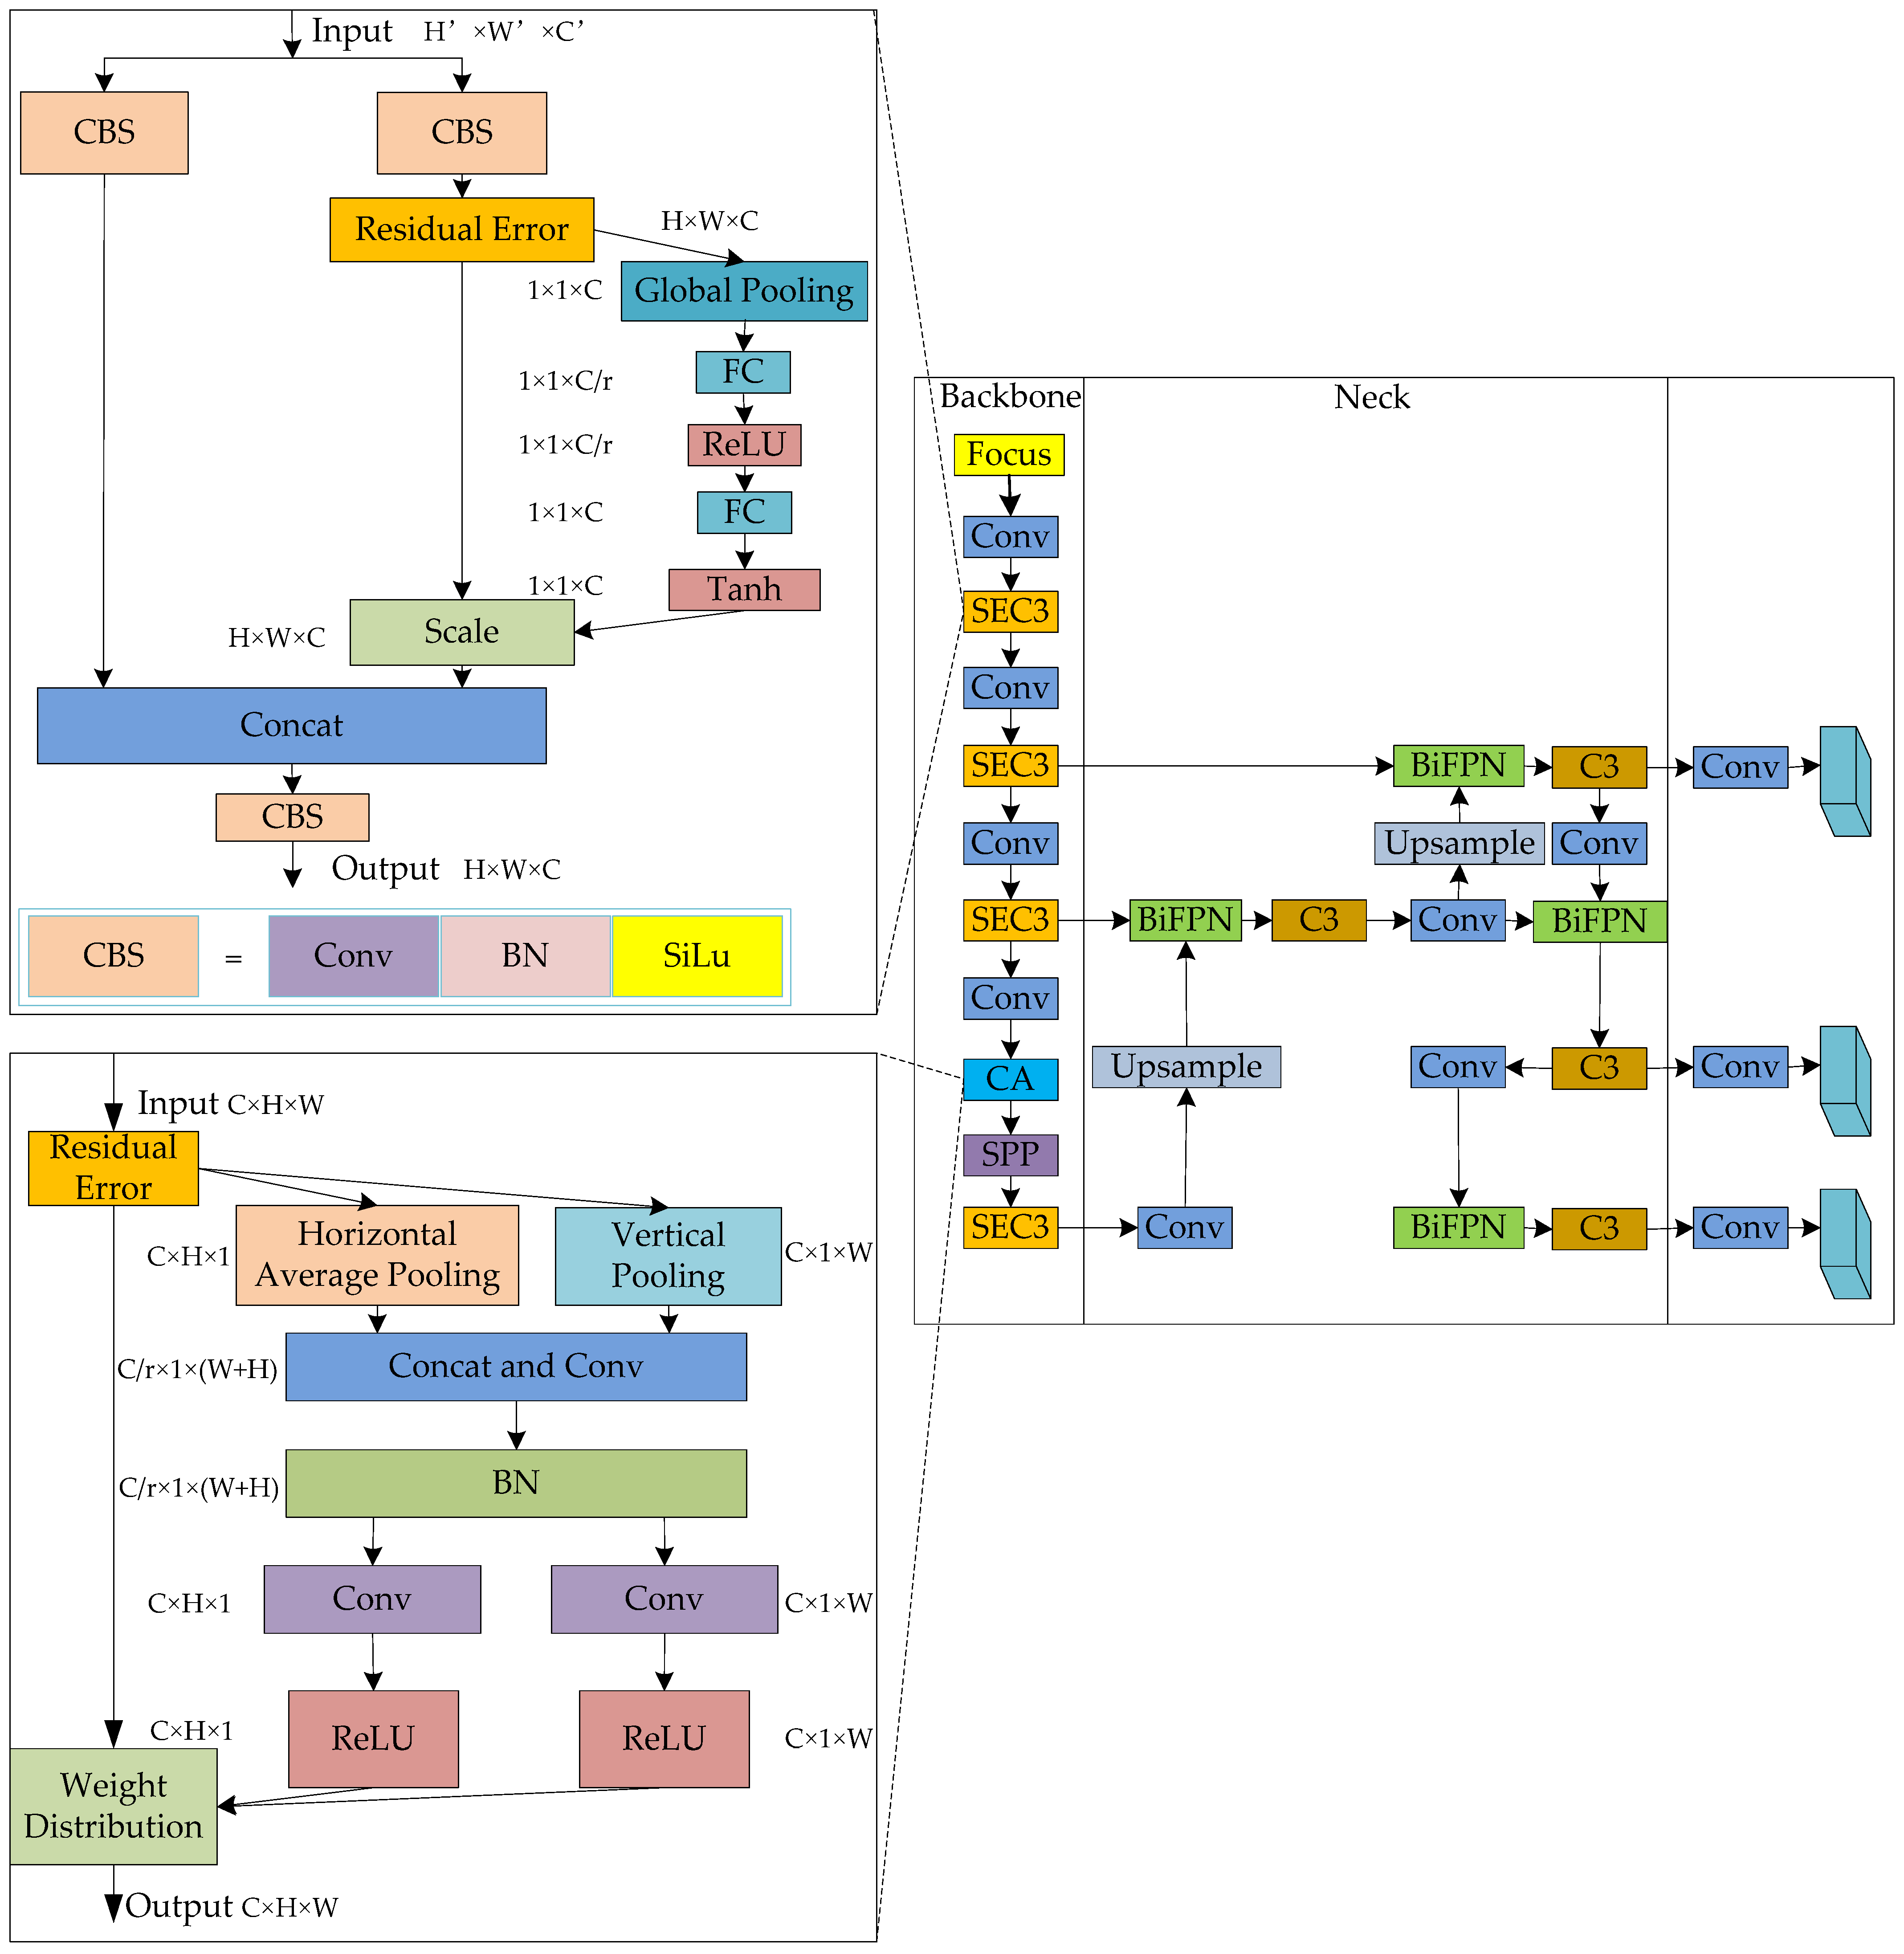
3.2. Improved YOLOv5s Model
3.2.1. Letterbox
3.2.2. Attention Mechanism
- SE and Tanh activation function are introduced
- 2.
- CA attention module and ReLu activation function are introduced
- 3.
- BiFPN module and SiLU activation function are introduced
4. Fall Detection with WiFi Signal Based on LSTM Model
4.1. The Sensing of WiFi Signal
4.2. Fall Prediction Principle Based on WiFi Signal
4.3. CSI Data Acquisition
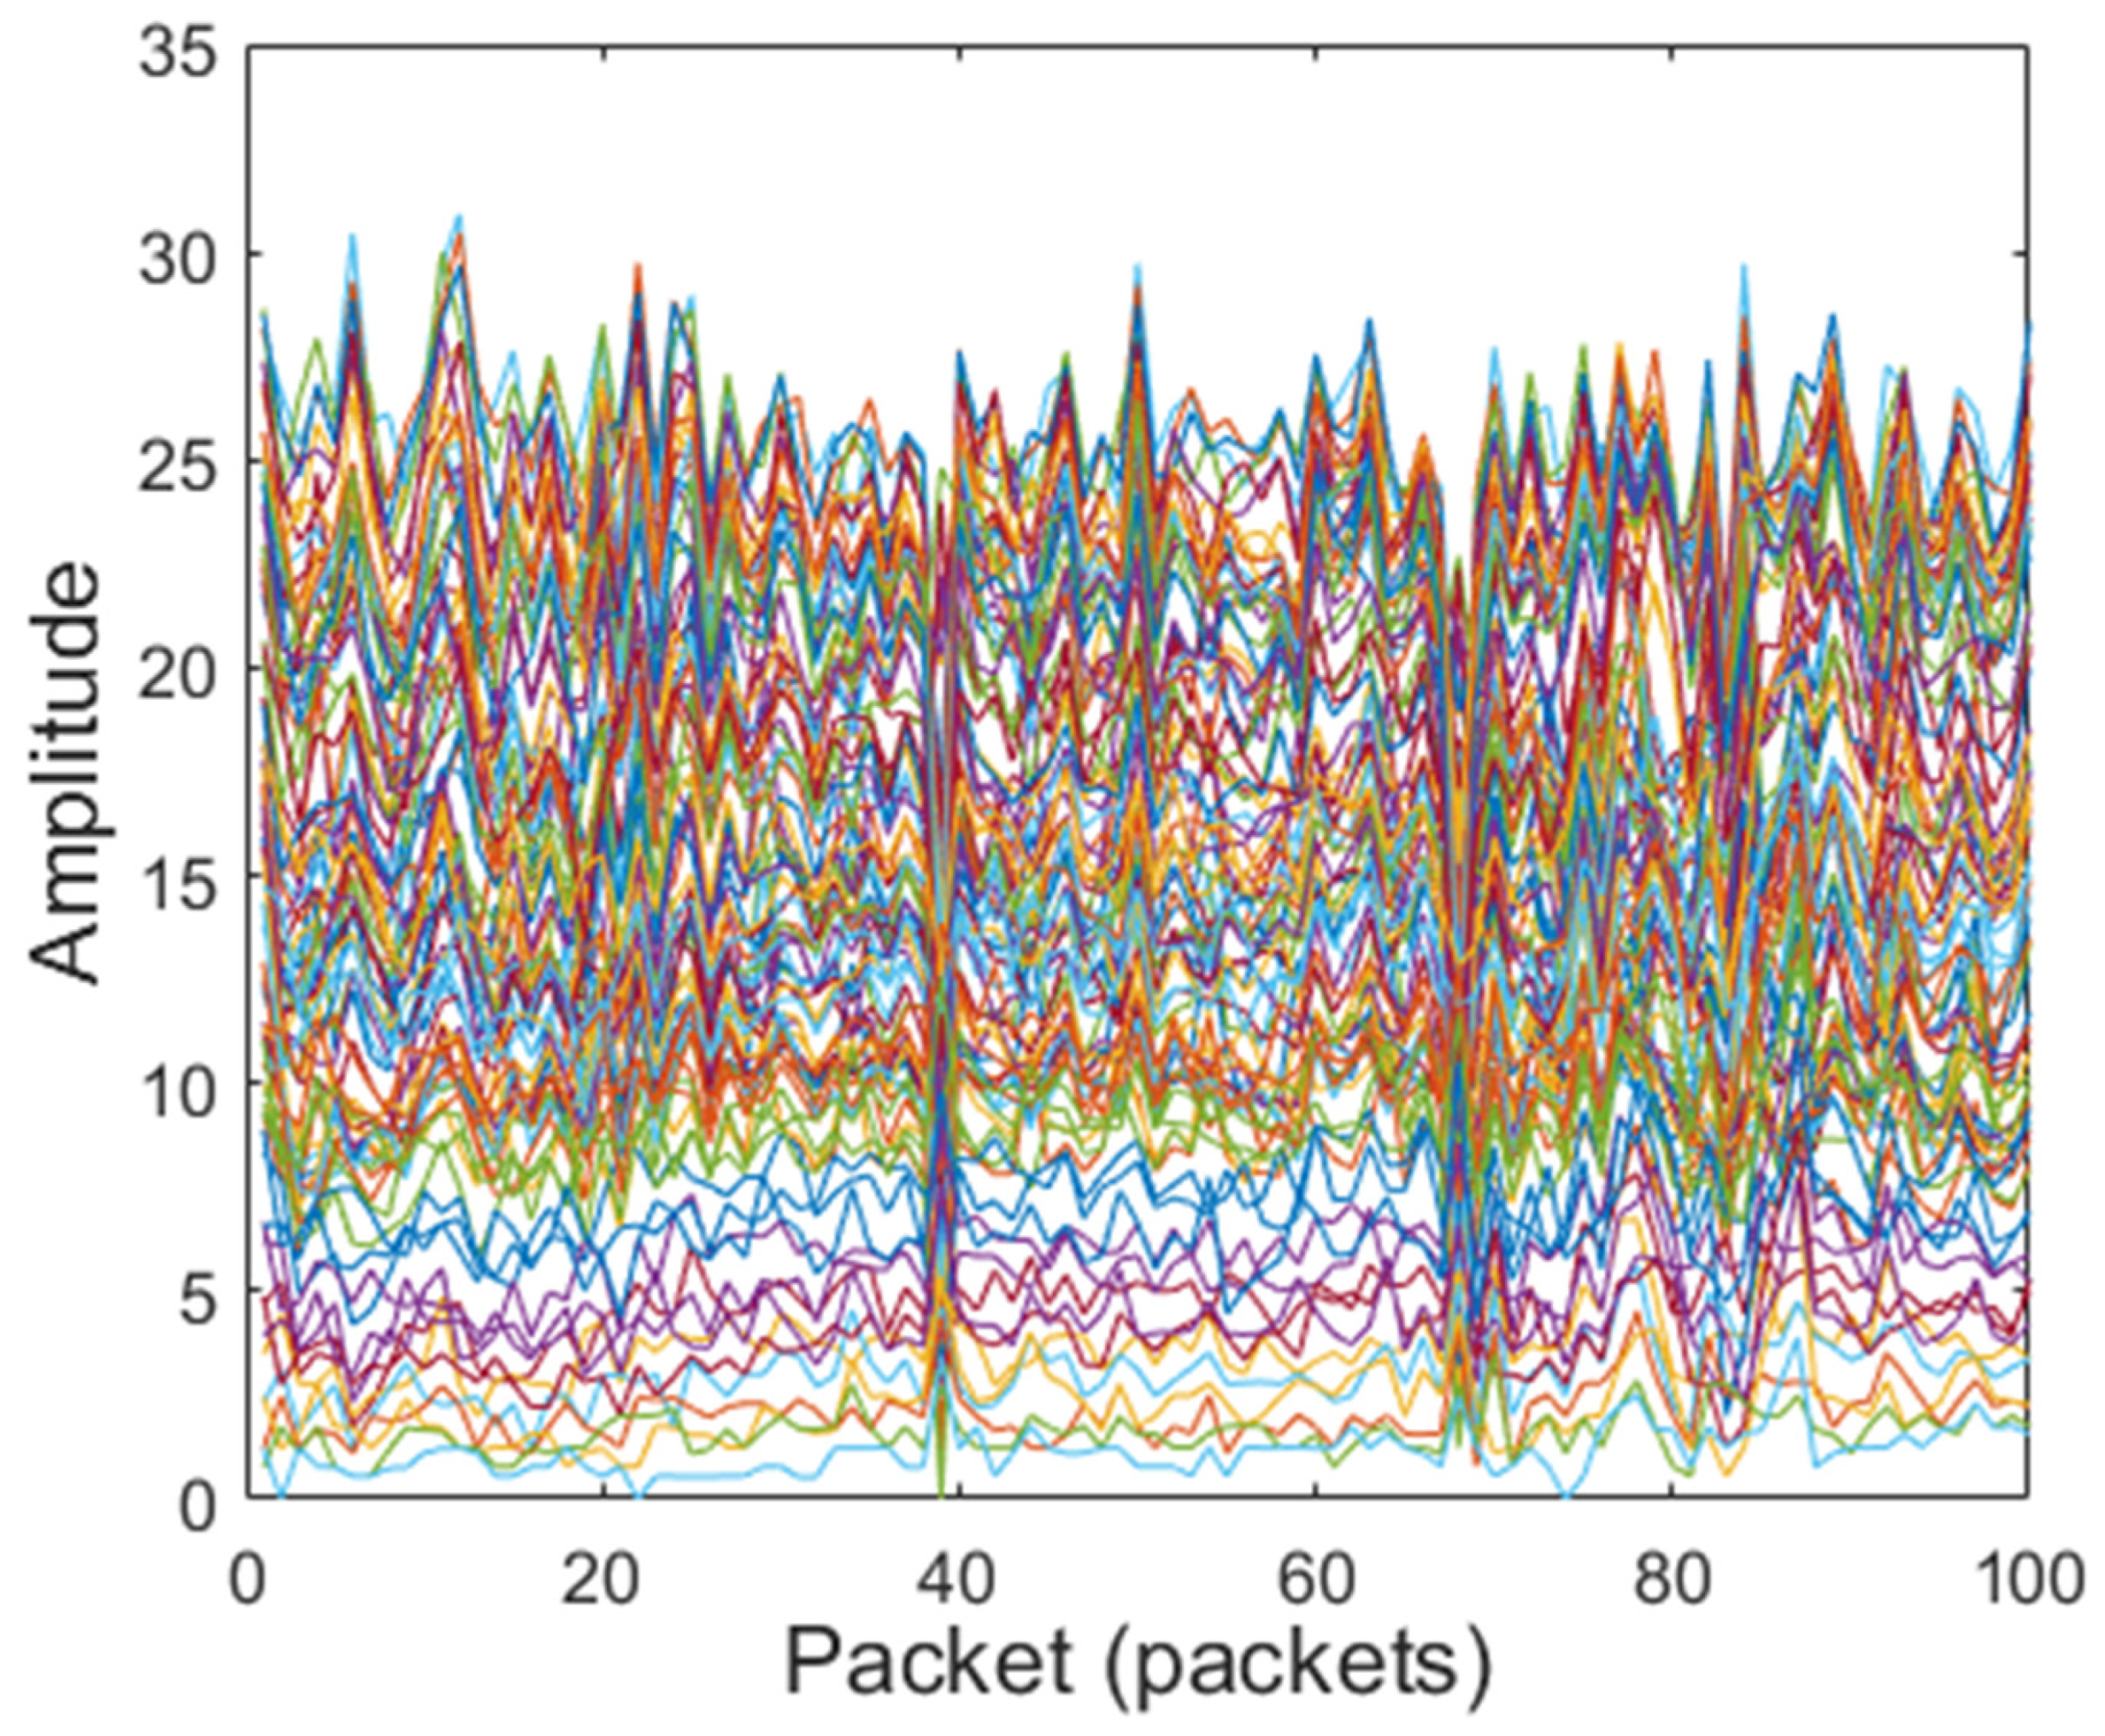
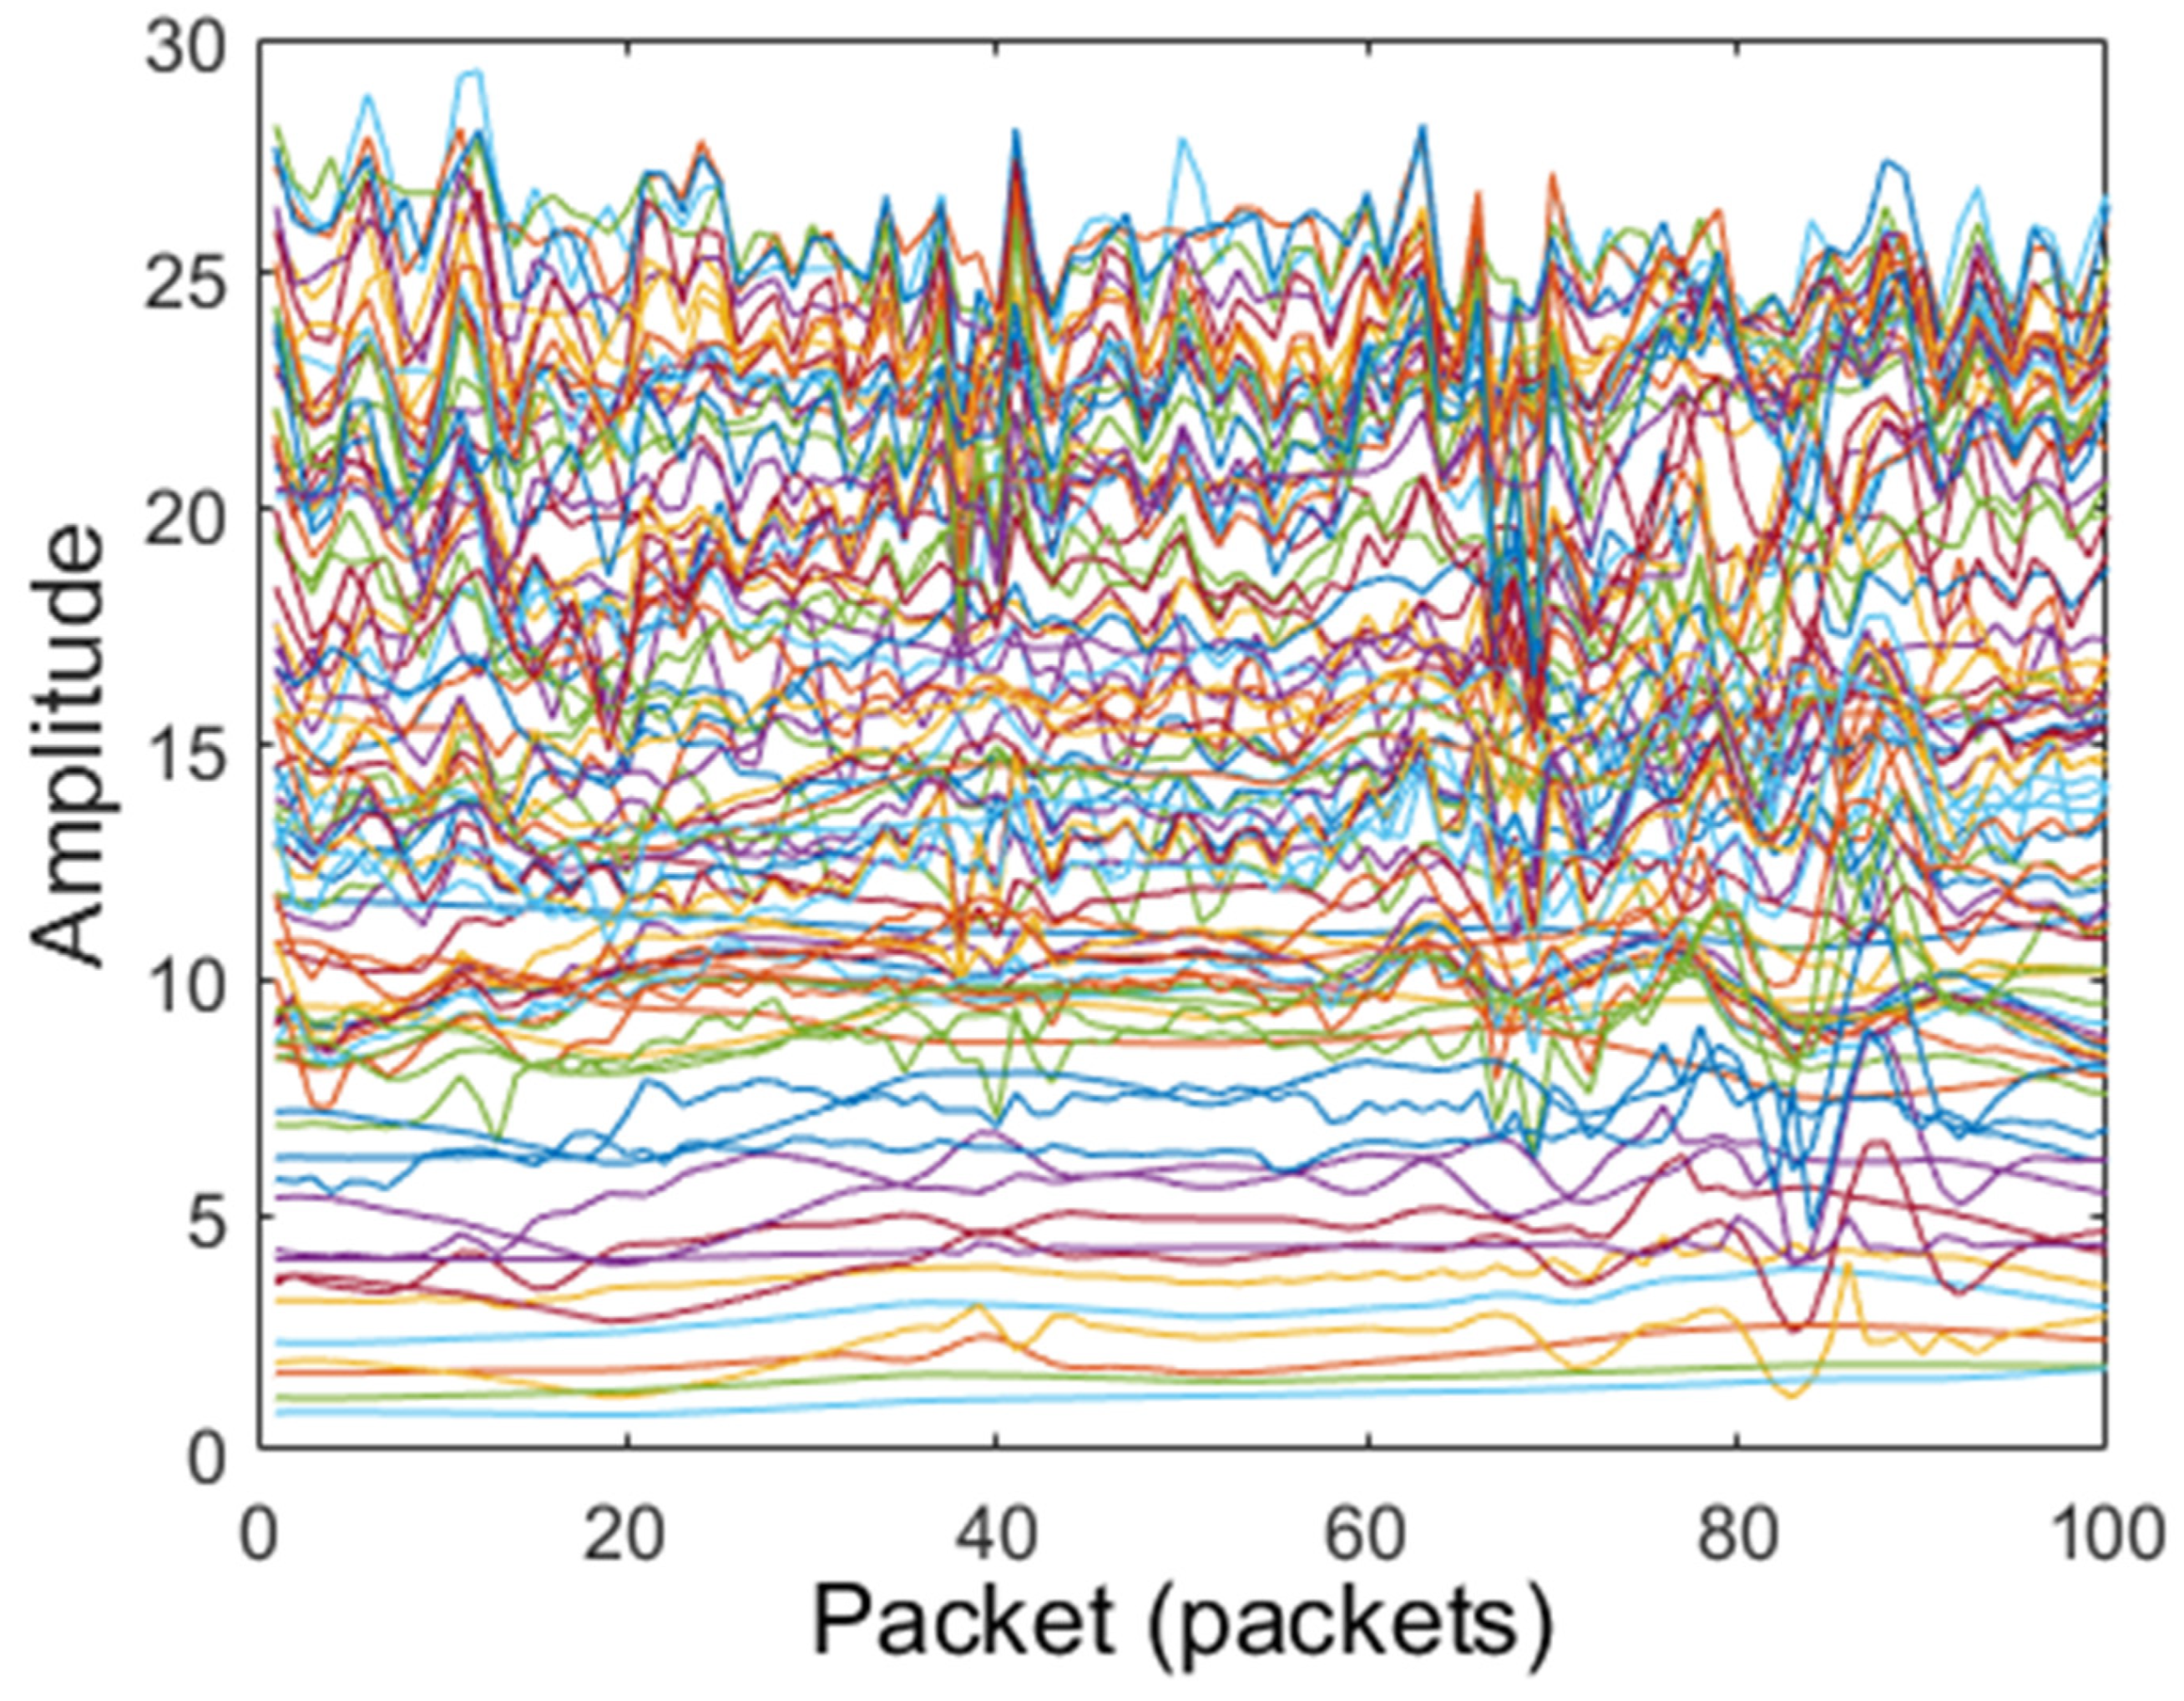
4.4. CSI Data Preprocessing
4.5. Fall Detection
4.5.1. Selection of Detection Model
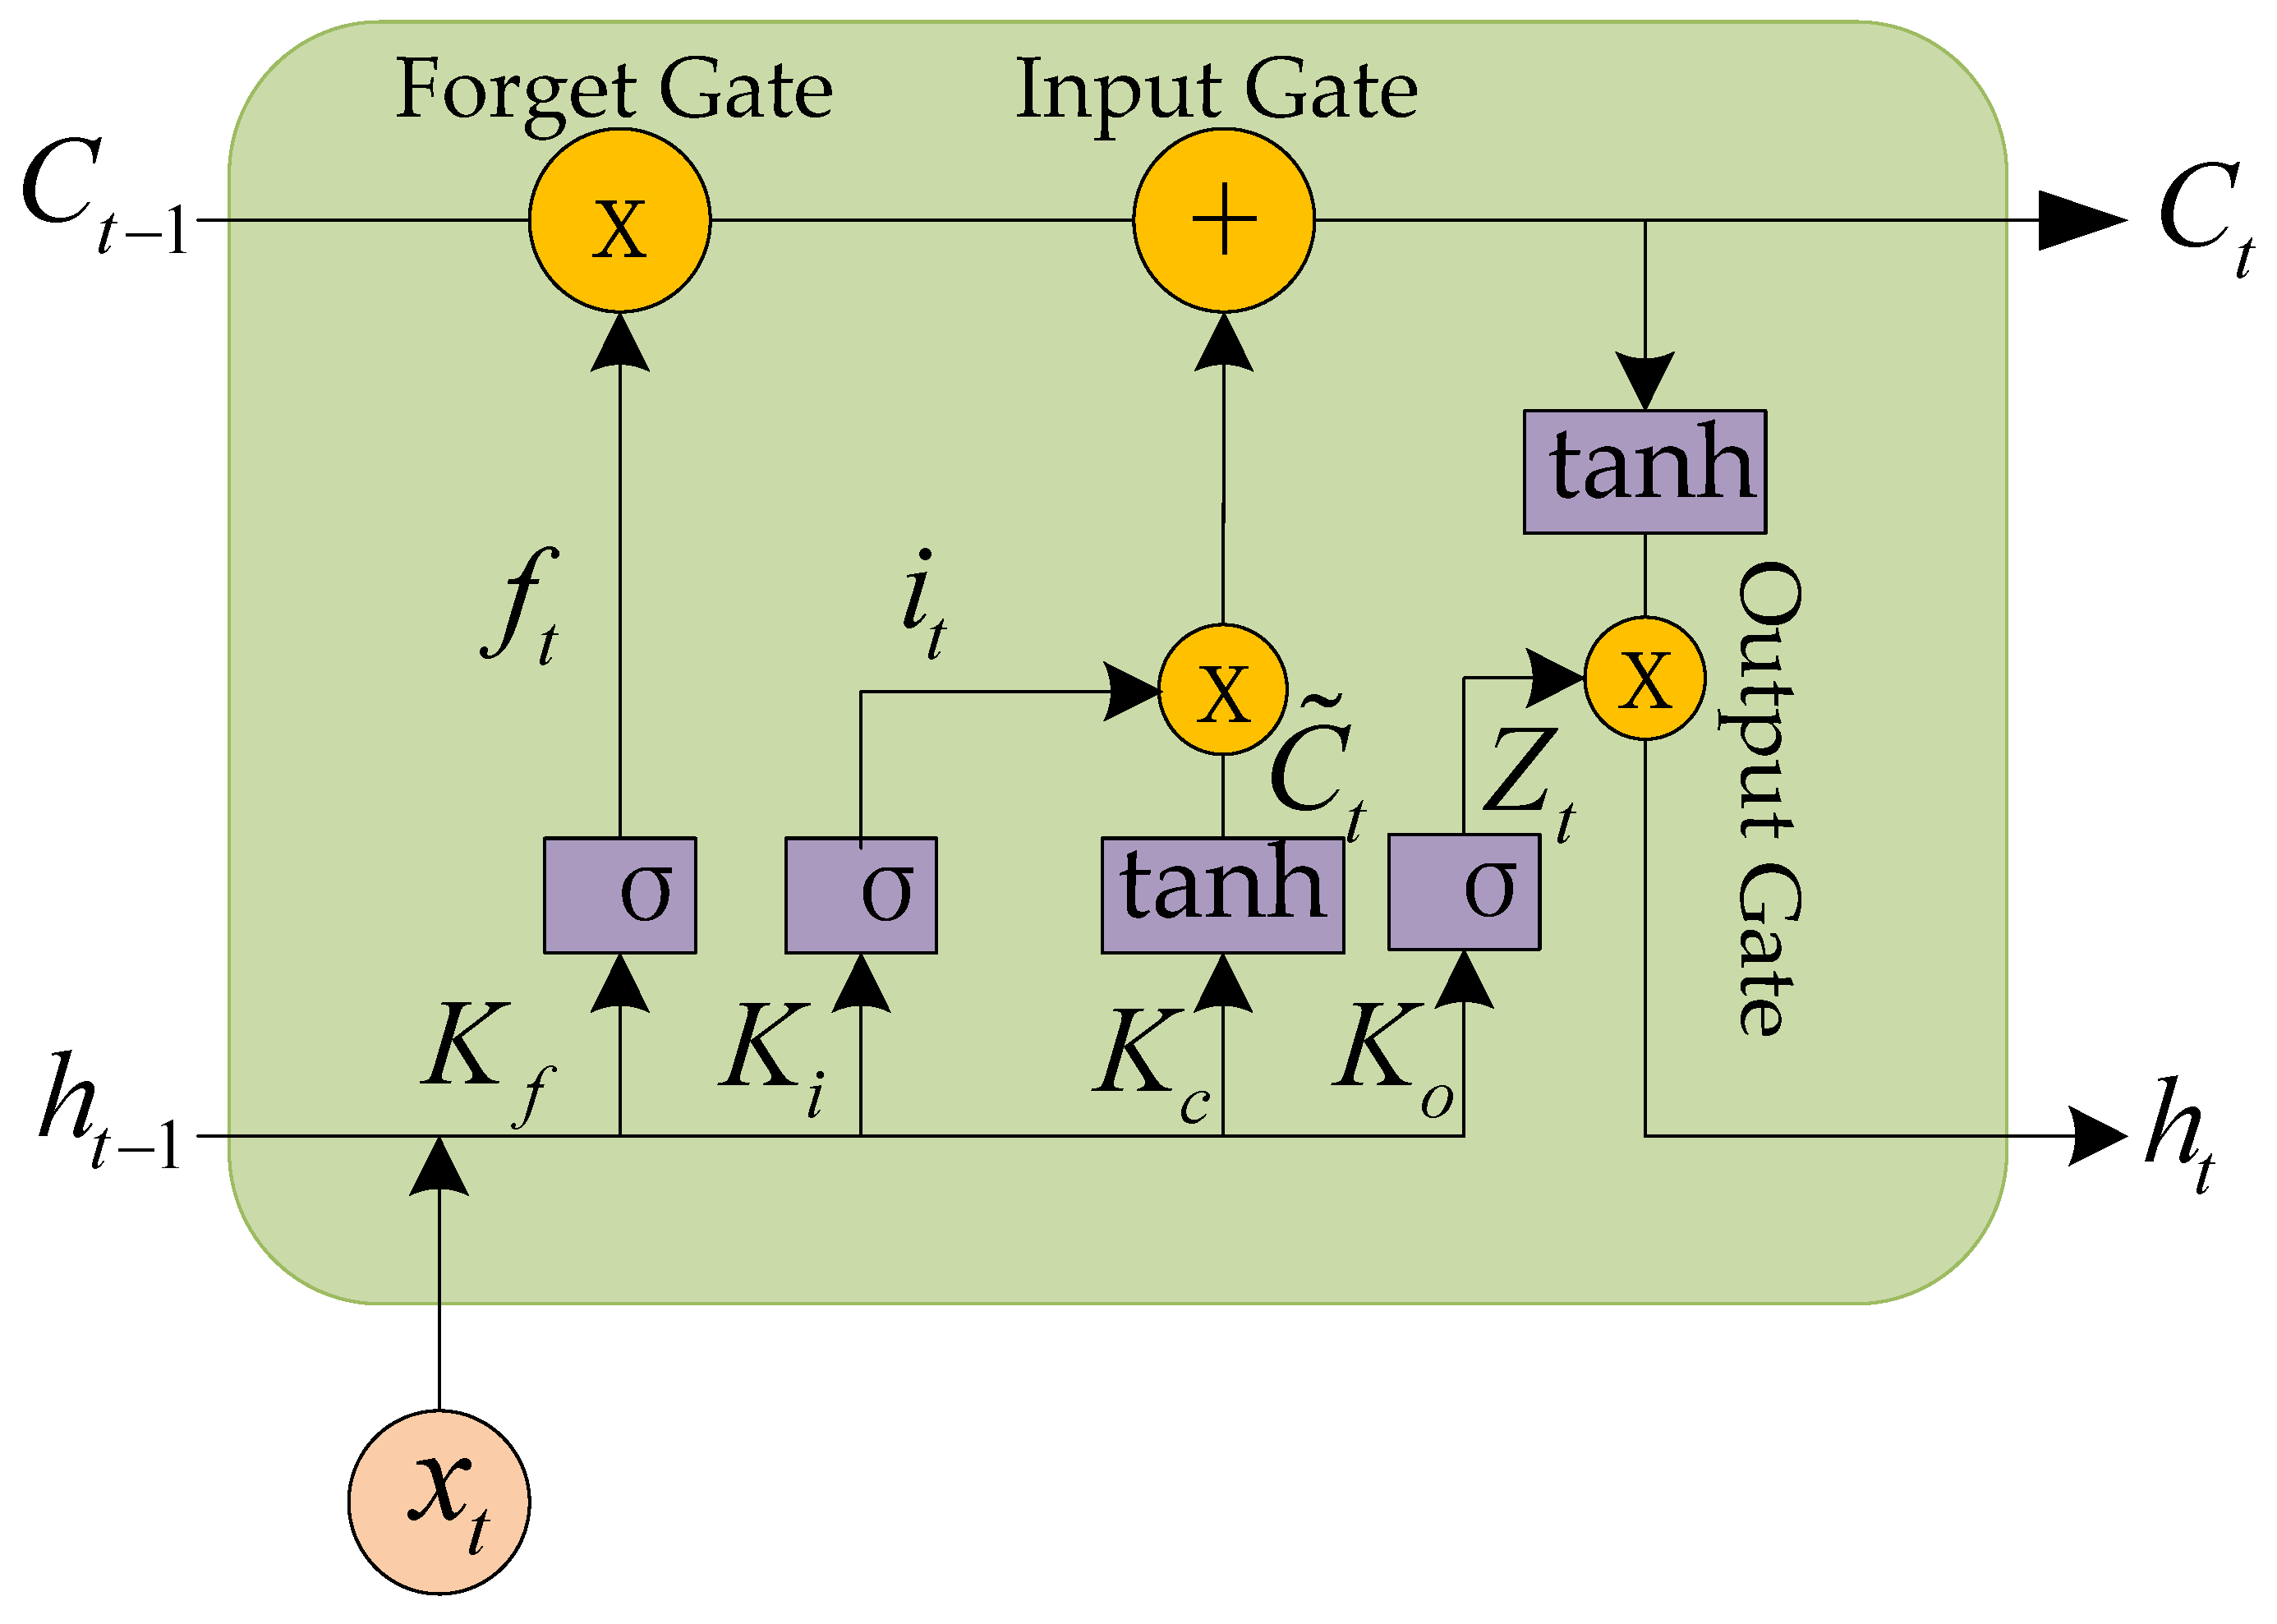
4.5.2. Improved LSTM Model
- LSTM model
- 2.
- Improved LSTM model
5. Structure and Principle of the Discriminator
6. Experimental Results and Analysis
6.1. Performance of Fall Detection Algorithm Based on Improved YOLOv5s
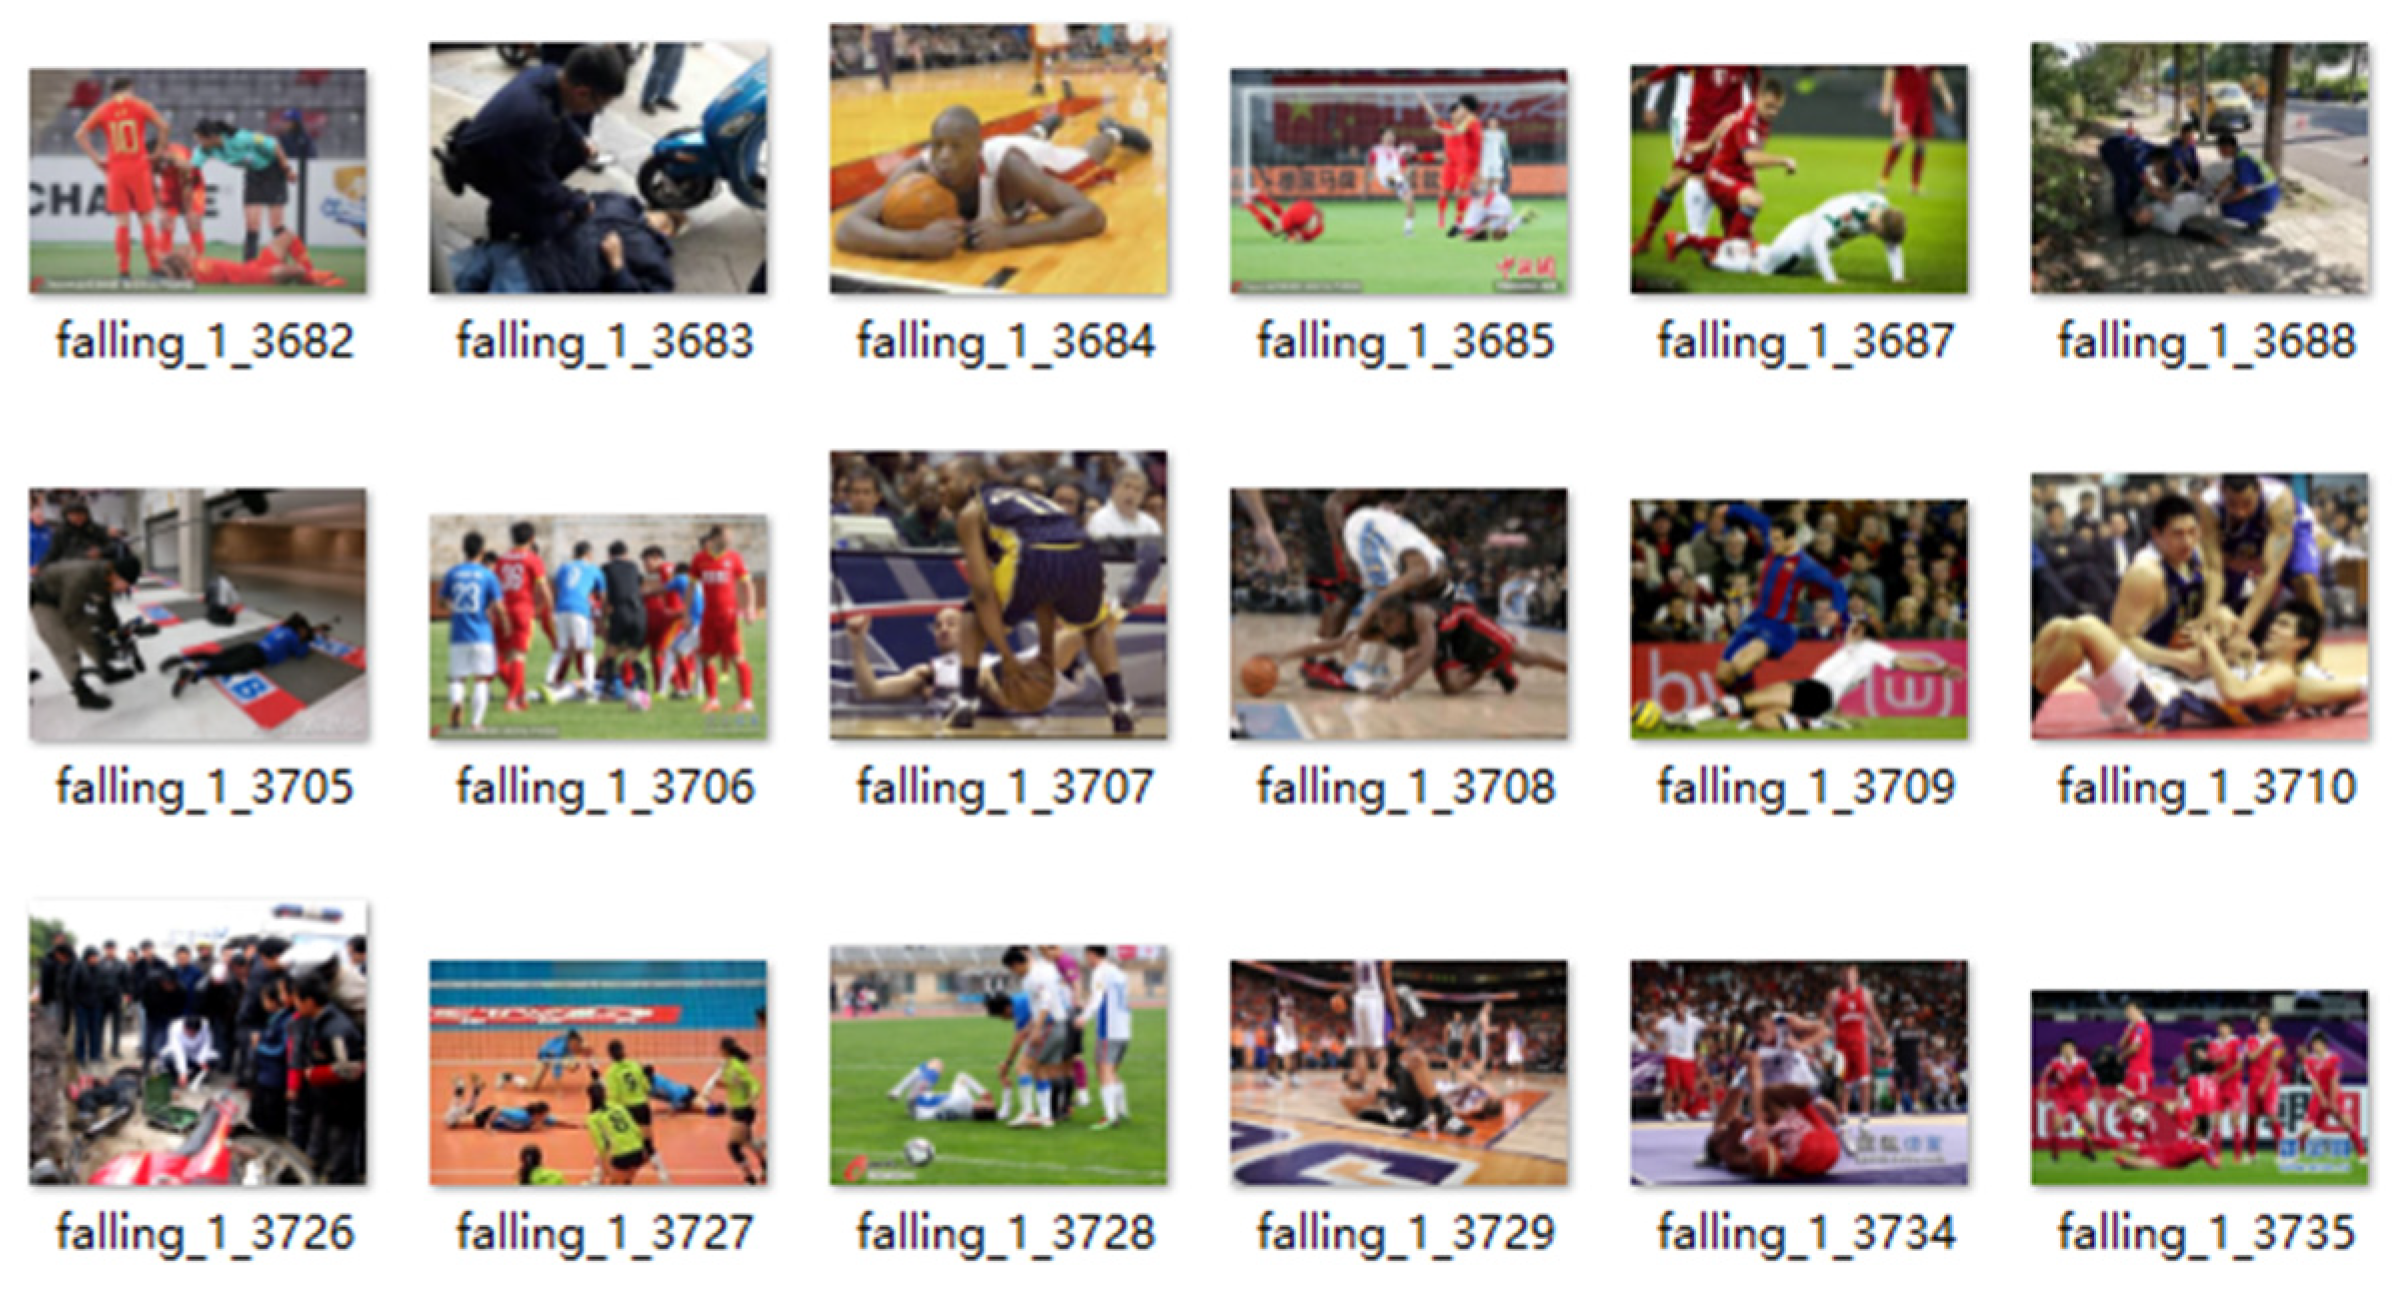
6.1.1. Dataset
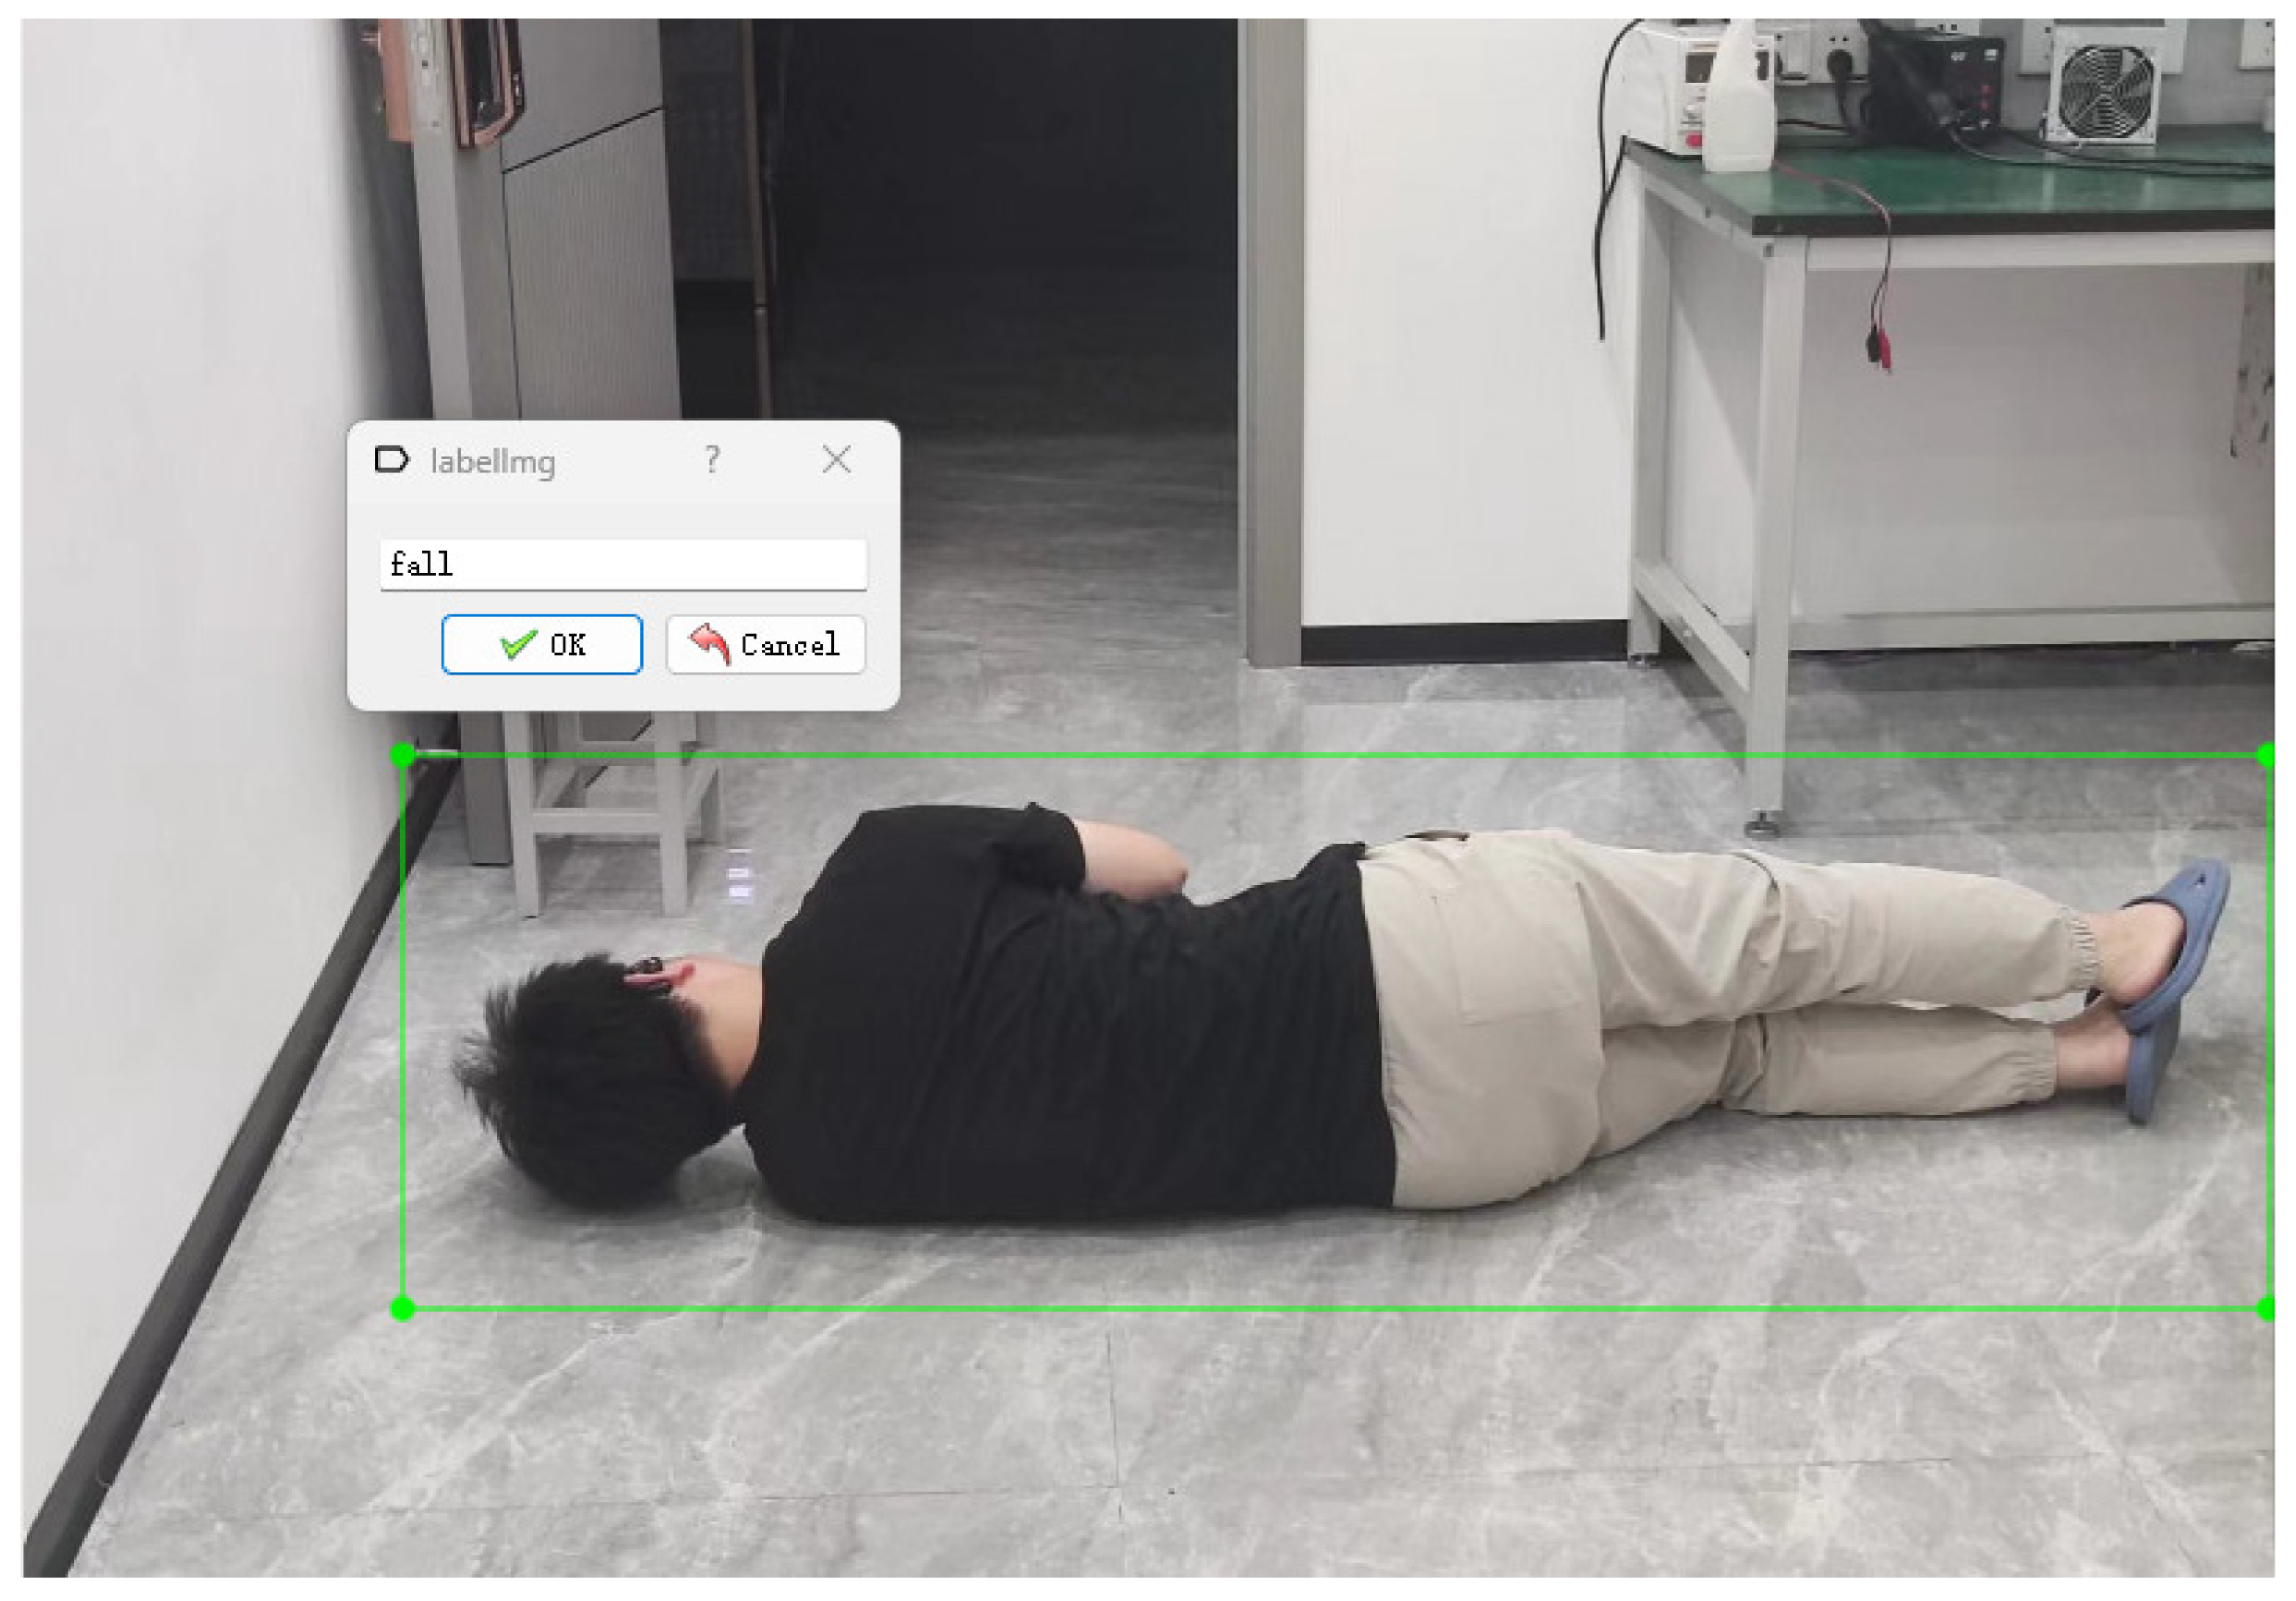
6.1.2. Partitioning and Labeling of Dataset
6.1.3. Experimental Settings
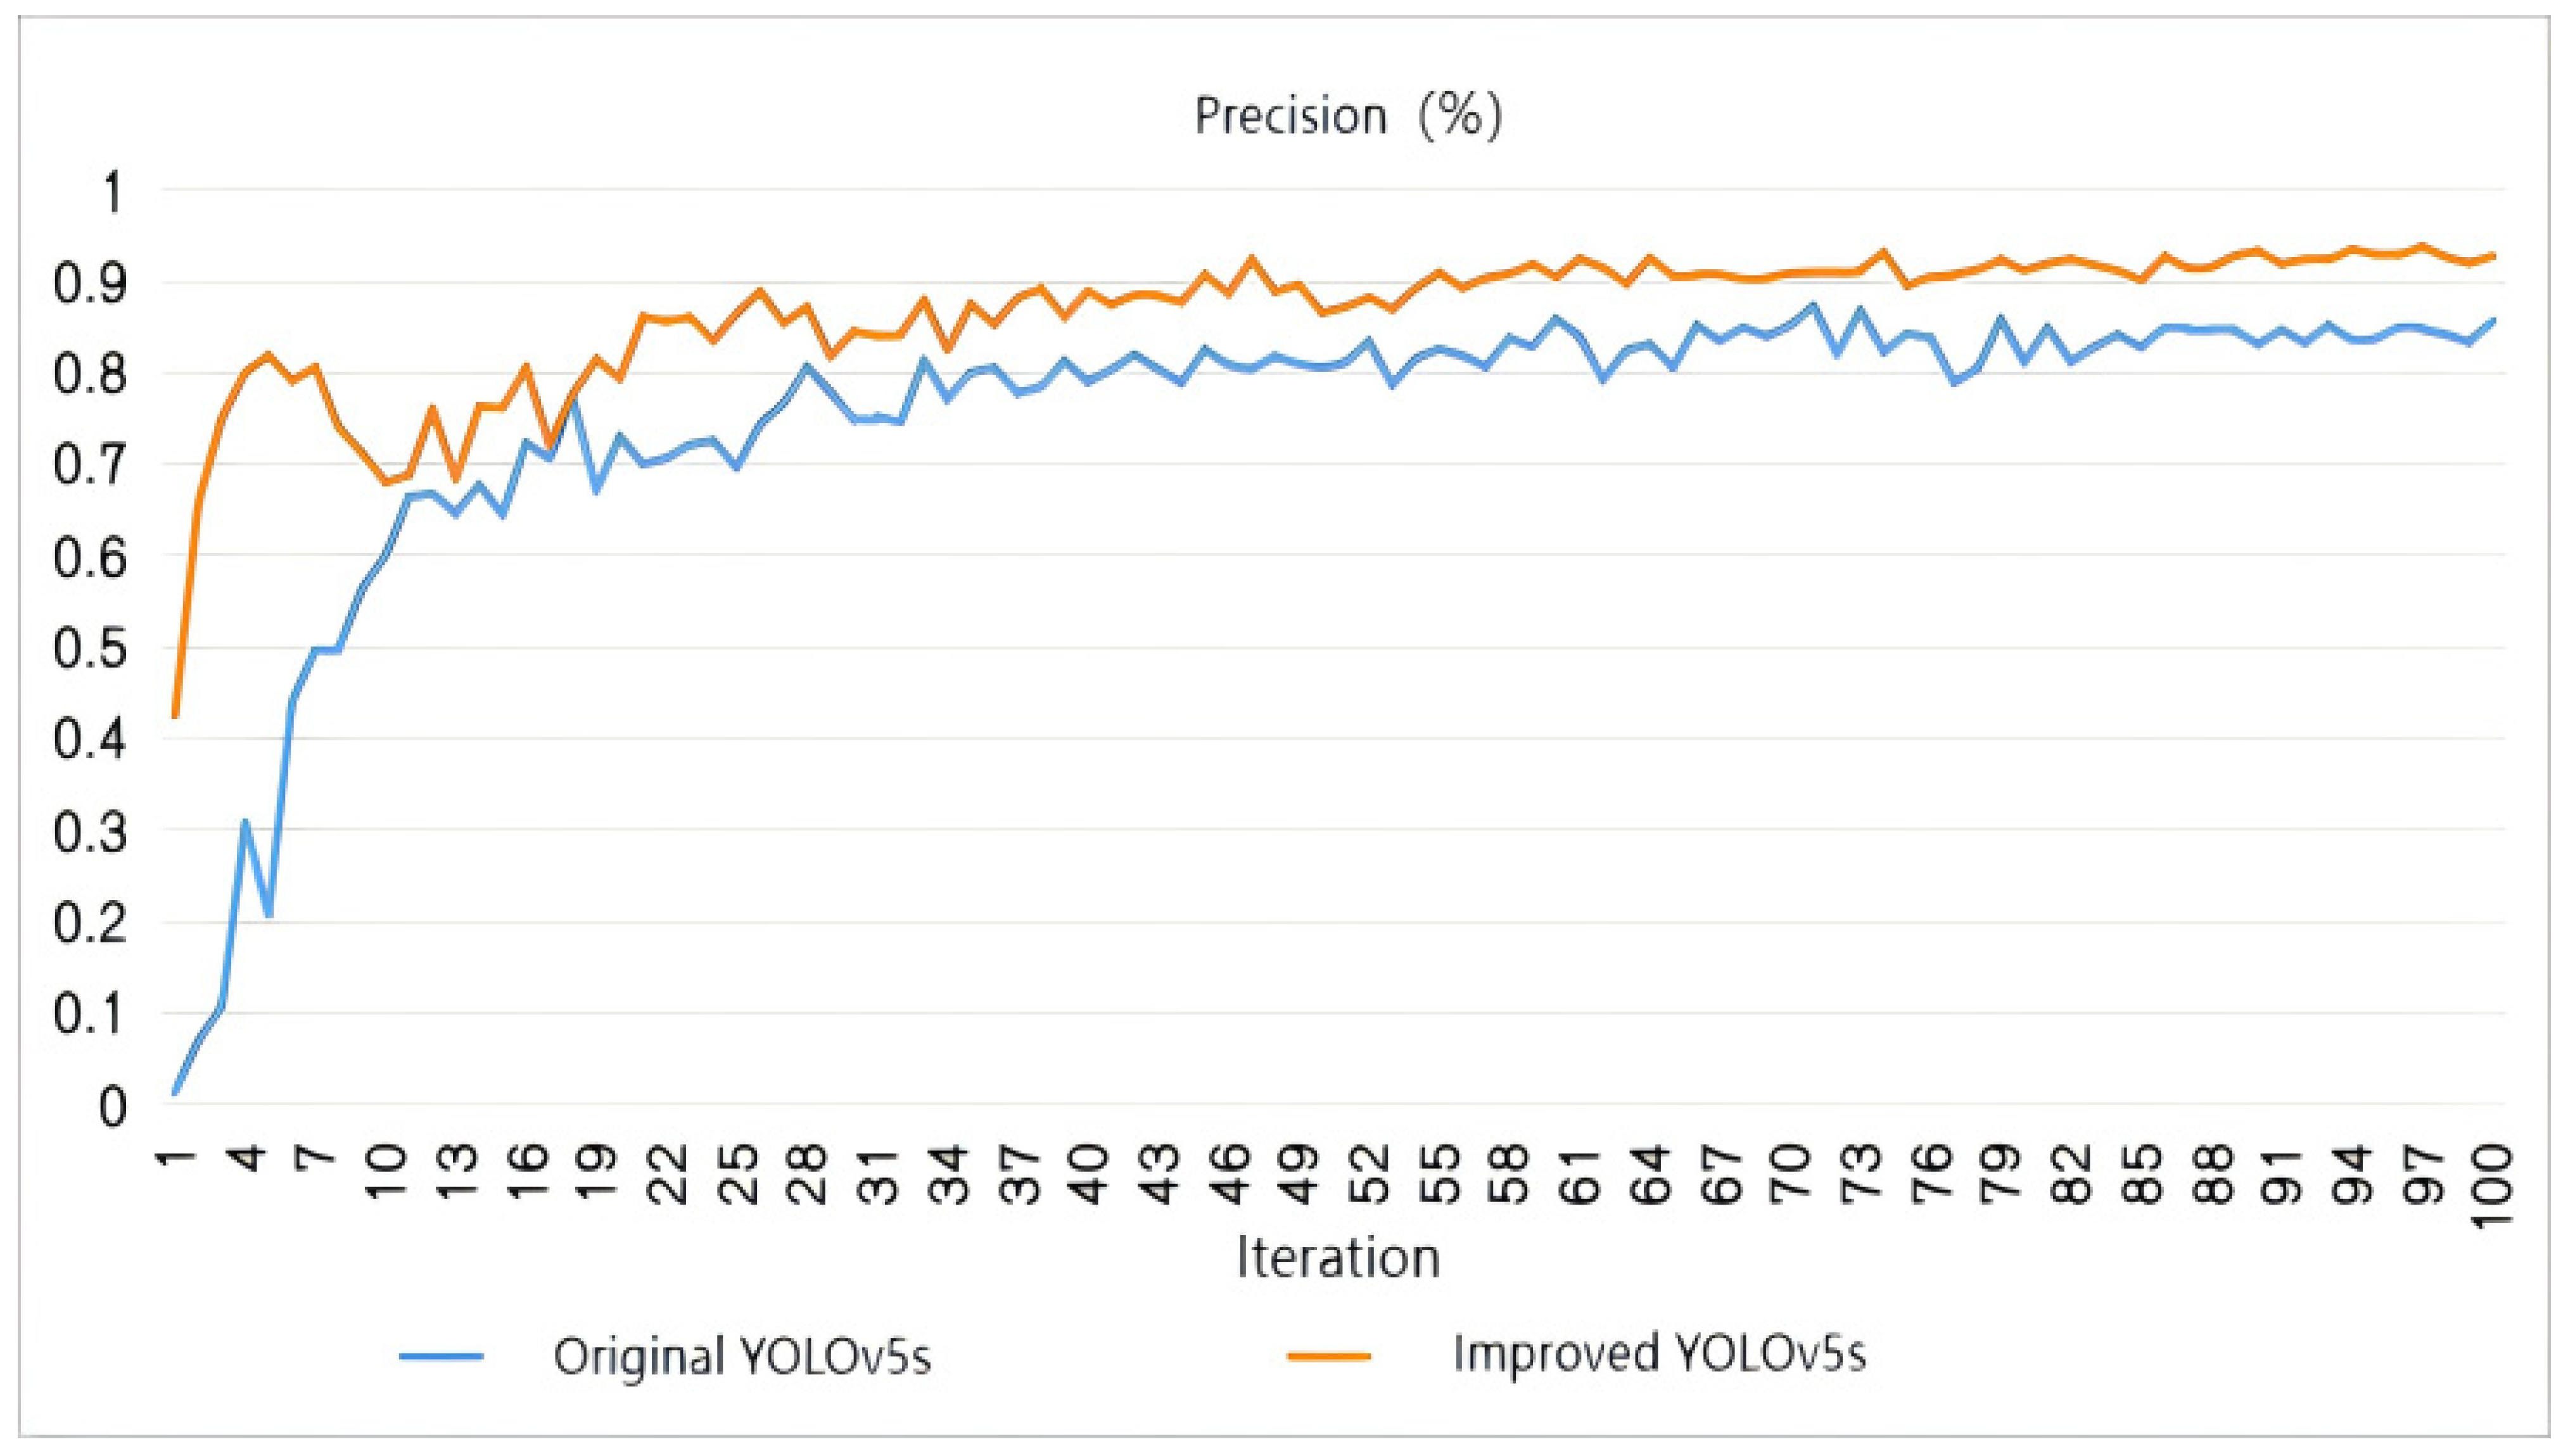
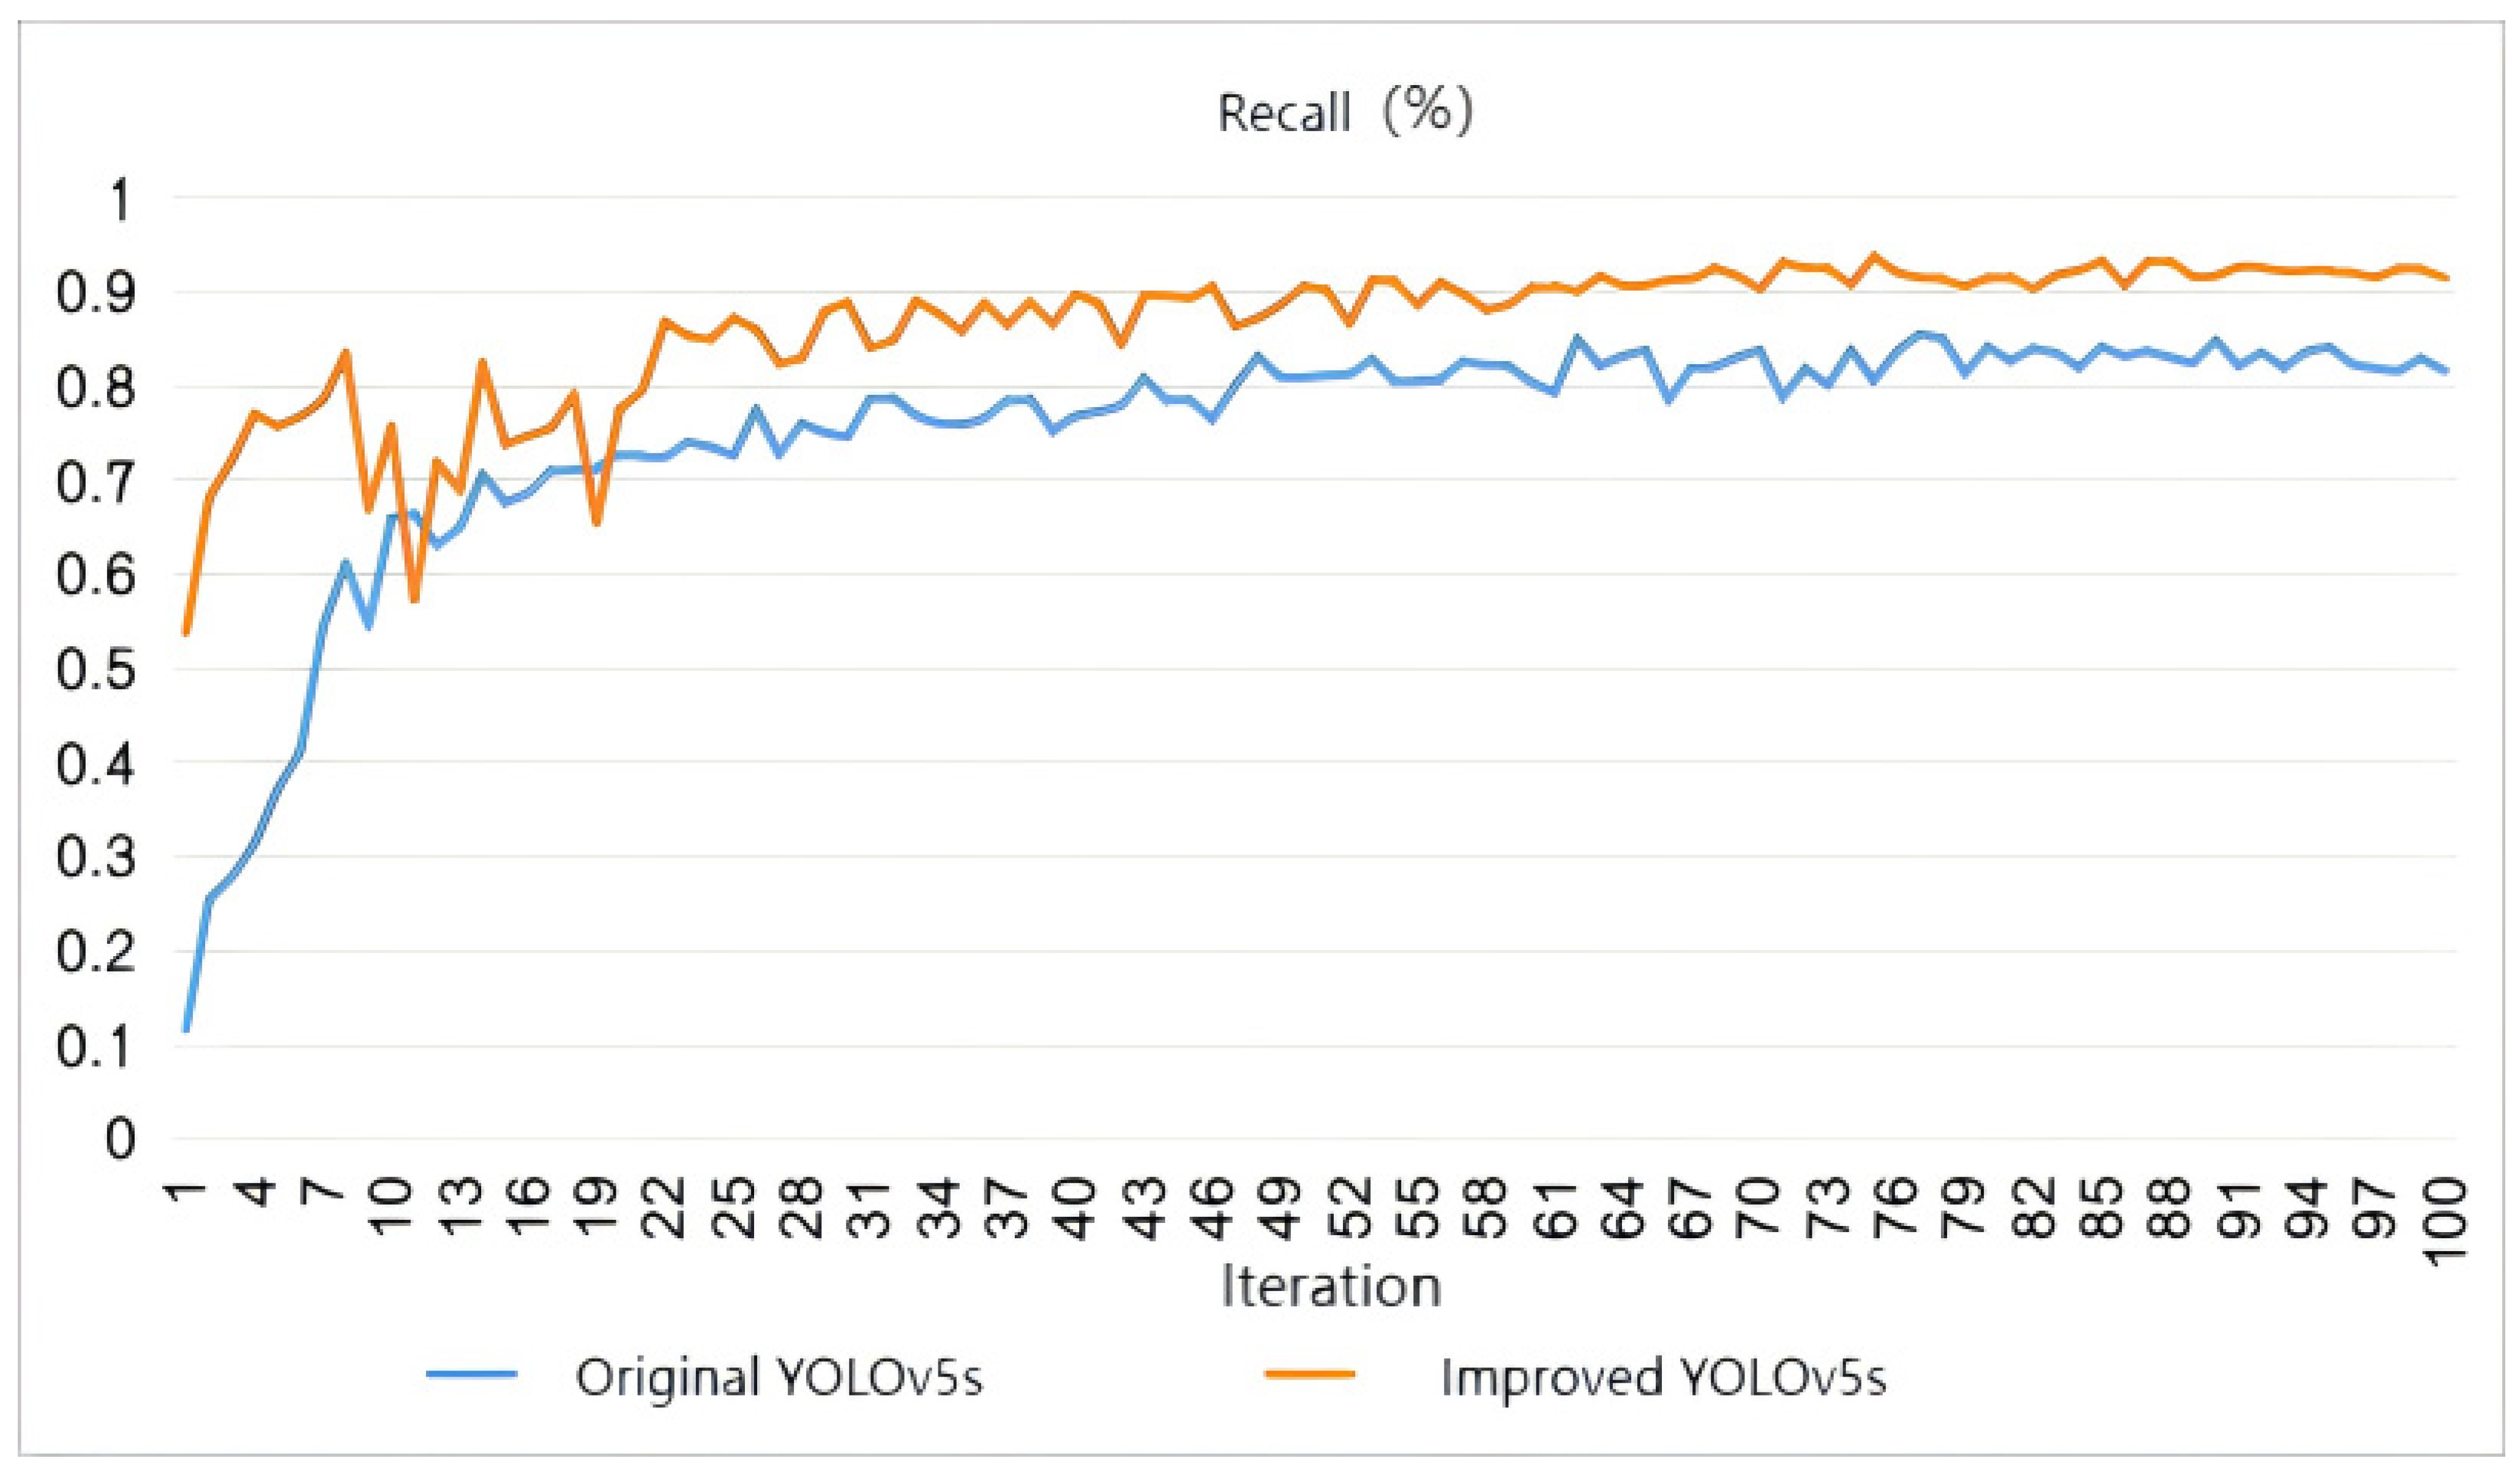
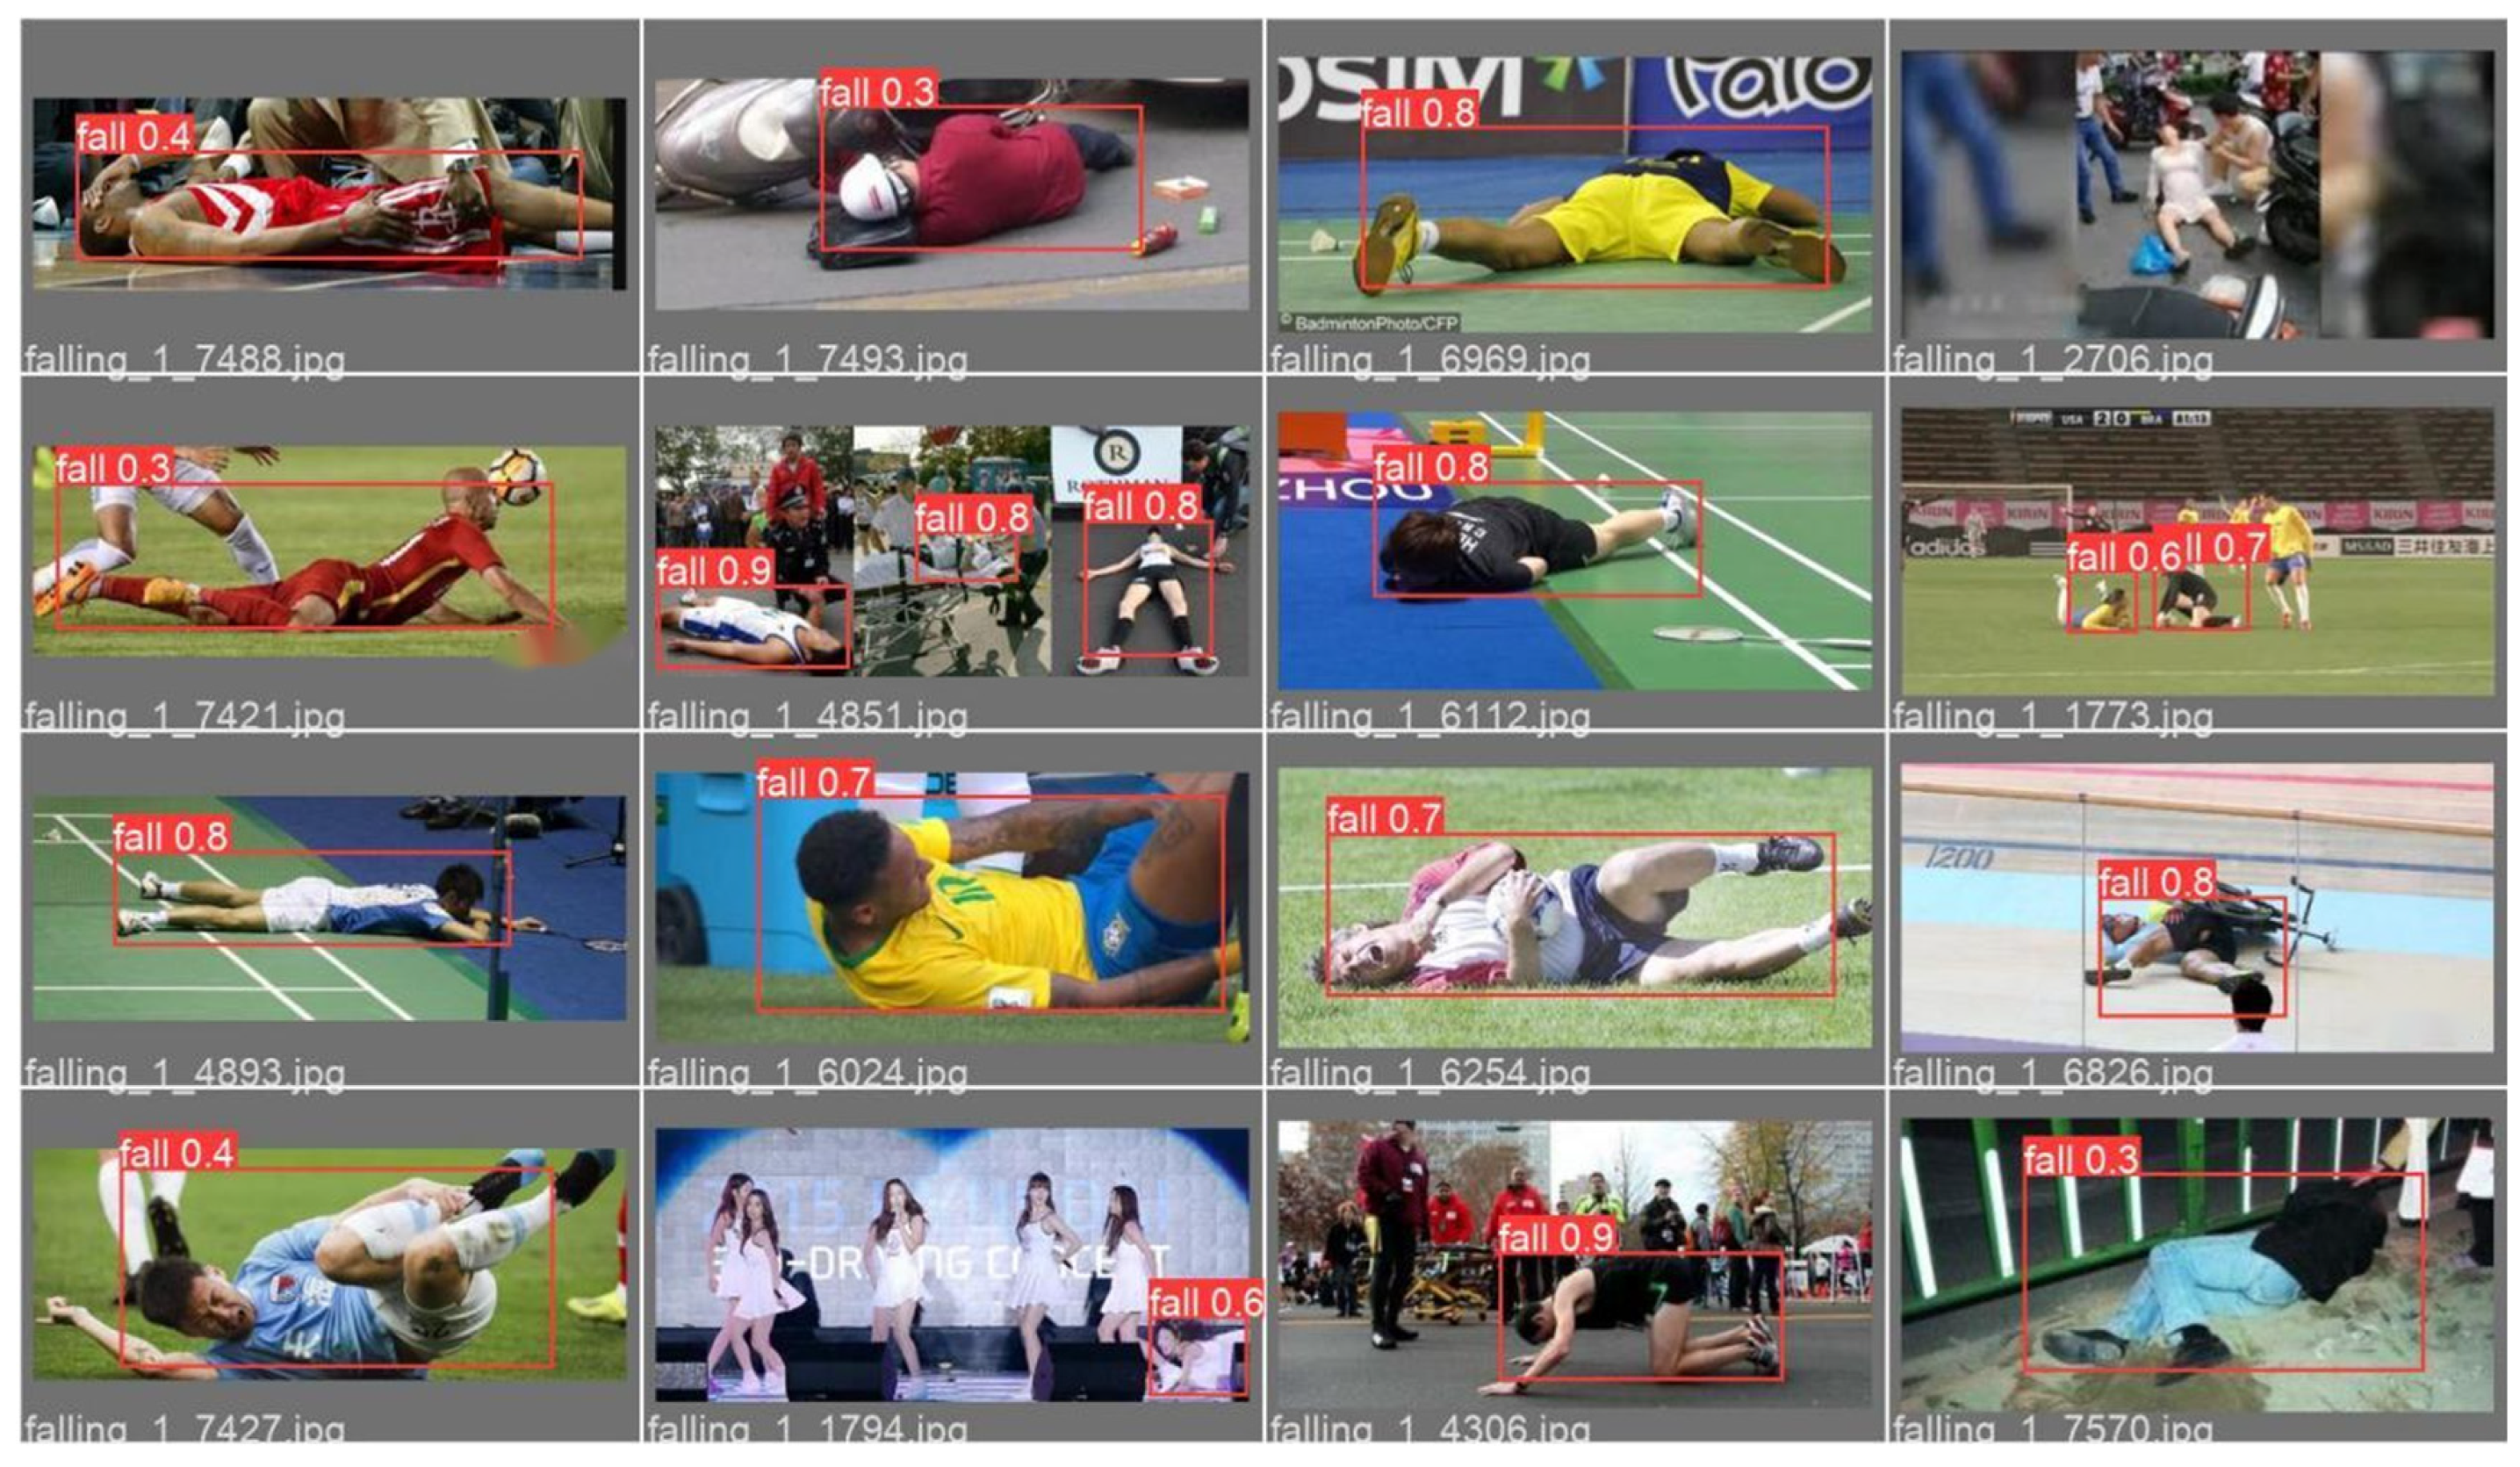
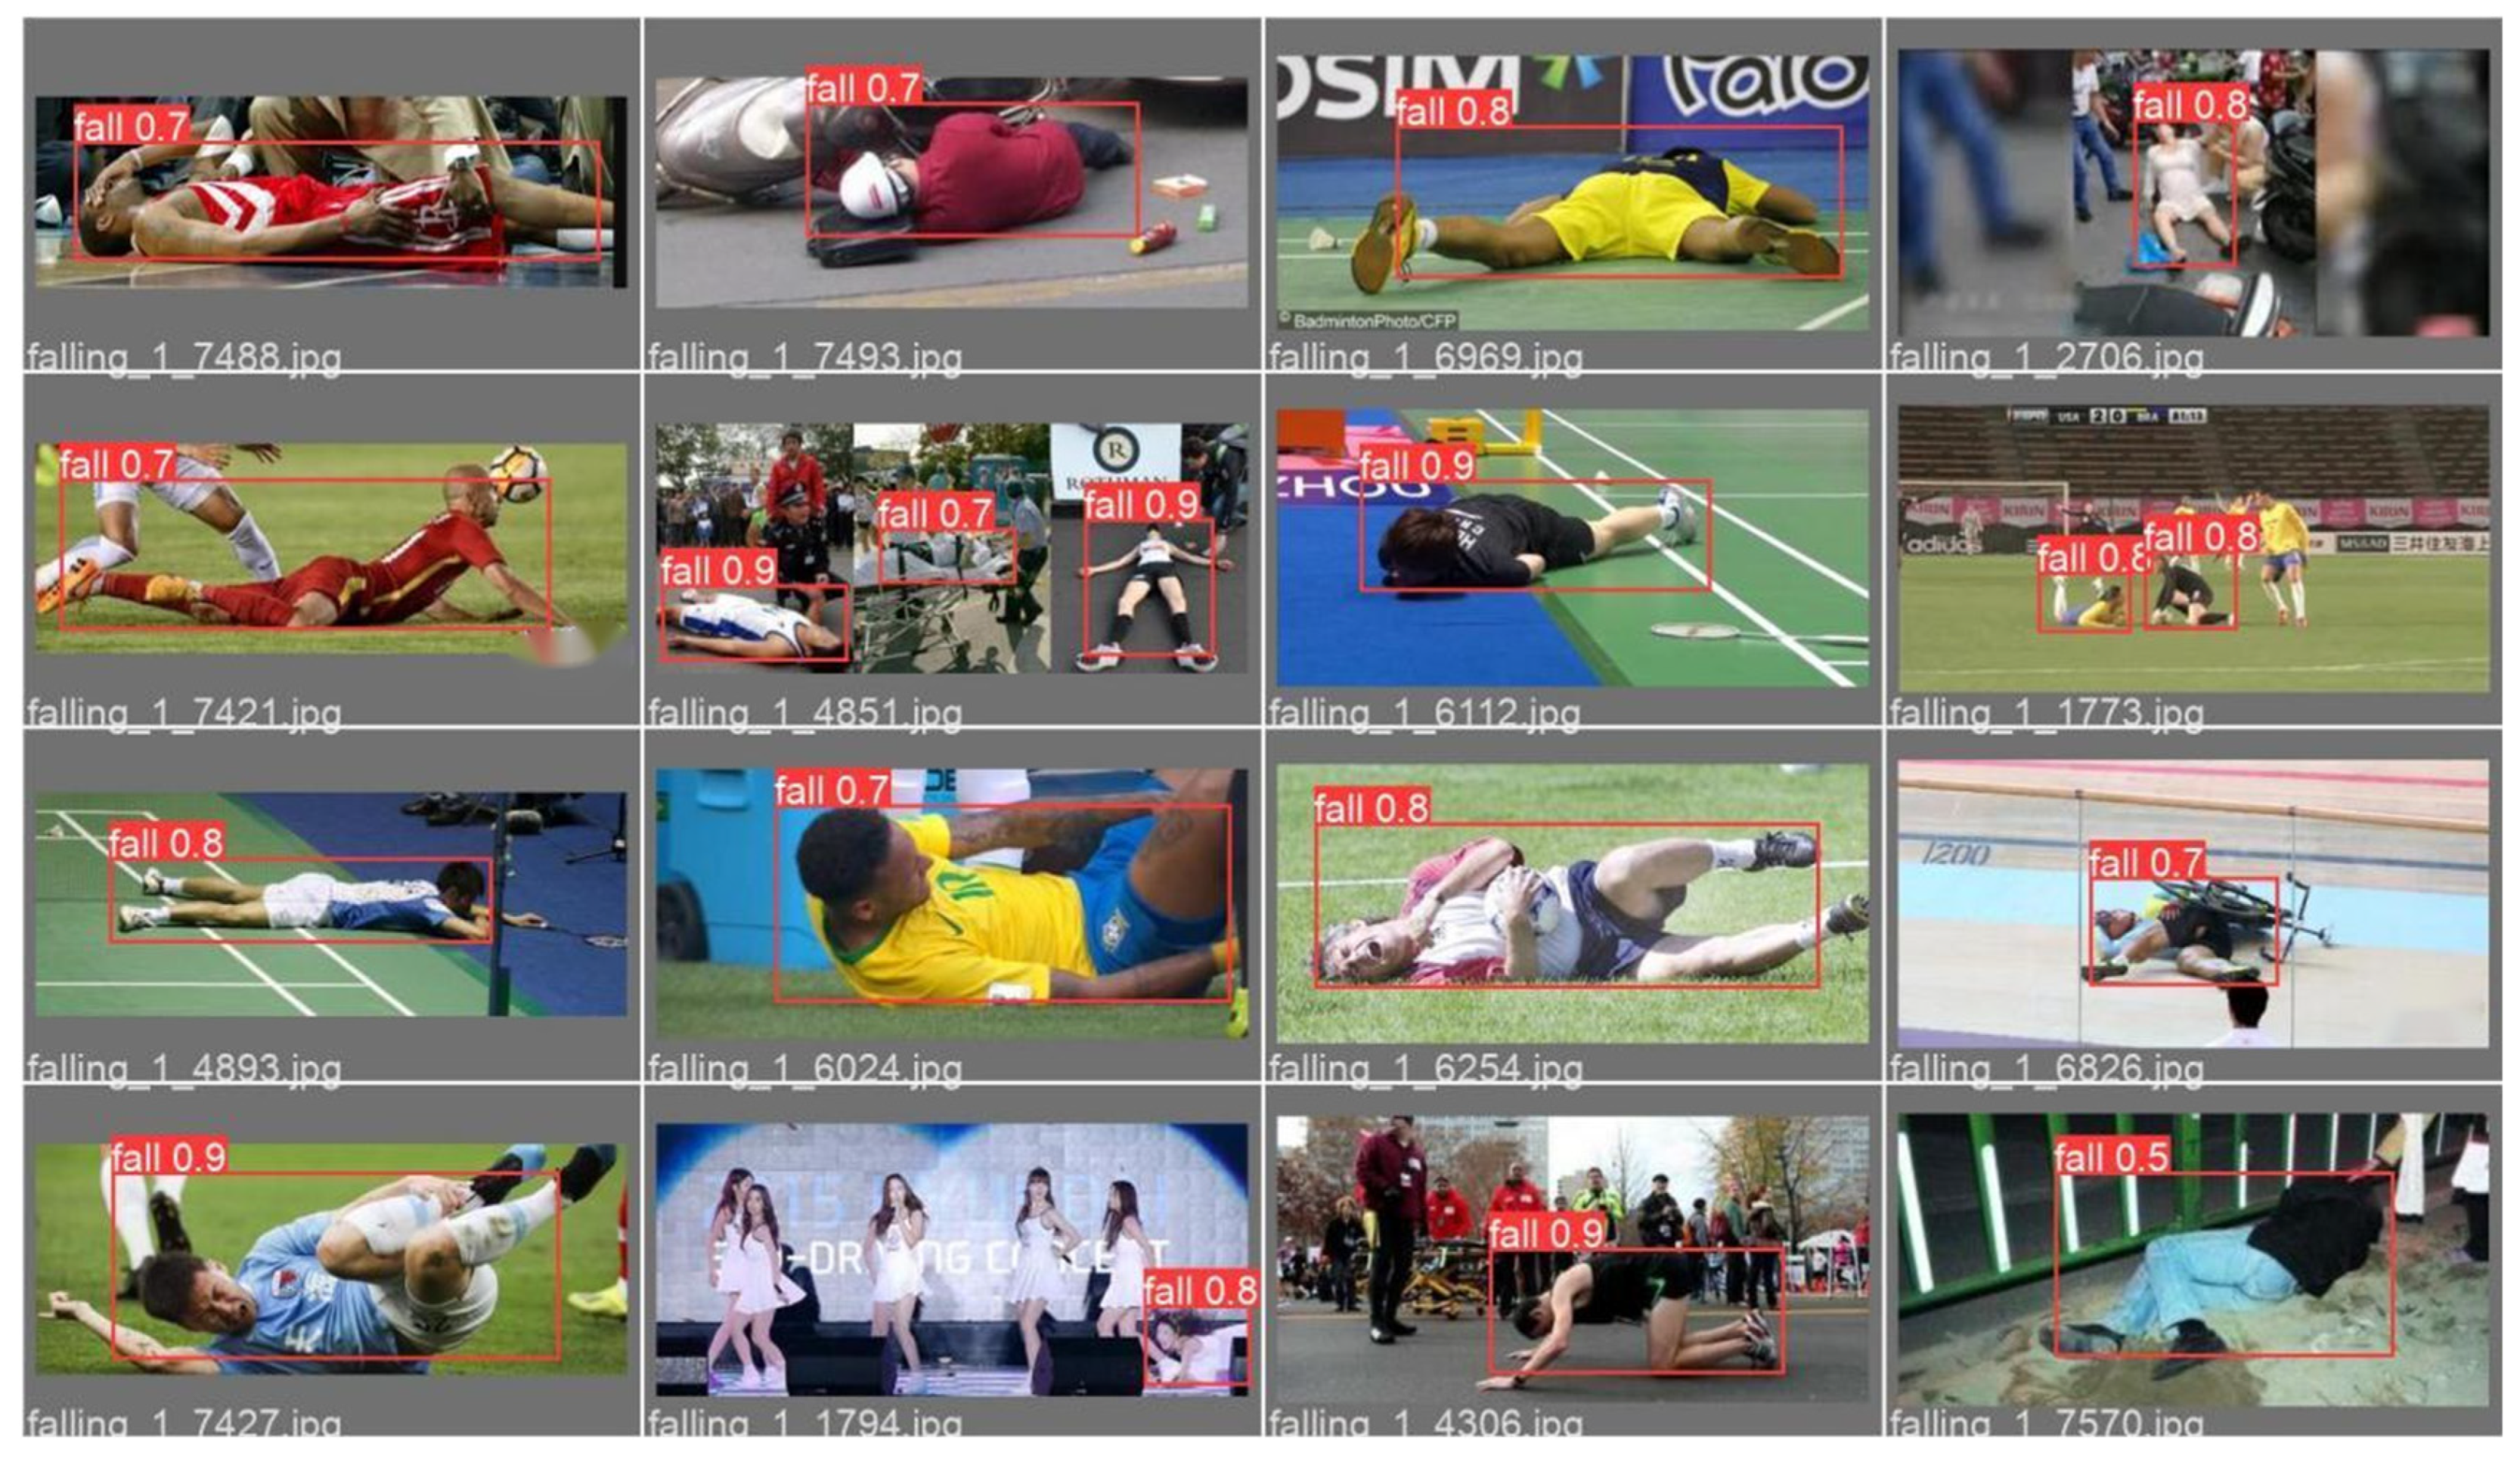
6.1.4. Experimental Results
6.2. Performance of CSI Fall Detection Algorithm Based on Improved LSTM Model
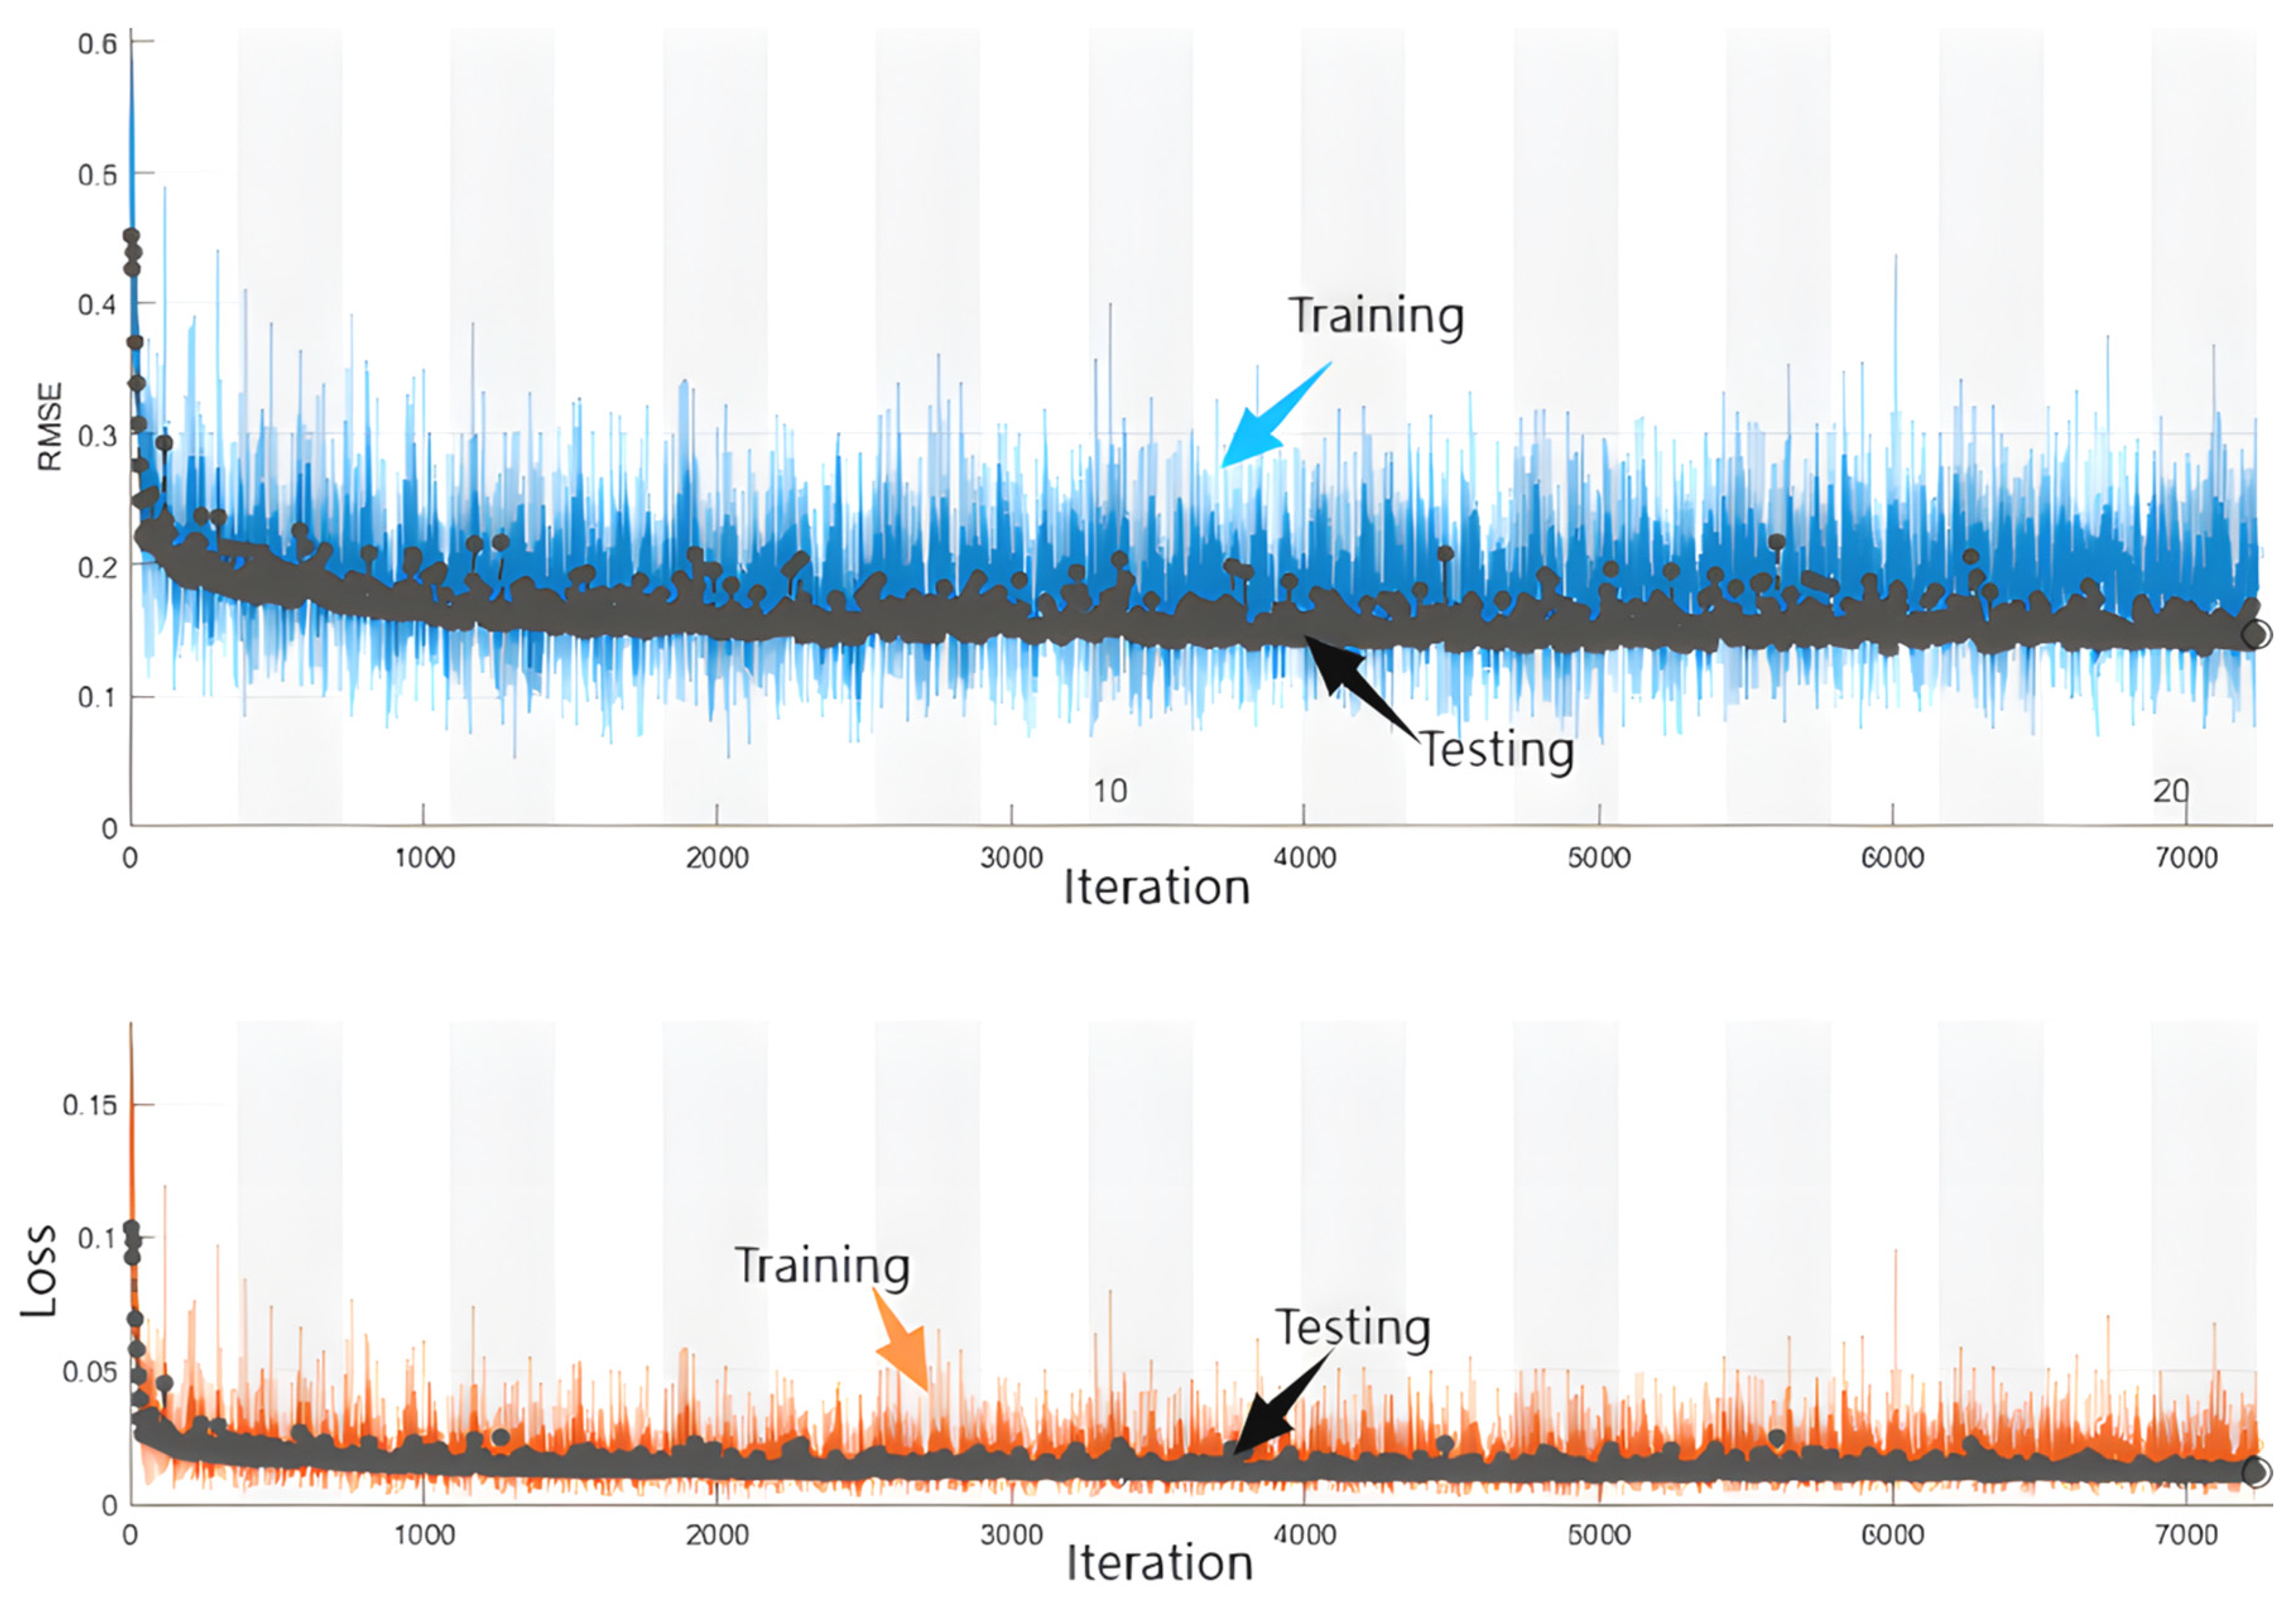
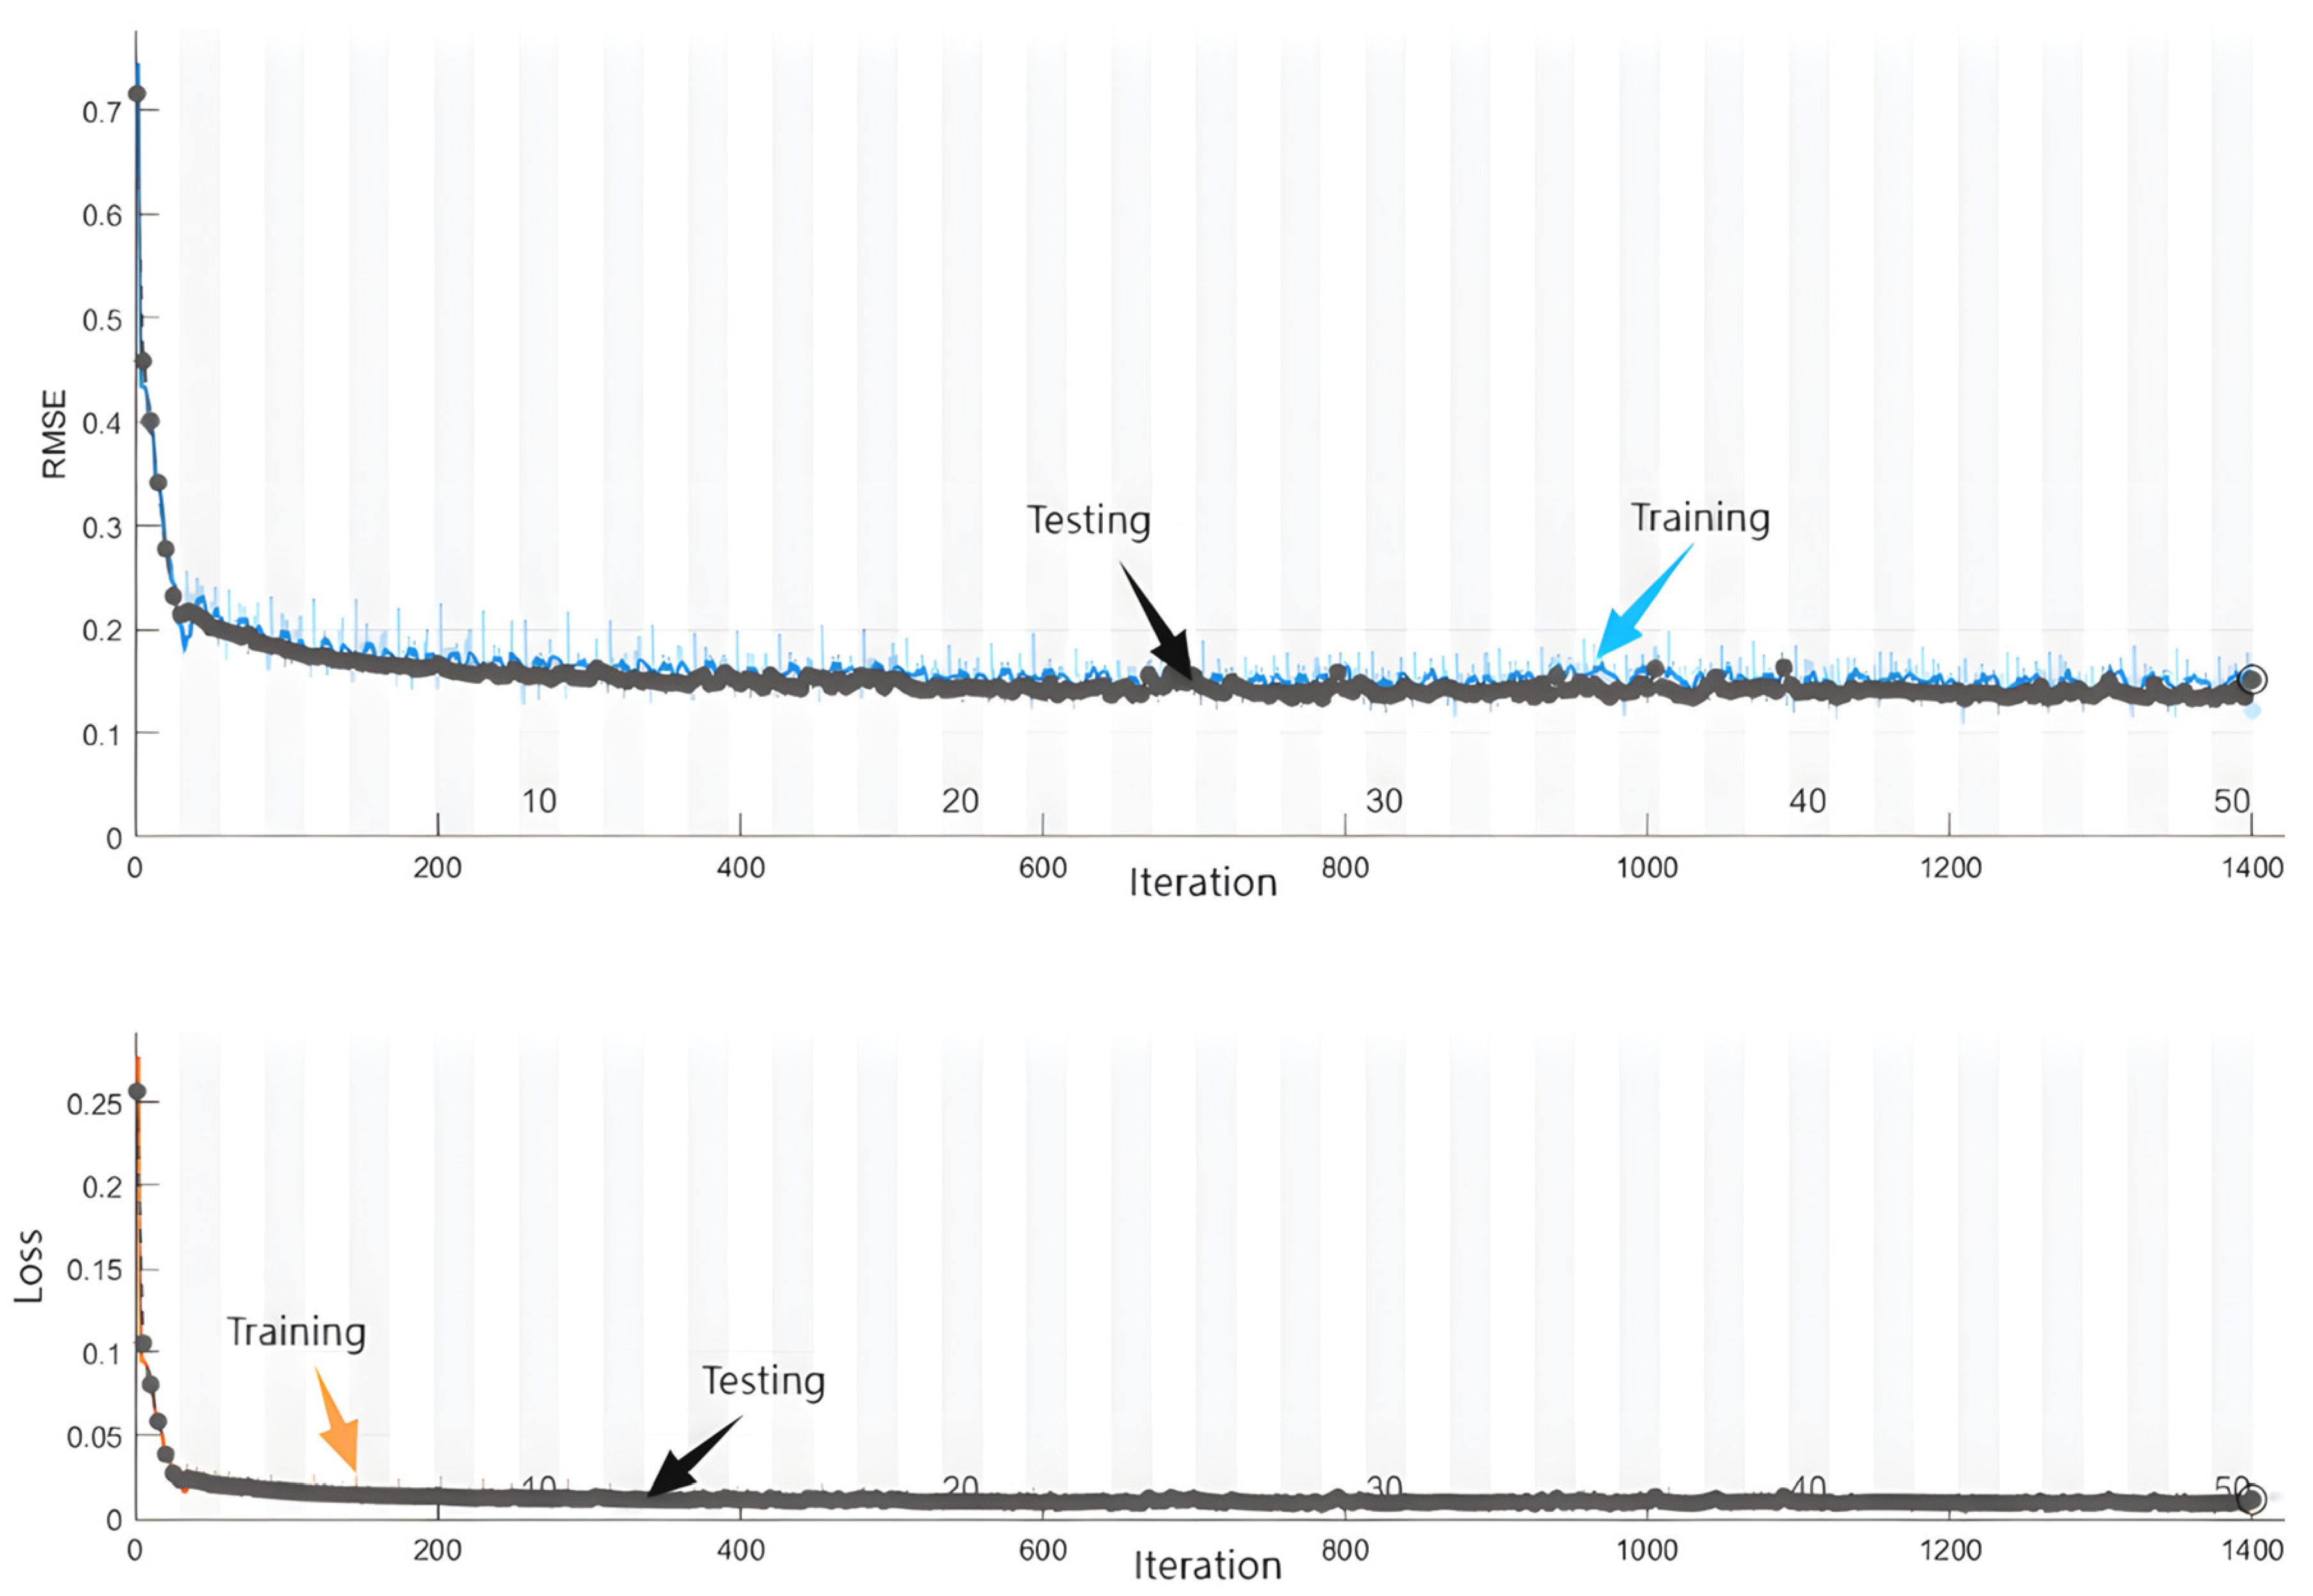
6.2.1. Comparison of Training Performance
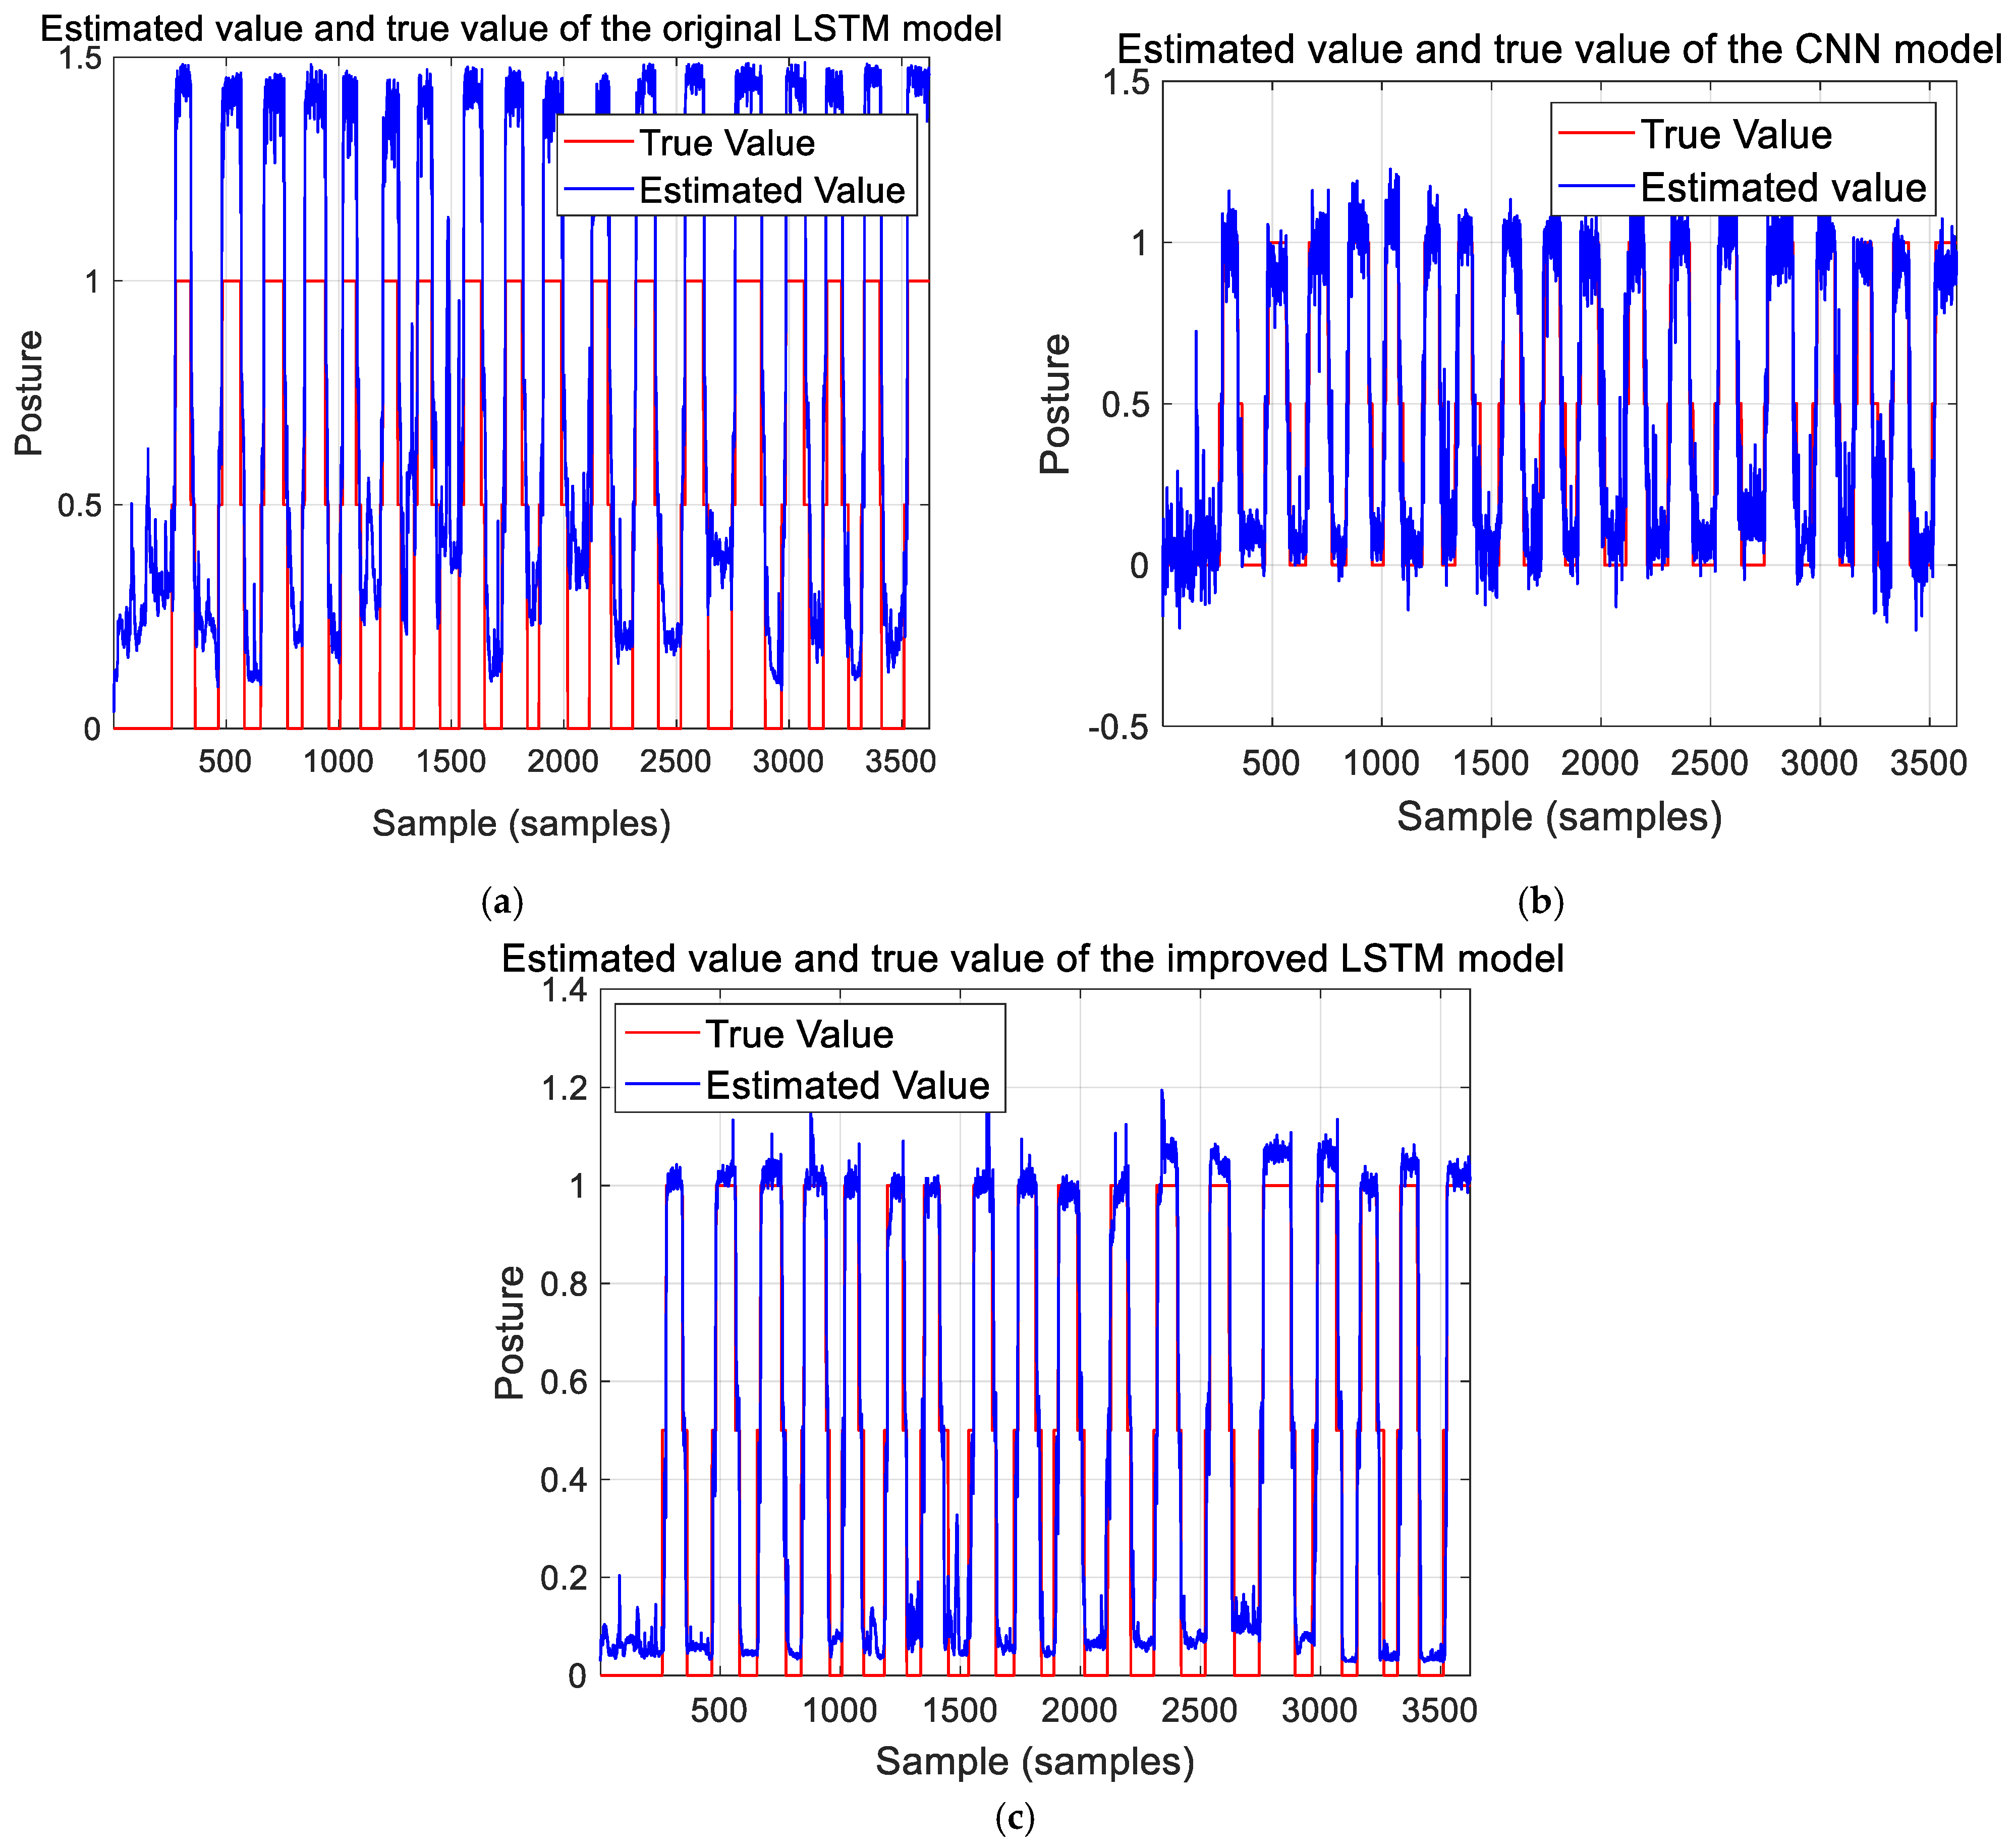
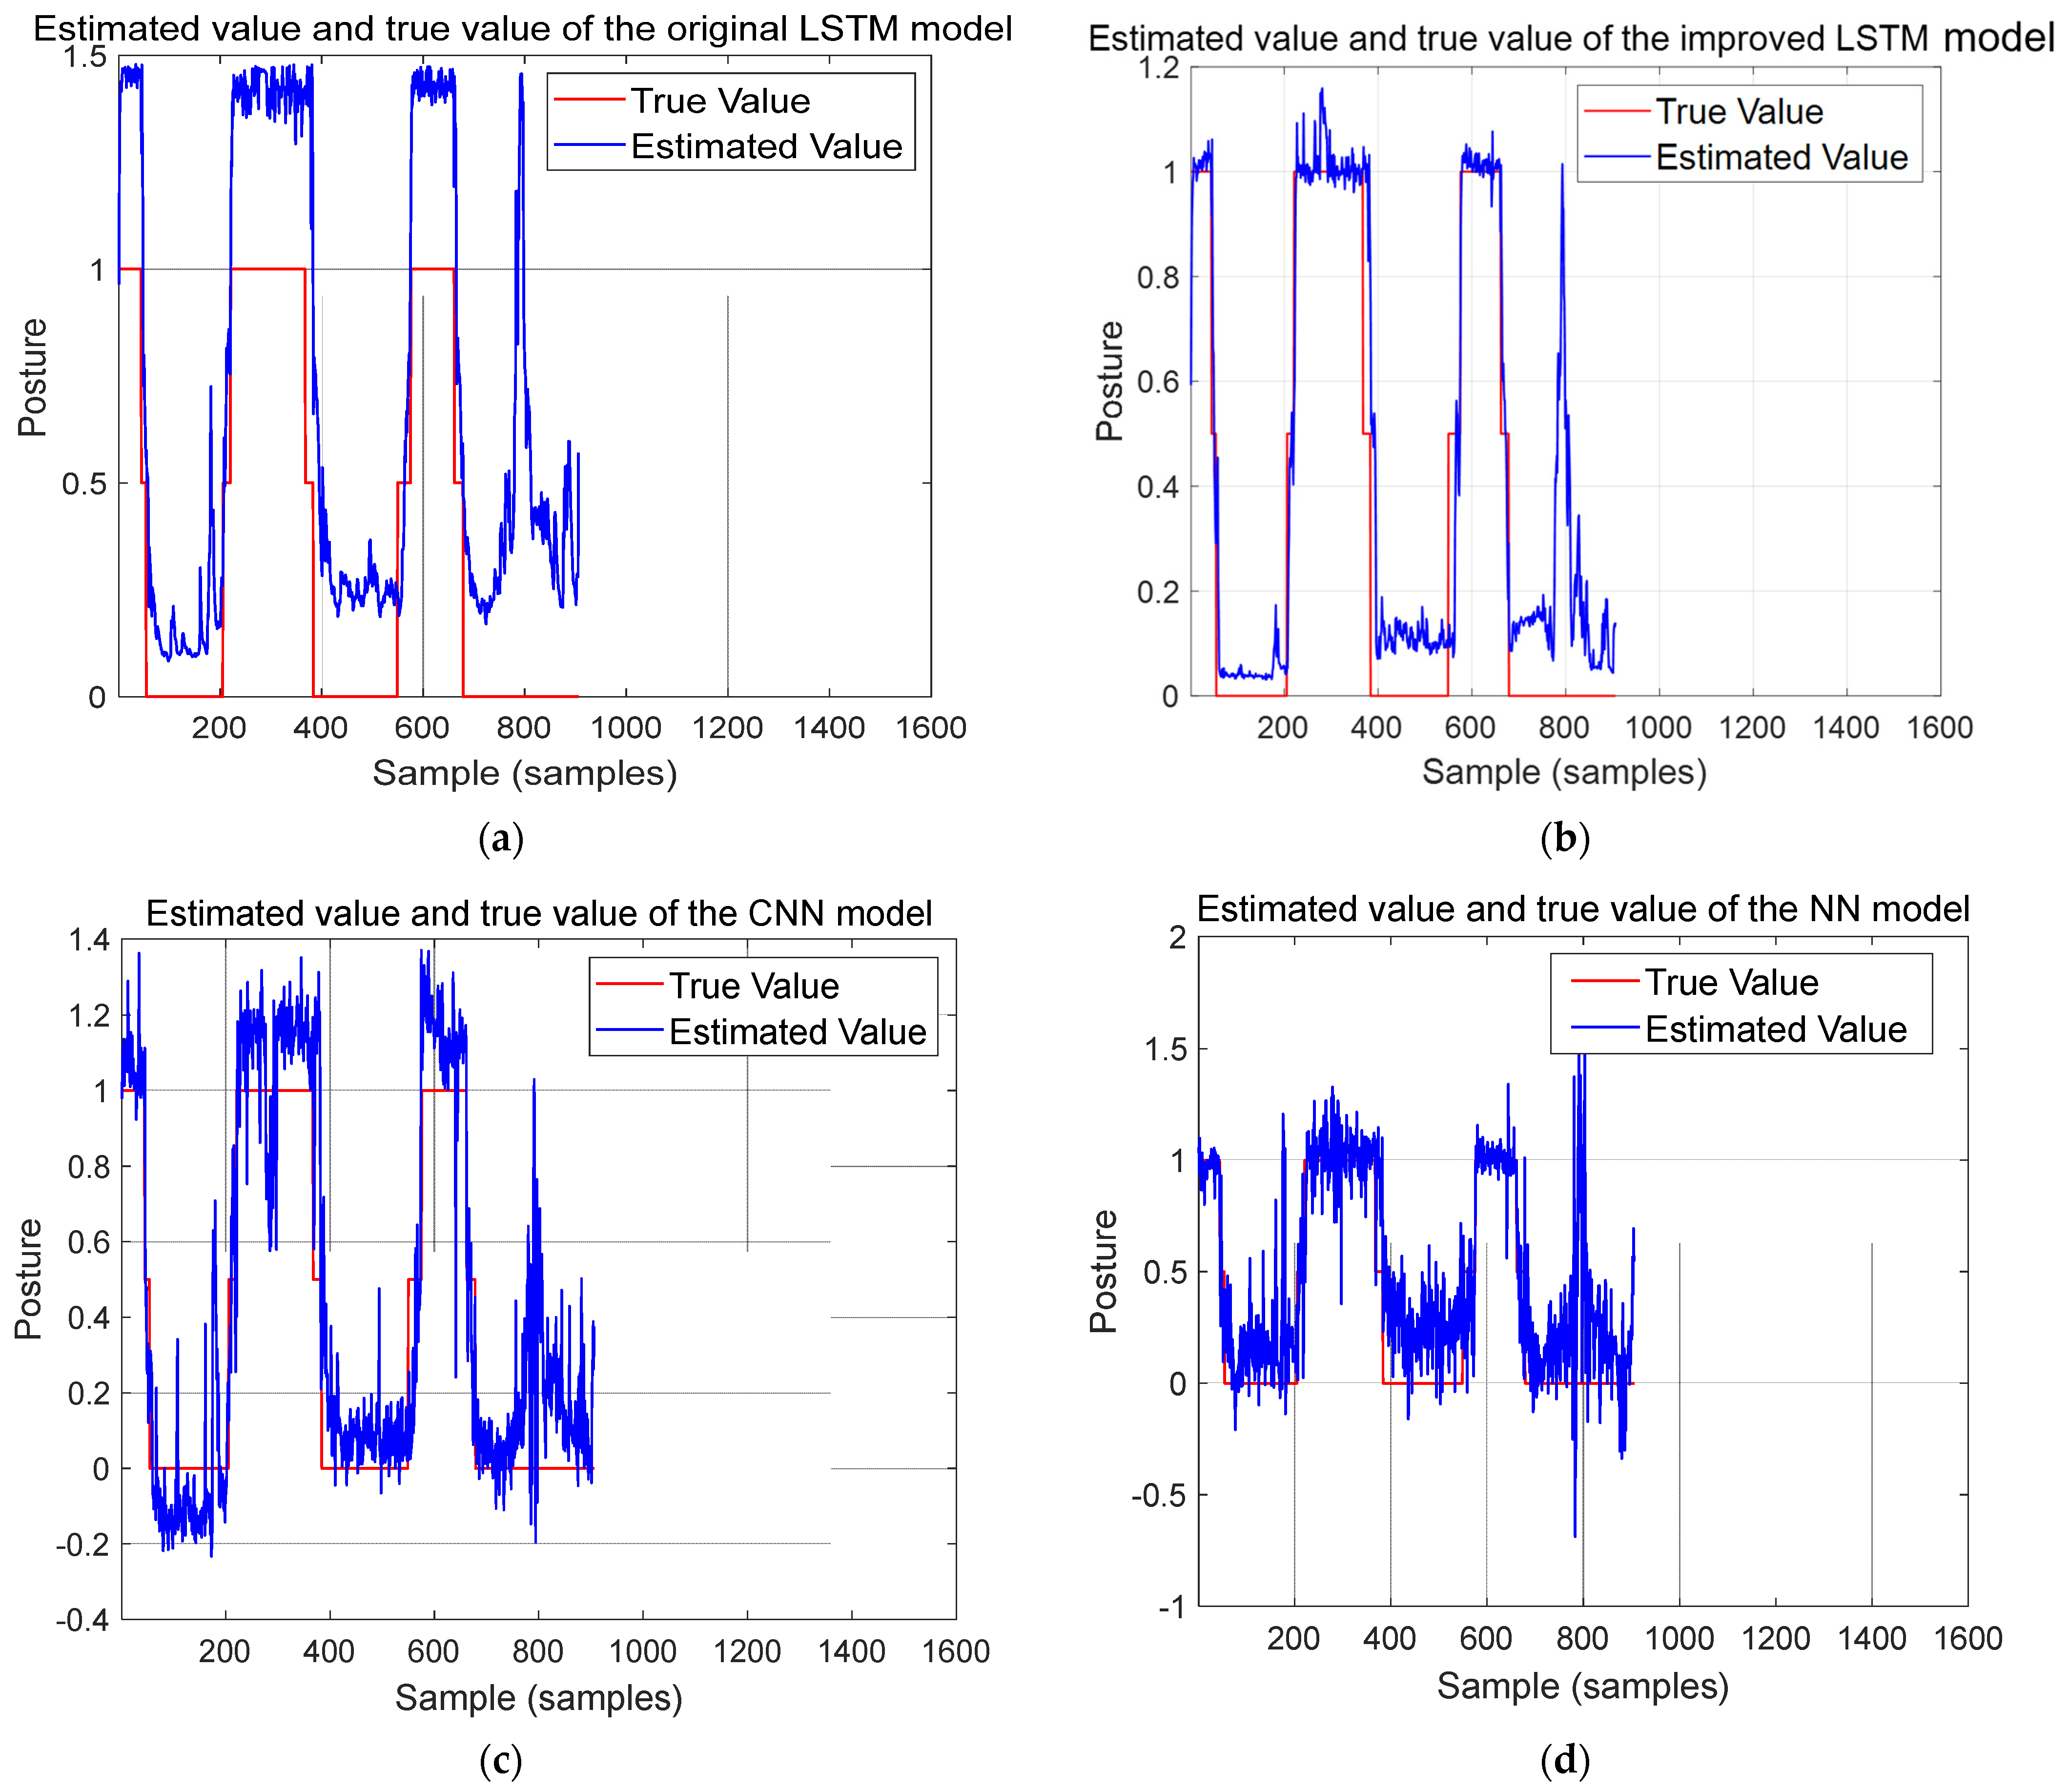
6.2.2. Comparison of Performance of Posture Estimation
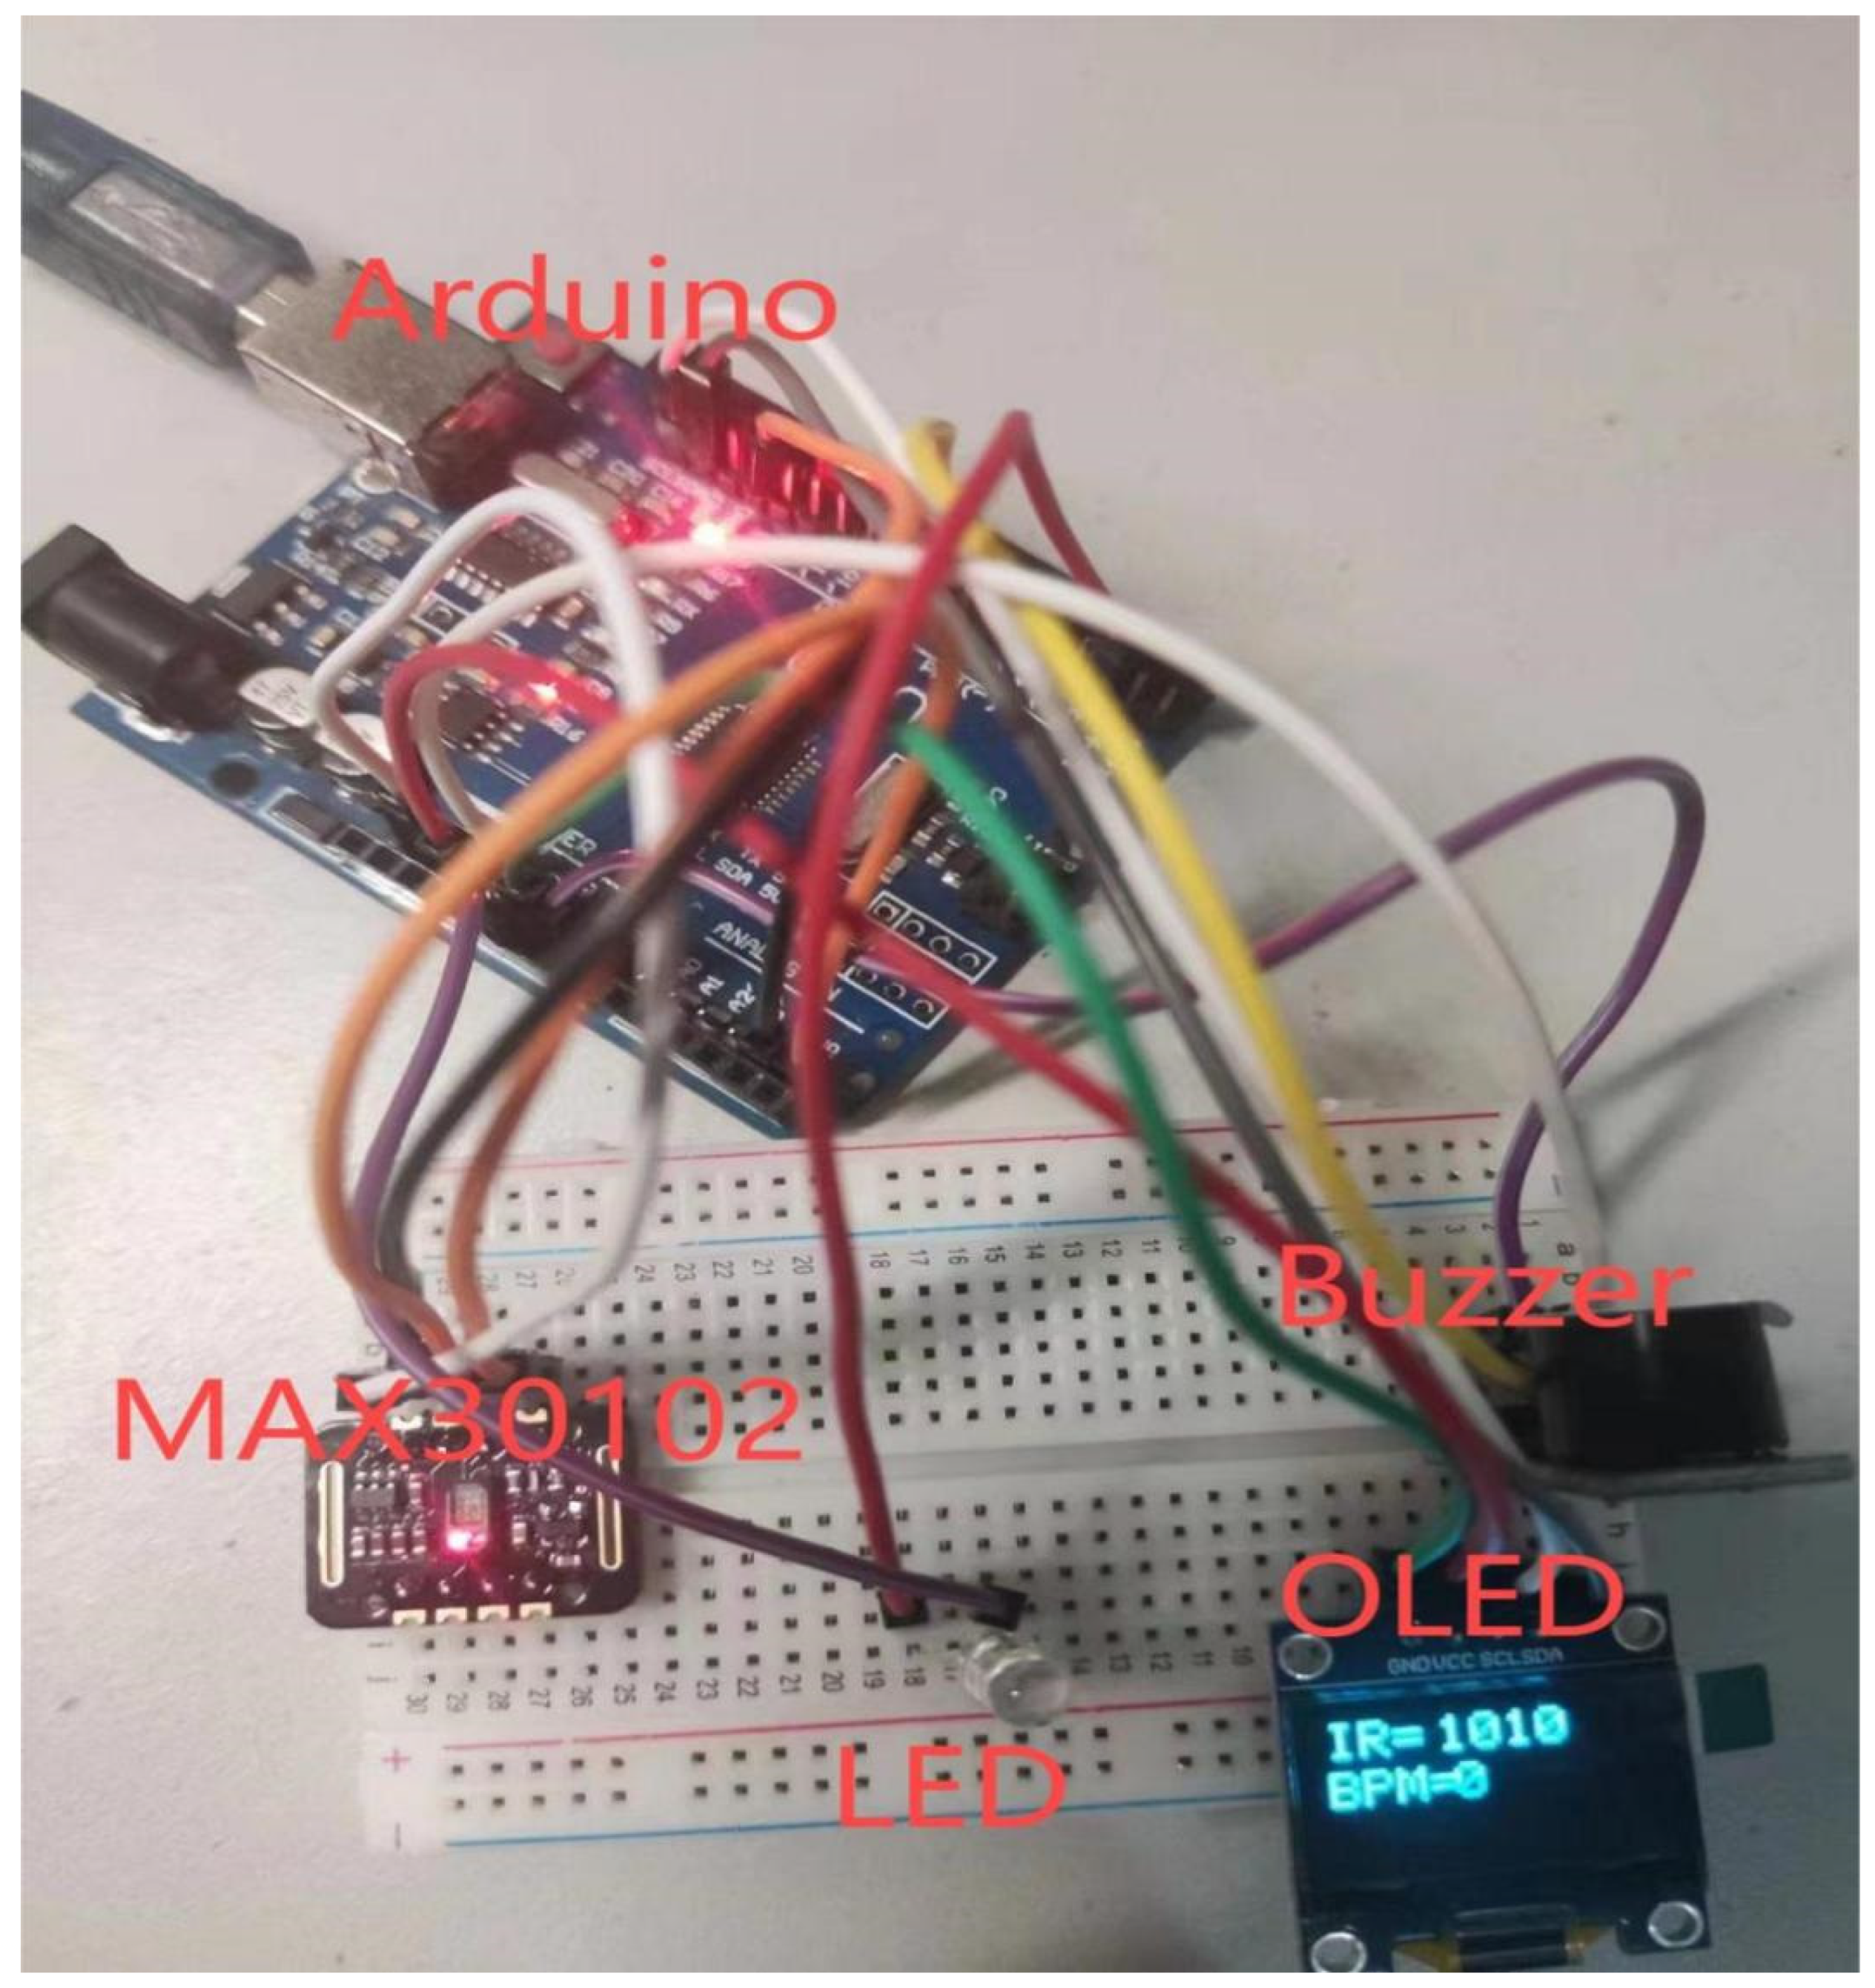
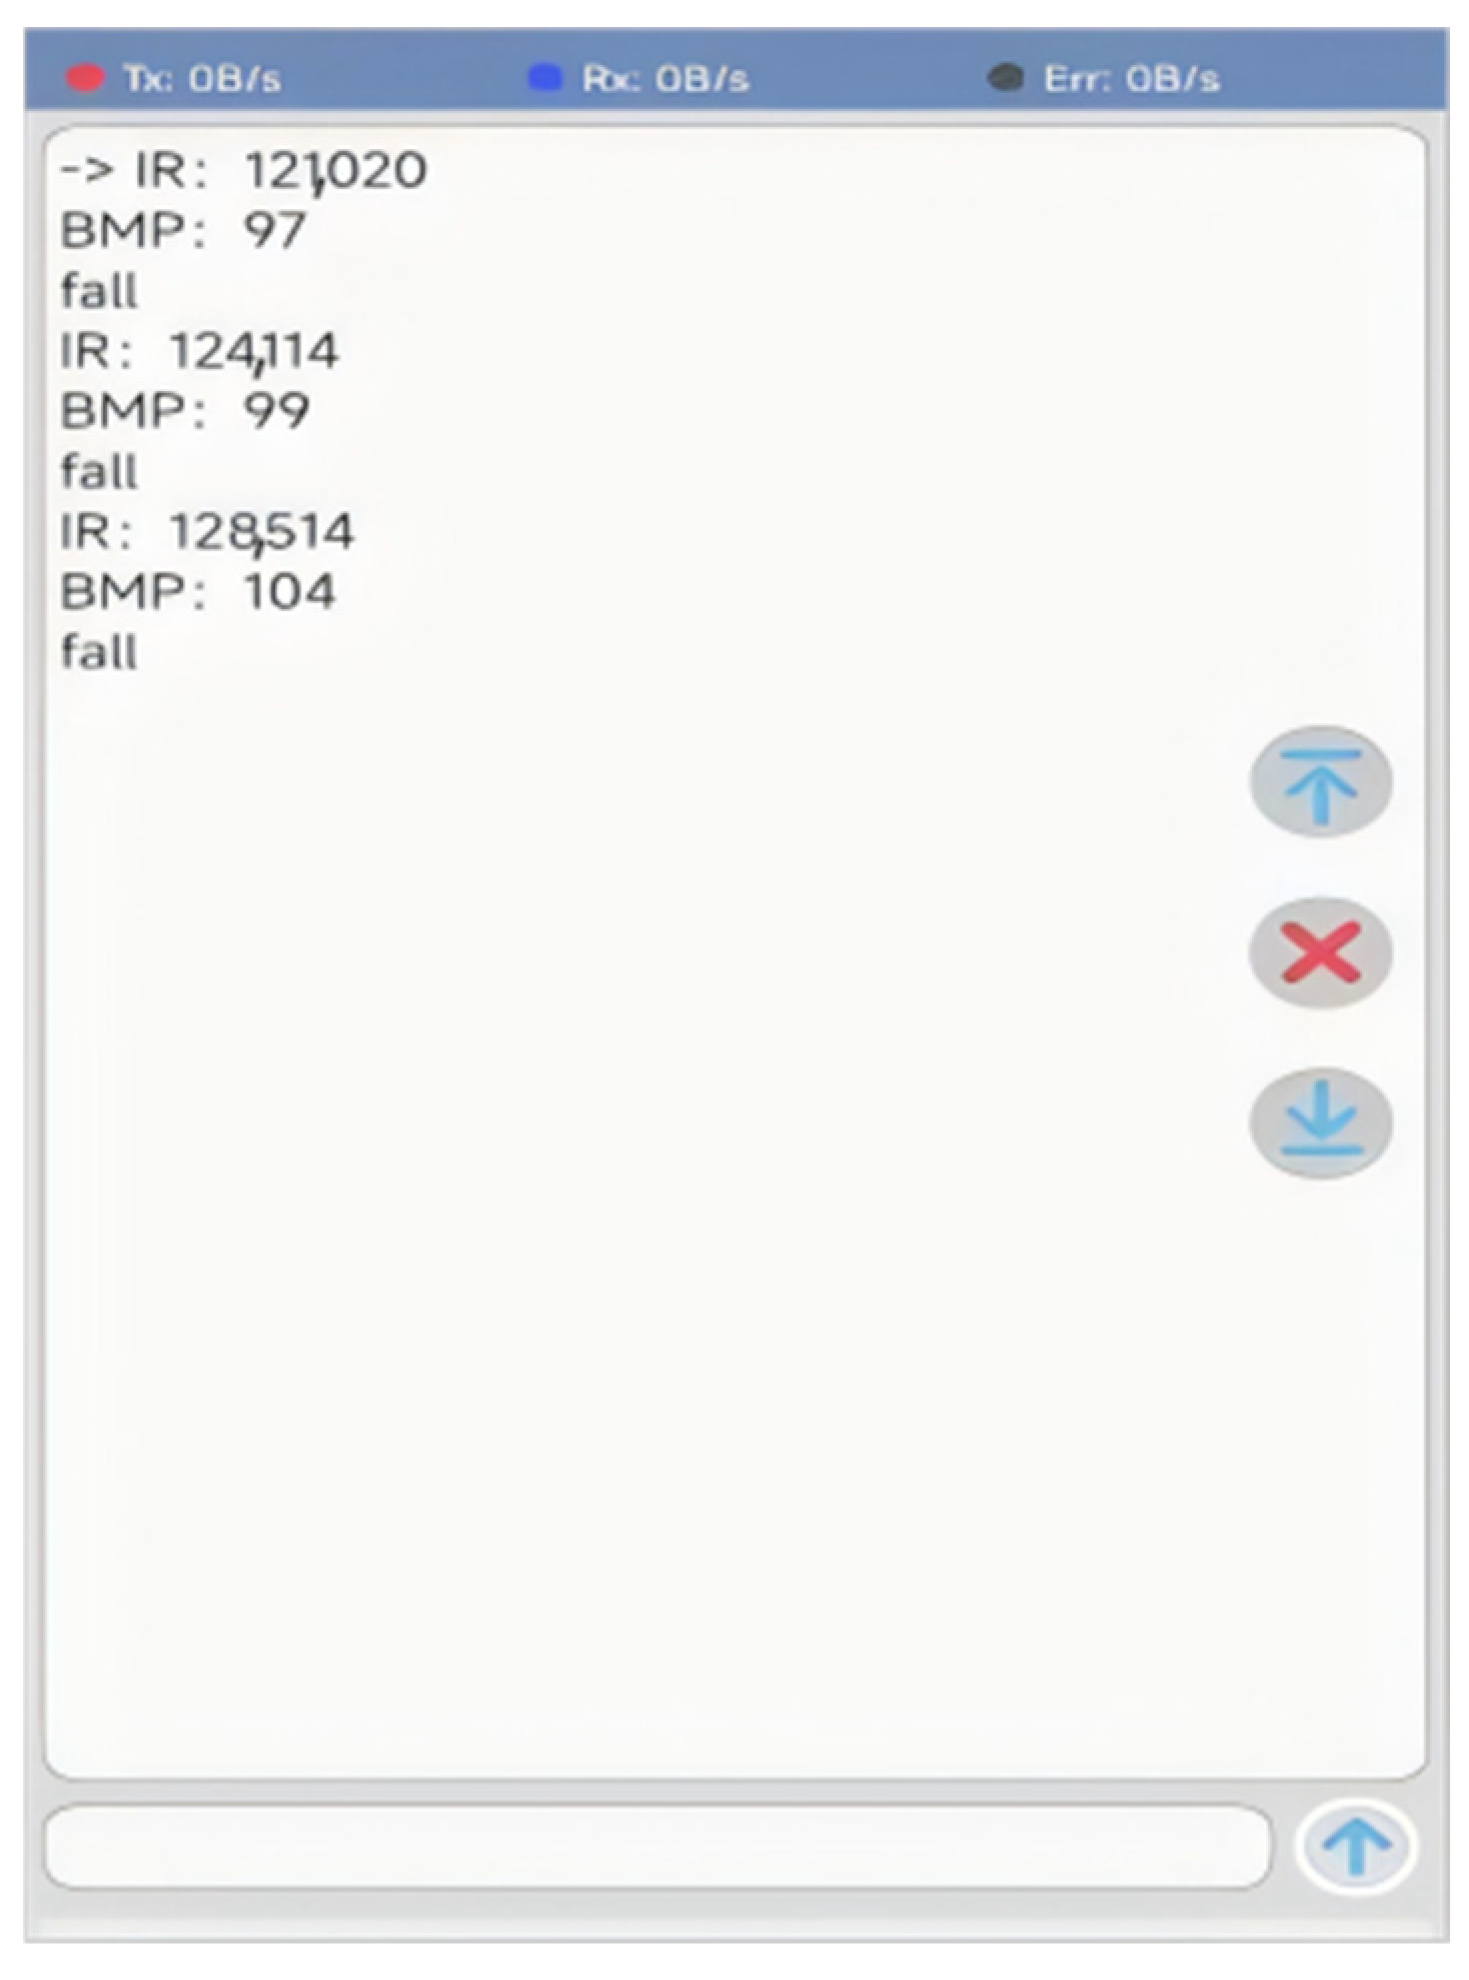
6.3. The Result of Combining Posture Detection with Physiological Data
7. Conclusions
Author Contributions
Funding
Institutional Review Board Statement
Informed Consent Statement
Data Availability Statement
Conflicts of Interest
References
- Sivaprasad, T.C.; Surendhar, R.; Heiner, A.J. Wearable Smart Health Monitoring Transmitter and Portable Receiver Systems for Enhanced Wellness Insights. In Proceedings of the 2023 2nd International Conference on Automation, Computing and Renewable Systems (ICACRS), Pudukkottai, India, 11–13 December 2023; pp. 1558–1563. [Google Scholar] [CrossRef]
- Rasheed, A.; Iranmanesh, E.; Li, W.; Ou, H.; Andrenko, A.S.; Wang, K. A wearable autonomous heart rate sensor based on piezoelectric-charge-gated thin-film transistor for continuous multi-point monitoring. In Proceedings of the 2017 39th Annual International Conference of the IEEE Engineering in Medicine and Biology Society (EMBC), Jeju, Republic of Korea, 11–15 July 2017; pp. 3281–3284. [Google Scholar] [CrossRef]
- Coviello, G.; Florio, A.; Avitabile, G.; Talarico, C.; Wang-Roveda, J.M. Distributed Full Synchronized System for Global Health Monitoring Based on FLSA. IEEE Trans. Biomed. Circuits Syst. 2022, 16, 600–608. [Google Scholar] [CrossRef] [PubMed]
- Nafil, K.; Kobbane, A.; Mohamadou, A.-B.; Saidi, A.; Yahya, B.; Oussama, L. Fall Detection System for Elderly People using IoT and Machine Learning technology. In Proceedings of the 2023 3rd International Conference on Electrical, Computer, Communications and Mechatronics Engineering (ICECCME), Tenerife, Canary Islands, Spain, 19–21 July 2023; pp. 1–5. [Google Scholar] [CrossRef]
- Guo, T.; Wan, F.; Shi, Y. Review of Fall Detection Research Based on Wearable Pressure Sensor. Softw. Eng. 2023, 26, 1–7. [Google Scholar] [CrossRef]
- Yan, B. Research on Fall Detection Method Based on Acceleration and Audio. Master’s Thesis, Yanshan University, Qinhuangdao, China, 2023. [Google Scholar] [CrossRef]
- Zhou, L.; Chen, Y.; Liu, M.; Zhu, C. Human fall detection system based on multi-sensor fusion. J. Air Space Early Warn. Res. 2023, 37, 129–135. [Google Scholar]
- Kiran, S.; Riaz, Q.; Hussain, M.; Zeeshan, M.; Krüger, B. Unveiling Fall Origins: Leveraging Wearable Sensors to Detect Pre-Impact Fall Causes. IEEE Sens. J. 2024, 24, 24086–24095. [Google Scholar] [CrossRef]
- Cheng, S.; Zhang, L.; Chu, Z.; Yu, Y.; Li, X.; Liu, Z. Fall detection system design based on visual recognition and multi-sensor. Transducer Microsyst. Technol. 2024, 43, 91–94. [Google Scholar]
- Zhang, Y.; Liang, W.; Yuan, X.; Zhang, S.; Yang, G.; Zeng, Z. Deep Learning-Based Abnormal Behavior Detection for Elderly Healthcare Using Consumer Network Cameras. IEEE Trans. Consum. Electron. 2024, 70, 2414–2422. [Google Scholar] [CrossRef]
- Zhang, C.C.; Wang, C.; Dai, X.; Liu, S. Camera-Based Analysis of Human Pose for Fall Detection. In Proceedings of the 2023 Congress in Computer Science, Computer Engineering, & Applied Computing (CSCE), Las Vegas, NV, USA, 24–27 July 2023; pp. 1779–1782. [Google Scholar]
- Yin, Y.; Lei, L.; Liang, M.; Li, X.; He, Y.; Qin, L. Research on Fall Detection Algorithm for the Elderly Living Alone Based on YOLO. In Proceedings of the 2021 IEEE International Conference on Emergency Science and Information Technology (ICESIT), Chongqing, China, 22–24 November 2021; pp. 403–408. [Google Scholar] [CrossRef]
- Chen, T.; Ding, Z.; Li, B. Elderly Fall Detection Based on Improved YOLOv5s Network. IEEE Access 2022, 10, 91273–91282. [Google Scholar] [CrossRef]
- Zhu, S.; Qian, C.; Kan, X. High-Precision Fall Detection Algorithm with Improved YOLOv5. Comput. Eng. Appl. 2024, 60, 105–114. [Google Scholar] [CrossRef]
- Song, X.; Luo, Q. Pedestrian fall detection algorithm based on improved YOLOv5. In Proceedings of the 2024 5th International Conference on Computer Vision, Image and Deep Learning (CVIDL), Zhuhai, China, 19–21 April 2024; pp. 1302–1306. [Google Scholar] [CrossRef]
- Chen, Y.; Du, R.; Luo, K.; Xiao, Y. Fall detection system based on real-time pose estimation and SVM. In Proceedings of the 2021 IEEE 2nd International Conference on Big Data, Artificial Intelligence and Internet of Things Engineering (ICBAIE), Nanchang, China, 26–28 March 2021; pp. 990–993. [Google Scholar] [CrossRef]
- Seifeldin, M.A.; El-keyi, A.F.; Youssef, M.A. Kalman Filter-Based Tracking of a Device-Free Passive Entity in Wireless Environments. In Proceedings of the WiNTECH’11, Las Vegas, NV, USA, 19–23 September 2011; ACM: New York, NY, USA, 2011; pp. 43–50. [Google Scholar]
- Wang, Y.; Wu, K.; Ni, L.M. Wifall: Device-free fall detection by wireless networks. IEEE Trans. Mob. Comput. 2016, 16, 581–594. [Google Scholar] [CrossRef]
- Halperin, D.; Hu, W.; Sheth, A.; Wetherall, D. Predictable 802.11 packet delivery from wireless channel measurements. ACM SIGCOMM Comput. Commun. Rev. 2010, 40, 159–170. [Google Scholar] [CrossRef]
- Keenan, R.M.; Tran, L.-N. Fall Detection using Wi-Fi Signals and Threshold-Based Activity Segmentation. In Proceedings of the 2020 IEEE 31st Annual International Symposium on Personal, Indoor and Mobile Radio Communications, London, UK, 31 August–3 September 2020; pp. 1–6. [Google Scholar] [CrossRef]
- Ding, J.; Wang, Y.A. WiFi-based smart home fall detection system using recurrent neural network. IEEE Trans. Consum. Electron. 2020, 66, 308–317. [Google Scholar] [CrossRef]
- Chu, Y.; Cumanan, K.; Sankarpandi, S.K.; Smith, S.; Dobre, O.A. Deep Learning-Based Fall Detection Using WiFi Channel State Information. IEEE Access 2023, 11, 83763–83780. [Google Scholar] [CrossRef]
- Zein, H.E.; Mourad-Chehade, F.; Amoud, H. Leveraging Wi-Fi CSI Data for Fall Detection: A Deep Learning Approach. In Proceedings of the 2023 5th International Conference on Bio-engineering for Smart Technologies (BioSMART), Paris, France, 7–9 June 2023; pp. 1–4. [Google Scholar] [CrossRef]
- Wang, C.; Tang, L.; Zhou, M.; Ding, Y.; Zhuang, X.; Wu, J. Indoor Human Fall Detection Algorithm Based on Wireless Sensing. Tsinghua Sci. Technol. 2022, 27, 1002–1015. [Google Scholar] [CrossRef]
- El Zein, H.; Mourad-Chehade, F.; Amoud, H. Intelligent Real-time Human Activity Recognition Using Wi-Fi Signals. In Proceedings of the 2023 International Conference on Control, Automation and Diagnosis (ICCAD), Rome, Italy, 10–12 May 2023; pp. 1–5. [Google Scholar] [CrossRef]
- He, J.; Zhu, W.; Qiu, L.; Zhang, Q.; Wang, C. An indoor fall detection system based on WiFi signals and genetic algorithm optimized random forest. Wirel. Netw. 2024, 30, 1753–1771. [Google Scholar] [CrossRef]
- Ma, L. Elderly fall monitoring system based on WiFi human behaviour recognition. Electron. Test 2022, 36, 9–11+23. [Google Scholar] [CrossRef]
- Redmon, J.; Divvala, S.; Girshich, R.; Farhadi, A. You Only Look Once: Unified, Real-Time Object Detection. In Proceedings of the 2016 IEEE Conference on Computer Vision and Pattern Recognition (CVPR), Las Vegas, NV, USA, 27–30 June 2016; pp. 779–788. [Google Scholar] [CrossRef]
- Hu, J.; Shen, L.; Sun, G. Squeeze-and-Excitation Networks. In Proceedings of the 2018 IEEE/CVF Conference on Computer Vision and Pattern Recognition (CVPR), Salt Lake City, NT, USA, 18–23 June 2018. [Google Scholar] [CrossRef]
- Hou, Q.; Zhou, D.; Feng, J. Coordinate Attention for Efficient Mobile Network Design. In Proceedings of the 2021 IEEE/CVF Conference on Computer Vision and Pattern Recognition (CVPR), Nashville, TN, USA, 20–25 June 2021; pp. 13708–13717. [Google Scholar] [CrossRef]
- Tan, M.; Pang, R.; Le, Q.V. EfficientDet: Scalable and Efficient Object Detection. In Proceedings of the 2020 IEEE/CVF Conference on Computer Vision and Pattern Recognition (CVPR), Seattle, WA, USA, 13–19 June 2020; pp. 10778–10787. [Google Scholar] [CrossRef]
- Luo, Y. Research and Implementation of Fall Detection Based on Ubiquitous Wireless Signals. Master’s Thesis, University of Electronic Science and Technology of China, Xi’an, China, 2023. [Google Scholar] [CrossRef]
- Hochreiter, S.; Schmidhuber, J. Long Short-Term Memory. Neural Comput. 1997, 9, 1735–1780. [Google Scholar] [CrossRef] [PubMed]


| Parameter | Value | Explanation |
|---|---|---|
| timestamp_low | 1.8345 × 10⁹ | Timestamp |
| Nrx | 3 | Number of receiving antennae |
| Ntx | 2 | Number of transmitting antennae |
| rssi_a | 39 | The received signal strength indicator of the first receiving antenna |
| rssi_b | 33 | The received signal strength indicator of the second receiving antenna |
| rssi_c | 37 | The received signal strength indicator of the third receiving antenna |
| noise | −81 | Noise power |
| csi | 2 × 3 × 30 | Channel state information |
| Network Layer | Output | Learnable Parameter |
|---|---|---|
| Input | 90 × 1 × 1 | ___ |
| Fold | 90 × 1 × 1 | ___ |
| Conv2D | 61 × 1 × 3 | Weights 30 × 1 × 1 × 3 Bias 1 × 1 × 3 |
| BN | 61 × 1 × 3 | Offset 1 × 1 × 3 Scale 1 × 1 × 3 |
| ReLU | 61 × 1 × 3 | ___ |
| MaxPool | 61 × 1 × 3 | ___ |
| Unfold | 61 × 1 × 3 | ___ |
| Flatten | 183 | ___ |
| LSTM | 100 | Input Weights 400 × 183 Recurrent Weights 400 × 100 Bias 400 × 1 |
| Dropout | 100 | ___ |
| FC | 1 | Weights 1 × 100 Bias 1 × 1 |
| Normal Heart Rate | Abnormal Heart Rate |
|---|---|
| 85 | 98 |
| 84 | 99 |
| 87 | 101 |
| 81 | 105 |
| 83 | 105 |
| 89 | 108 |
| 88 | 107 |
| 85 | 109 |
| 86 | 108 |
| Hardware Configuration | Version |
|---|---|
| CPU | 14-core Intel Xeon Gold |
| Memory | 12 Gb |
| GPU | NVIDIA 3080 RTX |
| Operating System | Windows10, 64 Bit |
| Software Configuration | Version |
|---|---|
| Language | Python 3.8 |
| Deep learning framework | Pytorch 1.5.1 |
| GPU engine | Cuda 10.1 |
| Virtual environment | Miniconda3 |
| Model | Determination Coefficient () |
|---|---|
| Original LSTM | 0.65575 |
| CNN | 0.58604 |
| NN | 0.49748 |
| Improved LSTM | 0.75810 |
| Detection Results of the Improved Models | Heart Rate Collected by MAX3012 | Output Results of the Discriminator |
|---|---|---|
| Fall | 99 | fall |
| Fall | 83 | not fall |
| Fall | 103 | fall |
| Fall | 105 | fall |
| Fall | 105 | fall |
| Fall | 104 | fall |
| Fall | 108 | fall |
| Fall | 111 | fall |
Disclaimer/Publisher’s Note: The statements, opinions and data contained in all publications are solely those of the individual author(s) and contributor(s) and not of MDPI and/or the editor(s). MDPI and/or the editor(s) disclaim responsibility for any injury to people or property resulting from any ideas, methods, instructions or products referred to in the content. |
© 2024 by the authors. Licensee MDPI, Basel, Switzerland. This article is an open access article distributed under the terms and conditions of the Creative Commons Attribution (CC BY) license (https://creativecommons.org/licenses/by/4.0/).
Share and Cite
Bui, T.; Liu, J.; Cao, J.; Wei, G.; Zeng, Q. Elderly Fall Detection in Complex Environment Based on Improved YOLOv5s and LSTM. Appl. Sci. 2024, 14, 9028. https://doi.org/10.3390/app14199028
Bui T, Liu J, Cao J, Wei G, Zeng Q. Elderly Fall Detection in Complex Environment Based on Improved YOLOv5s and LSTM. Applied Sciences. 2024; 14(19):9028. https://doi.org/10.3390/app14199028
Chicago/Turabian StyleBui, Thioanh, Juncheng Liu, Jingyu Cao, Geng Wei, and Qian Zeng. 2024. "Elderly Fall Detection in Complex Environment Based on Improved YOLOv5s and LSTM" Applied Sciences 14, no. 19: 9028. https://doi.org/10.3390/app14199028
APA StyleBui, T., Liu, J., Cao, J., Wei, G., & Zeng, Q. (2024). Elderly Fall Detection in Complex Environment Based on Improved YOLOv5s and LSTM. Applied Sciences, 14(19), 9028. https://doi.org/10.3390/app14199028