Abstract
This paper explores the combination of a data mining-based state evaluation method for electrical equipment in substations, analyzing the effectiveness and accuracy. First, a Gaussian mixture model is applied to fit all raw data of electrical equipment. The Expectation Maximization algorithm summarizes the data distribution characteristics and identifies outliers. The a priori algorithm is then employed for data mining to derive frequent itemsets and association rules between equipment quality and measurement data. For new equipment samples, conditional probabilities of each feature are independently calculated and combined to classify and evaluate equipment quality. The results suggest that equipment reliability in smart substations can be inferred from historical and real-time operational data using improved association rule algorithms and Naive Bayes classifiers. Finally, the proposed method was applied to analyze statistical data from a 110 kV substation of a power supply company. The states prediction accuracy exceeded 95% when compared with actual equipment quality. The effectiveness evaluation metrics demonstrated that this method outperforms single-category algorithms in terms of accuracy and discrimination ability.
1. Introduction
Smart substations, essential to modern power transmission and distribution systems, face complex challenges in equipment status assessment. Rapid artificial intelligence (AI) advancements have improved substation equipment monitoring and evaluation, enhancing system reliability and efficiency. AI technology robustly supports the safe and economic operation of modern power systems.
Smart substations generate vast amounts multidimensional operational data, including temperature, mechanical parameters, and power load. Traditional manual analysis methods are time-consuming and error prone. AI algorithms efficiently process data through data mining and machine learning, transforming raw data into valuable insights. Ref. [1] proposes that recurrent neural networks (RNNs) can capture dynamic equipment status changes in substation operational time-series data. This improves data processing speed and state assessment accuracy, aiding fault diagnosis. Ref. [2] employs a self-organizing map (SOM) to analyze the comprehensive value of transformer fault gas. AI can pre-emptively identify fault risks and issue early warnings. AI and data fusion techniques enable multisource data analysis [3]. For instance, combining temperature anomaly detection and vibration data analysis enables more accurate differentiation between internal faults and environmental factors. AI models autonomously update parameters based on operational data, adapting to new environments and fault modes. This enables intelligent substations to effectively manage operational uncertainties [4]. Artificial intelligence algorithms significantly reduce unplanned downtime through real-time monitoring and precise evaluation, outperforming traditional manual inspection and maintenance [5].
State evaluation is crucial for smart substation operations, ensuring grid safety, reliability, and efficiency. Continuous optimization of data mining, big data analysis and AI technology can further enhance intelligent substations performance and robustness. Ref. [6] proposed a fault assessment method for measurement and control devices based on the Markov model, using spectral clustering to evaluate substation equipment reliability. The model incorporates hardware, software, auxiliary equipment, and human-related faults. Spectral clustering analysis learns key point similarities, generates charts, and performs data clustering. A multidimensional fuzzy comprehensive evaluation method was proposed for online substation equipment monitoring, based on comparisons of data quality methods [7,8]. The method establishes a two-layer data evaluation set, fuzzy relationship matrices and data weights to quantitatively score online monitoring data, demonstrating effectiveness. Ref. [9] points out that substation operation and maintenance inspections generate substantial data while ensuring normal equipment operation. The study elaborates on data mining applications in daily inspections, defect management, and fault analysis. Future equipment status and monitoring data are predicted using trend extrapolation, predictive modeling, and least squares regression. A Lyapunov prediction model for equipment defects and malfunctions is developed using historical data and case studies. Inspection datasets serve as test sets for defect or malfunction prediction, enabling continuous model refinement. Analyzing equipment status using image data and deep convolutional neural networks (CNNs) is viable for intelligent substation equipment evaluation [10]. Multisource monitoring using edge computing and CNNs enhances efficiency in comprehensive substation equipment health evaluation. YOLOv4 incorporates CSPNet, enhancing relevant feature channels while suppressing less important ones. Additionally, PANet utilizes depth-wise separable convolution, enhancing efficiency and evaluation performance. Ref. [11] proposed an electrical equipment defect detection method based on clustering analysis and a priori algorithm. The study employs graph computing to construct an automatic defect identification model for major substation equipment, including transformers and circuit breakers. This model integrates multisource heterogeneous data to assess defect susceptibility across equipment from various manufacturers and production batches. A condition cleaning algorithm eliminates duplicate and false combinations, improving defect detection accuracy and efficiency.
Association rule mining uncovers potential key relationships between database attributes. The a priori algorithm, a prominent association rule method, is widely applied due to its simplicity and efficiency in processing large datasets [12]. However, the basic a priori algorithm often struggles to mine rules of user interest effectively [13,14]. The a priori algorithm typically relies on discretization or frequency thresholding methods when calculating frequent itemsets—it may overlook low-frequency rules with significant correlations [15]. The frequent itemset definition in the a priori algorithm’s rule mining process may result in key rules omission. Recent research proposes methods to improve the a priori algorithm’s handling of continuous data. Combining K-means clustering with the a priori algorithm enhances its applicability and accuracy for continuous data through discretization [16]. Researchers propose using probability distributions for continuous data processing, improving association rule reliability and statistical significance [17]. This approach emphasizes probabilistic modeling in data mining for more accurate and practical rules.
The improved a priori algorithm shows considerable promise in improving the accuracy of electrical equipment state assessments. Further research is warranted to analyze the integration of the enhanced a priori algorithm with the Naive Bayes classifier. The Naive Bayes classifier, renowned for its computational efficiency and simplicity in classification tasks, presents potential enhancements for state evaluation models [18]. The integration of these two methods can enhance the identification of equipment status characteristics while maintaining the detection of crucial rules. The amalgamation of the a priori algorithm and Naive Bayes classifier presents a novel approach to tackling the aforementioned challenges. The Naive Bayes classifier, known for its simplicity and efficiency, effectively mitigates the limitations of the traditional a priori algorithm in classification tasks when integrated [19]. This integrated model facilitates both association rule mining and comprehensive rule classification and analysis, substantially improving the accuracy and reliability of state evaluation. Table 1 summarizes the latest trends in electrical equipment state evaluation and data mining research.

Table 1.
Summary of reference work.
This paper proposes a data mining-based method for assessing the state of electrical equipment in smart substations. It aims to evaluate the reliability of diverse electrical equipment by analyzing historical and real-time operational data, using a combination of improved association rule algorithms and Naive Bayes classifiers. The method consists of three primary phases: data preprocessing, association rule mining, and equipment classification. A Gaussian mixture model is employed to fit the original dataset, with the expectation-maximization algorithm to summarize data distribution characteristics and filtering outliers. The a priori algorithm is applied to the preprocessed dataset to identify frequent itemsets and derive association rules, which are then used for model training. For new equipment samples, conditional probabilities of each feature are independently calculated and combined. This process enables the evaluation of electrical equipment status. The scheme achieves high computational efficiency by determining crucial operating characteristics of electrical equipment (such as insulation resistance, contact resistance, mechanical properties) and identifying their influence on equipment failure.
The proposed methodology presents several advantages compared to existing electrical equipment status assessment techniques:
- The proposed state assessment algorithm integrates the a priori algorithm with a Naive Bayes classifier. The former efficiently identifies frequent itemset, revealing operational patterns and correlations, including co-occurrence of equipment failures under specific conditions. This provides valuable input for subsequent state classification. The Naive Bayes classifier utilizes the association rules discovered by a priori to swiftly classify device states, enhancing predictive capabilities in specific contexts.
- Gaussian mixture models are employed to unify state characteristics of electrical equipment across varying environments, loads, and operating conditions. These models provide a cohesive description of state features, identifying commonalities and differences across states, offering high flexibility and adaptability. This approach minimizes the impact of environmental interference and varying working conditions on status monitoring data, enhancing the reliability of final evaluation results.
This paper is structured as follows: Section 1 provides a basic introduction, discussing substation development and current trends in electrical equipment evaluation methods. Section 2 presents a comprehensive explanation of the proposed algorithm. It begins by introducing characteristics of substation electrical equipment status assessment, including equipment types and status data acquisition methods. Then, it explores effective information dataset extraction techniques and details the collaborative application of a priori algorithm and Naive Bayes classifiers for device state classification and evaluation. Finally, this section validates the efficacy of the proposed data mining-based smart substation state evaluation method and algorithm. Section 3 summarizes this paper and proposes future research directions.
2. Methodology
This section outlines the stepwise process for developing an electrical equipment state evaluation model, starting with dataset preparation. The initial phase involves preprocessing to consolidate equipment test data, online monitoring data, and human observations. Following preprocessing, clustering and association rule analysis are performed to discern relationships between equipment states (abnormal, intact, or faulty) and anomalous patterns or outliers in the observation data. Based on these analyses, evaluation model rules are formulated to assess the state of electrical equipment in Figure 1.
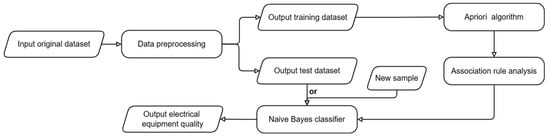
Figure 1.
Flowchart of method process.
2.1. Equipment Status Characteristics
A substation’s high-voltage electrical equipment primarily consists of transformers, circuit breakers, voltage transformers, current transformers, surge arresters, and capacitor banks. These devices serve multiple functions: voltage transformation, circuit interruption or connection, high-voltage current/voltage measurement, and lightning overvoltage protection, collectively ensuring stable power transmission and distribution. Substation state evaluation focuses on defining and assessing the current condition of these devices, quantified through testing and online monitoring.
Electrical testing methods evaluate equipment insulation and functionality to determine its operational viability within the system. The predominant method involves comparing current test values with those recorded at equipment delivery or manufacturer-specified ranges. Post-test analysis of deviations from these reference values, coupled with expert assessment, determines equipment condition. Online monitoring utilizes various sensors to capture real-time equipment parameters. The data are transmitted to a monitoring system for assessment by personnel or automated analysis systems. In a substation, the Supervisory Control and Data Acquisition (SCADA) system integrates online monitoring data from various devices via specialized modules. Transformer monitoring data include winding and oil temperature (via temperature sensors), current and voltage (via current transformers and voltage transformers), dissolved gas analysis (via gas chromatography), and insulation status (via insulation monitoring systems). Switchgear monitoring data comprise: switch operation count and status (via position sensors), temperature (via temperature sensors), and operating current (via current transformers). Switchgear cabinet monitoring data encompass internal or external temperature (via temperature sensors), internal humidity (via humidity sensors), and partial discharge (via specialized monitoring devices). Lightning arrester monitoring data include leakage current (via leakage current tester) for performance evaluation and discharge frequency (via discharge counter) to track operational conduction events. Capacitor monitoring primarily focuses on the temperature of capacitors and their peripheral devices, measured via temperature sensors. Cable monitoring data encompass cable sheath and internal temperatures (via temperature sensors), partial discharge (via specialized monitoring devices).
The substation environment influences internal equipment, necessitating regular inspections by operation and maintenance personnel. These inspections focus on aspects beyond automated monitoring, including temperature at contact and wire connection points, inspection of aluminum stranded wire integrity, assessing of plants or animals’ interference environmental temperature and humidity recording, oil level checks in oil-filled equipment, and SF6 equipment gas pressure monitoring [20,21].
Substations typically employ two transformer types: main power transformer (oil-filled) for voltage exchange and energy distribution, and station power transformers (dry-type) for powering station equipment. Circuit breakers are mainly categorized as gas-insulated switchgear (GIS), SF6 circuit breakers, oil circuit breakers, and vacuum circuit breakers. GIS or SF6 circuit breakers are typically employed on the high-voltage side, while switchgear is utilized on the low-voltage side. The three primary transformer types are current transformers, electromagnetic voltage transformers, and capacitive voltage transformers [22,23,24]. Table 2 delineates the monitoring parameters for each equipment type.
Table 2.
High-voltage electrical equipment quantification items.
2.2. Data Analysis
The research analyzed three sources of electrical equipment status monitoring data: experiment tests, online monitoring, and human inspections. This section introduces the dataset model.
Due to current technological constraints, numerous electrical equipment tests must be conducted during power outages. The resulting data reflects the inherent properties of the equipment. The status information includes test date, test items, measured values, ambient conditions (temperature and humidity), and potentially analysis results from test personnel [25]. These attributes are categorized into three types: comparison, verification, and destructive testing. For instance, comparing resistance values with factory or previous test values belongs to the comparison category. Polarity and phase checks fall under verification, while various withstand voltage tests are classified as destructive testing.
Online monitoring devices utilize various sensors to collect real-time data during power grid operation. This data represents the operational information of electrical equipment. It encompasses basic parameters (voltage, current, frequency) and advanced metrics (winding and oil temperatures, dissolved gases, circuit breaker operations, contact resistance, operating time, switchgear characteristics, and partial discharge conditions). These attributes are classified into comparison and validation categories. Unlike experimental data, real-time monitoring yields a more extensive dataset. The dataset selectively incorporates data points that significantly deviate from mean values or exhibit anomalous characteristics.
Human inspection data, unlike experimental and online monitoring data, often poses digitization challenges. Quantifiable data is predominantly confined to instrument and meter measurements. Sensory observations (visual, olfactory, tactile) introduce subjectivity in assessments, including evaluations of equipment condition, environmental factors, and potential faunal threats. Despite their inherent subjectivity, these observations often identify issues that may escape detection by experimental or online monitoring methods. A tripartite logical coding system standardizes this subjective data: 1 (affirmative/good), 0 (negative/bad), and 2 (uncertain). This numerical conversion enhances subsequent data processing and analysis.
The data feature mining processes categorize raw data into discrete and continuous values across multiple scales. This feature entry heterogeneity may influence rule establishment. A mixture Gaussian algorithm is employed to discretize values and achieve quantitative similarity [26].
The discretization process of the Gaussian mixture model begins with collecting substation electrical equipment state data. Let the dataset be , where each denotes a sample.
The ‘fitdist’ function is used to fit the data and select an appropriate probability distribution model.
The Gaussian mixture models (GMM) parameters are initialized via K-Means clustering establishing initial mean , covariance matrix , and mixing coefficient .
In the E-step of the Expectation Maximization (EM) algorithm, the sample’s probability density function is computed,
And the posterior probability of each sample belonging to each Gaussian component is calculated,
In the M-step, GMM parameters are updated.
Figure 2 illustrates the data preprocessing workflow. This process integrates minor data variations and independent data unrelated to other features. The main goals are to maintain inter-data feature correspondences and achieve approximate sample size parity across features.
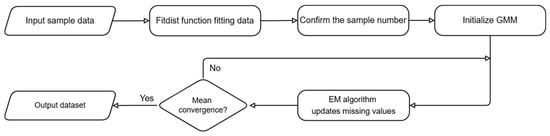
Figure 2.
Flowchart of data preprocessing.
2.3. Association Rules
Equipment status analysis and evaluation involve identifying co-occurring features and isolating relevant elements from the broader feature set. Association rules are then derived to clarify relationships between equipment statuses, facilitating current assessment and future prediction based on real-time data.
For this purpose, the a priori algorithm is employed. The a priori algorithm iteratively generates candidate itemsets, comparing them against a predetermined threshold for requirement fulfillment. This process continues until all possible itemsets re-evaluated and frequent itemsets are identified [27,28,29].
The initial step involves extracting frequent itemsets from the dataset. Given k candidate items in the overall itemset, the itemset is defined as . The candidate itemset 1 for the first iteration is .
After creating the candidate set, the algorithm scans the transaction database to compute support values for each candidate itemset.
It can be understood as the ratio of the number containing the set of items to the total number . Then, record all items with support value greater than or equal to the threshold as frequent 1 itemset
Assuming , a candidate 2-itemset generated from . Similarly, the support for each candidate itemset is calculated
All items with support greater than or equal to the threshold are recorded as frequent itemsets
This process iterates until or , completing frequent itemset generation. The final frequent itemset is the union of all . Figure 3 illustrates this process flow.
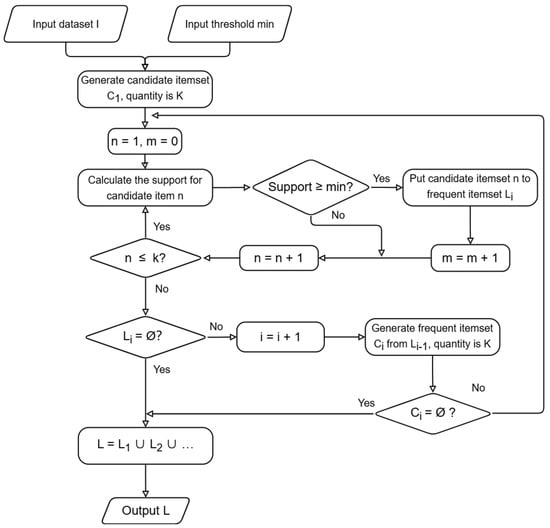
Figure 3.
Flowchart for searching frequent itemsets.
Association rules are calculated for itemset given the occurrence of itemset . Multiple indicators are used to evaluate these rules.
Confidence, or conditional probability in statistics, indicates the correlation degree between two itemsets [30]. It is mathematically expressed as
The algorithm sets a minimum confidence threshold, . When the confidence level is higher than value, the association rules are considered acceptable and further evaluated using other indicators.
Lift, another evaluation metric, is calculated as
A lift value is greater than one indicates a positive correlation, suggesting ’s occurrence increases ’s likelihood [13,31]. This metric helps determine the association strength between itemsets.
Cosine similarity, often used to define rule strength, is calculated as:
Values range from zero to one, with higher values indicating stronger association rules.
2.4. Methods of State Evaluation of Electrical Equipment
Each record is labeled based on the data recording device’s current status (e.g., intact, attentive, abnormal). If the device’s current status is indeterminate, it is marked as ‘uncertain’. The a priori algorithm is applied to discover association rules for state evaluation using labeled historical data. Discovered rules are evaluated using the aforementioned indicators to identify the most significant. Equipment status assessment accuracy is analyzed and estimated using historical evaluation data.
For state judgment, ri denotes the prerequisite length of each association rule, where i is the rule number, reflecting dataset-specific rules. The is defined as the ratio of items between two different datasets in the same state. The state–dataset relationship is analyzed based on these criteria:
- Combine association rules with higher value for the same state.
- For rules with equal value, select the one with the highest confidence for that state.
- For rules with equal value, choose the one with higher value as the state’s association rule.
Figure 4 illustrates the process of determining current device status using the monitoring dataset.

Figure 4.
Flowchart for obtaining the status of electrical equipment. (i is the rule number, coveri is the cover rate, confi is the confidence value, cosi is the cosine value of this rule).
After mining electrical equipment state evaluation data, a Naive Bayes classifier assesses observation data of unknown states. The Naive Bayes classifier determines device states as follows.
Let be the training set of elements and related class labels, where each unit is an n-dimensional vector .
Calculate the conditional probability of for each given feature X in different categories n times based on the attribute. By
The probability of the feature belonging to a specific state is calculated, then determines the probability of each state.
The final prediction synthesizes these results [32,33].
Figure 5 shows the flowchart of this process.
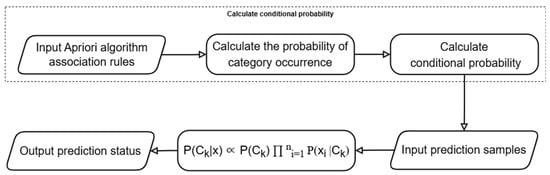
Figure 5.
Flowchart for state evaluation of new samples.
2.5. Case Study
This paper aims to evaluate the quality of various electrical equipment in a substation. Data from a 110 kV substation, operated by a power supply company was used to analyze the effectiveness of data mining-based state evaluation for electrical equipment. The 110 kV substation is equipped with: (1) Two 110 kV incoming lines with GIS, including three sets of circuit breakers and isolation switches on both sides, three sets of current transformers, two capacitive line voltage transformers, one set of 110 kV bus voltage transformers and lightning arresters. (2) A 50 MVA main transformer (3) Seven 10 kV outgoing lines with supporting electrical equipment using armored movable indoor AC metal-enclosed switchgear. Each outgoing cable is equipped with a parallel lightning arrester at its front end. (4) A 10 kV bus is connected to station power transformers, bus voltage transformers, and two sets of capacitor banks.
- (1)
- Effectiveness analysis
The GIS was used to validate the proposed electrical equipment state evaluation methods. Data from various sources, including online monitoring, testing, operation, maintenance, and environmental factors, were used to assess its operational status. This approach assumes that all data accurately reflect the real state of the equipment. The dataset was split into a training set (70%) and a test set (30%). The training set was used to identify key factors influencing equipment quality and to uncover the influence mechanisms and strong association rules. The test set was used to evaluate the quality assessment methodology, thereby validating its accuracy.
The study dataset includes GIS data samples from three sources: routine tests, online monitoring, and inspections. The correct functioning of GIS depends on four main components: conductors, insulators, cooling medium and mobile contacts. In the data samples, beyond general environmental factors such as time, weather, temperature, and humidity, loop resistance and external contact temperature are used to represent conductive factors. The insulation resistance characteristics are used to account for the insulating factors. And the SF6 moisture content and air pressure features accounts for cooling medium factors. The moving contact factor is reflected by operating time characteristics. Table 3 summarizes the features included in each data sample.
Table 3.
Data sample characteristics.
To investigate the interrelationships among various GIS status data in the substation environment, raw data samples were preprocessed using Gaussian mixture models before applying the a priori algorithm. Table 4 shows the distribution of data processed by the Gaussian mixture model. The internal structure and features of the data are described based on the center position and distribution shape of each cluster [34].
Table 4.
High voltage electrical equipment quantification items.
The primary finding was that specific combinations of conditions correlate with particular states of electrical equipment quality.
Table 5 presents selected association rules extracted from the dataset using the a priori algorithm. The minimum support and minimum confidence thresholds were set to 4% and 80%, respectively. The support, confidence, and lift metrics of the rules depend on data balancing and mixing processes. The prefix number for each variable indicates the attribute index, which is applicable to repeated transactions with distinct attributes. Rules extracted based on these thresholds are considered reliable and useful, as the statistical relationships between antecedents and consequents are validated in the main unbalanced dataset. However, the metrics of rule support, confidence, and lift are valid only within the respective sub-datasets created through record relabeling and balancing.
Table 5.
Association rules extracted from Table 4 (excerpt).
Table 5 provides evaluation criteria for the rules. For instance, the first four rules suggest that temperature and humidity significantly influence the on–off performance of switches. In humid summer conditions, slightly exceeding the on–off time may cause equipment failure, even without affecting usage. Severely exceeding the on–off time will inevitably lead to equipment issues. The pressure of SF6 consistently aligns with both human observations and equipment testing results. These parameters can be quickly assessed through equipment testing in emergency situations, reducing decision-making time. The temperature of the equipment’s external contacts is influenced by ambient environment and equipment load, rather than solely the contact surface condition. In high-temperature conditions, the equipment’s temperature rises due to elevated ambient temperature, increased cooling load from air conditioning and other devices further contributes to additional heat generation in conductors.
Naive Bayes classification calculates the posterior probability of a sample belonging to a specific category based on available evidence. The sample is then assigned to the category with the highest posterior probability. This discussion focuses solely on probability parameters, as the Naive Bayes classifier does not require learning structural parameters. The trained Bayes classifier processes the test dataset by determining the posterior probability of states based on association rules between mined states and metrics (Equations (13) and (14)). Using the data mining model to determine the a priori probability. The model’s effectiveness is validated by comparing its detection criteria, based on the attributes of derived rules, with the state parameters of the test sample set. Figure 6 illustrates the prediction results of the test set.
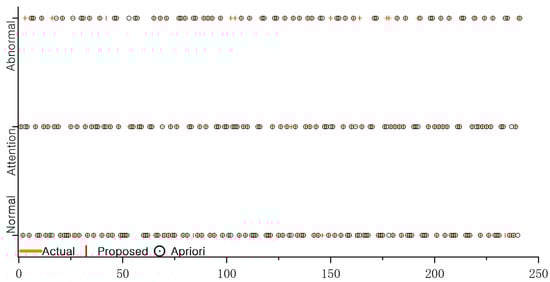
Figure 6.
Comparison between predicted results and actual results.
Figure 6 compares the predictive evaluation model with the actual dataset. In this figure, horizontal axis represents the labeling of test samples, and vertical axis represents the quality of the electrical equipment. The symbol ‘-’ denotes equipment quality recorded in data samples, ‘|’ represents the results obtained by using the fusion proposed in this paper of the a priori algorithm with Naive Bayes classification. And ‘o’ represents the results obtained using a priori algorithm alone. Comparative analysis reveals that the proposed algorithm achieves an accuracy of 96.68%, surpassing the a priori algorithm’s accuracy of 89.21%. These results indicate strong consistency with the training dataset, improved electrical equipment status prediction. Furthermore, there is significantly enhanced accuracy of the proposed method compared to the a priori algorithm alone.
- (2)
- Comparison and analysis of effectiveness
To compare the effectiveness of the proposed electrical equipment condition assessment method with other classifier algorithms, we used data from various sources related to the main transformer, including online monitoring, testing, operation and maintenance, and environmental factors. Next followed the process described in (1), using 70% of the dataset as a training set and 30% as a test set for quality assessment of the electrical equipment. Then, we compared our method’s effectiveness with other classifier algorithms using various performance metrics to predict the main transformer results: accuracy, recall, precision, F1-score, receiver operating characteristic (ROC) curve, and area under the curve (AUC).
Table 6 shows the distribution of data processed by the Gaussian mixture model.
Table 6.
Distribution of processed data.
Table 7 presents association rules mined using the method described in Section 2.4.
Table 7.
Association rules extracted from Table 6 (excerpt).
The method used these association rules to form probability parameters, then inputs the test dataset into a trained Naive Bayes classifier. The predicted results were organized into a 3 × 3 confusion matrix in Figure 7a. To evaluate the classifier’s performance, the project adjusted the statistical form to compare predicted and actual states, as shown in Figure 7b–d.
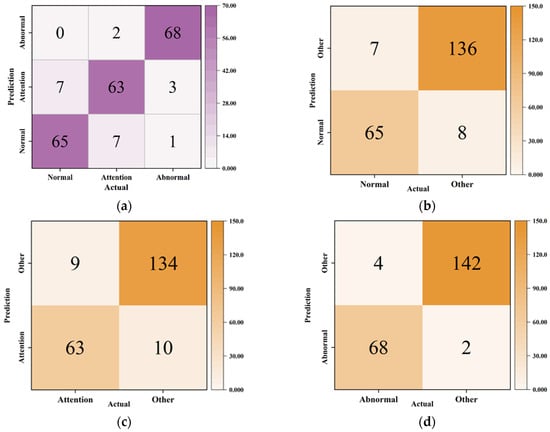
Figure 7.
The confusion matrix of this method: (a) 3 × 3 confusion matrix; (b) normal state confusion matrix; (c) attention state confusion matrix; (d) abnormal state confusion matrix.
The confusion matrix has four metrics:
- True positive (TP): Both actual and predicted states belong to this state.
- True negative (TN): Neither actual nor predicted states belong to this state.
- False positive (FP): The predicted state belongs to this state, but the actual state does not.
- False negative (FN): The actual state belongs to this state, but the predicted state does not.
The performance metrics are calculated as follows:
In the ROC curve, horizontal axis represents the false positive rate (FPR), proportion of incorrect predictions among samples with negative actual state. And vertical axis represents the true positive rate (TPR), proportion of correct predictions among samples with positive actual state. Performance is quantified by AUC, with higher values indicating better performance. The multiclass problem was transformed into three binary classification problems. For each category, the other categories were grouped together and an AUC value was calculated for each binary problem. These individual AUC values were combined to evaluate overall performance [35].
To compare the classifier’s performance with other models (e.g., Support Vector Machine (SVM) and K-Nearest Neighbor (KNN)), all experiments were conducted using MATLAB 2023a.
Figure 8 and Figure 9 display the confusion matrices for KNN and SVM, respectively. Figure 10 presents the ROC curves and AUC values for each model. Table 8 summarizes the performance metrics across three states (normal, attention, and abnormal) for each model, with Figure 11 illustrating these metrics as a bar chart.
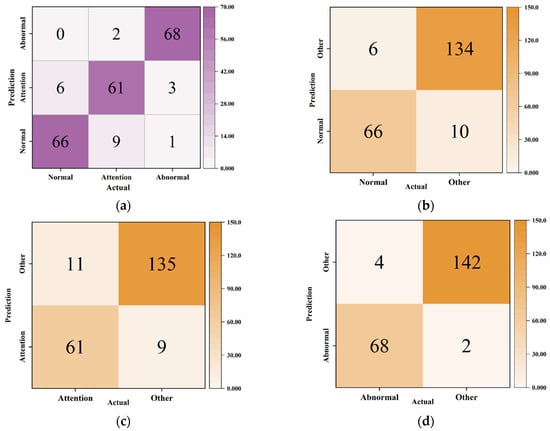
Figure 8.
The confusion matrix of the SVM model: (a) 3 × 3 confusion matrix; (b) normal state confusion matrix; (c) attention state confusion matrix; (d) abnormal state confusion matrix.
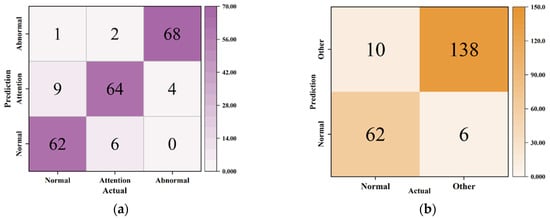
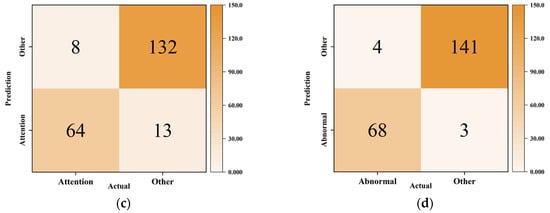
Figure 9.
The confusion matrix of the KNN model: (a) 3 × 3 confusion matrix; (b) normal state confusion matrix; (c) attention state confusion matrix; (d) abnormal state confusion matrix.
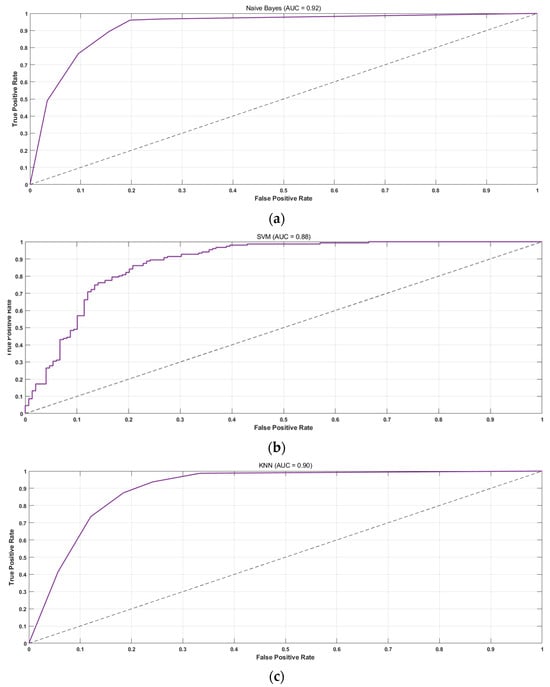
Figure 10.
ROC curves: (a) the proposed method; (b) the SVM model; (c) the KNN model.
Table 8.
Performance metrics for each method.

Figure 11.
Bar chart of performance metrics.
The proposed method demonstrates superior classification performance in normal and attention states. While its performance in abnormal states is marginally lower than the SVM model, it still outperforms in terms of accuracy and recall for abnormal states. The method’s superior performance is evidenced by higher AUC values and improved ROC curves, showing reduced FPR and enhanced TPR. This performance provides a reliable foundation for assessing electrical equipment reliability and informing decisions on shutdown, inspection, or maintenance requirements.
3. Conclusions
This study presents a data mining-based algorithm for evaluating electrical equipment status in substations. The algorithm combines the a priori and Naive Bayes algorithms to assess the current state of electrical equipment. The implementation of GMM for unifying electrical equipment state feature data enables more comprehensive data utilization compared to alternative evaluation methods. The a priori algorithm efficiently processes large-scale data, while the Bayes classifier utilizes the derived association rules for classification. This approach enhances accuracy in conditional probability estimation and improves overall classification performance. The proposed method’s applicability and effectiveness were assessed using diverse status monitoring data from operational substations. Results indicate the scheme’s viability for practical implementation in substation environments.
The feasibility of the proposed method was evaluated using statistical data from electrical equipment in a 110 kV substation of a power supply company. The evaluation process involved three steps: applying a Gaussian mixture model to analyze and discretize the GIS data, employing the a priori algorithm to derive frequent itemsets and association rules between electrical equipment quality and measurement data, and utilizing these rules to predict GIS quality through a Naive Bayes classifier. The method achieved a state prediction accuracy exceeding 95% when compared to the original dataset. Further evaluation using 110 kV arrester equipment data and a validity evaluation index demonstrated the superiority of the proposed classification method over other algorithms. Results showed that the proposed scheme outperforms single-category algorithms, demonstrating high accuracy and strong discriminative ability.
The complexity of electrical equipment status monitoring data and multiple influencing factors present significant challenges. As datasets grow, the number of candidates itemset for deriving association rules increases exponentially, escalating computational complexity. Moreover, while numerous association rules may be generated, many could lack meaningful information, potentially complicating subsequent state classification. Future research will aim to optimize the model for applications in diverse and complex environments, focusing on addressing these identified challenges. In conclusion, this scheme exhibits considerable potential and practical value for evaluating the status of high-voltage electrical equipment in substations.
Author Contributions
Conceptualization, D.D. and Y.L.; methodology, D.D. and Y.L.; software, Y.L.; validation, D.D.; formal analysis, Y.L.; data curation, D.D.; writing—original draft preparation, D.D.; writing—review and editing, Y.L.; supervision, D.D.; project administration, S.-K.L. All authors have read and agreed to the published version of the manuscript.
Funding
This research received no external funding.
Institutional Review Board Statement
Not applicable.
Informed Consent Statement
Not applicable.
Data Availability Statement
The original contributions presented in this study are included in this article, further inquiries can be directed to the corresponding authors.
Conflicts of Interest
The authors declare no conflicts of interest.
References
- Suan, A.B.; Al-Amer, B.; Assiri, I.A. Multi-Variate, Recurrent Neural Network in a Short-Term Time-Series Substation Demand Forecasting. In Proceedings of the 2022 Saudi Arabia Smart Grid (SASG), Riyadh, Saudi Arabia, 12–14 December 2022; pp. 1–5. [Google Scholar]
- Betti, A.; Crisostomi, E.; Paolinelli, G.; Piazzi, A.; Ruffini, F.; Tucci, M. Condition monitoring and predictive maintenance methodologies for hydropower plants equipment. Renew. Energy 2021, 171, 246–253. [Google Scholar] [CrossRef]
- Guo, Z.; Ma, H.; Liu, W. Cause Analysis of Substation Faults Based on Multimodal Fusion Detection and Knowledge Graph. In Proceedings of the 2023 10th International Forum on Electrical Engineering and Automation (IFEEA), Nanjing, China, 3–5 November 2023; pp. 1252–1256. [Google Scholar]
- Khalid, H.; Shobole, A. Existing developments in adaptive smart grid protection: A review. Electr. Power Syst. Res. 2021, 191, 106901. [Google Scholar] [CrossRef]
- Alvarez Quiñones, L.I.; Lozano-Moncada, C.A.; Bravo Montenegro, D.A. Machine learning for predictive maintenance scheduling of distribution transformers. J. Qual. Maint. Eng. 2023, 29, 188–202. [Google Scholar] [CrossRef]
- Min, Z.; Jian, S.; Li, C.; Bin, Z.; Liang, Z.S.; Zhe, H. Status evaluation of smart substation measurement and control device. In Proceedings of the IOP Conference Series: Materials Science and Engineering, Jakarta, Indonesia, 21–22 November 2019; p. 042077. [Google Scholar]
- Dehghanian, P.; Guan, Y.; Kezunovic, M. Real-time life-cycle assessment of high-voltage circuit breakers for maintenance using online condition monitoring data. IEEE Trans. Ind. Appl. 2018, 55, 1135–1146. [Google Scholar] [CrossRef]
- Fu, D.; Wang, F.; Yuan, S.; Wang, G.; Shao, M. Fuzzy Comprehensive Evaluation Method for On-Line Monitoring Data Quality of Substation Equipment. In Proceedings of the 2019 6th International Conference on Information Science and Control Engineering (ICISCE), Shanghai, China, 20–22 December 2019; pp. 753–757. [Google Scholar]
- Yang, L.; Li, W.; Zhang, S.; Wan, J.; Zhao, H. Application of Big Data and Artificial Intelligence in Substation Operation and Maintenance. In Proceedings of the Journal of Physics: Conference Series, Bengaluru, India, 23–24 November 2023; p. 012002. [Google Scholar]
- Ma, Z.-X.; Zhang, L.-S.; Gu, H.; Xin, Z.-Z.; Kang, Z.; Wang, Z.-L. Panoramic Assessment Method of Substation Equipment Health Status Based on Multisource Monitoring and Deep Convolution Neural Network under Edge Computing Architecture. J. Electr. Comput. Eng. 2023, 2023, 9194712. [Google Scholar] [CrossRef]
- Gao, Q.; Zhong, C.; Wang, Y.; Wang, P.; Yu, Z.; Zhang, J. Defect analysis of the same batch of substation equipment based on big data analysis algorithm. In Proceedings of the IOP Conference Series: Earth and Environmental Science, Surakarta, Indonesia, 24–25 August 2021; p. 022093. [Google Scholar]
- Agrawal, R.; Srikant, R. Fast algorithms for mining association rules. In Proceedings of the 20th International Conference on Very Large Data Bases, VLDB, San Francisco, CA, USA, 12–15 September 1994; pp. 487–499. [Google Scholar]
- Zhao, Z.; Jian, Z.; Gaba, G.S.; Alroobaea, R.; Masud, M.; Rubaiee, S. An improved association rule mining algorithm for large data. J. Intell. Syst. 2021, 30, 750–762. [Google Scholar] [CrossRef]
- Yuan, C.; Xu, J.; Zhou, J.; Liu, L. Correlation Analysis of Electrical Equipment Defects Based on Association Rule Algorithm and Big Data. In Proceedings of the 2023 Panda Forum on Power and Energy (PandaFPE), Chengdu, China, 27–30 April 2023; pp. 1273–1277. [Google Scholar]
- Ali, S.H.K.; Aydilek, I.B. Shopping and Basket Analysis by Using an Improved Apriori Algorithm in WEKA. J. Stud. Sci. Eng. 2021, 1, 75–85. [Google Scholar]
- Miraftabzadeh, S.M.; Colombo, C.G.; Longo, M.; Foiadelli, F. K-means and alternative clustering methods in modern power systems. IEEE Access 2023, 11, 119596–119633. [Google Scholar] [CrossRef]
- Li, X.; Wang, Y.; Li, D. Medical data stream distribution pattern association rule mining algorithm based on density estimation. IEEE Access 2019, 7, 141319–141329. [Google Scholar] [CrossRef]
- Martinez-Arroyo, M.; Sucar, L.E. Learning an optimal naive bayes classifier. In Proceedings of the 18th International Conference on Pattern Recognition (ICPR’06), Hong Kong, China, 20–24 August 2006; pp. 1236–1239. [Google Scholar]
- Yang, T.; Qian, K.; Lo, D.C.-T.; Xie, Y.; Shi, Y.; Tao, L. Improve the prediction accuracy of Naïve Bayes classifier with association rule mining. In Proceedings of the 2016 IEEE 2nd International Conference on Big Data Security on Cloud (BigDataSecurity), IEEE International Conference on High Performance and Smart Computing (HPSC), and IEEE International Conference on Intelligent Data and Security (IDS), New York, NY, USA, 9–10 April 2016; pp. 129–133. [Google Scholar]
- Long, L. Research on status information monitoring of power equipment based on Internet of Things. Energy Rep. 2022, 8, 281–286. [Google Scholar] [CrossRef]
- Shang, P.; Dong, H.; Li, X.; Ren, W. Research on fault diagnosis method of 750kV substation based on Bayesian network and fault recording information fusion. Proc. J. Phys. Conf. Ser. 2020, 1550, 052020. [Google Scholar] [CrossRef]
- Hu, B.; Guo, Q.; Zhu, Y. Key Constraint Variable Identification, Transient Stability Assessment and Feasible Region Generation of Power Grid Operation Based on Machine Learning Method. In Proceedings of the PURPLE MOUNTAIN FORUM 2019-International Forum on Smart Grid Protection and Control: Volume II, 2020; Springer: Singapore, 2020; pp. 603–612. [Google Scholar]
- Ma, J.; Zhang, G.; Zhao, Y.; Jin, L. Design of the state simulation for the primary equipment of smart substation. In Proceedings of the 2020 IEEE 5th Information Technology and Mechatronics Engineering Conference (ITOEC), Chongqing, China, 12–14 June 2020; pp. 647–651. [Google Scholar]
- Razi-Kazemi, A.A.; Niayesh, K. Condition monitoring of high voltage circuit breakers: Past to future. IEEE Trans. Power Deliv. 2020, 36, 740–750. [Google Scholar] [CrossRef]
- Meng, X.-K.; Jia, Y.-B.; Liu, Z.-H.; Yu, Z.-Q.; Han, P.-J.; Lu, Z.-M.; Jin, T. High-Voltage Cable Condition Assessment Method Based on Multi-Source Data Analysis. Energies 2022, 15, 1369. [Google Scholar] [CrossRef]
- Delalleau, O.; Courville, A.; Bengio, Y. Efficient EM training of Gaussian mixtures with missing data. arXiv 2012, arXiv:1209.0521. [Google Scholar]
- Ahmed, I.; Guan, D.; Chung, T.C. Sms classification based on naive bayes classifier and apriori algorithm frequent itemset. Int. J. Mach. Learn. Comput. 2014, 4, 183. [Google Scholar] [CrossRef]
- Soni, A.; Saxena, A.; Bajaj, P. A methodological approach for mining the user requirements using apriori algorithm. J. Cases Inf. Technol. (JCIT) 2020, 22, 1–30. [Google Scholar] [CrossRef]
- Xie, H. Research and case analysis of apriori algorithm based on mining frequent item-sets. Open J. Soc. Sci. 2021, 9, 458. [Google Scholar] [CrossRef]
- Kumbhare, T.A.; Chobe, S.V. An overview of association rule mining algorithms. Int. J. Comput. Sci. Inf. Technol. 2014, 5, 927–930. [Google Scholar]
- Kazerooni, M.; Zhu, H.; Overbye, T.J. Literature review on the applications of data mining in power systems. In Proceedings of the 2014 Power and Energy Conference at Illinois (PECI), Champaign, IL, USA, 28 February–1 March 2014; pp. 1–8. [Google Scholar]
- Morais, J.; Klautau, A.; Cardoso, C.; Pires, Y. An Overview of Data Mining Techniques Applied to Power Systems. 2009. Available online: https://citeseerx.ist.psu.edu/document?repid=rep1&type=pdf&doi=0a255dbf8bebd476ede2bab9995949265c6f7ecf (accessed on 1 July 2024).
- Xie, J.; Shu, H.; Zhang, W.; Song, Q.; Luo, L. Evaluation algorithm of high voltage switchgear based on bayesian fusion. In Proceedings of the 2018 International Conference on Power System Technology (POWERCON), Guangzhou, China, 6–8 November 2018; pp. 3129–3135. [Google Scholar]
- Available online: https://woosuk-my.sharepoint.com/:u:/g/personal/dangjong_stu_woosuk_ac_kr/EUamKUZ9FyZGnrSpWVmZ0rMBzgZmQ19F2VWBZqDG4544fQ?e=ZeWzQH (accessed on 10 July 2024).
- Hossin, M.; Sulaiman, M.N. A review on evaluation metrics for data classification evaluations. Int. J. Data Min. Knowl. Manag. Process. 2015, 5, 1. [Google Scholar]
Disclaimer/Publisher’s Note: The statements, opinions and data contained in all publications are solely those of the individual author(s) and contributor(s) and not of MDPI and/or the editor(s). MDPI and/or the editor(s) disclaim responsibility for any injury to people or property resulting from any ideas, methods, instructions or products referred to in the content. |
© 2024 by the authors. Licensee MDPI, Basel, Switzerland. This article is an open access article distributed under the terms and conditions of the Creative Commons Attribution (CC BY) license (https://creativecommons.org/licenses/by/4.0/).