Abstract
In this study, an energy management model for electric vehicles including the entire vehicle such as the cabin, electric motors, battery, and the heating–cooling system was prepared. The heating and cooling processes for electric vehicles were run according to the internationally recognized driving cycles as well as at constant speeds to investigate them under different ambient conditions. The heating–cooling processes were managed in line with the cabin temperature target determined by considering the comfort conditions. The energy consumption of each of the system elements and the system in the heating–cooling process in electric vehicles was analyzed. Under different operating conditions, the variation of cabin temperature with time, instantaneous power, and cumulative energy consumption was calculated. The effect of heating and cooling processes on energy consumption, charging rate, and range were analyzed and interpreted. The results showed that the heating–cooling system for the heating process consumed more energy when the ambient temperature decreased, and the charge consumption ratio as well as the range deformation rate increased to about 30% when the ambient temperature was –10 °C. Similarly, the heating–cooling system for the cooling process consumed more energy when the ambient temperature increased, and the charge consumption ratio as well as the range deformation rate reached up to 40% when the ambient temperature was 40 °C. When the outdoor conditions were close to the thermal comfort temperature of 23 °C inside the cabin, the total energy consumption and the range deformation rates were reduced to less than 10%.
1. Introduction
The increasing population and high energy demand have led to energy crises and environmental problems in our world. To overcome these problems, countries are trying to switch from traditional internal combustion engines (ICEs) to electric vehicles (EVs). Although electric vehicles were proposed in the early years of the 19th century and the beginning of the 20th century, limited range and battery costs were disadvantages of EVs against ICEs. Restrictions of exhaust emissions of ICEs in the EU and political pressures increased research and development studies of EVs in the 1990s [1]. EV sales in the world market reached 6.61 million in 2021, and 10.25 million in 2022, and it is projected that they will reach up to 17.07 million by 2028 [2]. Although EVs are environmentally friendly and have lower running costs, range, battery storage capacity, charging–discharging characteristics, and battery life are the main drawbacks of EVs. Some research reported the predicted range of EV batteries [3]. The range calculations of EVs are performed by using the driving conditions, speed, acceleration, and the state of charge of the battery [4,5]. These mentioned disadvantages are closely related to the electric vehicles thermal management system (EVTMS) [6]. Thermal management of air conditioning (AC) systems, batteries, power train systems, and other auxiliary equipment such as lighting affects driving range, life of components, and efficiency [7,8].
Among the energy-consuming systems of EVs, the HVAC system consumes almost 33% of the total required energy to drive EVs [9]. Annual average HVAC energy consumption in a light-duty EV in all US states for a 19,312 km hypothetical ride shows that AC energy consumption is greater than the heating process [10]. Preconditioning of the vehicle cabin also influences the EV range [11]. A dynamic and modular AC system in an electric bus showed that fans and blowers consume up to 40% total energy in the vehicle [12]. EVs’ driving ranges also differ with geographical and environmental conditions.
The thermal comfort of the driver and passengers is important for pleasant and safer travel. Therefore, thermal comfort studies have always been a concern of HVAC designers [12,13]. To ensure thermal comfort, the HVAC system is a must in electric vehicles, as in all vehicles. There are several theoretical, numerical, and experimental research works published in the current literature concerning HVAC systems in EVs [6,9]. Some of the related works and their findings are mentioned here. Simulated models in MATLAB for range estimation of EVs concerning energy consumption of battery due to traction and HVAC revealed that measurements and simulations results are close to each other (less than 2.59%) and can help to overcome range anxiety of drivers [14]. A dynamic program was proposed to solve the battery management dilemma between energy consumption and thermal comfort. Variations of traction energy, AC energy, surplus energy, and thermal discomfort with travel time were presented [15]. Cabin heating of EVs in cold climates is energy intensive. A cabin heating and powertrain optimization platform was created and tested for a plug-in EV, and results showed that the proposed system can increase EV energy saving up to 26% [16]. Four model-based controller approaches including feedback controllers, a decentralized-proportional integral controller, and a centralized linear-quadratic-integral control strategy were designed and compared for AC systems in EVs [17]. Comfort parameters in an EV cabin such as air temperature, relative humidity, and volatile organic compounds (VOC) were measured for different HVAC modes. Energy consumption values of these different modes were compared [18]. A reversible heat pump HVAC system was designed with a regenerative heat exchanger for EVs. AC energy consumption and its influence on the range for daily commutes in different Italian cities showed that the base range of 94 km may decrease down to 72 km and replacement of a resistor with a heat pump may decrease the energy consumption by 17 to 25% [19]. A novel hybrid heat pump with a positive temperature coefficient (PTC) heater was proposed for EVs to perform in different heating modes to reach the goal temperature in a target time. According to the results, driving range can be increased by up to 15% [20]. Optimization of defrosting–demisting and blowing modes in an EV was conducted via computational fluid dynamics (CFD) simulations [21]. An innovative HVAC system equipped with an n-hexadecane phase change material (PCM) heat exchanger to reduce energy consumption was improved [22]. An economic model predictive control of HVAC systems in EVs reduces 4.4–7.5% of energy consumption and has a 70–86 s faster cabin cooling time [23]. The effects of glass properties on cabin solar heating and range on an EV revealed that the influence of glass properties was completely location-specific [24]. An optimization strategy was used for energy-efficient cabin conditioning in cold weather and AC with a heat pump. With the proposed optimization strategy, energy consumption was reduced by 11% [25]. The behavior of battery cooling and HVAC systems in EVs was controlled by a novel control-oriented model. The root mean square error (RMSE) of battery temperature was under 0.41 °C, the coolant temperature was under 0.35 °C, and the normalized RMSE of heat exchanger transfer rate at the heat exchangers was between 2.8% and 10.6% [26]. The developed algorithm limits the HVAC system to not consume more than 20–25% of instant power in the vehicle while maximizing comfort conditions according to customer preferences [27]. A thermal management strategy was developed for the passenger compartment to reduce HVAC energy consumption in an EV [28]. Sen et al. presented a fuzzy logic-based hybrid storage technique consisting of a supercapacitor (SC) and battery for efficient and safe storage of a regenerative braking system [29].
According to the aforementioned research, the majority of work was completed to estimate the energy consumption of the vehicle by taking into account the energy needed for traction, the route, and the impact of variations in ambient temperature on the energy requirement of the HVAC system. Previous studies have not considered the component-based energy consumption rates, and the cumulative energy consumption of vehicles with and without HVAC systems in detail. In addition, the impact of these on the range of EVs by considering the state of charging of EV battery has not been investigated in detail. In light of this, a dynamic energy management model including the entire vehicle consisting of the vehicle cabin, electric motors, battery block, and heating–cooling system elements on an electric vehicle was prepared to dynamically examine the energy consumption under different working conditions. The model included a heat pump for heating and cooling, as well as a PTC heater to be used when needed. In line with the cabin temperature target, which is determined by considering the comfort conditions in the cabin, the heating and cooling process was managed. In the heating–cooling process in the electric vehicle, the energy consumption of each of the system elements separately and the energy consumption of the whole system were examined. Under different road operating conditions, the temperature in the cabin over time, instantaneous power, and cumulative energy consumption were calculated. The effect of heating and cooling processes on energy consumption, the charge rate of the battery, and the variation of the EV range were examined and interpreted.
2. Materials and Methods
The energy management system of the electric vehicle model used in the present study is presented in Figure 1. The energy management system was modelled using MATLAB(R2022a)-SIMULINK software. The energy management model includes the entire vehicle consisting of the vehicle cabin, electric motors, battery block, and heating–cooling system elements on an electric vehicle. The thermal loads are the battery pack, powertrain equipment, and vehicle cabin. The heating–cooling system consists of two working fluid loops, a heat pump loop, and a cabin HVAC loop. The R1234yf cooling agent is used as the working fluid. The main elements of the heat pump system used for the heating–cooling system in electric vehicles are the compressor, expansion valve, evaporator, condenser, and four-way valve. With the series or parallel connection of the four-way valve in the system, heating and cooling activities are realized through the same system elements. In the modeled HVAC system, the serial and parallel connection of the four-way valve realizes the heating and cooling activities through the same system elements. The model includes a PTC heater for the heating process in cold climatic conditions and a chiller for the cooling process in hot climatic conditions. A condenser evaporator block was used for the evaporator and condenser. A cross-flow heat exchanger is preferred where the fluids do not mix. The compressor was modeled using a controlled mass flow rate. Moist air properties and outer ambient conditions were modeled with the moist air library. Thermal mass, conductive heat transfer, and convective heat transfer were modeled using the thermal elements library. Temperature control was modeled with the temperature sensor block. With this block, the temperature difference between two desired points can be examined without removing heat from the system. It is also used for the decision to stabilize the temperature at the desired points. Using the drive cycle source block, simulation was performed under internationally recognized road operating conditions. It contains a large number of road operating conditions. It can present road operating conditions to users in graphical form with different speed units. It can run the road operating conditions cyclically according to the simulation time. With this block, NEDC and FTP75 road operating conditions were run in the model. Fans that operate in the HVAC system were modeled via fan blocks in the moist air turbomachinery library.
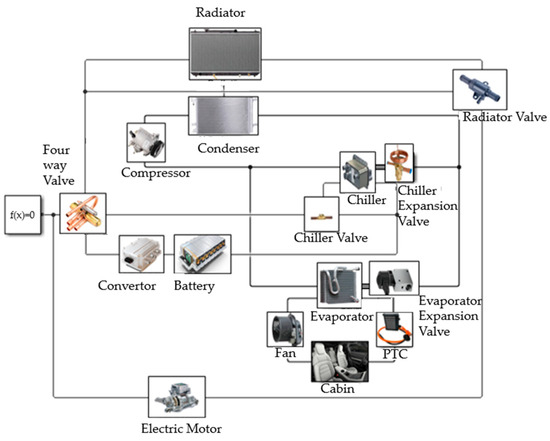
Figure 1.
Electrical vehicle energy management system model.
The metabolic heat production of the passengers in the vehicle was also included. The model was run for a one-hour driving cycle under internationally recognized road operating conditions NEDC, US Environmental Protection Agency Federal Test Procedure (FTP75), and constant speeds. The simulation was performed for different cabin target temperatures with comfort conditions. Figure 1 represents the HVAC model of the study.
The flow diagram of the electrical vehicle energy management system is presented in Figure 2.
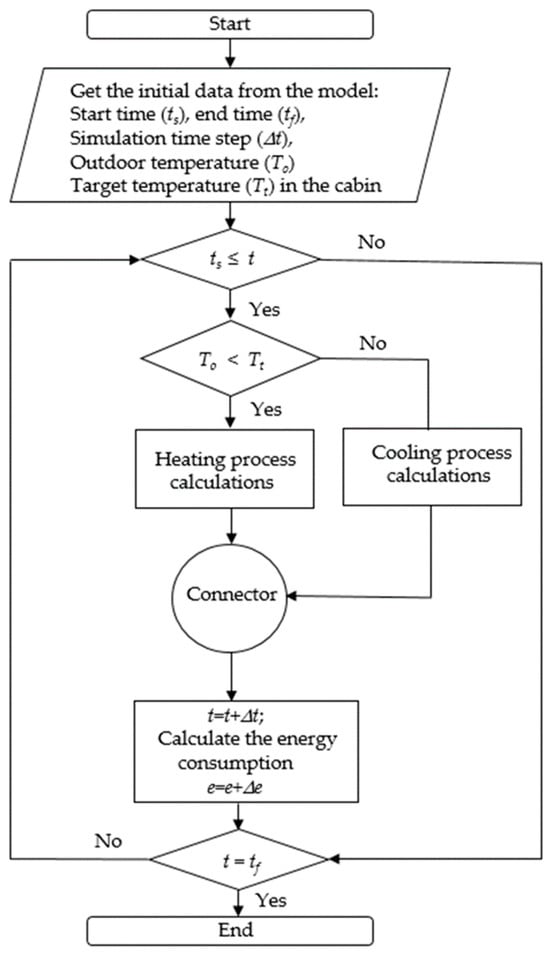
Figure 2.
Flow diagram of the EV energy management system model.
The MATLAB(R2022a) Simulink model used for cabin heat transfer calculations is presented in Figure 3. The cabin heat transfer model was analyzed in three parts: glass, doors, and ceiling. In the heating–cooling system model, the effect of the increase in the number of passengers in the cabin on the heat generation and the system was analyzed under NEDC road operating conditions. Radiative heat transfer was neglected in the cabin system modeling.
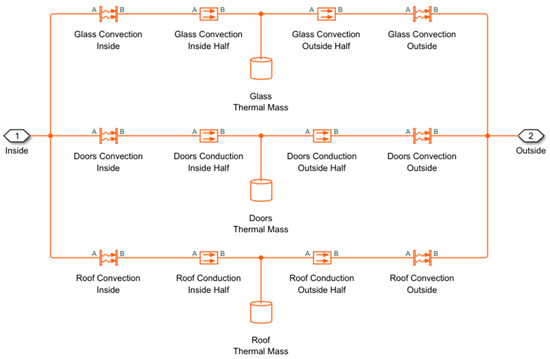
Figure 3.
Modeling of the cabin interior.
The HVAC system was used to ensure that the journeys in different climatic and weather conditions continued in comfort conditions. Modeling studies were carried out in line with the cabin target temperature (23 °C) determined by considering the comfort conditions.
The heat generation of the passengers in the vehicle cabin was included in the model. The model was created for different outdoor temperatures. In the model, heating process simulations were performed for outdoor temperatures of −10 °C, 0 °C, and 10 °C. Cooling process simulations were performed under 30 °C, 35 °C, and 40 °C outdoor temperatures.
The thermophysical properties of materials used in cabin heat transfer calculations are given in Table 1.

Table 1.
Thermophysical properties of cabin materials [30].
Although NEDC road operating conditions were first used in internal combustion vehicles, today they can be used in studies on performance, consumption, and range for electric and hybrid vehicles. NEDC road operating conditions have an urban driving cycle (UDC) and extra urban driving cycle (EUDC) in their internal structure. In NEDC road operating conditions, UDC was repeated 4 times and each cycle duration was 195 s. The EUDC in NEDC road operating conditions takes place once for 400 s. Thus, the operating conditions last approximately 1200 s in total [31]. The speed profile of the NEDC cycle is given in Figure 4a. FTP5 driving cycle speed profile is given in Figure 4b [32].
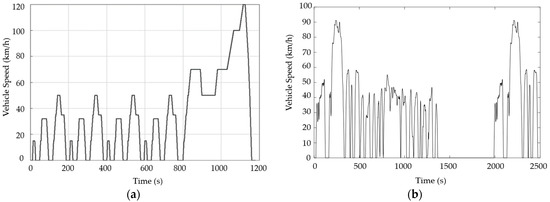
Figure 4.
Speed profile of NEDC cycle (a) and speed profile of FTP75 cycle (b).
In the model, the heating and cooling process was also realized under constant speed-moving road operating conditions. The system was run for one hour with constant speeds of 20 km/h, 50 km/h, 80 km/h, and 110 km/h as road operating conditions. Time-dependent cabin temperature and total energy consumption analysis of the vehicle at different constant speed road operating conditions and outdoor temperatures was performed. The specifications of the battery are presented in Table 2.
Table 2.
Battery and consumption characteristics of EV.
In the range degradation rate (Xdeg) calculations, the total range (Xtot) predicted with the vehicle’s heating–cooling system off, the predicted range (Xpre) with the heating–cooling system running, and the range loss (Xloss) that may occur with the heating–cooling system running are calculated using Equations (1) and (2) and then given as a percentage.
3. Results
3.1. Heating Period
The heating process of the model was carried out under international road operating conditions FTP75 and NEDC. Time-dependent cabin temperature and total energy consumption analysis of the vehicle under different road operating conditions and outdoor temperatures are presented.
Time-dependent total energy consumption analysis of the heating process for the FTP75 road operating conditions of the model at −10 °C ambient conditions was carried out. The results are presented in Figure 5.
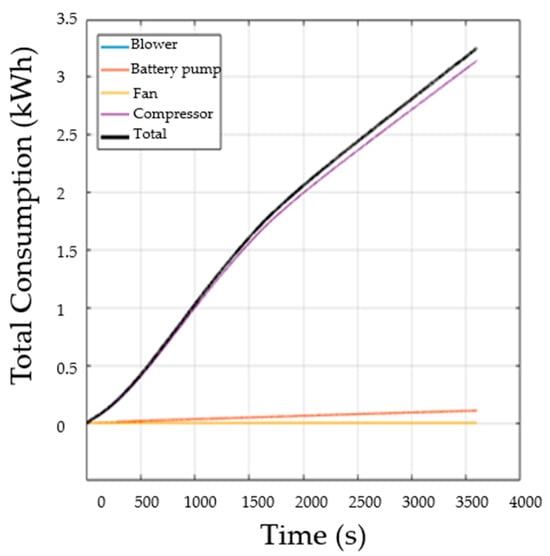
Figure 5.
Energy consumption profile of FTP75 cycle for heating period.
Under FTP75 road operating conditions at −10 °C initial conditions, it took approximately 1100 s to reach the targeted temperature of 24 °C inside the cabin. The total consumption was approximately 3.25 kWh.
It took approximately 1200 s for the vehicle to reach the target temperature inside the cabin under NEDC road operating conditions under the −10 °C initial conditions shown in Figure 6. The total consumption was measured as 3.75 kWh. During the heating process, the time to reach the target temperature increased by 8% and the total consumption increased by 13% for NEDC road operating conditions compared to FTP75.
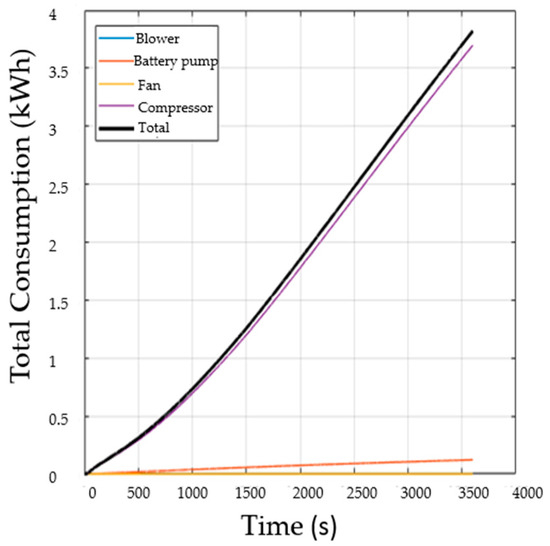
Figure 6.
Energy consumption profile of NEDC cycle for heating period.
In FTP75 road operating conditions, the vehicle’s −10 °C standstill time was longer than NEDC conditions, which resulted in lower consumption.
The model was run for one hour with constant speeds of 20 km/h, 50 km/h, 80 km/h, and 110 km/h as road operating conditions. The effect of energy consumption under these operating conditions on the range and charging rate was analyzed.
First, one-hour cabin temperature and total consumption analyses of the vehicle traveling with a constant 20 km/h were performed at −10 °C ambient conditions.
The calculations show that it took approximately 1000 s for the vehicle traveling at a constant 20 km/h for one hour to reach the target temperature of 24 °C inside the cabin at −10 °C outdoor conditions. As seen in Figure 7, the total consumption was measured as 3.3 kWh.
Figure 7.
Energy consumption profile of the vehicle traveling at constant 20 km/h at −10 °C.
One-hour cabin temperature and total consumption analyses of the vehicle traveling at a constant 50 km/h were performed at −10 °C ambient conditions.
The vehicle in Figure 8, which was traveling at a constant 50 km/h for one hour, took approximately 1000 s to reach the target temperature inside the cabin at −10 °C outdoor conditions.
Figure 8.
Energy consumption profile of the vehicle traveling at constant 50 km/h at −10 °C.
The total energy consumption was 3.9 kWh. The fact that the constant speed road operating conditions were 50 km/h instead of 20 km/h increased the total energy consumption by 0.6 kWh at the end of one hour. The time taken for the target temperature inside the cabin did not change. It was observed that the compressor consumed the most energy in the system.
The vehicle moving at a constant 80 km/h for one hour, took 1000 s to reach the target temperature inside the cabin under −10 °C outdoor conditions. The total consumption was 4.4 kWh. It was calculated that the energy consumption increased by 12% compared to the case where the road operating conditions were 50 km/h. The results are shown in Figure 9.

Figure 9.
Energy consumption profile of the vehicle traveling at constant 80 km/h at −10 °C.
Figure 10 shows the vehicle traveling at a constant 110 km/h speed for one hour, reaching the target temperature inside the cabin in 1000 s under −10 °C outdoor conditions. The total consumption was 5.2 kWh. The fact that the speed in the road operating conditions was 110 km/h instead of 80 km/h increased the total energy consumption of the system by 18%.
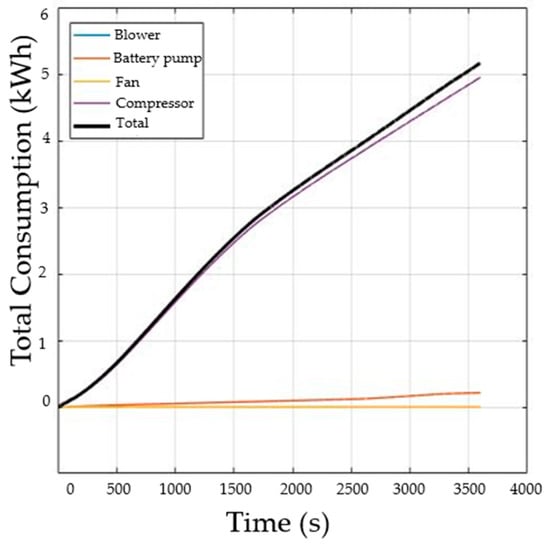
Figure 10.
Energy consumption profile of the vehicle traveling at constant 110 km/h at −10 °C.
3.2. Cooling Period
The cooling process of the model was carried out under international road operating conditions FTP75 and NEDC. Time-dependent total energy consumption analysis of the vehicle under different road operating conditions and outdoor temperatures is presented.
The total consumption analyses of the cooling process for FTP75 road operating conditions were performed for the model in 30 °C ambient conditions.
The vehicle for FTP75 road operating conditions at 30 °C initial conditions took approximately 1250 s to reach the target temperature inside the cabin. It can be seen from Figure 11 that the total energy consumption was 0.9 kWh.
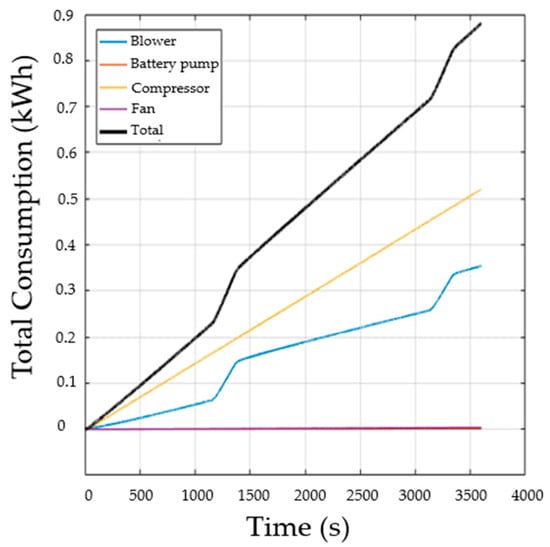
Figure 11.
Energy consumption profile of FTP75 cycle for the cooling period.
The cabin temperature and total energy consumption analyses of the cooling process for NEDC road operating conditions were performed for the model at 30 °C ambient conditions. Figure 12 shows that it took approximately 1200 s for the vehicle to reach the target temperature inside the cabin for NEDC road operating conditions at 30 °C initial conditions. The total energy consumption was approximately 0.7 kWh.
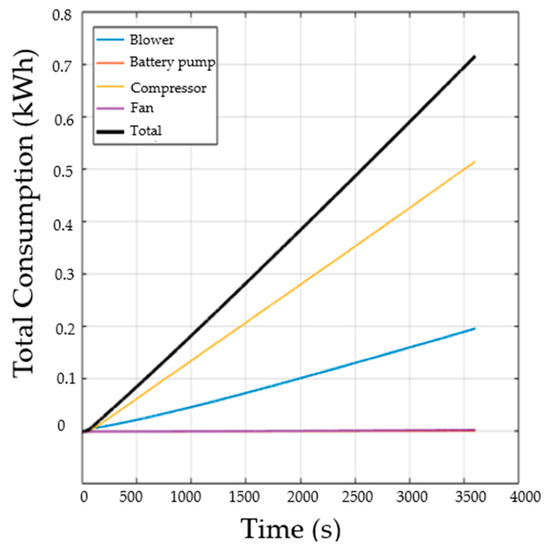
Figure 12.
Energy consumption profile of NEDC cycle for cooling period.
It was calculated that the FTP75 road operating conditions at 30 °C outdoor temperature consumed 0.2 kWh more energy compared to NEDC. The compressor in the system was calculated to consume 72% of the total energy. Under NEDC road operating conditions, the target temperature was reached 50 s earlier than in FTP75 conditions.
One-hour cabin temperature and total energy consumption analyses of the vehicle moving at a constant 20 km/h speed under 40 °C ambient conditions were performed.
The vehicle in Figure 13, which was traveling at a constant 20 km/h for one hour, took approximately 1500 s to reach the target temperature inside the cabin under 40 °C outdoor conditions. The total energy consumption was measured as 3.7 kWh. It was calculated that the compressor in the system consumed 3 kWh of energy.
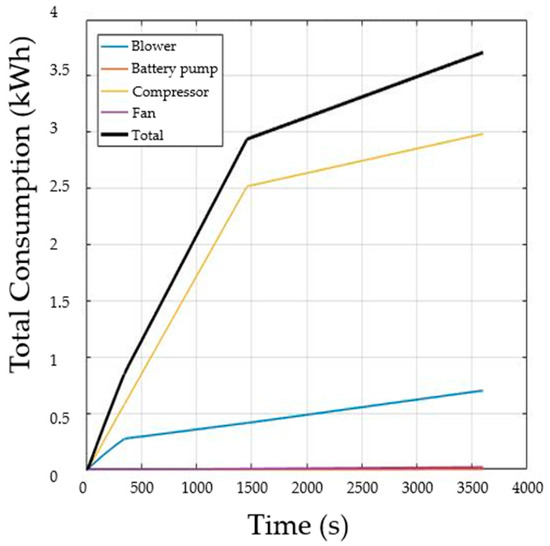
Figure 13.
Cooling process of vehicle moving at a constant 20 km/h for an ambient temperature of 40 °C.
The vehicle in Figure 14, which was moving at a constant 50 km/h for one hour, took approximately 1500 s to reach the target temperature inside the cabin under 40 °C outdoor conditions. To reach the equilibrium temperature within 1500 s, 4 kWh of energy was consumed. The total energy consumption at the end of one hour was 5.1 kWh. Increasing the vehicle speed from 20 km/h to 50 km/h increased the energy consumption of the cooling system by 1.4 kWh.
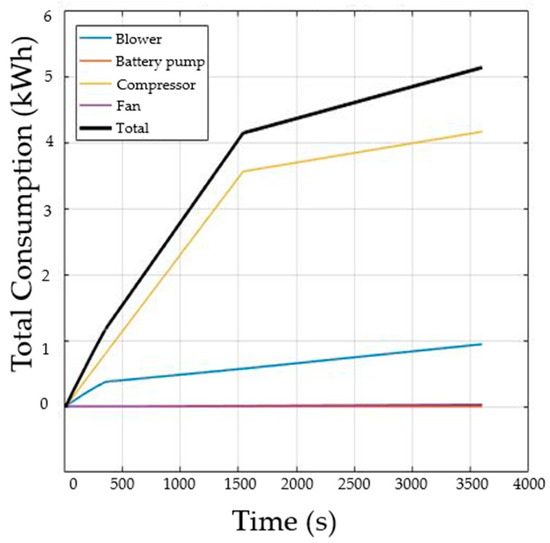
Figure 14.
Cooling process of vehicle moving at a constant 50 km/h for an ambient temperature of 40 °C.
One-hour in-cabin temperature and total consumption analyses of the vehicle moving at a constant 80 km/h under 40 °C ambient conditions were performed. The effect of speed on the charging rate and range of electric vehicles was analyzed. Figure 15 shows the total energy consumption of the vehicle with time that was traveling at a constant 80 km/h speed under 40 °C outdoor ambient conditions. It took approximately 1500 s to reach the target temperature inside. Total consumption was measured as 5.4 kWh.
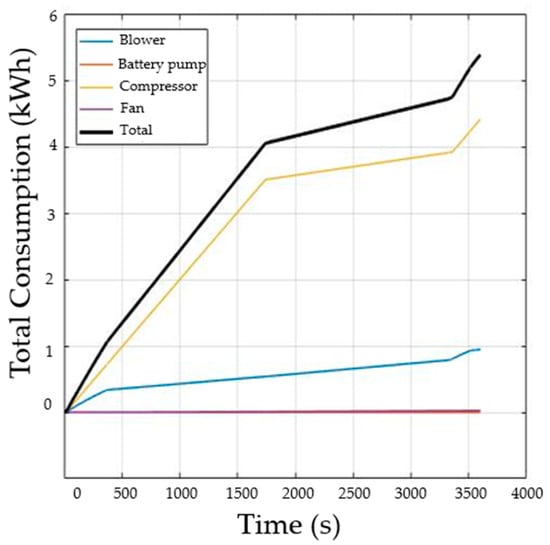
Figure 15.
Cooling process of vehicle moving at a constant 80 km/h for an ambient temperature of 40 °C.
One-hour cabin temperature and total energy consumption analyses of the vehicle moving at a constant 110 km/h speed at 40 °C ambient conditions were performed.
The vehicle in Figure 16, which was moving at a constant 110 km/h for one hour, took approximately 1400 s to reach the target temperature inside the cabin under 40 °C outdoor conditions. The total energy consumption was measured as 5.8 kWh. It was calculated that the energy consumption in the compressor consumes 82% of the total energy.
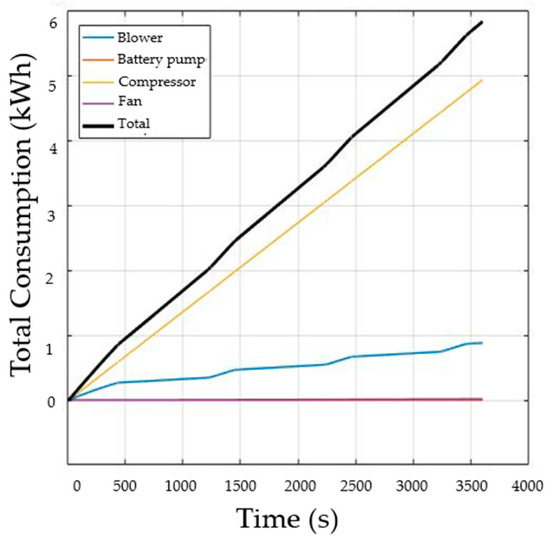
Figure 16.
Cooling process of vehicle moving at a constant 110 km/h for an ambient temperature of 40 °C.
3.3. Range and Charging Rate
The results of the analysis of the heating–cooling system operating at different outdoor temperatures are presented in Table 3, and the effect of energy consumption in the system on the charging rate and range of the vehicle is presented in Table 4.
Table 3.
Energy consumption of heating and cooling systems operating at different outdoor temperature values.
Table 4.
Effect of different outdoor temperatures on charging rate and range.
The results in Table 3 show that the heating and cooling system consumed more energy in extreme conditions when the outdoor temperatures were too high or too low. When the outdoor conditions were close to the target temperature of 23 °C inside the cabin, the total energy consumption was greatly reduced. Under −10 °C initial conditions, it was calculated that 0.11 kWh of energy was consumed for every 1 °C of temperature. Under 40 °C initial conditions, 0.28 kWh of energy was consumed for every 1 °C of temperature.
In Table 4, 27 kWh/100 km consumption data of the vehicle with 83.7 kWh battery capacity selected under NEDC road operating conditions was taken as reference. Only the rate of charge consumption in the case of heating and cooling system operation was calculated. The total charge rate consumed by the vehicle and the heating and cooling system under NEDC road operating conditions was calculated. The total range of the vehicle with and without the heating and cooling system was calculated. The loss of range in km due to the operation of the heating and cooling system for one hour was calculated. At the end of the total test period of one hour, it was observed that the rate of increase in range loss and deterioration rate was greater when the ambient temperature dropped below 10 °C or increased above 30 °C.
Figure 17 represents the effect of ambient temperature on the range and charge rate of the vehicle under NEDC driving conditions. Under NEDC road operating conditions, there was a loss of 18.06 km in range when comparing the cooling process at 40 °C ambient to the heating process at −10 °C ambient.
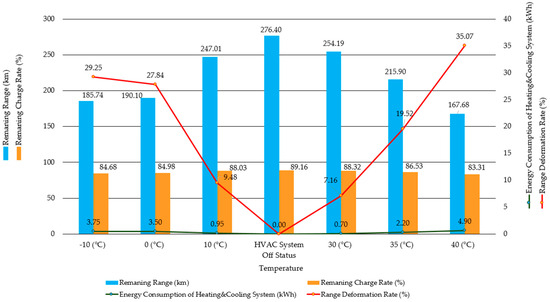
Figure 17.
Effect of ambient temperature on range and charge rate.
The model was run for one hour at 20 km/h, 50 km/h, 80 km/h, and 110 km/h speeds designed as constant speed road operating conditions. The effect of energy consumption at various constant speeds on the charging rate and range was analyzed. The results are presented in Table 5.
Table 5.
Effect of different road operating conditions on charge rate and range at constant speed.
In the one-hour analyses where the outdoor conditions were −10 °C for heating and 40 °C for cooling, total consumption increased with increasing vehicle speed. Despite the increase in total consumption as a result of the increase in vehicle speed, the range loss and deterioration rate caused by the heating–cooling system were found to decrease. The difference between the ranges that can be obtained with the heating–cooling system off and on was the lost range. At low speeds, at the end of an hour, less distance traveled for the total energy consumption resulted in less total range traveled. Therefore, the lost range was higher. At high speeds, although the total consumption was higher, more range was obtained. As the achievable range increased while the system was operating, the loss range decreased. The range degradation ratio is the ratio of the lost range to the total range when the HVAC system is off.
Figure 17 represents the effect of constant-speed road operating conditions on range and charge rate. As seen from Figure 18, the higher range loss at low speeds results in a higher range degradation rate. When the range degradation rate was evaluated, the optimum speed range for the range that can be obtained with the heating and cooling system in operation was interpreted as between 50 km/h and 110 km/h. In the cooling process at constant speeds, energy consumption, charge rate, and range loss were higher than in the heating process.
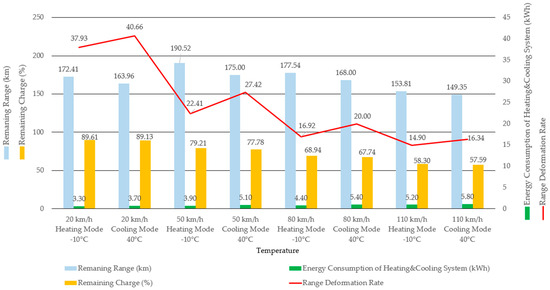
Figure 18.
Effect of constant speed road operating conditions on range and charge rate.
In the heating and cooling system, the temperature target of 23 °C inside the cabin was changed to 24 °C during the heating process when the outdoor conditions were −10 °C. In the cooling process when the outdoor conditions were 40 °C, the temperature inside the cabin was changed to 22 °C. The time-dependent in-cab temperature analysis and energy consumption of the heating and cooling system with the new in-cab temperature target are presented in Table 6.
Table 6.
Energy consumption of different cabin target temperatures for heating and cooling systems.
The results in Table 6 show that a 1 °C target temperature change in the heating process increases the energy consumption by 0.15 kWh and a change in the cooling process by 0.2 kWh. In the analyses under NEDC road operating conditions, a 1 °C target temperature change in the heating and cooling system did not affect the time taken to reach the target temperature.
The results for charging rate, range, and range degradation rate as a result of changing the target cabin temperature of the heating and cooling process are presented in Table 7.
Table 7.
The effect of different cabin target temperatures on charging rate and range of heating and cooling system.
Increasing the temperature target in the heating process by 1 °C resulted in a loss of 2.54 km in range. A decrease of 1 °C in the temperature target in the cooling process resulted in a further loss of 2.84 km in range.
As a result of the cabin temperature change, the remaining charge rate during the heating process was 86%, while the remaining charge rate during the cooling process was 84%. Due to the NEDC road operating conditions at low speeds, the range consumption caused by the heating and cooling system was higher. The range degradation rate was 29.25% for heating and 35.99% for cooling at new target temperatures. These results are mainly in line with the current literature such as the works of Kang et al. [9] and Bellocchi et al. [19].
Figure 19 shows the total range, range degradation rate, remaining charge rate, and energy consumption of the heating and cooling system as a result of the change in target cabin temperature after one hour of test under NEDC road operating conditions.
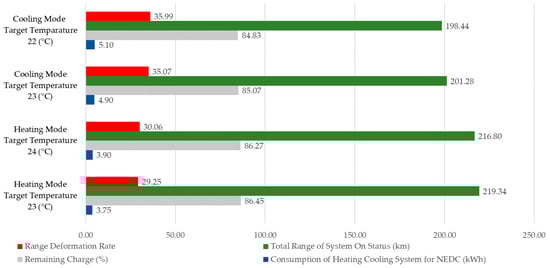
Figure 19.
Effect of different target temperature of heating and cooling systems on range and charging rate.
4. Conclusions
In this work, an energy management model for the entire electric vehicle including vehicle cabin, electric motors, battery, and heating–cooling system was prepared in the MATLAB Simulink environment. The model was run under different ambient conditions with the internationally recognized road operating conditions cycles as NEDC, FTP75, and the constant speeds of 20 km/h, 50 km/h, 80 km/h, and 110 km/h for one hour. Using the prepared model, the effect of the energy consumption of the heating–cooling system on the total energy consumption and range of the vehicle was examined in detail. The main conclusions of the study are given below:
In the heating–cooling system in electric vehicles, the energy consumption in the cooling process is higher than in the heating process. The compressor always consumes the most energy among the system elements.
When NEDC and FTP75 road operating conditions were compared, it was calculated that 15% more energy was consumed in the heating process for NEDC and 25% more energy was consumed in the cooling process for NEDC in the heating and cooling process when the outdoor ambient conditions were −10 °C and 40 °C. Since the vehicle’s standstill time was much less in NEDC than in the FTP75 driving cycle, more convection heat transfer was realized between the vehicle and the ambient conditions. Therefore, more energy was consumed to sustain the target temperature inside the cabin.
The energy consumption of the system decreases as the outdoor ambient temperatures approach the target temperature inside the cabin under all considered road operating conditions. The decrease in energy consumption leads to an increase in the total range of the vehicle and the amount of remaining charge.
As the vehicle speed increases, the convection heat transfer rate and the energy consumption of the heating and cooling system increase. Despite the increase in total consumption as a result of the increase in vehicle speed, the range loss and deterioration rate caused by the heating–cooling system decreases. At higher vehicle speeds, although the total consumption was higher, more range was achieved.
In general, the energy consumption in the cooling process was higher than in the heating process. A change of 1 °C in cabin target temperature affects the total range by approximately 3 km.
Author Contributions
Conceptualization, M.K. and M.Ö.K.; methodology, M.K. and M.Ö.K.; software, M.K. and M.Ö.K.; validation, M.K. and M.Ö.K.; formal analysis, M.K. and M.Ö.K.; investigation, M.K. and M.Ö.K.; resources, M.K. and M.Ö.K.; data curation, M.K. and M.Ö.K.; writing—original draft preparation, M.K. and M.Ö.K.; writing—review and editing, M.K. and M.Ö.K.; visualization, M.K. and M.Ö.K.; supervision, M.K. All authors have read and agreed to the published version of the manuscript.
Funding
This research received no external funding.
Institutional Review Board Statement
Not applicable.
Informed Consent Statement
Not applicable.
Data Availability Statement
The data used to support the findings of this study are included within the article.
Conflicts of Interest
The authors declare no conflicts of interest.
References
- Haghani, M.; Sprei, F.; Kazemzadeh, K.; Shahhoseini, Z.; Aghaei, J. Trends in electric vehicles research. Transp. Res. Part D Transp. Environ. 2023, 123, 103881. [Google Scholar] [CrossRef]
- EV Statistics.pdf. Available online: https://www.statista.com/outlook/mmo/electric-vehicles/worldwide (accessed on 17 May 2024).
- Cuma, M.U.; Koroglu, T. A comprehensive review on estimation strategies used in hybrid and battery electric vehicles. Renew. Sustain. Energy Rev. 2015, 42, 517–531. [Google Scholar] [CrossRef]
- Wager, G.; Whale, J.; Braunl, T. Driving electric vehicles at highway speeds: The effect of higher driving speeds on energy consumption and driving range for electric vehicles in Australia. Renew. Sustain. Energy Rev. 2016, 63, 158–165. [Google Scholar] [CrossRef]
- Galvin, R. Energy consumption effects of speed and acceleration in electric vehicles: Laboratory case studies and implications for drivers and policymakers. Transp. Res. Part D Transp. Environ. 2017, 53, 234–248. [Google Scholar] [CrossRef]
- He, L.; Jing, H.; Zhang, Y.; Li, P.; Gu, Z. Review of thermal management system for battery electric vehicle. J. Energy Storage 2023, 59, 106443. [Google Scholar] [CrossRef]
- Wawzyniak, M.; Wiebelt, A. Thermal Management for Electrified Vehicles. MTZ Worldw. 2016, 77, 38–43. [Google Scholar] [CrossRef]
- Kausthubharam; Koorata, P.K.; Panchal, S.; Fraser, R.; Fowler, M. Combined influence of concentration-dependent properties, local deformation and boundary confinement on the migration of Li-ions in low-expansion electrode particle during lithiation. J. Energy Storage 2022, 52, 104908. [Google Scholar] [CrossRef]
- Kang, B.H.; Lee, H.J. A Review of Recent Research on Automotive HVAC Systems for EVs. Int. J. Air-Cond. Refrig. 2017, 25, 1730003. [Google Scholar] [CrossRef]
- Kambly, K.R.; Bradley, T.H. Estimating the HVAC energy consumption of plug-in electric vehicles. J. Power Sources 2014, 259, 117–124. [Google Scholar] [CrossRef]
- Kambly, K.; Bradley, T.H. Geographical and temporal differences in electric vehicle range due to cabin conditioning energy consumption. J. Power Sources 2015, 275, 468–475. [Google Scholar] [CrossRef]
- Torregrosa-Jaime, B.; Payá, J.; Corberan, J. Design of efficient air-conditioning systems for electric vehicles. SAE Int. J. Altern. Powertrains 2013, 2, 291–303. [Google Scholar] [CrossRef]
- Korukçu, M.Ö.; Kiliç, M. Transient effects of different heating modes on temperature and humidity inside the automobile cabin during heating period. Isi Bilimi Teknigi Dergisi/J. Therm. Sci. Technol. 2012, 32, 101–107. [Google Scholar]
- Hariharan, C.; Gunadevan, D.; Prakash, S.A.; Latha, K.; Raj, V.A.A.; Velraj, R. Simulation of battery energy consumption in an electric car with traction and HVAC model for a given source and destination for reducing the range anxiety of the driver. Energy 2022, 249, 123657. [Google Scholar] [CrossRef]
- Lahlou, A.; Ossart, F.; Boudard, E.; Roy, F.; Bakhouya, M. A dynamic programming approach for thermal comfort control in electric vehicles. In Proceedings of the 2018 IEEE Vehicle Power and Propulsion Conference, Chicago, IL, USA, 27–30 August 2018; pp. 1–6. [Google Scholar] [CrossRef]
- Hemmati, S.; Doshi, N.; Hanover, D.; Morgan, C.; Shahbakhti, M. Integrated cabin heating and powertrain thermal energy management for a connected hybrid electric vehicle. Appl. Energy 2021, 283, 116353. [Google Scholar] [CrossRef]
- Göltz, S.; Sawodny, O. Design and comparison of model-based controllers for an automotive air conditioning system in an electric vehicle. Control Eng. Pract. 2023, 130, 105376. [Google Scholar] [CrossRef]
- Russi, L.; Guidorzi, P.; Pulvirenti, B.; Aguiari, D.; Pau, G.; Semprini, G. Air Quality and Comfort Characterisation within an Electric Vehicle Cabin in Heating and Cooling Operations. Sensors 2022, 22, 543. [Google Scholar] [CrossRef] [PubMed]
- Bellocchi, S.; Guizzi, G.L.; Manno, M.; Salvatori, M.; Zaccagnini, A. Reversible heat pump HVAC system with regenerative heat exchanger for electric vehicles: Analysis of its impact on driving range. Appl. Therm. Eng. 2018, 129, 290–305. [Google Scholar] [CrossRef]
- Sevilgen, G.; Kiliç, M.; Bayram, H.; Başak, E.; Dursun, H. The investigation of the innovative hybrid heat pump system designed and prototyped for heating process of electric vehicles. Alex. Eng. J. 2023, 68, 417–435. [Google Scholar] [CrossRef]
- Tan, L.; Yuan, Y. Computational fluid dynamics simulation and performance optimization of an electrical vehicle Air-conditioning system. Alex. Eng. J. 2022, 61, 315–328. [Google Scholar] [CrossRef]
- Rezaei, H.; Ghomsheh, M.J.; Kowsary, F.; Ahmadi, P. Performance assessment of a range-extended electric vehicle under real driving conditions using novel PCM-based HVAC system. Sustain. Energy Technol. Assess. 2021, 47, 101527. [Google Scholar] [CrossRef]
- Kwak, K.H.; Kim, J.; Chen, Y.; Kim, Y.; Jung, D. Economic Model Predictive Control of HVAC System in Electric Vehicles. IFAC-PapersOnLine 2021, 54, 852–857. [Google Scholar] [CrossRef]
- Penning, A.K.; Weibel, J.A. Assessing the influence of glass properties on cabin solar heating and range of an electric vehicle using a comprehensive system model. Appl. Energy 2023, 339, 120973. [Google Scholar] [CrossRef]
- De Nunzio, G.; Sciarretta, A.; Steiner, A.; Mladek, A. Thermal management optimization of a heat-pump-based HVAC system for cabin conditioning in electric vehicles. In Proceedings of the Thirteenth International Conference on Ecological Vehicles and Renewable Energies (EVER), Monte Carlo, Monaco, 10–12 April 2018. [Google Scholar]
- Chen, Y.; Kwak, K.H.; Kim, J.; Jung, D.D.; Kim, Y. Control-oriented Model of HVAC and Battery Cooling Systems in Electric Vehicles. IFAC-PapersOnLine 2022, 55, 44–49. [Google Scholar] [CrossRef]
- Suh, I.S.; Shin, E.G. Control algorithm of HVAC system power management in OLEV® application. J. Integr. Des. Process Sci. 2011, 15, 29–42. [Google Scholar]
- Schaut, S.; Sawodny, O. Thermal Management for the Cabin of a Battery Electric Vehicle Considering Passengers’ Comfort. IEEE Trans. Control Syst. Technol. 2020, 28, 1476–1492. [Google Scholar] [CrossRef]
- Şen, M.; Özcan, M.; Eker, Y.R. Fuzzy Logic-Based Energy Management System for Regenerative Braking of Electric Vehicles with Hybrid Energy Storage System. Appl. Sci. 2024, 14, 3077. [Google Scholar] [CrossRef]
- Kılıç, M.; Yiğit, A. Isı Transferi, 6th ed.; Dora Yayıncılık: Bursa, Turkey, 2018. (In Turkish) [Google Scholar]
- Marotta, A.; Pavlovic, J.; Ciuffo, B.; Serra, S.; Fontaras, G. Gaseous Emissions from Light-Duty Vehicles: Moving from NEDC to the New WLTP Test Procedure. Environ. Sci. Technol. 2015, 49, 8315–8322. [Google Scholar] [CrossRef]
- Bielaczyc, P.; Woodburn, J.; Szczotka, A. A Comparison of Carbon Dioxide Exhaust Emissions and Fuel Consumption for Vehicles Tested over the NEDC, FTP-75 and WLTC Chassis Dynamometer Test Cycles. SAE Tech. Pap. 2015. [Google Scholar] [CrossRef]
Disclaimer/Publisher’s Note: The statements, opinions and data contained in all publications are solely those of the individual author(s) and contributor(s) and not of MDPI and/or the editor(s). MDPI and/or the editor(s) disclaim responsibility for any injury to people or property resulting from any ideas, methods, instructions or products referred to in the content. |
© 2024 by the authors. Licensee MDPI, Basel, Switzerland. This article is an open access article distributed under the terms and conditions of the Creative Commons Attribution (CC BY) license (https://creativecommons.org/licenses/by/4.0/).