

Collaborative Analysis of Learners’ Emotional States Based on Cross-Modal Higher-Order Reasoning


Abstract
1. Introduction
2. Related Works
2.1. Cross-Modal Feature Fusion
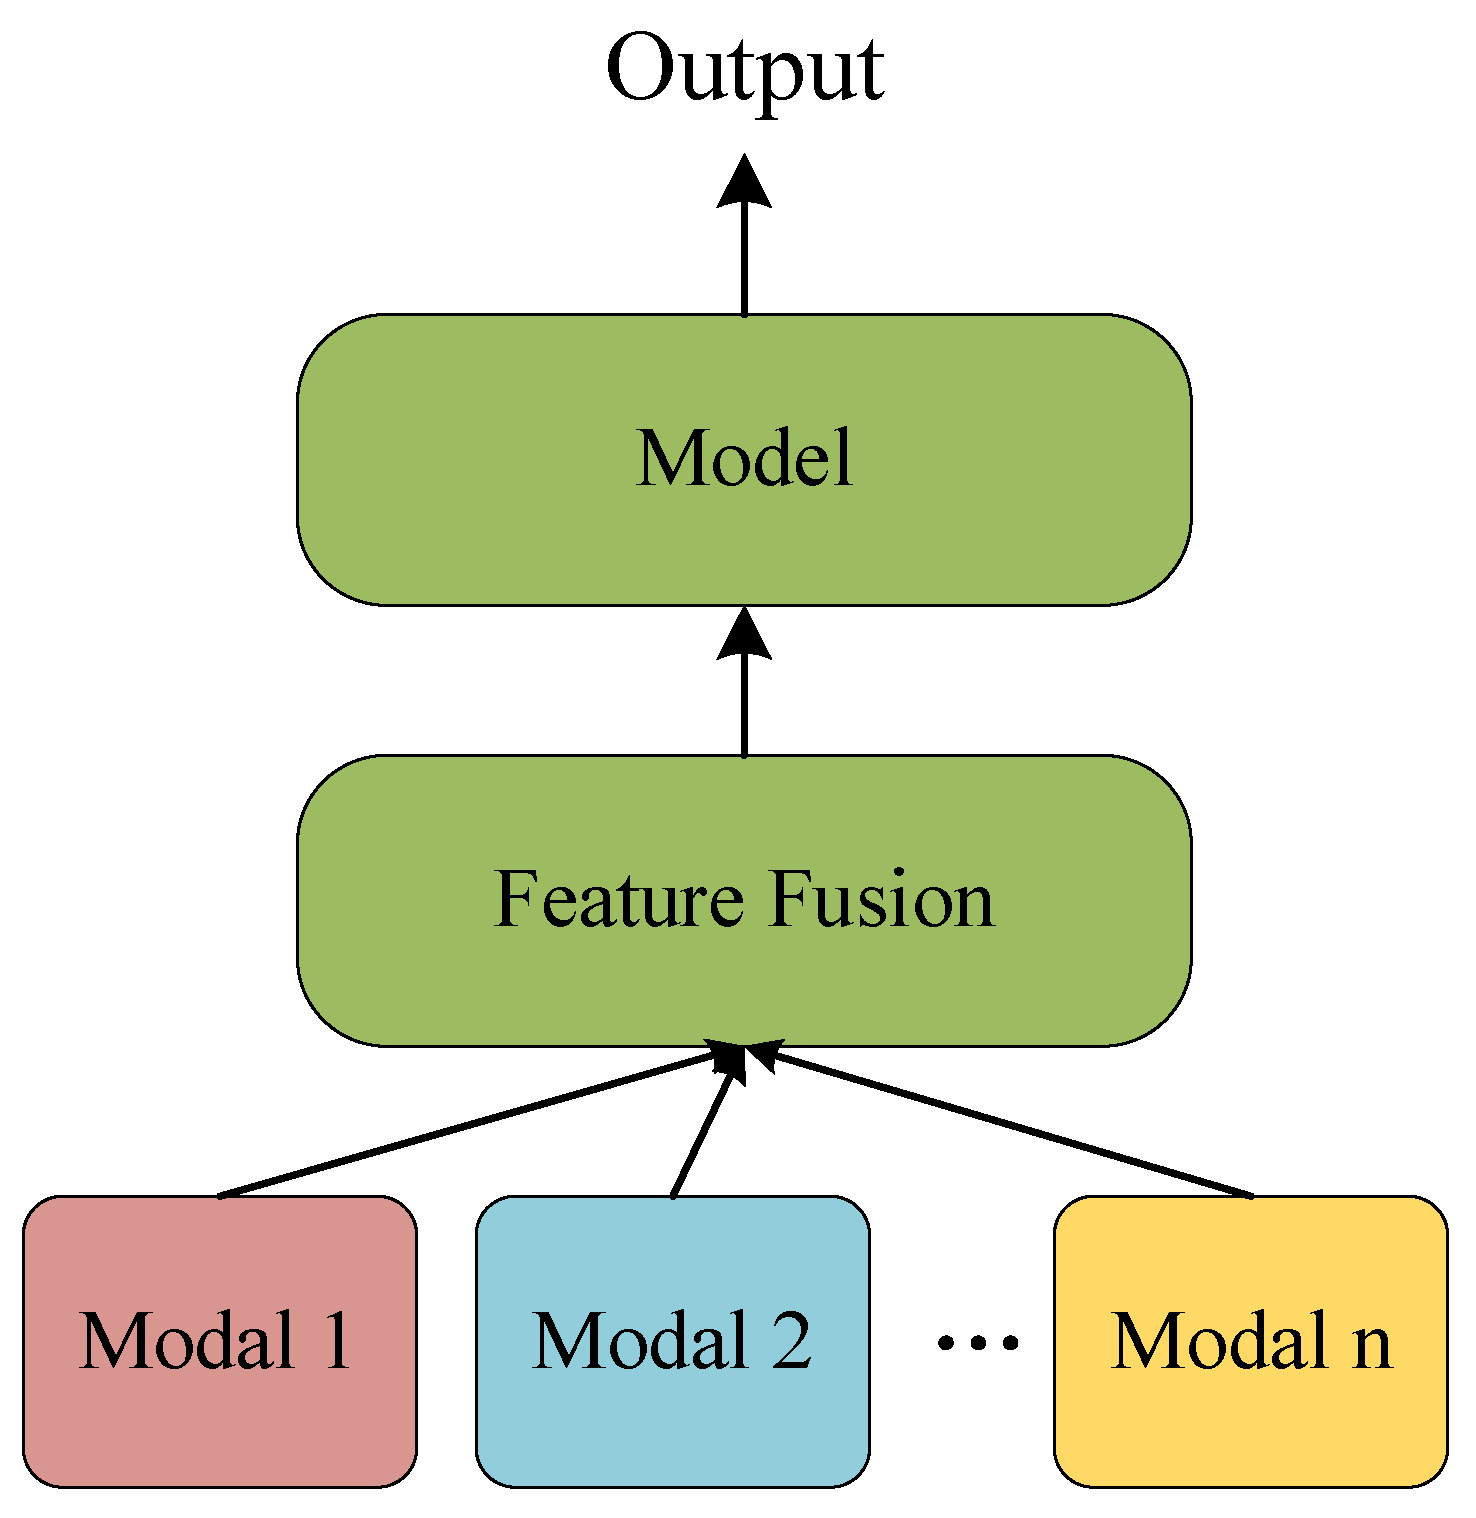
2.1.1. Early Fusion
2.1.2. Late fusion
2.1.3. Hybrid Fusion
2.2. Attention Mechanism
3. Methods
3.1. Overall Architecture
3.2. Modality Feature Extraction Module
3.3. Modality Attention Extraction Module
3.4. Cross-Modal Attention Cooperative Interaction Module
3.5. Emotion Prediction Module
4. Experiments
4.1. Experimental Environment
4.2. Dataset
4.3. Evaluation Metrics
4.4. Module Ablation Experiments
4.5. Network Comparison Experiment
5. Conclusions
Author Contributions
Funding
Data Availability Statement
Conflicts of Interest
References
- Wei, Q.; Sun, B.; He, J.; Yu, L. BNU-LSVED 2.0: Spontaneous multimodal student affect database with multi-dimensional labels. Signal Process. Image Commun. 2017, 59, 168–181. [Google Scholar] [CrossRef]
- Trabelsi, Z.; Alnajjar, F.; Parambil, M.M.A.; Gochoo, M.; Ali, L. Real-Time Attention Monitoring System for Classroom: A Deep Learning Approach for Student’s Behavior Recognition. Big Data Cogn. Comput. 2023, 7, 48. [Google Scholar] [CrossRef]
- Ma, L.; Lu, Z.; Shang, L.; Li, H. Multimodal convolutional neural networks for matching image and sentence. In Proceedings of the IEEE International Conference on Computer Vision, Washington, DC, USA, 7–13 December 2015; pp. 2623–2631. [Google Scholar]
- Poria, S.; Cambria, E.; Bajpai, R.; Hussain, A. A review of affective computing: From unimodal analysis to multimodal fusion. Inf. Fusion. 2017, 37, 98–125. [Google Scholar] [CrossRef]
- Pantic, M.; Rothkrantz, L. Facial Action Recognition for Facial Expression Analysis From Static Face Images. IEEE Trans. Syst. Man Cybern.-Part B 2004, 34, 1449–1461. [Google Scholar] [CrossRef] [PubMed]
- Bashyal, S.; Venayagamoorthy, G. Recognition of Facial Expression Using Gabor Wavelets and Learning Vector Quantization. Eng. Appl. Artif. Intell. 2008, 21, 1056–1064. [Google Scholar] [CrossRef]
- Cheon, Y.; Kim, D. Natural Facial Expression Recognition Using Differential-AAM and Manifold Learning. Pattern Recognit. 2009, 42, 1340–1350. [Google Scholar] [CrossRef]
- Shan, C.F.; Gong, S.G.; Peter, W. A Comprehensive Empirical Study on Linear Subspace Methods for Facial Expression Analysis. In Proceedings of the IEEE Computer Society Conference on Computer Vision and Pattern Recognition Workshop, Washington, DC, USA, 17–22 June 2006; pp. 153–158. [Google Scholar]
- Chen, G.; Zhang, P.; Wang, T. A review of multimodal sentiment analysis. J. Commun. Univ. China (Nat. Sci. Ed.) 2022, 29, 70–78. [Google Scholar]
- Lin, S.; Zhang, X.; Guo, M. Research on emotion recognition methods based on audio and video. Signal Process. 2021, 37, 1889–1898. [Google Scholar]
- Degottex, G.; Kane, J.; Drugman, T.; Raitio, T.; Scherer, S. COVAREP—A collaborative voice analysis repository for speech technologies. In Proceedings of the 2014 IEEE International Conference on Acoustics, Speech and Signal Processing (ICASSP), Florence, Italy, 4–9 May 2014; pp. 960–964. [Google Scholar]
- Baltrusaitis, T.; Robinson, P.; Morency, L.P. OpenFace: An open source facial behavior analysis toolkit. In Proceedings of the 2016 IEEE Winter Conference on Applications of Computer Vision (WACV), Lake Placid, NY, USA, 7–10 March 2016; pp. 1–10. [Google Scholar]
- He, K.; Zhang, X.; Ren, S.; Sun, J. Deep residual learning for image recognition. In Proceedings of the IEEE Conference on Computer Vision and Pattern Recognition, Las Vegas, NV, USA, 7–10 March 2016; pp. 770–778. [Google Scholar]
- Devlin, J.; Chang, M.W.; Lee, K.; Toutanova, K. BERT: Pre-training of deep bidirectional transformers for language understanding. In Proceedings of the 2019 Conference of the North American Chapter of the Association for Computational Linguistics: Human Language Technologies, Volume 1 (Long and Short Papers), Minneapolis, MN, USA, 2–7 June 2019; pp. 4171–4186. [Google Scholar]
- Sahay, S.; Okur, E.; Kumar, S.H.; Nachman, L. Low rank fusion based transformers for multimodal sequences. In Proceedings of the 58th Annual Meeting of the Association for Computational Linguistics, Online, 5–10 July 2020; p. 2934. [Google Scholar]
- Zadeh, A.; Chen, M.; Poria, S.; Cambria, E.; Morency, L.-P. Tensor fusion network for multimodal sentiment analysis. In Proceedings of the 2017 Conference on Empirical Methods in Natural Language Processing, Copenhagen, Denmark, 9–11 September 2017; pp. 1103–1114. [Google Scholar]
- Zadeh, A.; Liang, P.P.; Mazumder, N.; Poria, S.; Cambria, E.; Morency, L.-P. Memory fusion network for multi-view sequential learning. In Proceedings of the AAAI Conference on Artificial Intelligence, New Orleans, LA, USA, 2–7 February 2018; pp. 5634–5641. [Google Scholar]
- Tsai, Y.H.; Bai, S.; Liang, P.P.; Kolter, J.Z.; Morency, L.-P.; Salakhutdinov, R. Multimodal transformer for unaligned multimodal language sequences. In Proceedings of the 57th Annual Meeting of the Association for Computational Linguistics, Florence, Italy, 28 July–2 August 2 2019; pp. 6558–6569. [Google Scholar]


| Parameter | Value |
|---|---|
| Dropout | 0.1 |
| Batch size | 32 |
| Epoch | 180 |
| Optimizer | AdamW |
| Learning rate | 1 × 10⁻⁴ |
| Weight decay | 1 × 10⁻² |
| Attention head | 2 |
| CSMD | Mae | Corr | Acc-6 | F1 |
|---|---|---|---|---|
| ResNet50 | 1.212 | 0.505 | 39.1 | 68.2 |
| Bert | 1.032 | 0.579 | 46.8 | 77.0 |
| LMF | 1.074 | 0.569 | 45.1 | 75.1 |
| TFN | 1.057 | 0.577 | 46.5 | 76.4 |
| GMFN | 1.014 | 0.58 | 48.0 | 77.5 |
| MFN | 0.989 | 0.594 | 48.2 | 77.2 |
| MulT | 0.984 | 0.612 | 49.3 | 79.2 |
| ACAM | 0.976 | 0.618 | 49.9 | 80.5 |
Disclaimer/Publisher’s Note: The statements, opinions and data contained in all publications are solely those of the individual author(s) and contributor(s) and not of MDPI and/or the editor(s). MDPI and/or the editor(s) disclaim responsibility for any injury to people or property resulting from any ideas, methods, instructions or products referred to in the content. |
© 2024 by the authors. Licensee MDPI, Basel, Switzerland. This article is an open access article distributed under the terms and conditions of the Creative Commons Attribution (CC BY) license (https://creativecommons.org/licenses/by/4.0/).
Share and Cite
Wu, W.; Zhao, J.; Shen, X.; Feng, G. Collaborative Analysis of Learners’ Emotional States Based on Cross-Modal Higher-Order Reasoning. Appl. Sci. 2024, 14, 5513. https://doi.org/10.3390/app14135513
Wu W, Zhao J, Shen X, Feng G. Collaborative Analysis of Learners’ Emotional States Based on Cross-Modal Higher-Order Reasoning. Applied Sciences. 2024; 14(13):5513. https://doi.org/10.3390/app14135513
Chicago/Turabian StyleWu, Wenyan, Jingtao Zhao, Xingbo Shen, and Guang Feng. 2024. "Collaborative Analysis of Learners’ Emotional States Based on Cross-Modal Higher-Order Reasoning" Applied Sciences 14, no. 13: 5513. https://doi.org/10.3390/app14135513
APA StyleWu, W., Zhao, J., Shen, X., & Feng, G. (2024). Collaborative Analysis of Learners’ Emotional States Based on Cross-Modal Higher-Order Reasoning. Applied Sciences, 14(13), 5513. https://doi.org/10.3390/app14135513