Abstract
As a strong interference source for the all-time optical imaging surveillance of maritime targets, sea surface glare is difficult to mitigate accurately because of its time-varying characteristics due to lighting conditions and seawater fluctuations. In this paper, we propose an adaptive suppression approach to sea surface glare, which establishes a geographic polarization suppression model based on real-time information regarding geographic positioning and the orientation information of the floating platform, and also combines dynamic polarization control and pixel normalization to achieve adaptive suppression of sea surface glare. Experimental results show that this approach can mitigate the influence of rapidly changing glare effectively, and the SSIM indexes between the images without glare and those with glare suppression of the same scenes exceed 0.8, which is suitable for all-time glare suppression on the sea surface under natural lighting conditions.
1. Introduction
Passive optical imaging surveillance serves as a pivotal technique for all-time monitoring of maritime targets, playing a broad supporting role in the advancement of marine domains. Within passive optical monitoring, glare resulting from the reflection of sunlight and moonlight off the sea surface can cause local saturation and distortion in optical detectors, significantly compromising the effectiveness of maritime target surveillance. Thus, accurately suppressing sea surface glare is an urgent issue that needs to be addressed for effective all-time maritime target monitoring [1,2,3,4,5,6,7,8,9,10,11,12,13,14,15,16].
In addressing the suppression of sea surface glare within passive optical imaging, researchers have proposed various solutions. These include the use of the Bidirectional Reflectance Distribution Function (BRDF) [1] model to suppress sea surface glare; suppression based on the physical relationships of different spectral bands [2]; glare suppression using Noise-Driven Suppression of Glare Control (ND-SGC) [3]; and methods based on polarization filtering [4,5,6,7,8,9,10,11,12,13,14,15,16]. Compared to the BRDF model, spectral band relationships, and ND-SGC methods, polarization filtering offers significant advantages in terms of real-time capability, ease of implementation, and suppression effectiveness. In 2006, Luo Yangjie and colleagues [8] discovered that glare could be effectively suppressed when light incidents at the Brewster angle. However, this method’s stringent incident conditions pose implementation challenges at sea. In 2007, Du Jia [9] demonstrated the theoretical possibility of suppressing glare using polarization at non-Brewster angles. Zhao Naizhuo [10] proposed a method for polarization-based glare suppression on the sea surface under ideal indoor mirror conditions, applicable at any incident zenith angle. However, overcoming the effects of sea surface fluctuations remains a challenge in practical applications. Addressing these fluctuations, Zhao et al. [16], in 2016, utilized the Fresnel and Cox–Munk models to establish a mid-wave infrared polarization imaging system, achieving glare suppression by adjusting the angles of dual polarizers in front of the detector. In 2017, Chen Wei and colleagues [11] analyzed the polarization characteristics of sea surface glare and maritime targets, designing a visible light polarization detection system based on a dual linear polarizer.
Although utilizing fixed polarization angles can effectively suppress sea surface glare, this method lacks adaptability to the varying characteristics of the glare. Consequently, researchers have proposed combined image processing approaches to enhance the adaptability of sea surface glare suppression methods. In 2019, Chen Wei et al. [12] introduced a solar glare suppression method based on the fusion of polarimetric radiance maps. In 2021, Ye Song and colleagues [7] implemented effective suppression of sea surface glare through the temporal fusion of image sequences generated with real-time polarization information. Yang Meimei and her team [14] proposed a method combining polarization filtering with polynomial fitting to suppress solar glare. In 2022, Li Yansong et al. [15] combined both single and dual polarizer modes with digital image filtering algorithms to suppress the background of solar glare.
While the integration of fixed polarizers and image processing has improved the adaptability of sea surface glare suppression, its capacity to adapt remains limited. Given the time-varying nature of sea surface glare polarization states, influenced by lighting conditions and water fluctuations, this approach still struggles with precise suppression. Addressing the challenge of enhancing the adaptability of sea surface glare suppression, this paper proposes a method based on a geographic polarization suppression model. By constructing a model to calculate real-time positioning and orientation information, dynamically adjusting the polarization suppression based on these calculations, and utilizing pixel normalization techniques, this method enhances the potential for polarization suppression of sea surface glare. Additionally, it differentiates the impacts of sunlight and moonlight based on geographic and astronomical data, enabling precise all-time suppression of sea surface glare.
Precise and efficient methods of sea surface glare suppression play a crucial role in advancing marine surface optical imaging technology. In the field of marine environmental remote sensing, effective glare suppression methods can significantly enhance the accuracy of marine remote sensing data, thus making the monitoring and analysis of marine biological community distribution, marine pollution, and the impact of climate change more precise. In marine scientific expeditions, glare suppression can optimize the quality of image collection, providing researchers with high-resolution image information. In drone-based marine environmental monitoring, effective suppression of sea surface glare further improves the quality of the acquired images, offering more efficient support for marine exploration, maritime target tracking, and maritime environmental regulation. Therefore, methods of sea surface glare suppression not only directly enhance the effectiveness of marine surface imaging, but also contribute significantly to the development of marine science and technology. The remainder of this paper is organized as follows: Section 2 introduces the basic principles of the proposed algorithm, including an analysis of the polarization characteristics of sea surface glare, the geographic polarization suppression model, and the pixel normalization method. Section 3 validates and analyzes the proposed method through experiments. Section 4 concludes the paper by summarizing the content.
2. Materials and Methods
The method described in this paper is based on the polarization characteristics of sea surface glare and the temporal variation of these polarization properties, facilitating adaptive polarization suppression of the glare. By constructing a geographic polarization suppression model and combining it with a pixel normalization technique, we achieve real-time, stable adaptive polarization suppression of sea surface glare throughout the day. The general methodological flowchart for sea surface glare suppression is shown in Figure 1.
Figure 1.
General methodological flowchart for sea surface glare suppression.
2.1. Relationship between Glare Polarization Characteristics and Angle of Incidence
The sea surface glare produced by the reflection of sunlight and moonlight off the sea surface exhibits distinct polarization characteristics [17,18]. Consequently, the sea surface glare can be decomposed into two polarization components: the s-component, which is perpendicular to the plane of incidence, and the p-component, which is parallel to the plane of incidence. The expressions for the reflection coefficients of these two polarization components are as follows:
Herein, represents the angle of incidence of light on the sea surface; denotes the angle of refraction of light entering the seawater; is the refractive index of the air above the sea surface; and is the refractive index of seawater. Based on the reflection coefficients of the two polarization components, the degree of polarization P of the sea surface glare is quantified as follows:
Combining the expression for the degree of polarization of sea surface glare with the Fresnel principles demonstrates that the polarization degree of sea surface glare varies with the changing angle of incidence of light. Hence, the polarization characteristics of sea surface glare are dependent on the light’s angle of incidence.
2.2. Geographic Polarization Suppression Model
2.2.1. Real-Time Positioning Information Solution Method
Based on the analysis of the three-dimensional schematic of light reflection on the sea surface, the geometric relationship between the angle of incidence and the solar or lunar altitude angle is determined. As shown in Figure 2, S represents the position of the sun or moon, O is the point of reflection on the sea surface, and P is the camera position, with representing the solar or lunar azimuth angle, the solar or lunar altitude angle, and the angle of incidence of the solar or lunar light on the sea surface. The geometric relationship between the angle of incidence and the solar or lunar altitude angle, as derived from Figure 2, is as follows:
Figure 2.
Three-dimensional schematic of the sun and moon reflections on the sea surface.
The solar and lunar altitude angles are calculated based on real-time information, and the calculation method is as follows.
- Solar Position Calculation
In the equation, represents the solar declination angle; is the observer’s latitude; is the solar hour angle; is the solar altitude angle; and is the solar azimuth angle. The solar declination angle is calculated using the Yu operator, and the solar hour angle is calculated using the Wloof operator [19].
- Lunar Position Calculation
The lunar longitude and latitude are calculated using the lunar calculation scheme referenced in ELP/MPP02 [20] and the lunar position periodic term calculation table developed from document [21], as shown in Equation (6).
Here, represents the lunar longitude; represents the lunar latitude; is the mean lunar longitude; is the longitude perturbation term; is the latitude perturbation term; and represents the number of relative Julian centuries. The perturbations in longitude and latitude can be calculated using the periodic term calculation table from document [21].
Subsequently, the longitude and latitude are converted into right ascension and declination, as shown in Equation (7):
Here, represents the right ascension, represents the lunar declination, and represents the obliquity of the ecliptic. The formula for calculating the obliquity of the ecliptic is shown as Equation (8):
The lunar hour angle is calculated using the lunar right ascension , and the calculation is as follows:
Here, represents the lunar hour angle, represents Greenwich sidereal time, and represents the longitude value of the observation point.
Finally, the lunar declination and lunar hour angle are converted into the lunar azimuth angle and altitude angle.
Here, represents the lunar azimuth angle, represents the lunar altitude angle, and represents the latitude value of the observation point.
Therefore, the expression for the solar and lunar altitude angles is shown in Equation (11), and the light incidence angle is shown in Equation (12).
Here, represents the longitude value of the observation point; represents the latitude value of the observation point; represents the solar and lunar declination angle; represents the solar and lunar hour angle; represents the time information; and represents the solar and lunar light incidence angle.
2.2.2. Orientation Information Solution Method
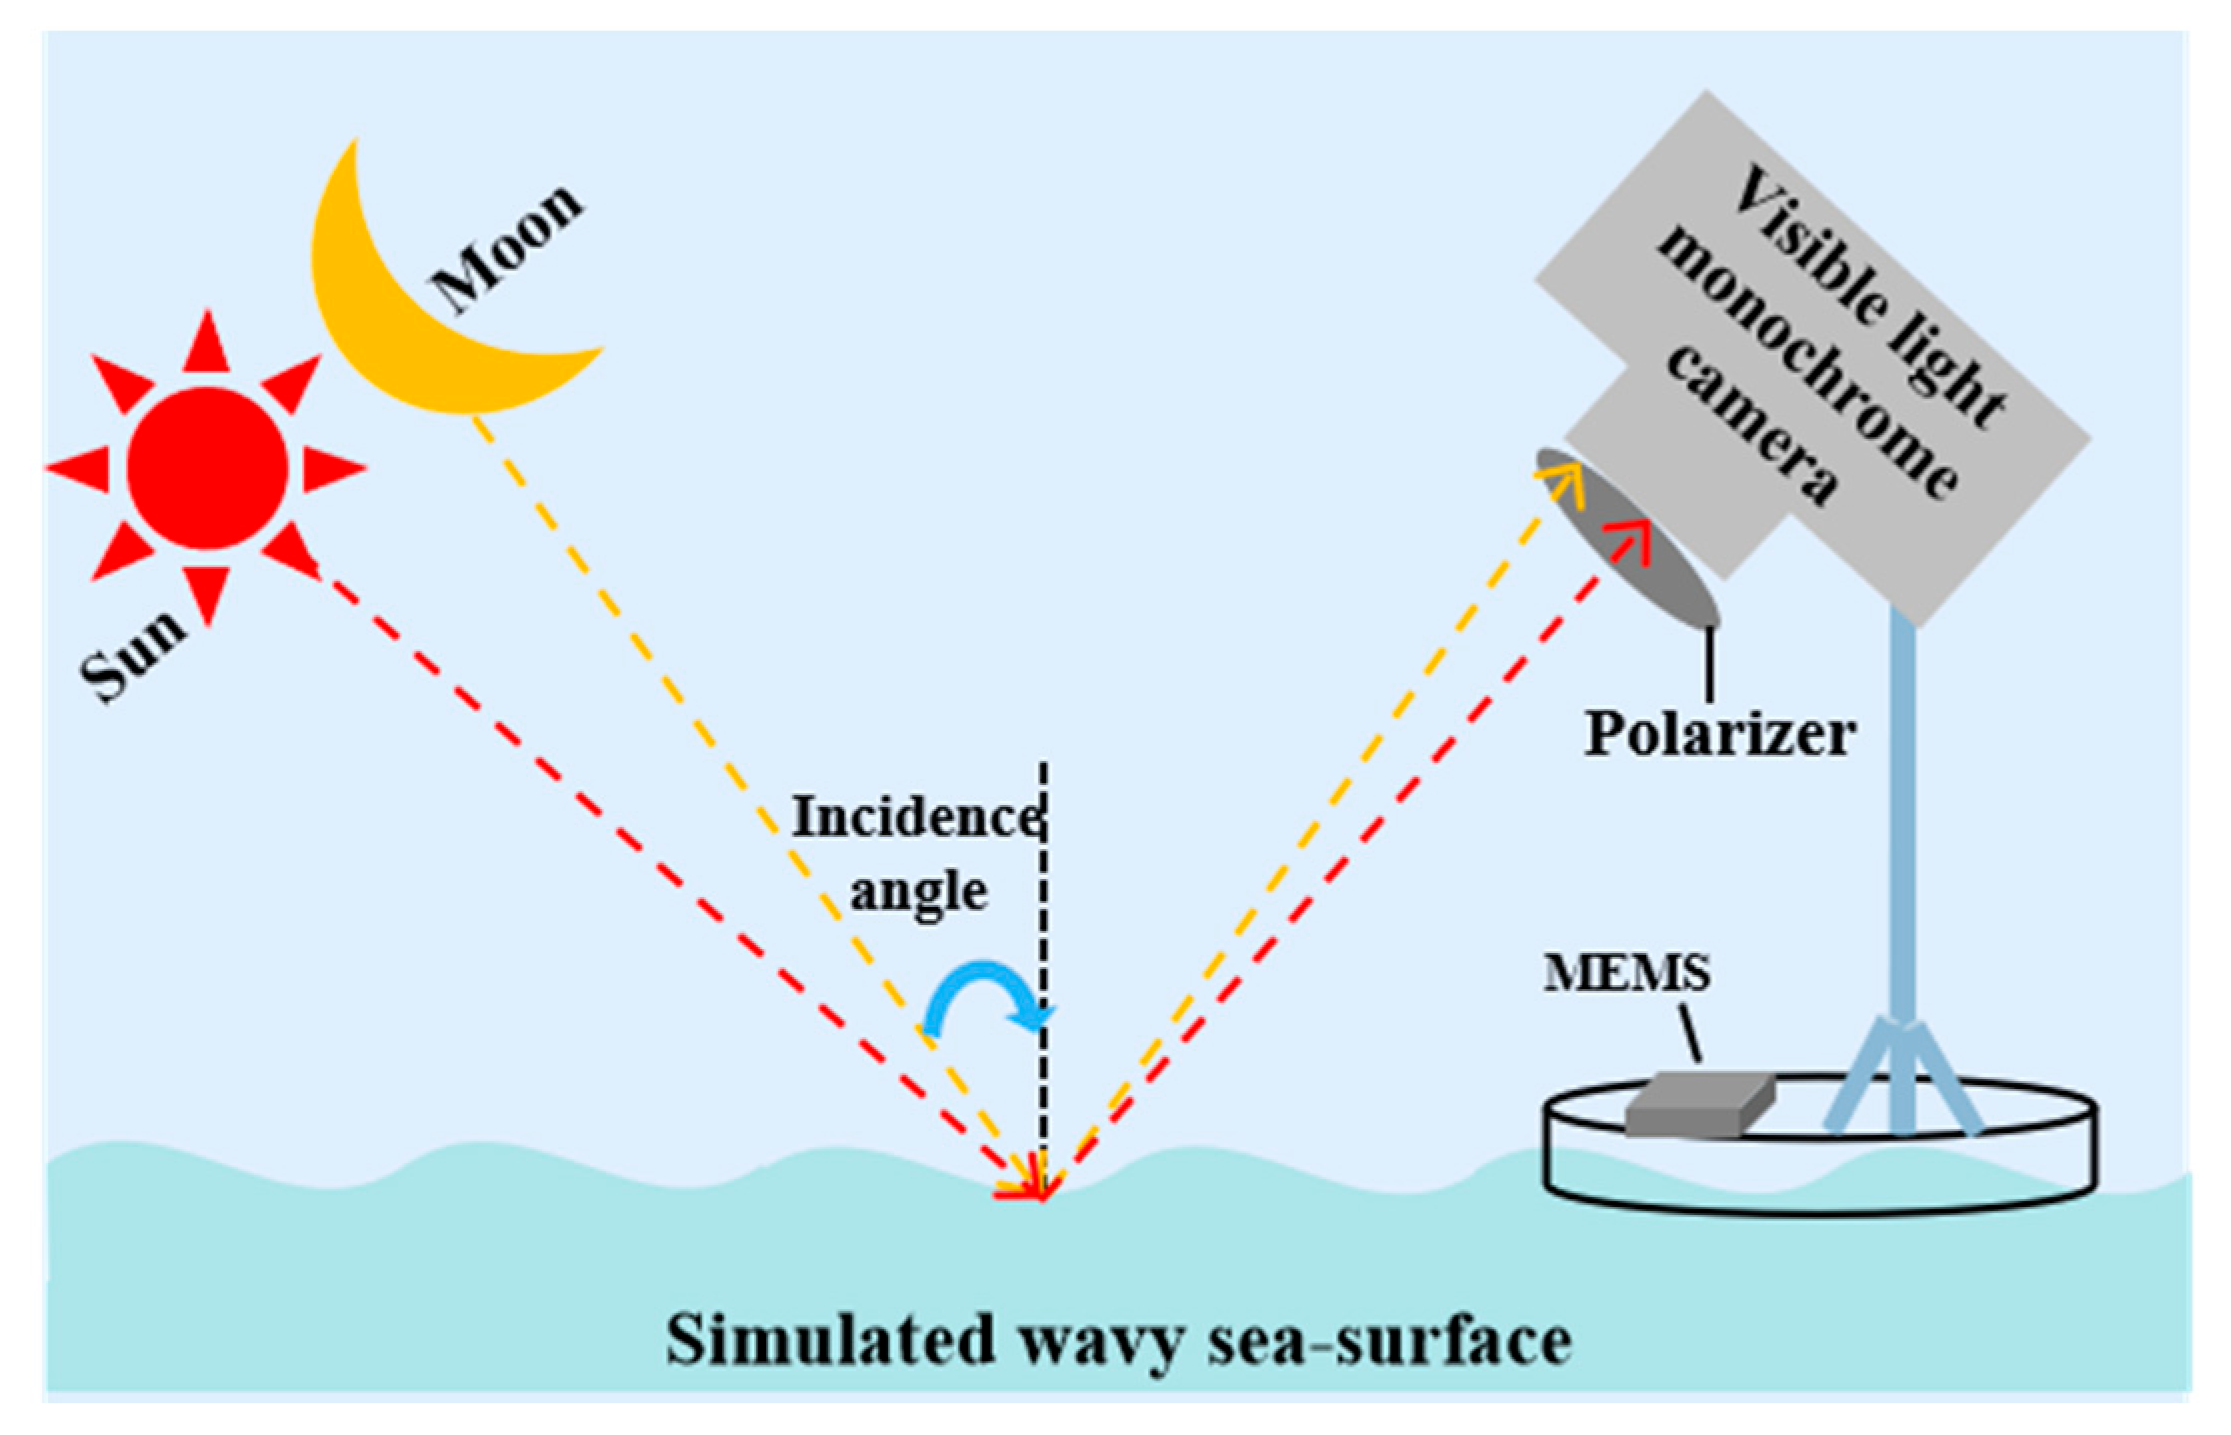
The inherent fluctuation of the sea surface significantly impacts the stable imaging of maritime monitoring platforms, complicating the effective suppression of sea surface glare. To address this challenge, this study employs an orientation information solution method to mitigate the effects of sea surface fluctuations.
During the implementation process, MEMS inertial sensors are utilized to capture the gyroscope’s angular velocity, and in conjunction with the orientation information solution method, precise orientation data is extracted. Within the orientation angle solution framework, Euler angles, direction cosine, and quaternion methods are extensively employed. However, the quaternion method is favored in this paper due to its low computational complexity, absence of singularities, capacity for comprehensive orientation measurement, and superior measurement accuracy [22].
Let quaternion be defined, where is a real number, and represents mutually orthogonal unit vectors. The quaternion solution expression is shown in Equation (13).
Here, the initial values of are 1, 0, 0, and 0, respectively, and represent the angular velocity values from the MEMS inertial sensor gyroscope.
The coordinate transformation matrix from the object coordinate system to the geographical coordinate system is denoted as , expressed by the quaternion as follows:
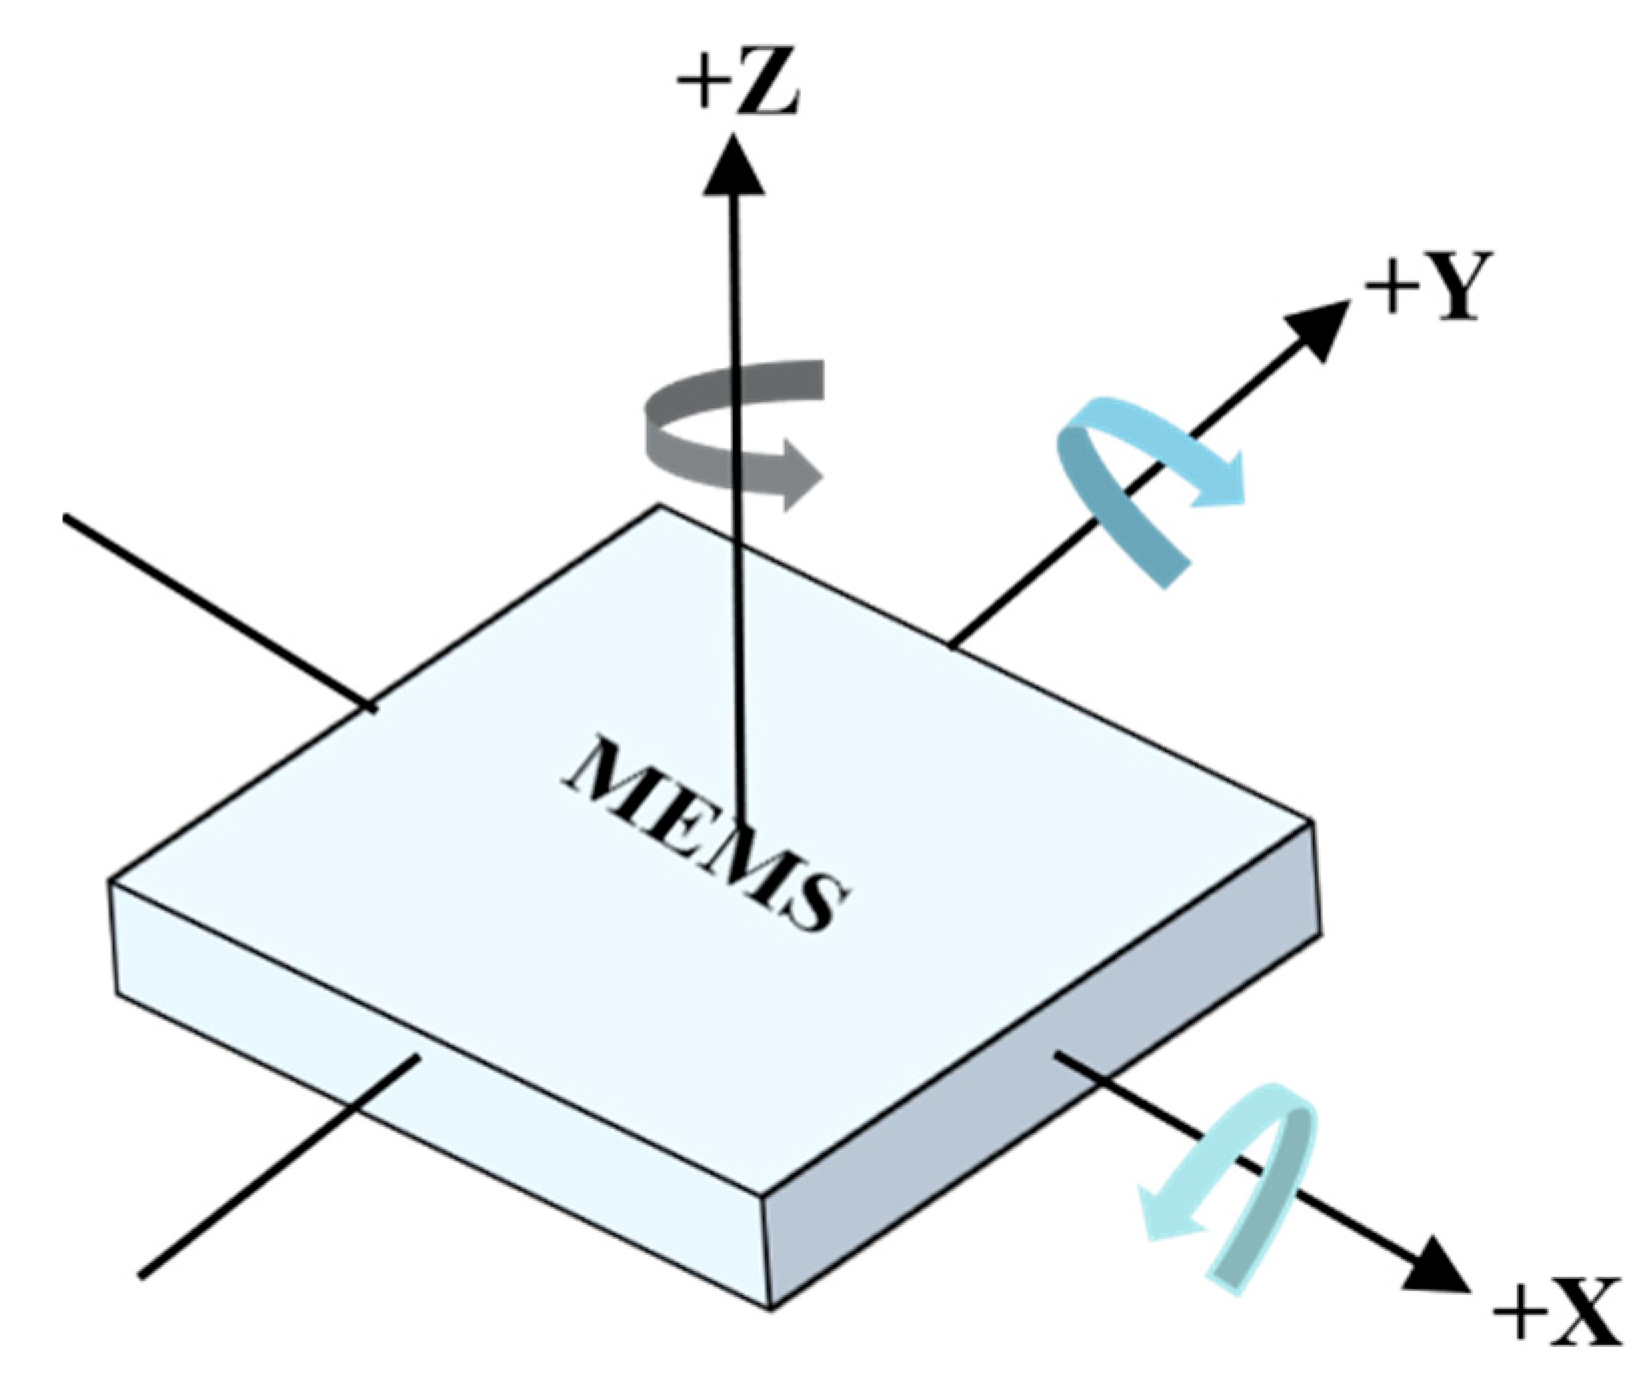
Place the MEMS inertial sensor horizontally with the sensor’s internal center as the origin, horizontally to the right as the x-axis, vertically upward as the z-axis, and directly forward as the y-axis, establishing a spatial Cartesian coordinate system. This coordinate system also aligns with the geographical and the initial object coordinate systems, as illustrated in Figure 3.
Figure 3.
Coordinate system reference diagram.
Define the rotation around the z-axis as the object’s heading angle , with the transformation matrix denoted as ; the rotation around the y-axis as the object’s pitch angle , with the transformation matrix as ; and the rotation around the x-axis as the object’s roll angle , with the transformation matrix as . The transformation matrices , , and are shown in Equation (15).
The object’s orientation transformation is equivalent to the composite rotation of the object around the x, y, and z axes. The composite orientation matrix is , with the rotation sequence in this paper being . The post-rotation orientation matrix is shown in Equation (16).
Since the coordinate system remains Cartesian during the rotation from the geographical coordinate system to the object coordinate system, is an orthogonal matrix, implying . By relating and , the expressions for the rotation angles of each axis can be derived, where these rotation angles represent the orientation angles. The expressions for the orientation angles are shown in Equation (17).
By combining Equations (13) and (17), the angle values of the orientation angles can be calculated. Therefore, the orientation information solution is presented as shown in Equation (18).
2.2.3. Geographic Polarization Suppression Model
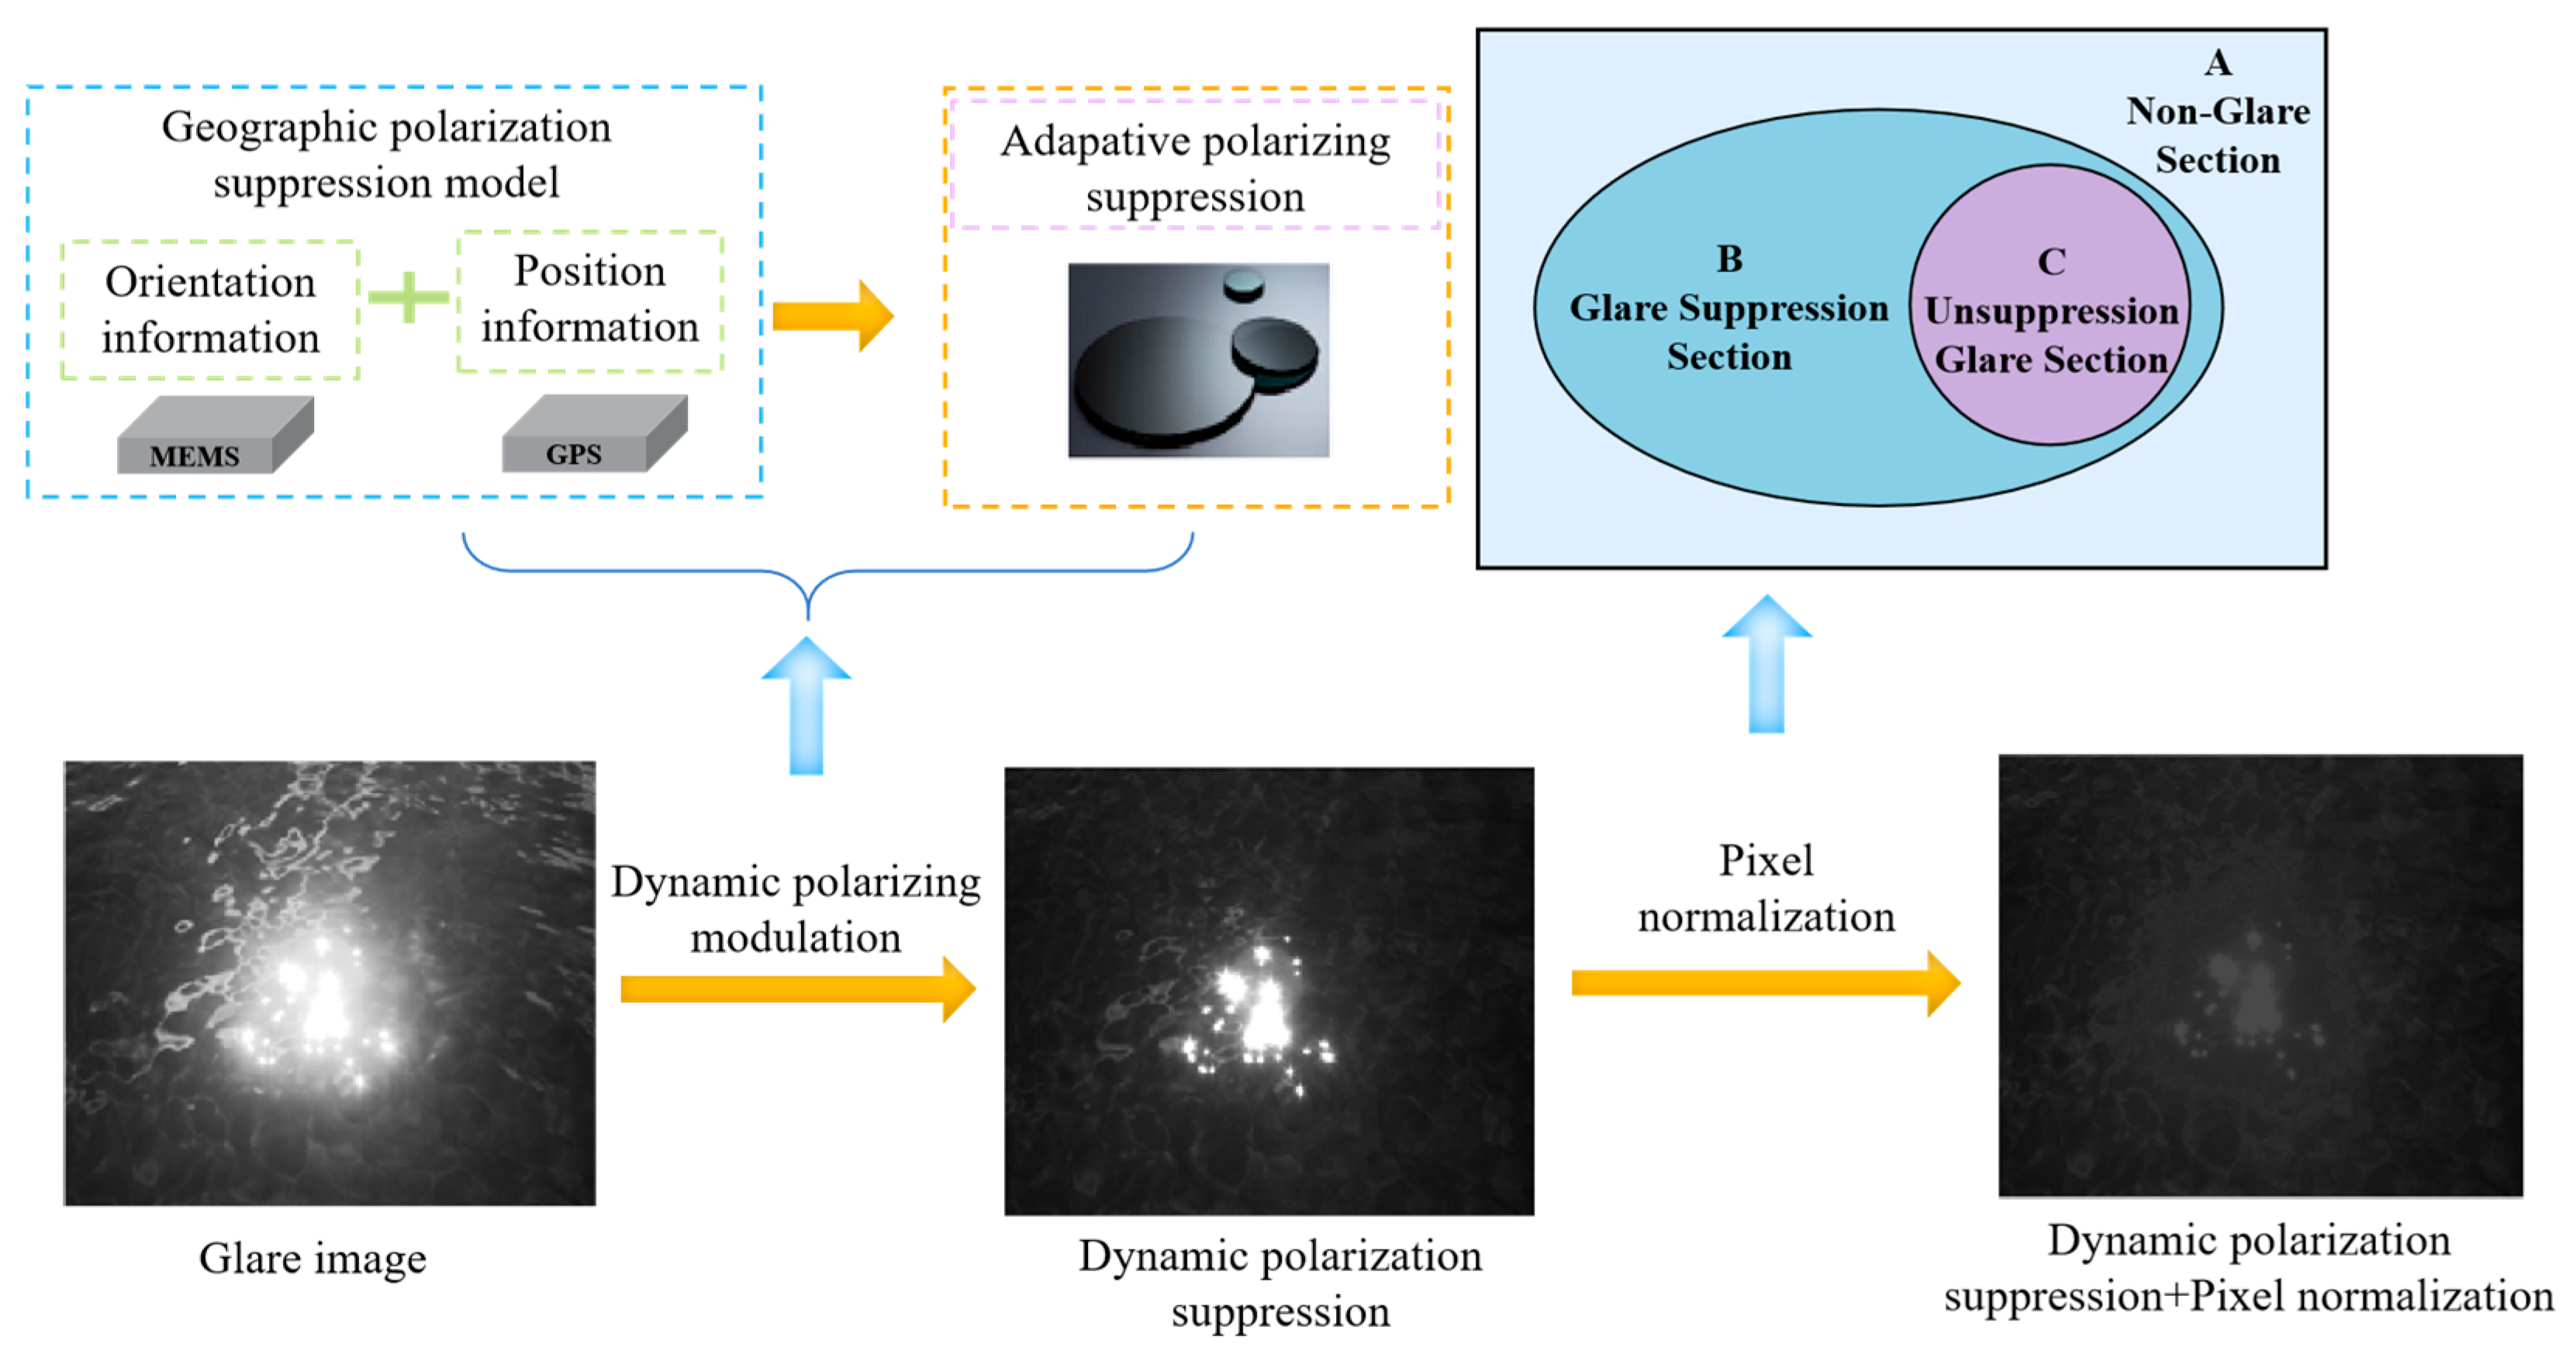
By integrating real-time positioning solutions with orientation information solution methods, a geographic polarization suppression model is developed, as shown in Equation (19).
In the model, represents the real-time positioning solution function, while denotes the orientation information solution function. The model initially acquires GPS data of the measurement point, using the latitude, longitude, and time information as input parameters for the function to calculate the solar or lunar elevation angle and the angle of incidence of light rays. Subsequently, the angular velocity information of the monitoring platform, captured by MEMS sensors, is used as input parameters for the function . The output of is then utilized to mitigate the interference of sea surface wave fluctuations on the monitoring platform.
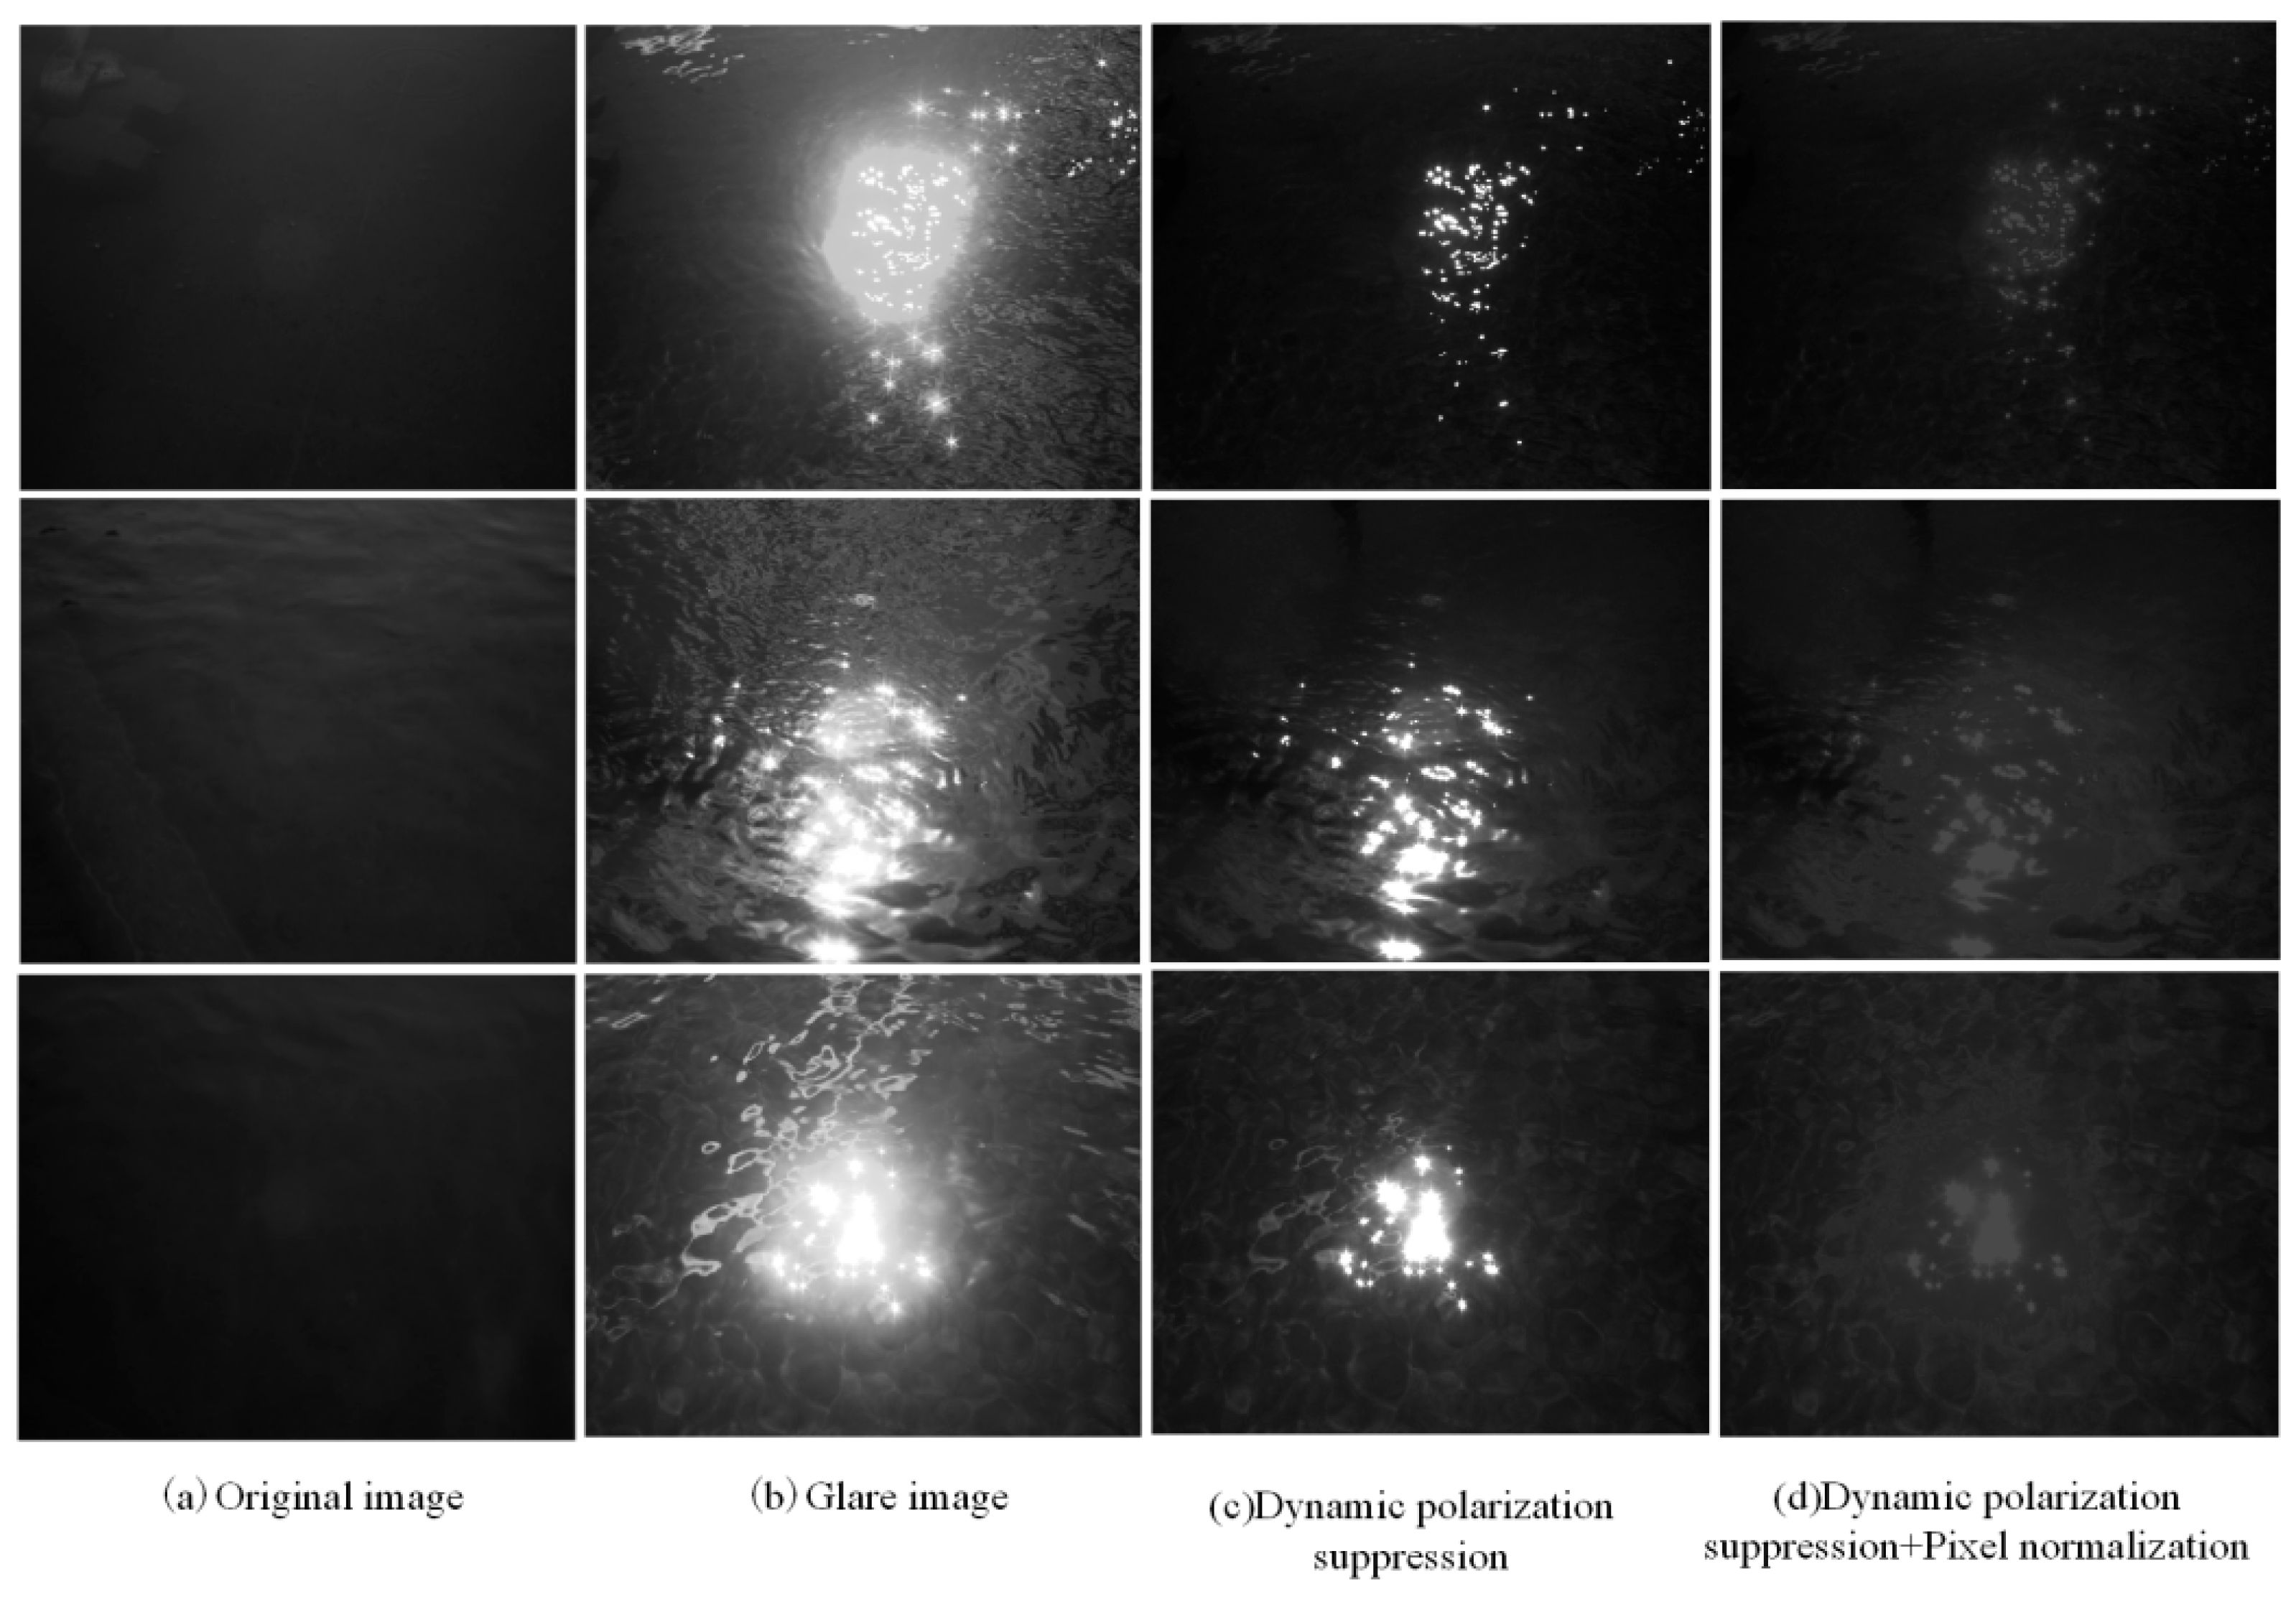
Ultimately, a geographic polarization suppression model is successfully constructed, capable of achieving all-weather, adaptive, and stable polarization suppression of sea surface glare. 
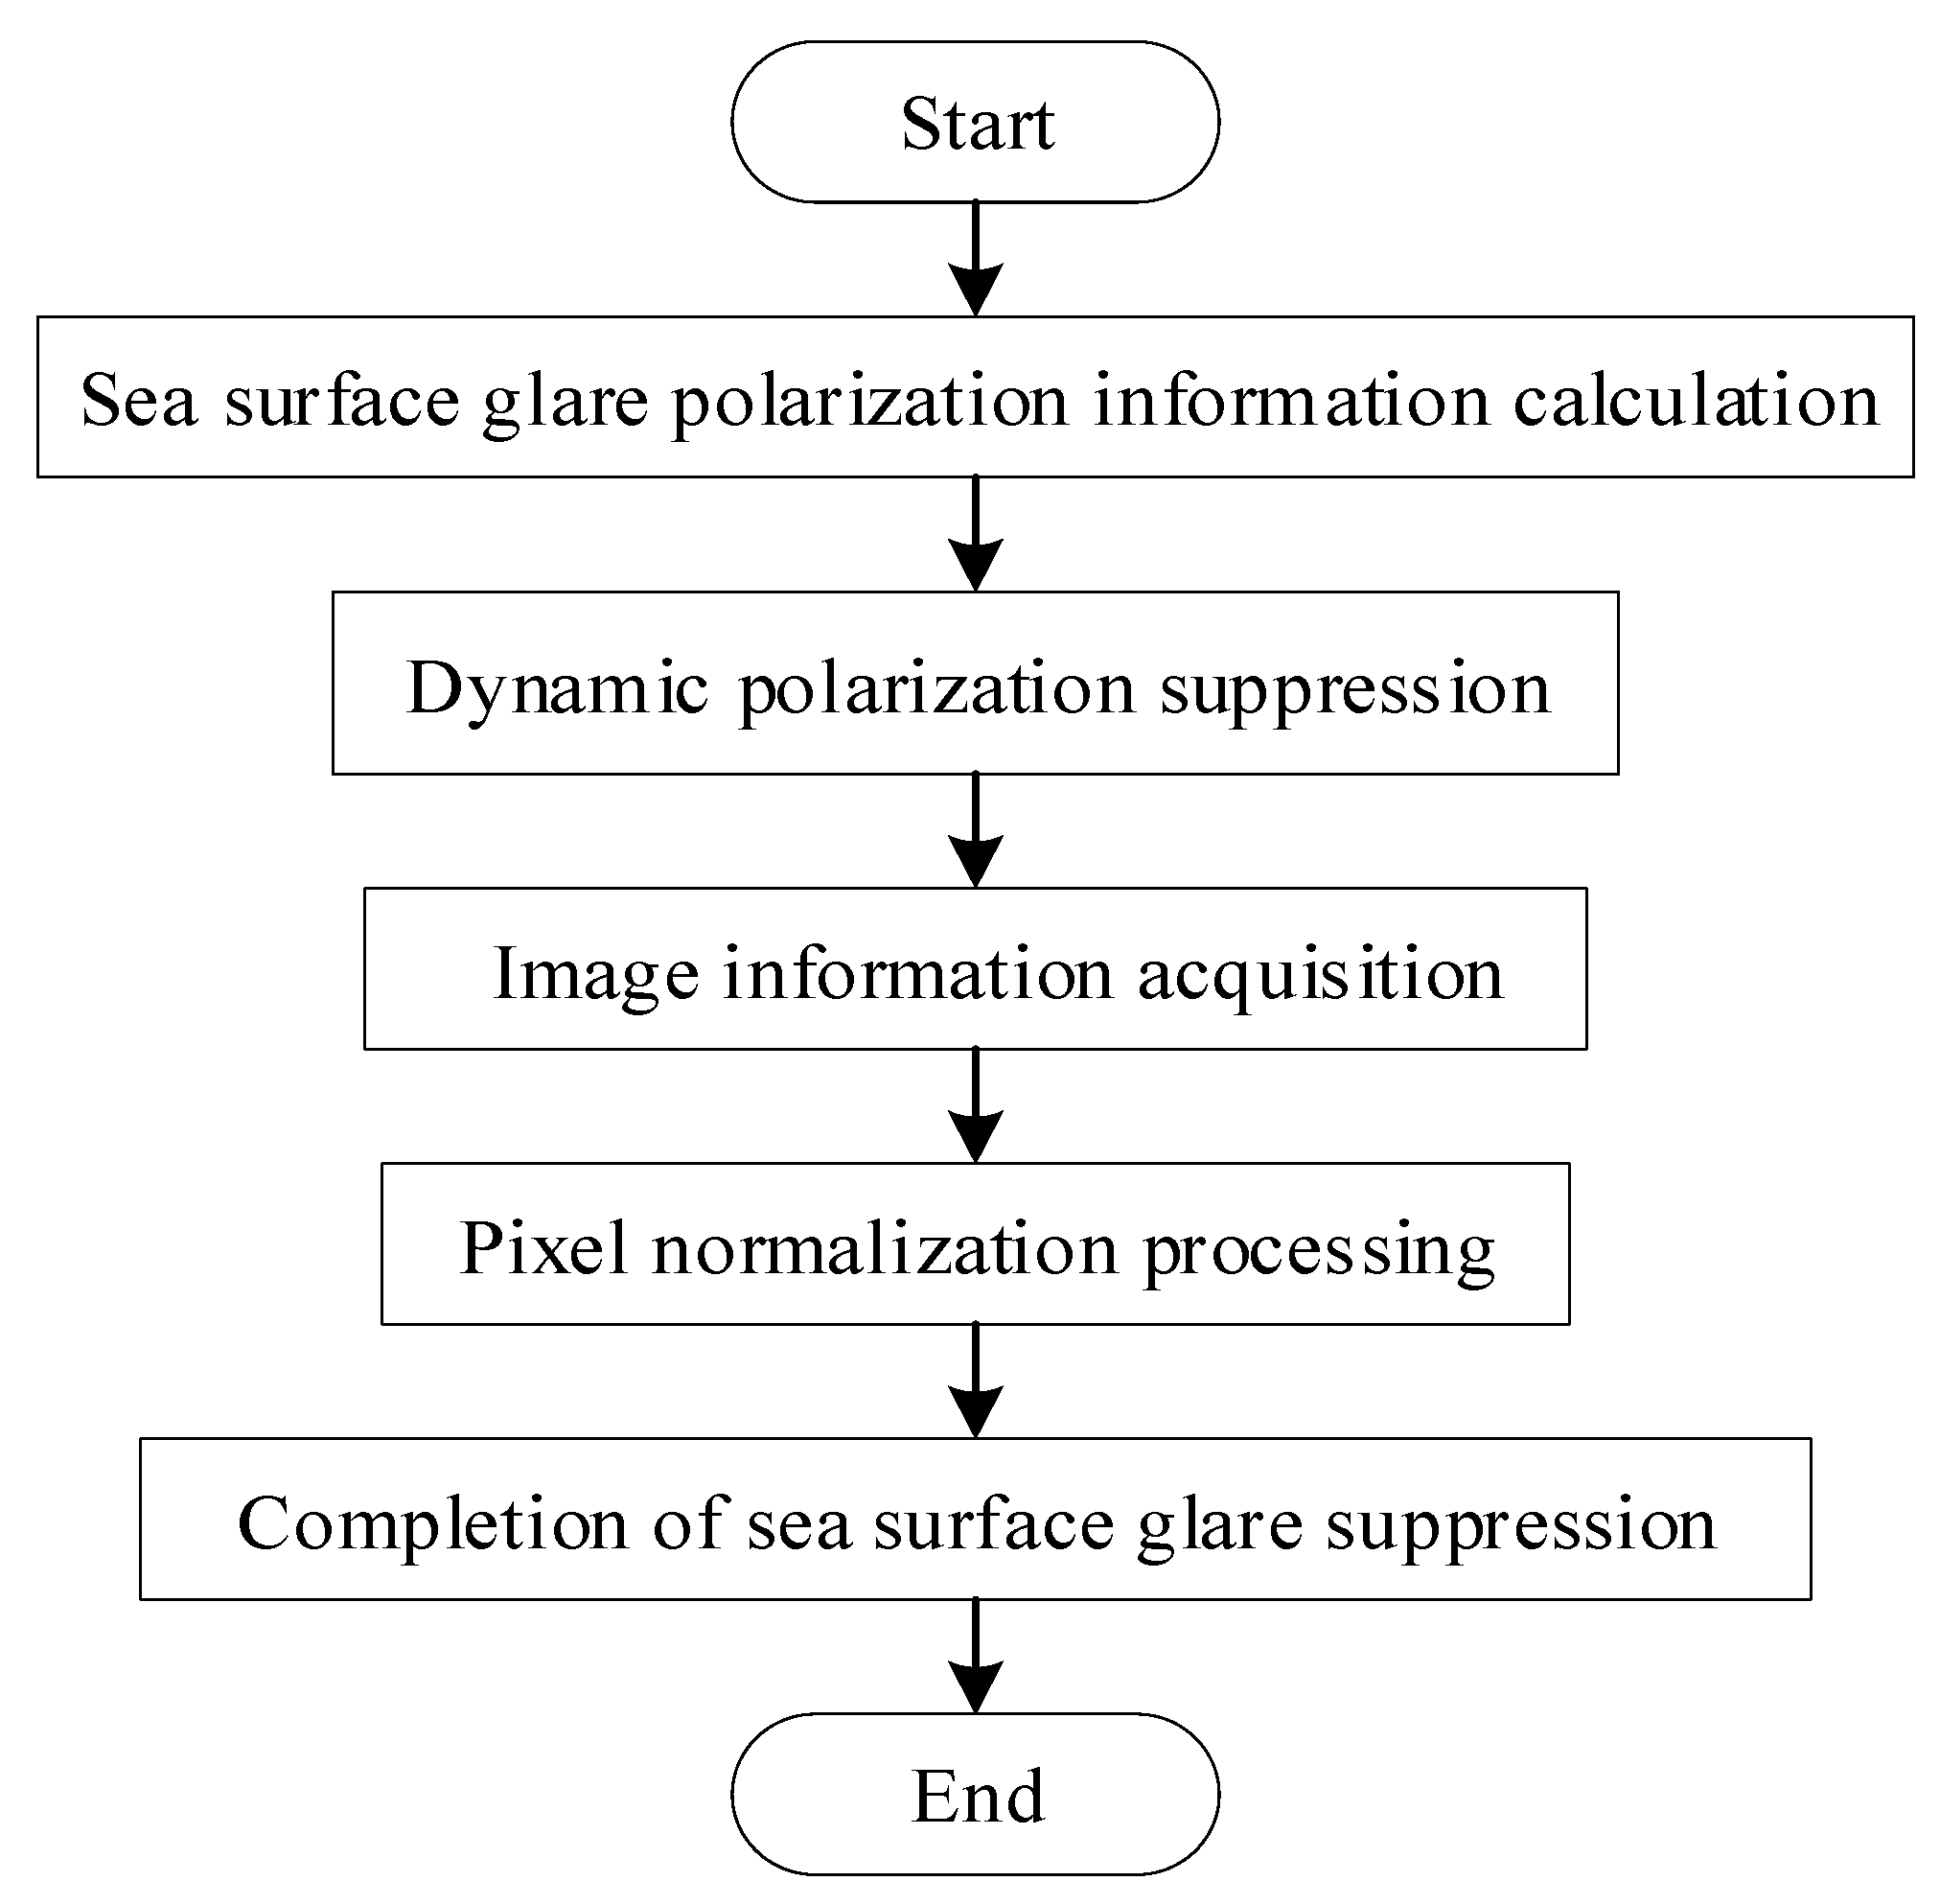
Figure 4 illustrates the glare suppression method process based on the geographic polarization suppression model.
Figure 4.
Flowchart of the sea surface glare adaptive polarization suppression method based on the geographic polarization suppression model.
2.3. Pixel Normalization Method
The pixel normalization method, based on the fundamental principles of radiometric normalization in remote sensing imagery [23,24], is used to further process images after dynamic polarization adaptive suppression. The radiometric normalization method uses the image’s own pixel values as parameters to establish a radiometric transformation equation, converting the image’s pixel values into radiometric pixels with physical significance, thereby restoring radiometric pixels without the need for any additional parameters.
This proposed method, guided by the principle of radiometric normalization, establishes a further suppression technique for images following dynamic polarization adaptive suppression. The pixel normalization method establishes a transformation relationship between the pixel values after dynamic polarization suppression and the glare pixel values, mapping the post-suppression pixel values to glare pixels to effectively restore glare pixels. As shown in Figure 5, the composition of the image after dynamic polarization suppression includes three parts: part A represents the non-glare portion; part B represents the dynamic polarization suppression portion; and part C represents the unsuppressed glare portion. In the proposed pixel normalization glare suppression method, part B is taken as the reference pixels, and then pixel normalization processing is applied to part C.
Figure 5.
Glare distribution map.
Firstly, select the maximum and minimum pixel values of part B, denoted as and , which will be the target range for pixel normalization. Secondly, select the maximum and minimum pixel values required for part C, denoted as and . Lastly, set a threshold value and search for pixels greater than the threshold pixel by pixel, using the transformation relationship in Equation (20) to calculate the normalized pixel value.
In the equation, represents the pixel points greater than the threshold , and represents the normalized pixel value.
The overall process of the sea surface glare adaptive suppression method is shown in Figure 6.
Figure 6.
The sea surface glare adaptive suppression method.
3. Experiment Validation and Analysis
To validate the effectiveness of the proposed method, a series of experiments were conducted, including experiments on real-time positioning information glare suppression and real-time orientation calculation glare suppression methods, as well as glare suppression experiments using the geographic polarization model. The results of these experiments were analyzed to confirm the feasibility and effectiveness of the proposed algorithm.
The experimental setup for measuring the relationship between the light incidence angle and the glare polarization angle is shown in Figure 7. A halogen light source with polarization characteristics was used to simulate sunlight for illumination [25,26,27], and the glare was captured using the Daheng Mercury second-generation China MERCURY2 polarization camera (Beijing, China). Based on the polarization images obtained from four directions using the polarization camera, the Stokes vector S was calculated, from which the angle of polarization (AOP) of the glare was determined. The calculation formulas are shown in Equations (21) and (22). The experiment covered the relationships between different light incidence angles and the polarization degree angle of glare, with the results shown in Figure 8. By fitting these experimental data, the experimental data in Table 1 were obtained.
Figure 7.
Diagram of the device for measuring the relationship between light incidence angle and glare polarization angle.
Figure 8.
Relationship curves between different incidence angles and both glare polarization degree and glare polarization angle.
Table 1.
Correspondence between light incidence angle and glare polarization angle.
In this study, the original experimental data were subjected to smoothing and fitting processing. As can be observed from Figure 8, there is a distinct incident–polarization relationship between the light incidence angle and the glare’s polarization angle in the fitted polarization angle curve. This relationship is of significant importance for the glare suppression method.
The data from Figure 8 and Table 1 are used as benchmark data, which are then compared with the experimental data collected in Section 3.1, Section 3.2, Section 3.3. By calculating the error in the experimental data, the effectiveness of the identified incident–polarization relationship for glare suppression is verified.
3.1. Experiment and Analysis of Glare Suppression for Real-Time Positioning Information
The experimental setup for real-time positioning information glare suppression is shown in Figure 9, consisting of a visible light monochrome camera and a rotatable polarizer. The experiment was conducted outdoors in Changchun, simulating a calm sea area (coordinates: N 43°50′55″, E 125°23′55″), aiming to verify the effectiveness of the real-time positioning information glare suppression method. According to the real-time positioning information acquisition and calculation method described in Section 2.2.1, the light incidence angle at different times is calculated. During the experiment, the polarizer in front of the camera lens is rotated until the image grayscale is minimized, at which point the rotation angle of the polarizer differs by 90 degrees from the glare polarization angle. By measuring the rotation angle of the polarizer, the corresponding glare polarization angle is calculated. The experimental results demonstrate the relationship between the incidence angle and the glare polarization angle, with the relationship curve shown in Figure 10 and the fitted experimental data presented in Table 2.
Figure 9.
Real-time positioning information glare suppression experimental apparatus.
Figure 10.
Real-time positioning information glare suppression relationship curve between incidence angle and polarization angle.
Table 2.
Real-time positioning information glare suppression experimental results.
We compared the polarization angles for the same incidence angles in Table 2 with those in Table 1, and calculated the relative error of the experimental data in Table 2 with respect to Table 1. The results of the relative error calculation are shown in Table 3.
Table 3.
Real-time positioning glare suppression experimental relative error.
From Table 2 and Figure 10, it can be observed that the relationship curve between the incidence angles and polarization angles in the real-time positioning information glare suppression experiment is approximately consistent with the incident–polarization correlation shown in Figure 8. The results of the relative error calculation indicate that the discrepancies between the experimental data and the benchmark data are relatively small, with an average relative error of 5.91%. Hence, there exists an incident–polarization correlation in the real-time positioning information method, confirming the effectiveness of the glare suppression method based on real-time positioning information calculation.
3.2. Experiment and Analysis of Glare Suppression for Orientation Information
The experimental setup for glare suppression using real-time orientation calculation is shown in Figure 11. This setup includes a Daheng Mercury second-generation MERCURY2 polarization camera, a halogen light source with polarization characteristics, and an MEMS inertial sensor. The MEMS inertial sensor is placed indoors to simulate a fluctuating sea surface. Using the real-time orientation information calculation method provided in Section 2.2.2, the orientation information of sea surface fluctuations is obtained. This orientation information is used to compensate for the impact of sea surface fluctuations on the monitoring platform. During the experiment, the glare polarization angles before and after orientation information compensation under the same light incidence angles are recorded. The relationship curves between incidence angles and polarization angles before and after orientation information compensation are shown in Figure 12, and the fitted experimental data are presented in Table 4.
Figure 11.
Experimental apparatus of real-time orientation calculation of glare suppression.
Figure 12.
Relationship between incidence angle and polarization angle before and after orientation information compensation.
Table 4.
Real-time orientation calculation glare suppression experiment results.
We compared the polarization angles for the same incidence angles in Table 4 with those in Table 1, and calculated the relative error of the experimental data in Table 4 with respect to Table 1. The results of the relative error calculation are presented in Table 5.
Table 5.
Real-time orientation calculation glare suppression experiment relative error.
As shown in Figure 12, in the experiment of glare suppression using real-time orientation information, the relationship curve between the incidence angles and the glare polarization angles exhibits a pattern similar to the correlation observed in Figure 8. According to Table 5, the average relative error of the glare polarization angles before orientation information compensation is 4.12%. After orientation information compensation, the average relative error of the glare polarization angles decreases to 1.70%. Therefore, there is a clear incident–polarization correlation in the glare suppression method using real-time orientation information compensation. This method not only effectively suppresses glare, but also reduces the error in the polarization angle of the glare, making the suppression more precise and effective.
3.3. Experiment and Analysis of the Geographic Polarization Suppression Model
The experimental setup for glare suppression based on the geographic polarization suppression model is depicted in Figure 13. This setup includes a visible light monochrome camera, a rotatable polarizer, and an MEMS inertial sensor, with the experiment conducted outdoors in Changchun simulating a fluctuating sea area (coordinates: N 43°50′55″, E 125°23′55″). During the experiment, the methods described in Section 2.2.1 and Section 2.2.2 are used to calculate the light incidence angle at different moments and the real-time orientation information of the fluctuating sea surface. The polarizer is rotated, and the rotation angle at which the image grayscale is minimized is recorded. For the glare suppression experiment using the geographic polarization suppression model, the relationship curve between the incidence angle and the glare polarization angle is shown in Figure 14, and the fitted experimental data are presented in Table 6.
Figure 13.
Geographic polarization suppression model experimental apparatus.
Figure 14.
Geographic polarization suppression model glare suppression relationship curve between incidence angle and polarization angle.
Table 6.
Glare suppression experiment based on geographic polarization suppression model.
We compared the polarization angles at the same incidence angles in Table 6 with those in Table 1, and calculated the relative error of the experimental data in Table 6 with respect to Table 1. The results of the relative error calculation are shown in Table 7.
Table 7.
Geographic polarization suppression model glare suppression experiment relative error.
As indicated in Figure 14, in the glare suppression experiment using the geographic polarization model, the curve showing the relationship between the light incidence angle and the glare polarization angle approximates the correlation observed in Figure 8. According to Table 7, the average relative error of the glare polarization angle in the geographic polarization model glare suppression experiment is 11.81%. Therefore, the method proposed in this paper, based on glare suppression using the geographic polarization model, also demonstrates an incident–polarization correlation, further validating the effectiveness and feasibility of the proposed glare suppression method. Comparison curve of experimental data on polarization angle is shown in Figure 15.
Figure 15.
Comparison curve of experimental data on polarization angle.
To verify the glare suppression effect of the method proposed in this paper, image quality assessment metrics were employed to measure the quality of image restoration after glare suppression. Common image quality assessment metrics include the mean squared error (MSE), peak signal-to-noise ratio (PSNR), and structural similarity index measure (SSIM). Although all three methods can evaluate images after glare suppression, MSE and PSNR only consider pixel-level differences and do not account for human visual perception of images. They are also very sensitive to minor changes in the image, which can lead to unreasonable evaluation results. On the other hand, SSIM is an image quality metric designed to evaluate the similarity between two images based on human visual perception. Its values range from 0 to 1, using the mean as an estimate of luminance, standard deviation as an estimate of contrast, and covariance as a measure of structural similarity, making its image quality evaluations more reasonable and accurate. Therefore, the SSIM method is used in this paper for image quality assessment. Table 8 shows the SSIM values for three sets of glare suppression experiment images.
Table 8.
SSIM values for glare suppression image quality evaluation.
The comparison of the effects before and after glare suppression is shown in Figure 16. The three sets of glare suppression experiments were conducted on 14 August 2023, at 15:24; 15 August 2023, at 10:15; and 9 August 2023, at 14:29, respectively. For these experiments, the SSIM values for the images post-suppression using the dynamic polarization control adaptive suppression method based on the geographic polarization model compared to the original images without glare are 0.8438, 0.8056, and 0.8703, respectively. When combining the dynamic polarization control based on the geographic polarization model with the polarization pixel normalization glare suppression method, the SSIM values are 0.8586, 0.8775, and 0.9206, respectively. In all three sets of experiments, both the adaptive suppression method based on the geographic polarization model and the combined method with pixel normalization effectively restored the glare images, with SSIM values above 0.8. The SSIM values of the combined method are noticeably higher than those of the adaptive suppression method alone, indicating that the method proposed in this paper, which combines the geographic polarization model with pixel normalization for glare suppression, performs better in image restoration, offering more effective and realistic glare suppression results. The three sets of glare suppression experiments shown in Figure 16 were conducted on a small maritime floating platform, limited by the experimental environment, thus taking place in a small area of maritime space. However, the sea surface glare suppression method proposed in this paper can be applied to spatial sections of any size, meaning the effectiveness of the glare suppression is independent of the size of the spatial section.
Figure 16.
Glare suppression experiment results.
Changes in maritime wind force directly affect the classification of sea waves and the intensity of sea surface fluctuations. The glare suppression experiments in this paper were conducted under conditions of moderate wind force, which is compatible with the environment of sea waves ranging from level 0 to 3. According to the experimental results presented in this paper, the proposed glare suppression method maintains good performance under such wave conditions. However, as the wave level increases to levels 4 to 5, the performance of the dynamic polarization glare suppression method decreases due to the response speed of the adaptive dynamic polarization control being unable to meet the rate of change in sea surface fluctuations. Although the pixel normalization method proposed in this paper can compensate to some extent for the glare not suppressed due to the reduced performance of dynamic polarization control, there is a certain degree of reduction in the SSIM value of the image after glare suppression processing. When the wave level rises to levels 6 to 9, which correspond to extreme maritime weather conditions, the inertial stability capacity of the experimental platform is insufficient and the response speed of adaptive polarization control is slow, resulting in a significant decrease in the performance of the glare suppression method proposed in this paper. Therefore, while the proposed glare suppression method is effective in suppressing sea surface glare in normal maritime environments, it is challenging to achieve effective suppression of sea surface glare under extreme maritime conditions.
4. Conclusions
This paper introduces a sea surface glare adaptive polarization suppression method based on the geographic polarization suppression model. Initially, the real-time positioning information solution method and the real-time orientation information solution method within the geographic suppression model were detailed. Subsequently, experimental validations were conducted for the real-time positioning information glare suppression method, the real-time orientation information glare suppression method, and the glare suppression method using the geographic polarization model. Moreover, a pixel normalization method was introduced to further suppress glare. The experimental results demonstrate that the method proposed in this paper exhibits effective glare suppression under various conditions. Specifically, the average relative error for the real-time positioning information glare suppression method is 5.91%; for the real-time orientation information glare suppression method, it is 1.7%; and for the glare suppression method using the geographic polarization model, it is 11.81%. Additionally, the SSIM image quality assessment method was employed to evaluate the images following glare suppression, showing that the proposed method maintains a high similarity in image quality, with SSIM values above 0.8 compared to the original images without glare. This indicates high similarity and low discrepancy between the suppressed and original non-glare images. In summary, the method proposed in this paper effectively suppresses the rapidly changing sea surface glare, achieving all-time adaptive and stable suppression of sea surface glare, providing significant assurance and support for the field of marine monitoring.
The sea surface glare suppression method proposed in this paper plays a significant role in improving the accuracy and quality of passive optical imaging of the ocean surface, and has also had a notable impact on the advancement of other disciplines. This method holds considerable application potential in fields such as marine remote sensing observation, climate change research, marine resource utilization, maritime security monitoring, and drone surveillance. In marine remote sensing, our method can effectively suppress the interference of sea surface glare, providing high-resolution remote sensing images to aid in the assessment of marine ecological changes and pollution levels, offering important guidance for exploration activities involving submarine oil, gas, and deep-sea mineral resources. In climate change research, our method can enhance the precision of monitoring key climate indicators such as sea surface temperature and sea ice coverage, providing technical support for the study of major climate phenomena such as global warming and sea-level rise. In the field of maritime security monitoring, our method can significantly improve the quality of surveillance images, enhancing the safety of maritime operations. For drone monitoring systems, our method can reduce glare interference and improve monitoring accuracy. In summary, the research results of this paper not only contribute to multiple disciplinary fields at a technical level, but also lay a solid foundation for the practical application and development of these fields, having profound significance for progress in environmental protection, climate change research, resource development, maritime safety, and military reconnaissance.
In future research, our initial plan is to address the issue of the slow response of adaptive dynamic polarization control under extreme weather conditions. Specifically, we intend to employ end-to-end deep learning techniques to enhance the performance of the glare suppression algorithm as well as the response speed and efficiency of dynamic polarization control. We will design and train a deep learning network that will be trained on a dataset of glare images. The trained network will be capable of performing multiple tasks, including detecting glare regions, segmenting glare areas in glare images, and suppressing glare, ultimately producing glare-free images directly. Additionally, we will reinforce the mechanical design of the monitoring platform to ensure its stability under extreme weather conditions, thereby improving the platform’s inertial stability capability.
Author Contributions
Conceptualization, L.S., X.L. (Xinyue Liu) and H.M.; formal analysis, X.L. (Xinyue Liu), X.B. and F.F.; funding acquisition, H.M.; investigation, L.S. and X.C.; methodology, L.S. and X.L. (Xinyue Liu); project administration, X.L. (Xinyue Liu) and H.M.; validation, L.S., X.Y. and X.L. (Xinyu Li); writing—original draft, L.S. and X.L. (Xinyue Liu); writing—review and editing, L.S. and X.L. (Xinyue Liu). All authors have read and agreed to the published version of the manuscript.
Funding
This work was supported by the National Key Research and Development Program of China, under grant 2021YFC3101300.
Institutional Review Board Statement
Not applicable.
Informed Consent Statement
Not applicable.
Data Availability Statement
The raw data supporting the conclusions of this article will be made available by the authors on request.
Conflicts of Interest
The authors declare no conflicts of interest.
References
- Li, N.; Guan, L.; Gao, H. Sun Glint Correction Based on BRDF Model for Improving the HY-1C/COCTS Clear-Sky Coverage. IEEE Geosci. Remote Sens. Lett. 2023, 20, 1500205. [Google Scholar] [CrossRef]
- Hochberg, E.J.; Andréfouët, S.; Tyler, M.R. Sea surface correction of high spatial resolution Ikonos images to improve bottom mapping in near-shore environments. IEEE Trans. Geosci. Remote Sens. 2003, 41, 1724–1729. [Google Scholar] [CrossRef]
- Cui, A.; Zhang, J.; Ma, Y.; Zhang, X. A Noise De-Correlation Based Sun Glint Correction Method and Its Effect on Shallow Bathymetry Inversion. Remote Sens. 2022, 14, 5981. [Google Scholar] [CrossRef]
- Liang, J.A.; Wang, X.; Fang, Y.J.; Zhou, J.J.; He, S.; Jin, W.Q. Water surface-clutter suppression method based on infrared polarization information. Appl. Opt. 2018, 57, 4649–4658. [Google Scholar] [CrossRef]
- Liang, J.A.; Wang, X.; He, S.; Jin, W.Q. Sea surface clutter suppression method based on time-domain polarization characteristics of sun glint. Opt. Express 2019, 27, 2142–2158. [Google Scholar] [CrossRef]
- Wang, G.; Wang, J.; Zhang, Z.; Cui, B. Performance of eliminating sun glints reflected off wave surface by polarization filtering under influence of waves. Optik 2016, 127, 3143–3149. [Google Scholar] [CrossRef]
- Ye, S.; Qu, W.X.; Li, S.; Wang, J.J.; Wang, X.Q.; Wang, F.Y.; Zhang, W.T.; Fu, S.M. Sea Surface Glint-Suppression Method Based on the Polarization Time-Domain Characteristics. Acta Opt. Sin. 2021, 41, 26–32. [Google Scholar]
- Luo, Y.J.; Zhao, Y.S.; Hu, X.L.; Wu, T. Polarization and sun glitter’s peeling-off of multi-angle remote sensing. Opt. Tech. 2006, 32, 205–208. [Google Scholar]
- Du, J.; Zhao, Y.S.; Wu, T.X.; Luo, Y.J. Applications of polarization in elimination of sun glitter in multi-angle remote sensing. Opt. Tech. 2007, 3, 375–378. [Google Scholar]
- Zhao, N.Z.; Zhao, Y.S. Further study on sun glitter’s peeling-off of multi-angle polarized remote sensing. Opt. Tech. 2007, 33, 932–934, 937. [Google Scholar]
- Chen, W.; Sun, X.B.; Qiao, Y.L.; Chen, Z.T.; Yin, Y.L. Polarization detection of marine targets covered in glint. Infrared Laser Eng. 2017, 46, S117001. [Google Scholar]
- Chen, W.; Qiao, Y.L.; Sun, X.B.; Yin, Y. Method for water surface sun glint suppression based on polarized radiation image fusion. Acta Opt. Sin. 2019, 39, 0529001. [Google Scholar] [CrossRef]
- Deng, Y.; Fu, Q.; Zhang, S.; Li, C.; Zhan, J.; Li, Y. Method of suppressing sea surface solar flare based on polarization detection technology. Laser Optoelectron. Prog. 2021, 58, 57–65. [Google Scholar]
- Yang, M.M.; Zhao, P.Y.; Feng, B.; Zhao, F. Water surface sun glint suppression method based on polarization filtering and polynomial fitting. Laser Optoelectron. Prog. 2021, 58, 125–136. [Google Scholar]
- Li, Y.S.; Zhao, H.J.; Li, N.; Jia, G. Detection of marine targets covered in sun glint based on mid-infrared polarization. Chin. J. Lasers 2022, 49, 296–304. [Google Scholar]
- Zhao, H.J.; Ji, Z.; Zhang, Y.; Sun, X.; Song, P.; Li, Y. Mid-infrared imaging system based on polarizers for detecting marine targets covered in sun glint. Opt. Express 2016, 24, 16396–16409. [Google Scholar] [CrossRef]
- Mobley, C.D. Polarized reflectance and transmittance properties of wind blown sea surfaces. Appl. Opt. 2015, 54, 4828–4849. [Google Scholar] [CrossRef]
- Hieronymi, M. Polarized reflectance and transmittance distribution functions of the ocean surface. Opt. Express 2016, 24, A1045–A1068. [Google Scholar] [CrossRef]
- Yu, B.W.; Luo, G.G.; Cai, H.W.; Zhou, X.; Yang, H. Several calculation methods and accuracy analysis of solar angle in optical observation. Comput. Meas. Control. 2022, 30, 306–318. [Google Scholar]
- Charpont, J.; Francou, G. The lunar theory ELP revisited. Introduction of new planetary perturbations. Astron. Astrophys. 2003, 404, 735–742. [Google Scholar]
- Wang, H.Z. The Position Calculation of Marine Celestial Body and Automatic Star-Choosing in Celestial Positioning. Master’s Thesis, Dalian Maritime University, Dalian, China, 2012. [Google Scholar]
- Xu, C. Research on Error Correction Algorithm of Attitude Calculation Based on MEMS Sensor. Master’s Thesis, Gulin University of Electronic Technology, Gulin, China, 2020. [Google Scholar]
- Bai, Y.; Tang, P.; Hu, C.M. KCCA transformation-based radiometric normalization of multi-temporal satellite images. Remote Sens. 2018, 10, 432. [Google Scholar] [CrossRef]
- Bai, Y. Radiometric Normalization of Remote Sensing Image Based on Kernel Canonical Correlation Analysis. Ph.D. Thesis, The University of Chinese Academy of Sciences, Beijing, China, 2019. [Google Scholar]
- Zhang, L.H.; Wang, Y. Experimental study on the selection of light sources for full spectrum solar simulators. J. Shandong Jianzhu Univ. 2007, 531–536+540. [Google Scholar]
- Zhang, N. Study on Photolytic Behavior of Diclofenac in Aqueous Environment. Ph.D. Thesis, Henan Normal University, Xinxiang, China, 2012. [Google Scholar]
- Zhao, H.Z.; Song, S.S.; Cheng, J.F.; Liu, Y.X. The performance test and experimental research on sun light source simulating system. Res. Energy Resour. 2017, 35, 8–12. [Google Scholar]
Disclaimer/Publisher’s Note: The statements, opinions and data contained in all publications are solely those of the individual author(s) and contributor(s) and not of MDPI and/or the editor(s). MDPI and/or the editor(s) disclaim responsibility for any injury to people or property resulting from any ideas, methods, instructions or products referred to in the content. |
© 2024 by the authors. Licensee MDPI, Basel, Switzerland. This article is an open access article distributed under the terms and conditions of the Creative Commons Attribution (CC BY) license (https://creativecommons.org/licenses/by/4.0/).