Abstract
This paper presents a comprehensive analysis of the adsorbent capacity of five distinctly different biosorbents derived from untreated biomasses. The optimal adsorption capacity of seaweed (Laminaria digitata), horse chestnut husk, hazelnut husk, rapeseed residue, and whitewood to remove methylene blue (MB) dye was assessed by analysing the effects of particle size, pH, temperature, and initial dye concentrations. Furthermore, the adsorption kinetics, isotherms, and adsorption thermodynamics were investigated. The results showed that relatively high MB adsorption capacity was achieved by Laminaria digitata (~180 mg/g), in addition to a reasonable MB adsorption capacity of horse chestnut husk (~130 mg/g), hazelnut husk (~110 mg/g), and rapeseed residue (~80 mg/g). However, whitewood provides a relatively low adsorption capacity of below 20 mg/g. The best fit with experimental results regardless of biosorbent type was a pseudo-second-order kinetic model with the lowest mean absolute percentage error (ε, MAPE < 2.5%) and the highest correlation coefficients (R2 > 0.99). Although the pseudo-second-order kinetic model is often associated with chemisorption, the low enthalpy values (<29.30 kJ/mol) typically suggest that the adsorption process is more characteristic of physisorption, which involves weaker van der Waals forces rather than the stronger covalent bonds of chemisorption. This proposed a multi-step adsorption process involving both physisorption and chemisorption. The adsorption isotherm of Langmuir showed superior fitting results for Laminaria digitata and hazelnut husk. In contrast, rapeseed residue and horse chestnut husk fit better with the Freundlich adsorption isotherm. The Langmuir adsorption isotherms showed a maximum adsorption capacity of ~500 mg/g for Laminaria digitata, followed by horse chestnut husk (~137 mg/g), hazelnut husk (~120 mg/g), and rapeseed residue (~85 mg/g). The Gibbs free energy was negative for Laminaria digitata < horse chestnut husk < hazelnut husk < 0, which suggests that the removal of MB is thermodynamically favourable, as the adsorption process occurs spontaneously. The results of the study indicate that MB dye removal using untreated biomasses has the potential to be a low-cost valorisation option in the holistic whole life cycle valorisation pathway for Laminaria digitata, horse chestnut husk, and hazelnut husk.
1. Introduction
Biomass-based adsorbents, or biosorbents, have been attracting increasing attention as a method of dye removal from wastewater as they are effective, eco-friendly, widely available, and low cost and have good surface characteristics [1,2]. Removal of dye contaminations from wastewater is one of the widely used applications of biomass adsorbent [3,4]. Resins, commercial activated carbons, and biosorbents frequently have superior selectivity in removing dyes [5]. There are numerous studies on the removal of methylene blue (MB) dye using biomass and biochars, such as silk powder [6], pine tree leaves [7], orange peel [8], green macro alga Caulerpa lentillifera [9], and Sargassum muticum [10].
Biosorbents are materials derived from different biological sources. The most common biosorbents are derived from microorganisms such as fungi, algae, yeasts, and bacteria [11]. Most lignocellulosic biomasses are generally pre-treated via chemical, biological, and thermochemical processes before use as adsorbents in order to improve their adsorption properties [12]. However, studies have also shown that some biomasses can be used as biosorbents without pre-treatment, and these are known as natural biosorbents. Numerous biomass materials such bean peel [13], banana and orange peel [14], sunflower stem pith [15], weeds [16], Carica papaya wood [17], corn straw [18], tea waste [19], pine tree leaves [7], cashew nutshell [20], and pineapple leaf powder [21] have been used as natural biosorbents to remove dyes from wastewater. Limited studies have also explored the potential of using untreated seaweeds as a natural biosorbent for dye removal [22,23]. However, few studies examine a wide range of natural biosorbents under the same MB adsorption conditions.
MB (3,7-bis(dimethylamino) phenothiazine chloride tetra methylthionine chloride) is a synthetic dye that is extensively used in the textile industry to dye materials including paper, cotton, silk, and wool [24]. However, MB dying can cause health issues such as eye burns and breathing difficulties as well as environmental pollution [5]. The loading of persistent organic pollutants such as dyes like MB is usually around 10–250 mg/L but can be as high as 1500 mg/L in textile industry effluents [25,26]. Common international standards state limits for COD of around 125 mg/L for the direct discharge of dye effluents [26]. However, these dyes are often used in developing countries with little or no regulation on limiting the amount of these dyes in effluents [27]. Thus, there is a need to find low-cost and low environmental impact ways to remove these dyes from industrial effluents prior to discharge. Biosorbents offer a low-cost, low-impact method of removing dyes from industrial wastewaters. MB dye removal using biomass base adsorbents has been a focus of numerous studies. In the majority of studies, the biomass will be pre-treated prior to becoming a biochar prior to use as an adsorbent [28,29,30]. However, high costs associated with the preparation of biochars and activated carbon, in addition to rejuvenation issues, hinder its uses in real situations [12], which is also a limiting factor in its use for heavy metal removal from wastewaters [31]. Thus, there is an increasing focus on the potential of using natural biosorbents, particularly from waste residues, for numerous wastewater pollutants [32,33,34,35]. The mechanism by which biosorbents uptake MB is known as biosorption [36]. Biosorption is an inherent, non-metabolic process encompassing various interactions between a sorbate and a biological matrix ( biosorbent) [37]. Common biosorption mechanisms involve the adsorption of organic pollutants. These include pore diffusion, hydrogen bonding, hydrophobic interactions, cationic and anionic interactions, and partitioning through non-carbonized regions [38]. Utilising biosorbents for MB removal presents a promising approach, particularly suitable for treating low MB concentrations [5]. Additionally, it offers a holistic method to enhance the economics of biomass processing technologies by utilising solid residues/biochars in an efficient dye removal process [30].
Furthermore, whilst adsorption is the most commonly investigated method of MB removal from wastewaters [39,40], it can also be used to evaluate a sorbent potential. It provides a measure of a specific surface area of sorbent particles in aqueous solutions, along with assessments of average pore size and distribution and dry surface area measurements [41]. This method has been used to evaluate numerous sorbents made from materials such as PANI@ZnO nanocomposites [42], metal organic framework [43], graphene-based materials [44], and fly ash residues [45].
Many research papers focus on individual biomasses [46,47,48,49], but to date limited studies have comprehensively investigated the adsorption potentials of distinctly different biosorbents in MB dye removal from wastewater or explored the impact of surface chemistry on performance. This paper aims to address this gap in knowledge by presenting a comparative study on how the adsorption process interdependencies influence the MB dye adsorption properties of five distinctly different biomass feedstocks: seaweed (Laminaria digitata), horse chestnut husk, rapeseed residue, hazelnut husk, and whitewood. The valorisation of these five distinctly different biomass as green biosorbents to adsorb MB dye was explored based on the effects of particle size, pH, temperature, and concentration. The study also explored the adsorption kinetics, equilibrium models, and thermodynamics to determine the MB adsorption characteristics of these biosorbents.
2. Materials and Methods
2.1. Biomass Feedstocks
Five distinct biosorbents were analysed in this study. Brown seaweed (Laminaria digitata, LD) [50] was collected in May 2015 near Downderry in Cornwall, UK. The preparation of LD was carried out according to the procedures outlined in a prior study by the same authors [51]. Horse chestnut husk (CH), a natural locally occurring biomass residue, was collected from Jubilee Campus at the University of Nottingham, UK, in August 2021. An agricultural waste, rapeseed residue (RS), was supplied by the School of Biosciences at the University of Nottingham [52,53]. Hazelnut husk (HH), a lignocellulosic agricultural waste [54], was obtained in 2020 from the Black Sea region (Ordu, Turkey), then dried and stored at 20 °C. The fifth biomass was a commercially sourced Northern Irish (UK) Brites® whitewood (WW) pellet, fabricated from sawdust residues. These feedstocks were selected as they all represent distinct types of biomasses, namely seaweed (LD), natural residue (CH), agricultural residue (RS), lignocellulosic waste (HH), and waste wood (WW) [51,55,56].
2.2. Characterisation of Biosorbents
All biomass feedstocks were milled using a cutting mill (Retsch SM300). Subsequently, they were sieved in a sieve shaker for 15 min and split into five particle size ranges (<106 µm, 106–212 µm, 212–300 µm, 300–425 µm, 425–600 µm) in accordance with BS EN ISO 17827-2:2016 [57,58]. Proximate analysis was conducted using a TA Instrument Q500 Thermogravimetric Analyser (TGA) via the slow pyrolysis method [59,60]. A LECO CHN 628 elemental analyser was used to estimate the carbon (C), hydrogen (H), and nitrogen (N) contents, and subsequently oxygen (O) content was obtained through difference [60]. A Bruker IFS66 (FTIR) was used to analyse the infrared spectra of the biosorbents. The Bruker IFS66 (FTIR) included a KBr beam splitter, Globar light source, deuterated triglycine sulfate (DTGS) room temperature detector, and Specac “Goldengate Bridge” diamond attenuated total reflection (ATR) attachment. A Micromeritics ASAP 2420 surface area and porosimetry system with CO2 adsorbate was used to determine the surface area and micropore volume of the prepared biosorbents. Specific surface areas were calculated using the BET model at relative pressures of 0.025 to 0.030 (0.83–1.07 bar), and the Dubinin-Radushkevich model was used to calculate the micropore volume in conjunction with the Microactive Software V5.0 [61].
2.3. Methylene Blue Removal
Initial experiments aimed to assess the impact of particle size on dye adsorption in order to determine the mass limitations of the process for each biomass. A batch system using 20 mg of each biomass feedstock in the 5 particle size ranges (<106 µm, 106–212 µm, 212–300 µm, 300–425 µm, 425–600 µm) was mixed with 10 mL of a 200 ppm MB solution (Sigma-Aldrich, St. Louis, MO, USA) in a glass cylindrical cell and then placed in an incubator for 24 h at 30 °C.
The next set of experiments explored the influence of pH on dye adsorption. Several batches of biosorbent at different pHs were left in an incubator at 30 °C for 24 h. Each glass cylindrical cell had 10 mg of biosorbent mixed with 10 mL of 200 ppm initial MB concentration at different pHs (2.0, 4.0, 6.0, 8.0, and 10.0). The pH was adjusted by adding 0.1 M HCl or 0.1 M NaOH to the solutions.
The influence of the initial MB concentration on dye adsorption was explored using ~30 mg of biosorbent mixed with 30 mL of MB solution (all at a set pH of 6) at concentrations of 200 ppm, 100 ppm, and 50 ppm. To assess the impact of temperature, ~30 mg of biosorbent mixed with 30 mL of MB solution (pH of 6) at a 200 ppm solution was mixed with a glass beaker at 160 rpm and stored in an incubator at 20, 30, and 40 °C for 24 h. To obtain the adsorption curves and calculate the adsorption kinetics, ~140 µL (0.46% of total solution) of the solution was removed at specific time intervals using automatic pipets.
After completion of each run, a syringe filter (20 µm pore size) was used to filter the solution, and a ultraviolet visible (UV/Vis, Shimadzu UV mini-1240) spectrophotometer was used to measure the MB concentration. For each experiment group, one sample was conducted in triplicate to assess the experimental error. The dye concentration at equilibrium was calculated from the calibration curve. The wavelength of maximum absorbance (664 nm) was used to obtain the calibration curve. The dye removal efficiency (Equation (1)) (wt.%) [7,62] and adsorption capacity (mg/g) (Equation (2)) [7,62] were determined as follows:
where C0 is initial MB concentration (mg/L) and C is the residual MB concentration (mg/L), Vsol (L) is the MB adsorption volume, mads (g) is the mass of biosorbent, and q (mg/g) is the biosorbent adsorption capacity.
MB Removal Efficiency η = (C0 − C)/Cc × 100
q = (C0 − C) × Vsol/mads
2.4. Adsorption Kinetics, Equilibrium Models, and Thermodynamics
Adsorption Kinetics: The biosorbent adsorption kinetics were investigated using three different kinetic models: pseudo-first order, pseudo-second order, and intra-particle diffusion. These models were applied to the data set produced from the MB concentration experiments at 30 °C for 50, 100, and 200 ppm. These models can identify the adsorption kinetics of the dye removal processes as they include the mass transfer steps during the adsorption process. Furthermore, pseudo-first- and second-order models are often used to predict the adsorption rates for batch adsorbers [62,63,64]. Pseudo-first-order and second-order adsorption rate models have limitations due to the adsorption rate constant being dependent on the adsorbate concentration and the amount of adsorbent charged to the adsorber [63,65]. The pseudo-first-order (Equation (3)) and second-order (Equation (4)) kinetic models equations are presented below [62,66,67], along with the intra-particle diffusion model (Equation (5)) [6,66].
where t (min) is the adsorption time, qt (mg/g) is the adsorption capacity at time t, qeq (mg/g) is the adsorption capacity of adsorbent at the equilibrium point, K1,ad (1/min), and k2,ad (g/mg·min) and k3,ad (mg/g·min1/2) are the constant rates of pseudo-first-order, pseudo-second-order, and intra-particle diffusion models, respectively.
Pseudo-First Order log(qeq − qt) = log(qeq) − (k1,ad/2.303) × t
Pseudo-Second Order t/qt = 1/(k2,ad × qeq2) + (1/qeq) × t
Intra-particle Diffusion qt = k3,ad × √t + C
Adsorption equilibrium models: Langmuir and Freundlich adsorption isotherms were used to assess adsorption equilibrium and the maximum adsorption capacity of biomass feedstocks and chars. The models were applied to experimental data obtained from the varying MB concentration experiments as described earlier in the method section. It is known that the effluent quantity at the solid-liquid interface increases non-linearly with the concentration at the equilibrium conditions. Langmuir (Equation (6)) and Freundlich (Equation (7)) adsorption isotherms are the most frequently used models in the literature [6,7,29,66,68,69,70] to describe the non-linear equilibrium between qeq and Ceq at a constant temperature and are described as follows [62,64]:
where, qeq (mg/g) is the adsorption capacity of adsorbent at the equilibrium, Ceq (mg/L) is the dye concentration at equilibrium, Q0 is the maximum adsorption capacity, b is the adsorption bonding energy, KF ((mg/g·(mg/L))n is the Freundlich adsorption constant, and n is the Freundlich adsorption constant (0 < n < 1).
Langmuir Model Ceq/qeq = Ceq/Q0 + 1/(Q0 × b)
Freundlich Model ln(qeq) = ln(KF) = (1/n) × ln(Ceq)
Adsorption thermodynamics: The adsorption process thermodynamic parameters indicate whether a process is favourable [7]. Gibbs free energy change ΔG°, standard enthalpy ΔH°, and standard entropy ΔS° of the kinetic data were thus analysed to gain a greater insight into the effect of temperature on the adsorption. Thermodynamic parameters ΔG°, ΔH°, and ΔS° were calculated using Equations (8)–(10) [7]:
where T is the adsorption temperature (K), R is the ideal gas constant (8.314 J/mol K), and Kd is the distribution coefficient.
Kd = qeq/Ceq
ln(Kd) = ∆S0/R − ∆H0/RT
∆G0 = ∆H0 − T × ∆S0
3. Results and Discussion
3.1. Characterisation of Biosorbents
The biosorbents were characterized prior to testing to assess their varying compositions. Table 1 presents the ultimate and proximate analyses, tap and true densities, and surface characteristics (surface area and micro-pore volume) of the biosorbents. From the proximate analysis data, there is a wide range of volatile matter, fixed carbon, and ash compositions for the selected biosorbents. CH and HH had similar proximate analysis, as did RS and WW, but LD had much lower volatile contents (54.7%) and higher carbon content (29.1%). The ranking of the samples by carbon content was LD > CH > HH > RS > WW. As fixed carbon content increases, the volatile matter content decreases, as noted by numerous previous studies [71,72,73].

Table 1.
Ultimate analysis, proximate analysis, true and tap densities, surface area, and micropore volume of biosorbents for seaweed (LD), natural residue (CH), agricultural residue (RS), lignocellulosic waste (HH), and waste wood (WW). NB a Dry ash free basis (daf). b Oxygen content by difference. c MC: moisture content, VM: volatile matter, FC: fixed carbon. d As received (ar). e micro-pore volume.
Biosorbents follow a similar trend to the volatile matter results in the ultimate analysis results (Table 1). RS had the highest carbon content (56 wt.%) and LD the lowest (29 wt.%). Among these biosorbents, LD has a higher ash content (~7.4 wt.%) than the other biosorbents, while HH, CH, and RS were about half that of LD (~3.6–4.2 wt.%). WW had a very low ash content of 0.44 wt.%. LD had the highest tap density (0.83 g/cm3) and true density (1.62 g/cm3) in comparison to other biosorbents. The lowest tap density was recorded for CH (0.17 g/cm3), and RS had the lowest true density (1.18 g/cm3). Regarding surface structure, WW had the highest surface area (27.35 m2/g) and micro-pore volume (0.01 m3/g).
The FTIR results show similar characterisitc peaks for all samples, but the intensity of the peaks varies (Figure 1). The wide band from 3100 to 3600 cm−1 was associated with the hydrogen-bonded hydroxyl group in addition to the potential overlapping of –NH with –OH bonds (Figure 1) [74,75]. This band is potentially due to symmetric and asymmetric stretching vibrations of H2O molecules [76,77] and/or non-bounded –OH groups such as alcohols, carboxylic acid, and/or phenolic compounds [78,79]. The differences in biosorbents could also explain the shifting of the peak point of the band (3100–3600 cm−1) in Figure 1.
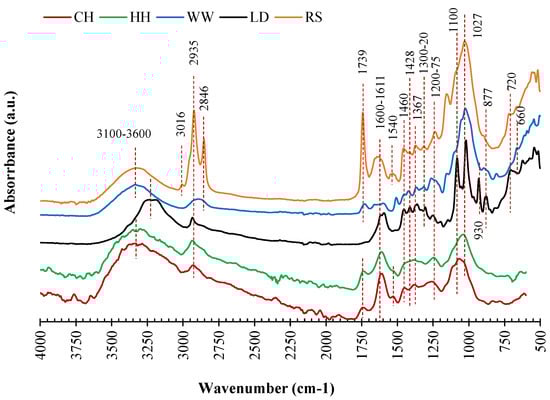
Figure 1.
FTIR analysis of biosorbents: LD, CH, HH, RS, and WW.
The peaks at 3016 cm−1, 2935 cm−1, and 2846 cm−1 are associated with the aromatic C-H, asymmetric C-H, and symmetric C-H stretching resulting from the aliphatic functional groups [78,80] in the biomass feedstocks. While these three C-H peaks are clear for RS, the peaks for asymmetric and symmetric C-H stretching are merged for WW. The peak at 1730 cm−1 is associated with the stretching of C=O resulting from carbonyl and carboxylic acid groups esters in RS [78] and WW [79]. The wide band at around 1600 cm−1 could be assigned the aliphatic and/or unsaturated aromatic compounds [78], methoxy stretching vibration of lignin [81], and/or ketonic component of hemicellulose [80]. The symmetric and asymmetric stretching of COO- bonds were assigned by the peaks at 1592 cm−1 and 1428 cm−1, respectively [82,83]. The peaks at 1460 cm−1, 1428 cm−1, 1367 cm−1, 1320 cm−1, 1027 cm−1, and 877 cm−1 are all associated with the stretching and bending vibrations of -CH2, -CH3, CH, -OH, and C-O bonds in cellulosic structures and aliphatic chains in lignocellulosic biomass [78,80,84,85]. The peaks between 1070 and 1275 cm−1 can be assigned to the stretching vibration C-O, C-O-C, and C-OH from the main source of cellulose, hemicellulose, and lignin [78,80,85,86]. The substituents of aromatic rigs (C–H stretching) could be observed at the range of 750–950 cm−1 [78,80,85]. The above results indicate that cellulose, hemicellulose, and lignin are the main component biosorbents and the functional groups are mainly provided by cellulose [87].
3.2. Methylene Blue Removal
The initial experiments in the MB dye adsorption tests exaimned how several parameters impacted on the adsorption process. The impact of particle size, pH of the MB solution, adsorption temperature, and initial MB concentrations were investigated to assess the suitability of each biosorbent for such applications and identify their optimal MB removal. Subsequently, adsorption kinetic, equilibrium models, and thermodynamics were developed for the selected biosorbents.
3.2.1. Particle Size
Particle size is known to be one of the most important determinants in adsorption mechanisms [38]. Thus, the MB removal of the biosorbents was tested for five particle size ranges (<106 µm, 106–212 µm, 212–300 µm, 300–425 µm, 425–600 µm), apart from LD, which was only available at <212 µm. Figure 2 shows the effects of particle sizes of biosorbents (RS, WW, LD, HH, and CH) on the removal efficiency and adsorption capacity of MB. For all samples, increasing particle size had a significant impact on MB removal efficiency (Figure 2). MB removal efficiency was reduced from ~97 wt.% for CH at <106 µm particle size to 66 wt.% at 425–600 μm particle size. Increasing particle size had the least impact on WW adsorption efficiency (25 wt.% to 18 wt.%), but WW also had the lowest adsorption efficiency of all the samples. This decreased adsorption capacity with increasing particle size can be attributed to the decrease in available surface area with increasing particle sizes [88]. The larger particles cause the more internal diffusion resistance, which limits the mobility of MB molecules into the internal surface of the particles [89]. The results of the particle size effects on MB removal efficiencies showed that a particle size below 106 μm should be used for all subsequent experiments to ensure maximum MB uptake.
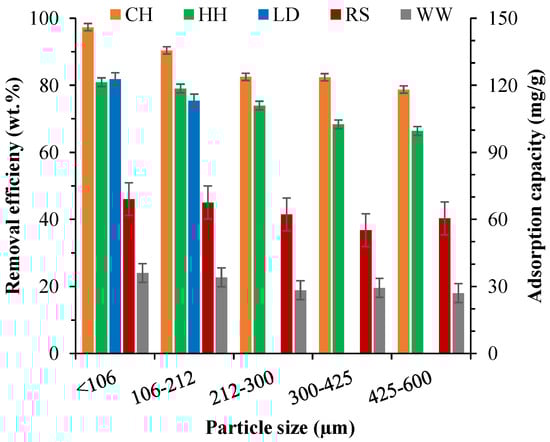
Figure 2.
Effects of particle size of LD, RS, CH, HH, and WW on MB removal efficiency.
3.2.2. pH
To observe the influence of pH on the uptake of MB of the different biomasses, solutions with varying pH levels (2–10) were tested for a 200 ppm MB dye solution (Figure 3). Initially, pH experiments for CH and HH were conducted for a broad range of pH levels (2–10). Figure 3 indicates that there was no substantial variation in MB removal rates for pH levels above 4. pH levels above 10 were not tested as studies [90] have shown that the optimum MB removal is below 10, while the optimal pH level for MB dye removal with biosorbents is around 5 [91]. With the pH of textile composite wastewater typically between 7 and 9 [92], the initial pH range of this study was set to 2–10 as it accurately reflects the pH levels encountered in industrial wastewater. As there was little variance in adsorption between pH 4–10, pH levels 5 and 7 were omitted for LD, RS, and WW.
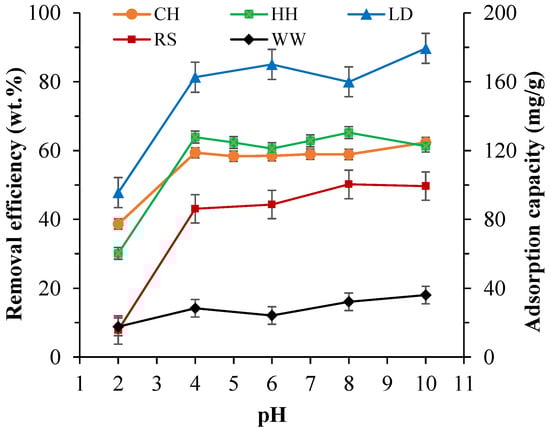
Figure 3.
The impact of initial pH on the dye removal and adsorption capacity of CH, HH, LD, RS, and WW for a 200 ppm initial MB concentration at 30 °C for 24 h.
There are two ways in which the interaction between a sorbate and a sorbent is affected by the pH of an aqueous [93]. As dyes are complex aromatic organic compounds that have varying functional groups and unsaturated bonds, they have different ionization potentials at different pH levels, resulting in the pH-dependent net charge on dye molecules. Furthermore, the sorbent surface contains numerous functional groups. Thus, the net charge on sorbents, which could be measured in the form of zeta potential or isoelectric point, is also pH dependent. Therefore, the interaction between dye molecules and biosorbents is a combination of charges on dye molecules and the surface of the sorbent. In this study (Figure 3), the biosorbents demonstrated relatively low adsorption capacities in strong acidic environments (pH < 2). This can be attributed to the decrease the attractive force between biosorbents and MB due to the formation of a positive charge on the surface of biosorbents with the excess H3O+ ions in the mixture in strong acidic environments [94,95]. Considering the MB dye is a cationic dye at pH > 3.4 (pKa = 3.8) [95], a higher pH is favoured for MB adsorption. MB dye removal remained at a constant level between the pH levels of 4 and 10 for all biosorbents (Figure 3), which is in accordance with previous studies [96,97]. This occurs as higher pH levels increase the presence of OH− ions, which in turn decrease the positively charged site on biosorbents and promotes the electrostatic attraction between the positively charged cationic dye and the negatively charged biosorbent surface [95,98]. In addition to the electrostatic interactions and adsorption at the pores, some other weak interactions such as cation exchange [99,100], hydrogen bonding [101,102], and dipole-dipole interaction [103] are also relatively significant in the MB removal processes. In conclusion, based on the outcomes of this study, a pH of 6 was selected for all further experiments as this was the pH level that provided optimal adsorptions for all biosorbents.
3.2.3. Adsorption Temperature and Initial MB Concentrations
The impact of temperature was investigated for the natural biosorbents at different temperatures (20–40 °C) for a 200 ppm concentration MB solution for 24 h (Figure 4a). Due to the decreasing viscosity of the solution, increasing temperature will increase the rate of diffusion of the adsorbate molecules across the external boundary layer as well as in the internal pores of the adsorbent particle [104]. Furthermore, changes in temperature will also change the equilibrium capacity of the adsorbent. Figure 4a shows that higher temperatures exhibited higher uptakes for HH and CH, indicating an endothermic adsorption [69], which may be due to an increase in the mobility of the dye with increasing temperature However, higher adsorptions rates were noted for LD and RS at lower temperatures, which indicates the process is exothermic [6], which reduces the diffusional resistance and increases the intraparticle diffusion [105]. Increasing temperature had a negligible impact on the MB uptake of WW. Detailed thermodynamic analysis and further discussion of these phenomena is provided in Section 3.3.
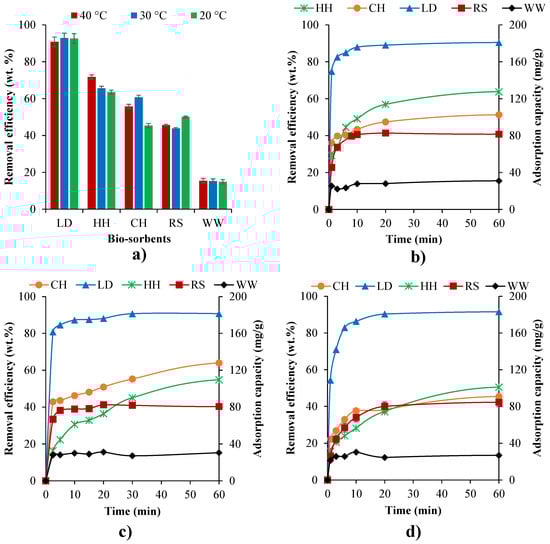
Figure 4.
(a) Impact of temperature (20–40 °C) on MB removal efficiencies of a 200 ppm initial MB concentration over 24 h and the adsorption capacity isotherms in the first 60 min at 40 °C (b), 30 °C (c), and 20 °C (d).
Among these five biosorbents, LD had the highest MB removal (~90 wt.%, ~180 mg/g), followed by HH (~71 wt.%, ~140 mg/g), CH (~60 wt.%, ~120 mg/g), and RS (~45 wt.%, ~90 mg/g). WW had the lowest MB removal (~15 wt.%, ~30 mg/g) despite having the highest surface area (27.3 m2/g) and micro-pore volume (0.01 m3/g) (Table 1). HH had the second highest micro-pore volume (0.0098 m3/g) but had a slower MB uptake rate compared with LD, CH, and RS (Figure 4c,d). This study does not show a direct relationship between surface area/pore volume of the natural biosorbent and MB adsorption. Although surface area and pore volume are key parameters in dye adsorption, they do not dominate the adsorption process for these natural biosorbents. The study indicates that, in addition to their accessibility and availability, the surface functional groups that can absorb MB (via electrostatic attraction, cation exchange, and surface complex mechanisms [106]) can also have an dramatic impact on MB removal efficiency.
The influence of initial MB concentration on the uptake for the different biosorbents was explored for initial concentrations of 50 ppm, 100 ppm, and 200 ppm (Figure 5). LD had relatively high MB removal efficiency (>89 wt.%) for all initial MB concentrations. Similarly, HH and CH provided relatively high MB removal efficiency (>89 wt.%) at the initial MB concentrations of 50 and 100 ppm, while MB removal efficiency drastically decreased (to 60–65 wt.%) at 200 ppm. RS had large differences in uptake, ranging between ~87 wt.% at 50 ppm and ~40 wt.% at 200 ppm (Figure 5a), lower uptakes for higher solution concentrations for all samples apart from LD (Figure 5a). However, Figure 5b,c illustrates that higher absorption capacities were observed in the higher MB concentration tests. This could potentially be due to the driving force of mass transfer [69]. Both the temperature and initial MB concentration tests showed that MB adsorption capacity and removal efficiency are rapidly enhanced at a very early stage of MB and biosorbent interaction: ~2.5 min for 200 ppm, ~3 min for 100 ppm, and ~6 min for 50 ppm of MB solution. This is potentially due to the presence and availability of large quantities of binding sites [95]. At 200 ppm of MB solution, MB adsorption capacity and removal efficiency research equilibrium was 30–60 min for LD, RS, and WW and 60–120 min for CH and HH (Figure 4b and Figure 5b).
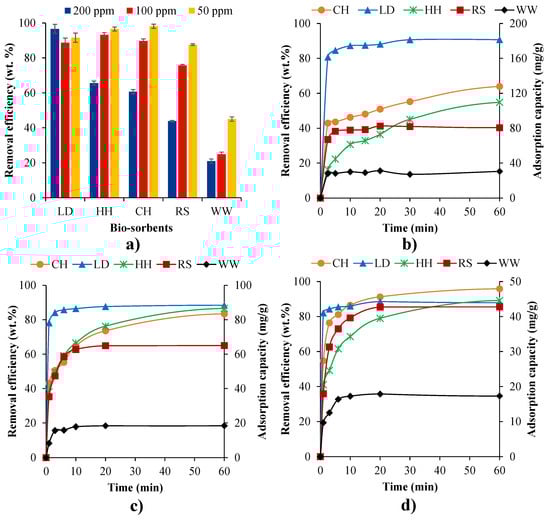
Figure 5.
Impact of initial MB concentrations (50–200 ppm) on (a) removal efficiency at 30 °C for 24 h. Adsorption capacity isotherms at the initial MB concentrations of 200 ppm (b), 100 ppm (c), and 50 ppm (d).
3.3. Adsorption Thermodynamics
In adsorption thermodynamics, the equilibrium relation is between the liquid phase and the adsorbed phase. The thermodynamic properties are thus described by the enthalpy and entropy of the system. From the slope and intercept of the Van’t Hoff plot (Figure 6), the standard enthalpy (ΔH°/R) and standard entropy (ΔS°/R) of the kinetic data can be determined [107]. The enthalpy of adsorption provides a measure of the heat released or adsorbed during the adsorption process. A change of entropy during the adsorption process indicates the affinity of the adsorbent to the adsorbate [108]. The thermodynamic parameters for the biosorbents used in this study (Table 2) were obtained from the slope of the Van’t Hoff plots in Figure 6.
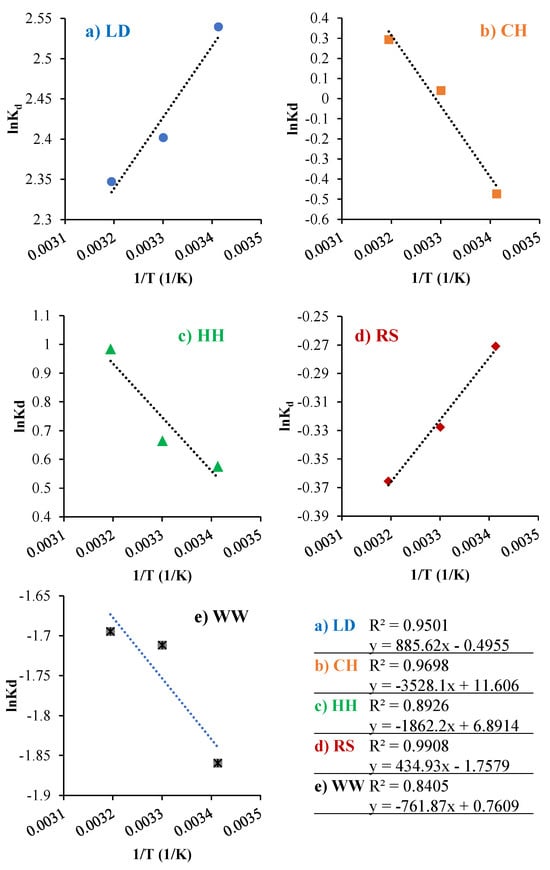
Figure 6.
Van’t Hoff plot for MB adsorption on (a) LD, (b) CH, (c) HH, (d) RS, and (e) WW in a 200 pm of MB solution at 20, 30, 40 °C.
Table 2.
Gibbs free energy change ΔG°, standard enthalpy ΔH°, and standard entropy ΔS° for RS, LD, WW, and biochars.
LD and RS showed a negative ΔH° (−3.61 kJ/mol and −7.36 kJ/mol). This indicates their adsorption processes are exothermic [6]. However, CH, HH, and WW showed positive ΔH° (29.30 kJ/mol, 15.48 kJ/mol, and 6.33 kJ/mol) values, indicating an endothermic adsorption [69]. By analysing the level of ΔH°, further information regarding the adsorption mechanisms can be determined. Chemical adsorption is the primary adsorption mechanism when ΔH° is between 40 and 200 kJ/mol [109]. When ΔH° is below 25 kJ/mol, the acting forces are van der Waals forces, which can be attributed to physical adsorption [109]. The electrostatic interaction between biosorbents and dyes results in non-covalent bonds with an enthalpy range of 20–80 kJ/mole. Based on the ΔH° levels in Table 2, the MB adsorption onto LD, RS, HH, and WW was driven by physical adsorption [95]. In contrast, CH ΔH° levels are inbetween physisorption and chemisorption. Thus the process for CH could be presented as a physical adsorption enhanced by a non-covalent bonding between dye and biosorbents. A negative ΔS° for RS (−0.014 kJ/mol K) and LD (−0.004 kJ/mol K) were observed while the ΔS° values were positive for the biosorbents CH (0.096 kJ/mol K), HH (0.057 kJ/mol K), and WW (0.006 kJ/mol K). The positive ΔS° of the system indicates the affinity of adsorbent for MB [69], as well as an increase in the randomness at the interface adsorbent/adsorbate during adsorption [7,66].
A positive ΔG° value was observed for all samples (0 < RS < CH < WW) at 20 °C. With increasing adsorption temperature, the ΔG° ranking changed to CH < 0 < RS < WW. The Gibbs free energy, RS, and WW demonstrated positive ΔG° values at the adsorption temperatures of 20–40 °C with 0 < RS < WW. Thus, these biosorbents are not favourable for MB adsorption. Despite CH having a positive ΔG° value at the adsorption temperatures of 20–30 °C, it has relatively high MB removal (60–65 wt.%). Additionally, the ΔG° values for CH decreased with following adsorption temperature order: T40 °C < 0 < T30 °C < T20 °C, which indicates that a higher temperature is favourable for MB removal with CH due to the nature of endothermic adsorption. Conversely, negative ΔG° values were obtained for LD < HH < 0. This indicates that MB removal could be a thermodynamically favourable process as a result of the spontaneous nature of the adsorption for these biosorbents [7,66]. This also explains why LD, HH, and CH have higher MB adsorption capacities compared to RS and WW (Table 2). Furthermore, the decreasing ΔG° for HH and CH with increasing adsorption temperature suggests that the adsorption process not only increases in spontaneity at higher temperatures [66] but also becomes more favourable with increasing temperature [7].
3.4. Adsorption Kinetics and Equilibrium Models
3.4.1. Adsorption Kinetics
Adsorption kinetics provide an evaluation of the performance of a given adsorbent, as well as proving insight into the underlying adsorption mechanisms. Based on methylene blue removal experiment results (Section 3.2), LD, HH, and CH had the greatest potential to be used as MB dye adsorbents. RS also has a reasonable level of MB removal at lower MB concentrations. Based on these results, the adsorption kinetics were evaluated for these potential biosorbents using pseudo-first-order, pseudo-second-order, and intra-particle diffusion models (Table 3). Figure 7 presents the MB adsorption kinetics for LD, CH, HH, and RS, while Figure 8 compares the estimated adsorption capacities (pseudo-second order) with experimental results. The Elovich equation has also been widely used in adsorption kinetics. However, the equation describes the chemical adsorption (chemical reaction) mechanism in nature [110]. When ΔH° is below 25 kJ/mol, the acting forces are van der Waals forces, which can be attributed to physical adsorption [109]. The electrostatic interaction between biosorbents and dyes results in non-covalent bonds with an enthalpy range of 20–80 kJ/mole. Based on the ΔH° levels presented in Table 2, the MB adsorption onto LD, RS, HH, and WW was driven by physical adsorption [95]. In contrast, CH ΔH° levels are in between physisorption and chemisorption. Therefore, the Elovich kinetic model was not explored as part of this study.
Table 3.
The experimental and estimated qeq values for the pseudo-first-order and pseudo-second-order adsorption kinetic models for an initial 100 ppm MB concentration.
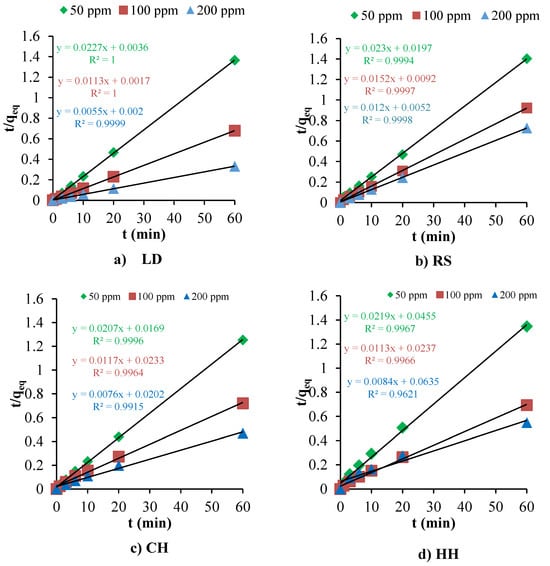
Figure 7.
The fit of the pseudo-second-order adsorption kinetics to the experimental data for (a) LD, (b) RS, (c) CH, and (d) HH biosorbents.
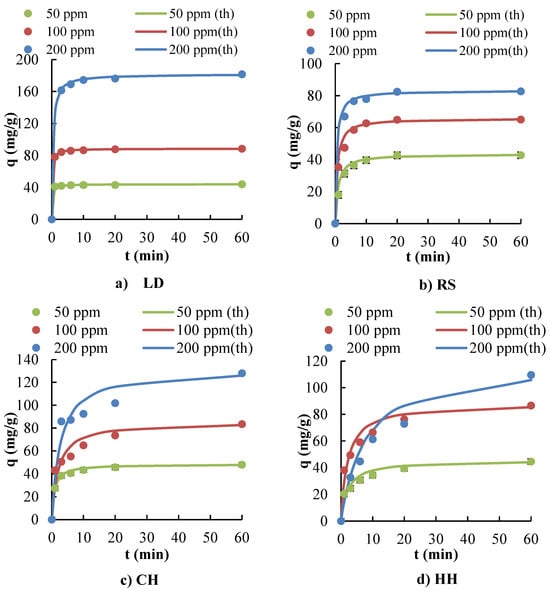
Figure 8.
Estimated adsorption capacities for a pseudo-second-order kinetic model with experimental results for (a) LD, (b) RS, (c) CH, and (d) HH biosorbents. (“th” is the estimated adsorption capacities from the pseudo-second-order model).
The pseudo-first-order model did not provide a satisfactory fit for the adsorption data across all biosorbents, as evidenced by the significant deviation of calculated qeq values from experimental data and the anomalously high mean absolute percentage error (MAPE) values, >10%. Notably, the negative rate constants (−0.093 and −0.090) obtained for HH and CH biosorbents under this model are indicative of its inapplicability, which may arise from limitations of the model in capturing the complexity of the adsorption process.
Conversely, Table 3 highlights that the mean absolute percentage error (ε, MAPE) and the correlation coefficients (R2) for pseudo-second-order kinetics were much lower than those obtained for the pseudo-first-order and intra-particle diffusion kinetic models when fitted to the experimental data. These results demonstrated that the pseudo-second-order kinetic model has the best fit for the biosorbents and identifies the adsorption kinetics of MB onto these sorbents (LD, RS, CH, and HH). The pseudo-second-order kinetic model is often associated with chemisorption because it assumes that the rate-limiting step involves chemical bonding or sharing of electrons between adsorbent and adsorbate. However, since the enthalpy values are low (presented in Section 3.3: Adsorption Thermodynamics), this typically suggests that the adsorption process is more characteristic of physisorption, which involves weaker van der Waals forces rather than the stronger covalent bonds of chemisorption. This apparent discrepancy between kinetic modelling and thermodynamic data is not uncommon and can arise due to several reasons such as the complexity of adsorption mechanisms, limitations of kinetic models, and surface properties and adsorbate concentration. The adsorption of MB over these biosorbents could occur via a multi-step process involving both physisorption and chemisorption. The discrepancy could be attributed to an initial rapid physisorption, followed by slower chemisorption. Under these conditions, the pseudo-second-order model can provide a good fit with the overall kinetics because it is sensitive to the slower, rate-limiting step that could be chemisorption, even if the process also involves significant physisorption.
The complexity of the adsorption mechanisms can also be observed from the results of the intra-particle diffusion model (Table 3). The model provided insights into the diffusion mechanisms but did not fully describe the adsorption process, as indicated by the lower R2 values. The non-zero intercept ‘C’ obtained from this model suggests that surface adsorption and boundary layer diffusion may contribute to the overall rate of adsorption, yet they are not the sole controlling steps. This implies that MB adsorption on the studied biosorbents is a complex process, potentially involving multiple concurrent or sequential steps.
3.4.2. Adsorption Equilibrium Models
Langmuir and Freundlich adsorption isotherms were used to determine the equilibrium type of adsorption and the maximum adsorption capacity of the biosorbents (Figure 9). The parameters for these isotherms were calculated from their respective linear equations (Equations (6) and (7)) and are presented in Table 4. The analysis of the equilibrium models revealed that LD and HH fitted the Langmuir model favourably to the Freundlich model. This implies that the adsorbent surface is energetically homogeneous [6], which is in line with the MB removal results with Caulerpa lentillifera [9]. On the other hand, RS and CH fitted the Freundlich model best, indicating that the MB dye adsorption occurred on a heterogeneous surface [28].
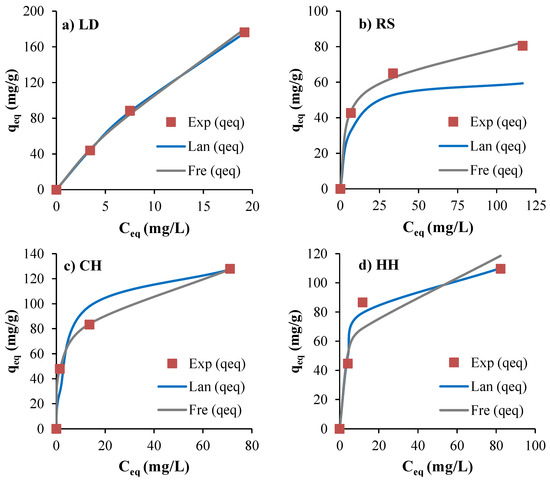
Figure 9.
Experimental and estimated non-linearised adsorption isotherms of MB on (a) LD, (b) RS, (c) CH, and (d) HH.
Table 4.
Adsorption isotherm parameters in Langmuir and Freundlich models.
The “n” value in the Freundlich adsorption models reflects the quality of adsorption, with an “n” value less than 1.0 indicating poor adsorption characteristics [6]. The maximum saturated adsorption capacity (Q0) of LD feedstocks was found to be up to 500 mg/g (Table 3), which is relatively higher compared to many other biosorbents [4,8,17,68,69,111,112,113]. The maximum adsorption capacities for CH and HH were 137 mg/g and 117 mg/g, respectively, while RS showed a reasonable maximum adsorption capacity of 85 mg/g.
4. Discussion on Mechanisms
4.1. Adsorption Mechanisms on Biosorbents
The MB adsorption over unmodified or natural biosorbents is influenced by the textural properties of biosorbents, surface chemistry of biosorbents, and specific interactions between the biosorbent and MB molecules [109,114]. As with many other adsorption processes, the adsorption mechanisms of MB dye over biosorbents can be categorised under three steps as illustrated in Figure 10:
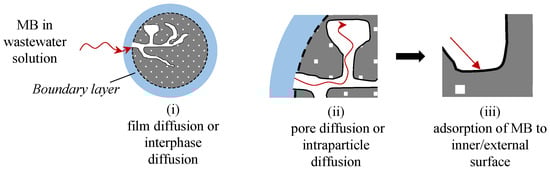
Figure 10.
The primary adsorption steps of MB over biosorbents. Image adapted from Lian et al. [100] with additional data from [115,116,117].
- i.
- Film diffusion or interphase diffusion: MB molecules diffuse from the bulk phase to the external surface of the biosorbent;
- ii.
- Pore diffusion or intraparticle diffusion: MB molecules diffuse from the pore mouth through the biosorbents pores into the immediate proximity of the internal active surface, which is the point where the MB adsorption occurs; and
- iii.
- Adsorption of MB molecules on the inner/external surface of biosorbents [110,115,116] based on the combination mechanism of electrostatic interaction, hydrogen bonding, functional group interaction, and van der Waals forces [48].
In discussing the sorption mechanisms of MB onto these biosorbents, the thermodynamic, kinetic, and isotherm results provide a deep understanding. The thermodynamic analysis revealed that adsorption onto LD and RS is exothermic with negative enthalpy changes, indicative of physisorption, which aligns with the negative Gibbs free energy values, confirming the spontaneous nature of the process. Contrastingly, the endothermic adsorption observed for CH and HH suggests a different interaction, possibly hinting at a more complex mechanism that involves energy absorption, potentially leading to a different adsorption capacity and effectiveness for these biosorbents.
While the pseudo-second-order kinetic model, which typically signifies chemisorption due to its assumption of chemical bond formation as the rate-limiting step, fits our kinetic data well, the low enthalpy values for all biosorbents suggest a process initially dominated by physisorption. This assertion is supported by isotherm studies, where the Langmuir model’s applicability to LD and HH indicates a homogenous adsorption surface and monolayer coverage, whereas the Freundlich isotherm fit for RS and CH biosorbents points to multi-layer adsorption, a characteristic of physisorption. These findings collectively suggest a multi-step adsorption process. Initially, rapid physisorption likely occurs, driven by the favourable thermodynamics, followed by a slower chemisorption, as the kinetics suggest, possibly within a monolayer as indicated by the Langmuir isotherm. The complexity of the adsorption process may rise due to the potential interaction between the surface chemistry of these biosorbents and the positively charged MB molecules, as illustrated in Figure 11. The hydroxyl groups (–OH, 3600–3100 cm−1 in FTIR results, Figure 1) of these biosorbents cause a dipole-dipole hydrogen bond between the H acceptor in MB molecules and hydroxyl groups (as H-donor) on the biosorbent structures (Figure 11) [118]. Additionally, positively charged MB molecules are attracted by negatively charged carboxylate ions (−COO−) over the surface of biosorbents, which was clearly demonstrated at the peaks 1428 and 1592 cm−1 (symmetric and asymmetric stretching of −COO−) in FTIR analysis (Figure 1) [119]. Similarly, the positively charged MB molecules are attracted to the negatively charged –CO- (indicating the peaks 1100 and 1027 cm−1 in FTIR analysis). A higher MB adsorption was observed for LD, CH, HH, and RS at higher pH levels due to strong electrostatic attractions between the negatively charged biosorbents and positively charged MB molecules [114]. The other potential interaction is a “n-π interaction”, which could be between Si-O-Si groups of the biosorbent surface and aromatic structure of MB [95] or potentially the oxygen in the acid groups that donate electrons to the aromatic rigs in the MB molecules [120]. Furthermore, MB adsorption can partially be enhanced by the “π-π interaction” between the hexagonal structure of hemicellulose, cellulose, and lignin and aromatic rings of MB molecules [95]. Although these interactions are potentially explanations for how MB absorption occurs for the biosorbents used in this study (LD, CH, HH, and RS), a detailed, comprehensive, and quantitative surface characterisations of these biosorbents are required in order to accurately propose the MB adsorption mechanisms at play.
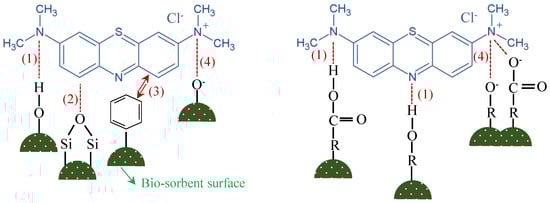
Figure 11.
Potential MB interaction with the surface chemistry of biosorbents. Images adapted from Fan et al. [95] and Wang et al. [99].
4.2. Comparison with Other Literatures
By comparing results from this study with those of previous similar studies, it becomes evident that LD exhibits the highest potential as a highly effective biosorbent for MB removal. LD has a higher removal capacity than most of the reported biomasses in Table 5 and was higher than many treated and activated biomasses [121]. Additionally, both CH and HH provide relatively high MB adsorption capacities: 128 mg/g and 110 mg/g, respectively, and thus are also potential biosorbents. As these two husks are waste biosorbents from nature, these two biosorbents were naturally dried and have no direct application in any value-added industry. RS could also be a potential adsorbent compared to many other biosorbents.
Table 5.
List of maximum MB adsorption capacities of various untreated biomasses from this study and the literature.
Industrial wastewaters can have dye loadings up to 1500 mg/L (1.5 mg/g) [25]. Thus, all biosorbents presented in this study would be suitable for dye removal from real effluents. However, real effluents also include other compounds, and this has been shown to reduce the capacity of adsorbents compared to laboratory-created simulated effluents [66]. This study demonstrates that natural biomasses have the potential to be used as biosorbents with respectable removal capacities without pre-treatment. This allows them to be a low-cost option for MB dye removal. However, scaling up the use of natural biosorbents for an industrial scale will require investigations. Fixed-bed columns have been used as a continuous flow process in biosorption for dye removal, but issues such as pH control of the bio-sorbate solution, lack of regeneration potential, and concerns over spent biosorbent disposal remain [131].
5. Conclusions
This paper presents a comparative analysis of the adsorption process interdependencies and how these are influenced the adsorption properties of five distinctly different biomass feedstocks: seaweed (Laminaria digitata), horse chestnut husk, rapeseed residue, hazelnut husk, and whitewood. Based on the comparative evaluation of natural biosorbents in methylene blue removal:
- Particle size should be as small as possible for all-natural biosorbents to ensure maximum MB uptake. For this study, <106 μm was found to be the optimal particle size for adsorption.
- Highly acidic environments (pH < 2) resulted in low uptakes of MB for all the natural biosorbents. A pH near neutral (pH = 6) was found to give the optimal balance of MB uptake for pH adjustment of the MB solution.
- The surface structure of the natural biosorbents (surface area and pore volume) had a lower impact on MB uptake than surface functional groups.
- LD exhibited the greatest potential to be used as an adsorbent for MB dye, with an uptake of ~180 mg/g. Furthermore, waste biomasses HH and CH showed relatively high levels of MB removal (~127 mg/g for CH and ~110 mg/g for HH), and RS, as an agricultural waste, also had a reasonable MB removal (~80 mg/g). However, WW demonstrated the lowest MB removal (<20 mg/g).
- Based on the thermodynamic analysis, the adsorption of MB on LD and RS provided a negative ΔH° (−3.61 kJ/mol and −7.36 kJ/mol), indicating an exothermic process. However, the adsorption on CH and HH showed a positive ΔH° (29.30 kJ/mol, 15.48 kJ/mol), indicating an endothermic process. The MB removal by LD, HH, and CH can be a thermodynamically favourable process thanks to the negative Gibbs free energy (ΔG°), which indicates MB adsorption on these biosorbents is spontaneous and physical in nature.
- The adsorption of MB onto these biosorbents aligns strongly with the pseudo-second-order kinetic model, as shown by an R2 greater than 0.99 and a MAPE between 0.1 and 2.5%. Despite this model typically suggesting chemisorption, the low enthalpy values shows at a process dominated by physisorption, leading to a probable sequential mechanism starting with physisorption and transitioning to chemisorption.
- The adsorption process was described well by the Langmuir isotherms for LD and HH biosorbents and by Freundlich the adsorption isotherm for RS and CH biosorbents. Langmuir adsorption isotherms showed relatively high maximum adsorption capacities (Qo); ~500 mg/g for LD, ~137 mg/g for CH, and ~117 mg/g for HH.
- The results of this study indicate that MB dye removal using untreated biomasses has the potential to be a low-cost valorisation option in the holistic whole life cycle valorisation pathway for Laminaria digitata, horse chestnut husk, and hazelnut husk.
This study provides a clear insight into how the adsorption process interdependencies are influenced by the MB dye adsorption properties of five distinctly different biomass feedstocks. As future works, we suggest a comprehensive and comparative investigation of the promising biosorbents in the application of removal of different dye and metal contaminations from wastewater, including stability of these biosorbents in different types of wastewater treatment. Additionally, in order to minimise the experimental work and maximise the process optimisation of different biosorbents, a detailed artificial intelligence model and statistical analysis can be developed using physicochemical characteristic and adsorption process conditions.
Author Contributions
F.G.: Conceptualization, Methodology, Formal analysis, Investigation, Validation, Visualization, Writing—original draft, Writing—review & editing. O.W.: Conceptualization, Funding acquisition, Methodology, Supervision, Writing—review & editing. E.T.K.: Methodology, Funding acquisition, Writing—review & editing. A.S.: Methodology, Funding acquisition, Writing—review & editing. L.A.S.: Methodology, Formal analysis, Writing—review & editing. E.L.: Conceptualization, Methodology, Supervision, Project administration, Funding acquisition, Writing—review & editing. All authors have read and agreed to the published version of the manuscript.
Funding
This research was funded and supported by the EPSRC, BBSRC, and UK Supergen Bioenergy Hub [Grant number EP/S000771/1], the University of Nottingham Anne McLaren Research Fellowship (Orla Williams), and the UK Biotechnology and Biological Sciences Research Council (BBSRC) Discovery Fellowship (Emily Kostas) [Grant number BB/S010610/1].
Institutional Review Board Statement
Not applicable.
Informed Consent Statement
Not applicable.
Data Availability Statement
The data presented in this study are openly available in Nottingham Research Data Management Repository https://rdmc.nottingham.ac.uk/ at DOI: 10.17639/nott.7361.
Acknowledgments
We also would like to acknowledge David Gray, Filippo Bramante, and Vincenzo Di Bari for supplying the rapeseed for this project and Şengül Güleç Baştaş for supplying hazelnut husk for this project.
Conflicts of Interest
The authors declare no conflict of interest.
References
- Aragaw, T.A.; Bogale, F.M. Biomass-based adsorbents for removal of dyes from wastewater: A review. Front. Environ. Sci. 2021, 9, 558. [Google Scholar] [CrossRef]
- Yaashikaa, P.; Kumar, P.S.; Saravanan, A.; Vo, D.-V.N. Advances in biosorbents for removal of environmental pollutants: A review on pretreatment, removal mechanism and future outlook. J. Hazard. Mater. 2021, 420, 126596. [Google Scholar] [CrossRef] [PubMed]
- Oladoja, N.; Aboluwoye, C.; Oladimeji, Y.; Ashogbon, A.; Otemuyiwa, I. Studies on castor seed shell as a sorbent in basic dye contaminated wastewater remediation. Desalination 2008, 227, 190–203. [Google Scholar] [CrossRef]
- Minisy, I.M.; Salahuddin, N.A.; Ayad, M.M. Adsorption of methylene blue onto chitosan–montmorillonite/polyaniline nanocomposite. Appl. Clay Sci. 2021, 203, 105993. [Google Scholar] [CrossRef]
- Rafatullah, M.; Sulaiman, O.; Hashim, R.; Ahmad, A. Adsorption of methylene blue on low-cost adsorbents: A review. J. Hazard. Mater. 2010, 177, 70–80. [Google Scholar] [CrossRef] [PubMed]
- Miraboutalebi, S.M.; Nikouzad, S.K.; Peydayesh, M.; Allahgholi, N.; Vafajoo, L.; McKay, G. Methylene blue adsorption via maize silk powder: Kinetic, equilibrium, thermodynamic studies and residual error analysis. Process Saf. Environ. Prot. 2017, 106, 191–202. [Google Scholar] [CrossRef]
- Yagub, M.T.; Sen, T.K.; Ang, H. Equilibrium, kinetics, and thermodynamics of methylene blue adsorption by pine tree leaves. Water Air Soil Pollut. 2012, 223, 5267–5282. [Google Scholar] [CrossRef]
- Kumar, P.S.; Fernando, P.S.A.; Ahmed, R.T.; Srinath, R.; Priyadharshini, M.; Vignesh, A.; Thanjiappan, A. Effect of temperature on the adsorption of methylene blue dye onto sulfuric acid–treated orange peel. Chem. Eng. Commun. 2014, 201, 1526–1547. [Google Scholar] [CrossRef]
- Marungrueng, K.; Pavasant, P. High performance biosorbent (Caulerpa lentillifera) for basic dye removal. Bioresour. Technol. 2007, 98, 1567–1572. [Google Scholar] [CrossRef]
- Rubin, E.; Rodriguez, P.; Herrero, R.; Cremades, J.; Barbara, I.; de Vicente, M.E.S. Removal of methylene blue from aqueous solutions using as biosorbent Sargassum muticum: An invasive macroalga in Europe. J. Chem. Technol. Biotechnol. Int. Res. Process Environ. Clean Technol. 2005, 80, 291–298. [Google Scholar] [CrossRef]
- Ravindiran, G.; Ganapathy, G.P.; Josephraj, J.; Alagumalai, A. A critical insight into biomass derived biosorbent for bioremediation of dyes. ChemistrySelect 2019, 4, 9762–9775. [Google Scholar] [CrossRef]
- Asemave, K.; Thaddeus, L.; Tarhemba, P.T. Lignocellulosic-based sorbents: A review. Sustain. Chem. 2021, 2, 271–285. [Google Scholar] [CrossRef]
- Grabi, H.; Derridj, F.; Lemlikchi, W.; Guénin, E. Studies of the potential of a native natural biosorbent for the elimination of an anionic textile dye Cibacron Blue in aqueous solution. Sci. Rep. 2021, 11, 9705. [Google Scholar] [CrossRef] [PubMed]
- Annadurai, G.; Juang, R.-S.; Lee, D.-J. Use of cellulose-based wastes for adsorption of dyes from aqueous solutions. J. Hazard. Mater. 2002, 92, 263–274. [Google Scholar] [CrossRef]
- Ma, X.; Liu, Y.; Zhang, Q.; Sun, S.; Zhou, X.; Xu, Y. A novel natural lignocellulosic biosorbent of sunflower stem-pith for textile cationic dyes adsorption. J. Clean. Prod. 2022, 331, 129878. [Google Scholar] [CrossRef]
- Silva, F.; Nascimento, L.; Brito, M.; da Silva, K.; Paschoal, W., Jr.; Fujiyama, R. Biosorption of methylene blue dye using natural biosorbents made from weeds. Materials 2019, 12, 2486. [Google Scholar] [CrossRef] [PubMed]
- Rangabhashiyam, S.; Lata, S.; Balasubramanian, P. Biosorption characteristics of methylene blue and malachite green from simulated wastewater onto Carica papaya wood biosorbent. Surf. Interfaces 2018, 10, 197–215. [Google Scholar]
- Honorato, A.C.; Machado, J.M.; Celante, G.; Borges, W.G.; Dragunski, D.C.; Caetano, J. Biosorption of methylene blue using agro-industrial residues. Rev. Bras. Eng. Agríc. Ambient. 2015, 19, 705–710. [Google Scholar] [CrossRef][Green Version]
- Uddin, M.T.; Islam, M.A.; Mahmud, S.; Rukanuzzaman, M. Adsorptive removal of methylene blue by tea waste. J. Hazard. Mater. 2009, 164, 53–60. [Google Scholar] [CrossRef]
- Kumar, P.S.; Abhinaya, R.; Lashmi, K.G.; Arthi, V.; Pavithra, R.; Sathyaselvabala, V.; Kirupha, S.D.; Sivanesan, S. Adsorption of methylene blue dye from aqueous solution by agricultural waste: Equilibrium, thermodynamics, kinetics, mechanism and process design. Coll. J. 2011, 73, 651–661. [Google Scholar] [CrossRef]
- Weng, C.-H.; Lin, Y.-T.; Tzeng, T.-W. Removal of methylene blue from aqueous solution by adsorption onto pineapple leaf powder. J. Hazard. Mater. 2009, 170, 417–424. [Google Scholar] [CrossRef] [PubMed]
- Oualid, H.A.; Abdellaoui, Y.; Laabd, M.; El Ouardi, M.; Brahmi, Y.; Iazza, M.; Oualid, J.A. Eco-efficient green seaweed codium decorticatum biosorbent for textile dyes: Characterization, mechanism, recyclability, and RSM optimization. ACS Omega 2020, 5, 22192–22207. [Google Scholar] [CrossRef]
- El Atouani, S.; Belattmania, Z.; Reani, A.; Tahiri, S.; Aarfane, A.; Bentiss, F.; Jama, C.; Zrid, R.; Sabour, B. Brown seaweed Sargassum muticum as low-cost biosorbent of methylene blue. Int. J. Environ. Res. 2019, 13, 131–142. [Google Scholar] [CrossRef]
- Dardouri, S.; Sghaier, J. Adsorptive removal of methylene blue from aqueous solution using different agricultural wastes as adsorbents. Korean J. Chem. Eng. 2017, 34, 1037–1043. [Google Scholar] [CrossRef]
- Shumaila, R.; Ali, N.; Torres, C.; Rittmann, B. Recent progress in treatment of dyes wastewater using microbial-electro-Fenton technology. RSC Adv. 2022, 12, 17104–17137. [Google Scholar]
- Dina, Y.A.; Scholz, M. Treatment of synthetic textile wastewater containing dye mixtures with microcosms. Environ. Sci. Pollut. Res. 2018, 25, 1980–1997. [Google Scholar]
- Ullhas, N. Sustainable chemistry: A solution to the textile industry in a developing world. Curr. Opin. Green Sustain. Chem. 2018, 9, 13–17. [Google Scholar]
- Jawad, A.H.; Abdulhameed, A.S.; Mastuli, M.S. Acid-factionalized biomass material for methylene blue dye removal: A comprehensive adsorption and mechanism study. J. Taibah Univ. Sci. 2020, 14, 305–313. [Google Scholar] [CrossRef]
- Sahu, S.; Pahi, S.; Tripathy, S.; Singh, S.K.; Behera, A.; Sahu, U.K.; Patel, R.K. Adsorption of methylene blue on chemically modified lychee seed biochar: Dynamic, equilibrium, and thermodynamic study. J. Mol. Liq. 2020, 315, 113743. [Google Scholar] [CrossRef]
- Williams, O.; Güleç, F.; Kostas, E.T.; Stevens, L.A.; Samson, A.; Lester, E. Absorbents from waste fuels. In 1st The European Conference on Fuel and Energy Research and its Applications (FERIA), Fuel and Energy Research Forum; University of Nottingham: Nottingham, UK, 2021; p. 105. [Google Scholar]
- Richards, S.; Dawson, J.; Stutter, M. The potential use of natural vs commercial biosorbent material to remediate stream waters by removing heavy metal contaminants. J. Environ. Manag. 2019, 231, 275–281. [Google Scholar] [CrossRef]
- Guleria, A.; Kumari, G.; Lima, E.C.; Ashish, D.K.; Thakur, V.; Singh, K. Removal of inorganic toxic contaminants from wastewater using sustainable biomass: A review. Sci. Total Environ. 2022, 823, 153689. [Google Scholar] [CrossRef] [PubMed]
- Charazińska, S.; Burszta-Adamiak, E.; Lochyński, P. Recent trends in Ni (II) sorption from aqueous solutions using natural materials. Rev. Environ. Sci. Bio/Technol. 2021, 21, 105–138. [Google Scholar] [CrossRef]
- Cusioli, L.F.; Quesada, H.B.; Baptista, A.T.; Gomes, R.G.; Bergamasco, R. Soybean hulls as a low-cost biosorbent for removal of methylene blue contaminant. Environ. Prog. Sustain. Energy 2020, 39, e13328. [Google Scholar] [CrossRef]
- Doğan, M.; Abak, H.; Alkan, M. Biosorption of methylene blue from aqueous solutions by hazelnut shells: Equilibrium, parameters and isotherms. Water Air Soil Pollut. 2008, 192, 141–153. [Google Scholar] [CrossRef]
- Sah, M.K.; Edbey, K.; EL-Hashani, A.; Almshety, S.; Mauro, L.; Alomar, T.S.; AlMasoud, N.; Bhattarai, A. Exploring the biosorption of methylene blue dye onto agricultural products: A critical review. Separations 2022, 9, 256. [Google Scholar] [CrossRef]
- Elgarahy, A.; Elwakeel, K.; Mohammad, S.; Elshoubaky, G. A critical review of biosorption of dyes, heavy metals and metalloids from wastewater as an efficient and green process. Clean. Eng. Technol. 2021, 4, 100209. [Google Scholar] [CrossRef]
- Praveen, S.; Jegan, J.; Pushpa, T.B.; Gokulan, R.; Bulgariu, L. Biochar for removal of dyes in contaminated water: An overview. Biochar 2022, 4, 10. [Google Scholar] [CrossRef]
- Santoso, E.; Ediati, R.; Kusumawati, Y.; Bahruji, H.; Sulistiono, D.; Prasetyoko, D. Review on recent advances of carbon based adsorbent for methylene blue removal from waste water. Mater. Today Chem. 2020, 16, 100233. [Google Scholar] [CrossRef]
- Mahdi, Z.; Hanandeh, A.E.; Yu, Q. Influence of pyrolysis conditions on surface characteristics and methylene blue adsorption of biochar derived from date seed biomass. Waste Biomass Valoriz. 2017, 8, 2061–2073. [Google Scholar] [CrossRef]
- Vilar, V.J.; Botelho, C.M.; Boaventura, R.A. Methylene blue adsorption by algal biomass based materials: Biosorbents characterization and process behaviour. J. Hazard. Mater. 2007, 147, 120–132. [Google Scholar] [CrossRef]
- Toumi, I.; Djelad, H.; Chouli, F.; Benyoucef, A. Synthesis of PANI@ ZnO hybrid material and evaluations in adsorption of congo red and methylene blue dyes: Structural characterization and adsorption performance, Journal of Inorganic and Organometallic. Polym. Mater. 2022, 32, 112–121. [Google Scholar]
- Eren, M.Ş.; Arslanoğlu, H.; Çiftçi, H. Production of microporous Cu-doped BTC (Cu-BTC) metal-organic framework composite materials, superior adsorbents for the removal of methylene blue (Basic Blue 9). J. Environ. Chem. Eng. 2020, 8, 104247. [Google Scholar] [CrossRef]
- Bu, J.; Yuan, L.; Zhang, N.; Liu, D.; Meng, Y.; Peng, X. High-efficiency adsorption of methylene blue dye from wastewater by a thiosemicarbazide functionalized graphene oxide composite. Diam. Relat. Mater. 2020, 101, 107604. [Google Scholar] [CrossRef]
- Yuan, N.; Cai, H.; Liu, T.; Huang, Q.; Zhang, X. Adsorptive removal of methylene blue from aqueous solution using coal fly ash-derived mesoporous silica material. Adsorpt. Sci. Technol. 2019, 37, 333–348. [Google Scholar] [CrossRef]
- Qiu, B.; Tao, X.; Wang, H.; Li, W.; Ding, X.; Chu, H. Biochar as a low-cost adsorbent for aqueous heavy metal removal: A review. J. Anal. Appl. Pyrolysis 2021, 155, 105081. [Google Scholar] [CrossRef]
- Dai, Y.; Zhang, N.; Xing, C.; Cui, Q.; Sun, Q. The adsorption, regeneration and engineering applications of biochar for removal organic pollutants: A review. Chemosphere 2019, 223, 12–27. [Google Scholar] [CrossRef] [PubMed]
- Srivatsav, P.; Bhargav, B.S.; Shanmugasundaram, V.; Arun, J.; Gopinath, K.P.; Bhatnagar, A. Biochar as an eco-friendly and economical adsorbent for the removal of colorants (dyes) from aqueous environment: A review. Water 2020, 12, 3561. [Google Scholar] [CrossRef]
- Güleç, F.; Özdemir, G.D.T. Investigation of drying characteristics of Cherry Laurel (Laurocerasus officinalis Roemer) fruits. Akad. Ziraat Derg. 2017, 6, 73–80. [Google Scholar]
- Vanegas, C.; Bartlett, J. Anaerobic digestion of Laminaria digitata: The effect of temperature on biogas production and composition. Waste Biomass Valoriz. 2013, 4, 509–515. [Google Scholar] [CrossRef]
- Kostas, E.T.; White, D.A.; Cook, D.J. Development of a bio-refinery process for the production of speciality chemical, biofuel and bioactive compounds from Laminaria digitata. Algal Res. 2017, 28, 211–219. [Google Scholar] [CrossRef]
- De Chirico, S.; di Bari, V.; Guzmán, M.J.R.; Nikiforidis, C.V.; Foster, T.; Gray, D. Assessment of rapeseed oil body (oleosome) lipolytic activity as an effective predictor of emulsion purity and stability. Food Chem. 2020, 316, 126355. [Google Scholar] [CrossRef] [PubMed]
- De Chirico, S.; di Bari, V.; Foster, T.; Gray, D. Enhancing the recovery of oilseed rape seed oil bodies (oleosomes) using bicarbonate-based soaking and grinding media. Food Chem. 2018, 241, 419–426. [Google Scholar] [CrossRef] [PubMed]
- Sayar, N.A.; Pinar, O.; Kazan, D.; Sayar, A.A. Bioethanol production from Turkish hazelnut husk process design and economic evaluation. Waste Biomass Valoriz. 2019, 10, 909–923. [Google Scholar] [CrossRef]
- Williams, O.; Newbolt, G.; Eastwick, C.; Kingman, S.; Giddings, D.; Lormor, S.; Lester, E. Influence of mill type on densified biomass comminution. Appl. Energy 2016, 182, 219–231. [Google Scholar] [CrossRef]
- Kostas, E.T.; Williams, O.S.; Duran-Jimenez, G.; Tapper, A.J.; Cooper, M.; Meehan, R.; Robinson, J.P. Microwave pyrolysis of Laminaria digitata to produce unique seaweed-derived bio-oils. Biomass Bioenergy 2019, 125, 41–49. [Google Scholar] [CrossRef]
- Paczkowski, S.; Sauer, C.; Anetzberger, A.; Paczkowska, M.; Russ, M.; Wöhler, M.; Pelz, S. Feedstock particle size distribution and water content dynamic in a pellet mill production process and comparative sieving performance of horizontal 3.15-mm mesh and 3.15-mm hole sieves. Biomass Convers. Biorefin. 2019, 11, 1621–1632. [Google Scholar] [CrossRef]
- EN-ISO-17827-2; Solid Biofuels—Determination of Particle Size Distribution for Uncompressed Fuels: Part 2: Vibrating Screen Method Using Sieves with Aperture of 3.15 mm and Below (17827-2:2016-10). DIN Deutsches Insitut für Normung: Berlin, Germany, 2016.
- Güleç, F.; Riesco, L.M.G.; Williams, O.; Kostas, E.T.; Samson, A.; Lester, E. Hydrothermal conversion of different lignocellulosic biomass feedstocks–Effect of the process conditions on hydrochar structures. Fuel 2021, 302, 121166. [Google Scholar] [CrossRef]
- Güleç, F.; Williams, O.; Kostas, E.T.; Samson, A.; Lester, E. Optimisation of Integrated Bioenergy and High Value Product Processing Pathways for Biomass Resources. In 1st The European Conference on Fuel and Energy Research and its Applications (FERIA), Fuel and Energy Research Forum; University of Nottingham: Nottingham, UK, 2021; p. 43. [Google Scholar]
- Kostas, E.T.; Durán-Jiménez, G.; Shepherd, B.J.; Meredith, W.; Stevens, L.A.; Williams, O.S.; Lye, G.J.; Robinson, J.P. Microwave pyrolysis of olive pomace for bio-oil and bio-char production. Chem. Eng. J. 2020, 387, 123404. [Google Scholar] [CrossRef]
- Karaman, C.; Aksu, Z. Modelling of Remazol Black-B adsorption on chemically modified waste orange peel: pH shifting effect of acidic treatment. Sakarya Üniv. Bilim. Enstit. Derg. 2020, 24, 1127–1142. [Google Scholar] [CrossRef]
- Yener, J.; Kopac, T.; Dogu, G.; Dogu, T. Batch adsorber rate analysis of Methylene Blue on Amberlite and Clinoptilolite. Sep. Sci. Technol. 2006, 41, 1857–1879. [Google Scholar] [CrossRef]
- Karaman, C.; Karaman, O.; Show, P.-L.; Orooji, Y.; Karimi-Maleh, H. Utilization of a double-cross-linked amino-functionalized three-dimensional graphene networks as a monolithic adsorbent for methyl orange removal: Equilibrium, kinetics, thermodynamics and artificial neural network modeling. Environ. Res. 2021, 207, 112156. [Google Scholar] [CrossRef] [PubMed]
- Yener, J.; Kopac, T.; Dogu, G.; Dogu, T. Dynamic analysis of sorption of Methylene Blue dye on granular and powdered activated carbon. Chem. Eng. J. 2008, 144, 400–406. [Google Scholar] [CrossRef]
- Williams, O.; Clark, I.; Gomes, R.L.; Perehinec, T.; Hobman, J.L.; Stekel, D.J.; Hyde, R.; Dodds, C.; Lester, E. Removal of copper from cattle footbath wastewater with layered double hydroxide adsorbents as a route to antimicrobial resistance mitigation on dairy farms. Sci. Total Environ. 2019, 655, 1139–1149. [Google Scholar] [CrossRef] [PubMed]
- Karimi, F.; Ayati, A.; Tanhaei, B.; Sanati, A.L.; Afshar, S.; Kardan, A.; Dabirifar, Z.; Karaman, C. Removal of metal ions using a new magnetic chitosan nano-bio-adsorbent; A powerful approach in water treatment. Environ. Res. 2022, 203, 111753. [Google Scholar] [CrossRef]
- El-Latif, M.A.; Ibrahim, A.M.; El-Kady, M. Adsorption equilibrium, kinetics and thermodynamics of methylene blue from aqueous solutions using biopolymer oak sawdust composite. J. Am. Sci. 2010, 6, 267–283. [Google Scholar]
- Bulut, Y.; Aydın, H. A kinetics and thermodynamics study of methylene blue adsorption on wheat shells. Desalination 2006, 194, 259–267. [Google Scholar] [CrossRef]
- Vadivelan, V.; Kumar, K.V. Equilibrium, kinetics, mechanism, and process design for the sorption of methylene blue onto rice husk. J. Coll. Interface Sci. 2005, 286, 90–100. [Google Scholar] [CrossRef]
- Vassilev, S.V.; Baxter, D.; Andersen, L.K.; Vassileva, C.G. An overview of the chemical composition of biomass. Fuel 2010, 89, 913–933. [Google Scholar] [CrossRef]
- Vassilev, S.V.; Vassileva, C.G.; Vassilev, V.S. Advantages and disadvantages of composition and properties of biomass in comparison with coal: An overview. Fuel 2015, 158, 330–350. [Google Scholar] [CrossRef]
- Vassilev, S.V.; Vassileva, C.G. Composition, properties and challenges of algae biomass for biofuel application: An overview. Fuel 2016, 181, 1–33. [Google Scholar] [CrossRef]
- Schiewer, S.; Balaria, A. Biosorption of Pb2+ by original and protonated citrus peels: Equilibrium, kinetics, and mechanism. Chem. Eng. J. 2009, 146, 211–219. [Google Scholar] [CrossRef]
- Niftaliyeva, A.; Güleç, F.; Karaduman, A. Methylation of 2-methylnaphthalene over metal-impregnated mesoporous MCM-41 for the synthesis of 2, 6-triad dimethylnaphthalene isomers. Res. Chem. Intermed. 2020, 46, 2403–2416. [Google Scholar] [CrossRef]
- Özbay, N.; Uzun, B.B.; Varol, E.A.; Pütün, A.E. Comparative analysis of pyrolysis oils and its subfractions under different atmospheric conditions. Fuel Process. Technol. 2006, 87, 1013–1019. [Google Scholar] [CrossRef]
- Güleç, F.; Niftaliyeva, A.; Karaduman, A. Selective synthesis of 2, 6-triad dimethylnaphthalene isomers by disproportionation of 2-methylnaphthalene over mesoporous MCM-41. Res. Chem. Intermed. 2018, 44, 7205–7218. [Google Scholar] [CrossRef]
- Yaman, E.; Ulusal, A.; Uzun, B.B. Co-pyrolysis of lignite and rapeseed cake: A comparative study on the thermal decomposition behavior and pyrolysis kinetics. SN Appl. Sci. 2021, 3, 97. [Google Scholar] [CrossRef]
- Huang, J.; Fu, S.; Gan, L. Chapter 2—Structure and Characteristics of Lignin. In Lignin Chemistry and Applications; Huang, J., Fu, S., Gan, L., Eds.; Elsevier: Amsterdam, The Netherlands, 2019; pp. 25–50. [Google Scholar]
- Salam, A.; Bashir, S.; Khan, I.; Hu, H. Biochar production and characterization as a measure for effective rapeseed residue and rice straw management: An integrated spectroscopic examination. Biomass Conv. Biorefin. 2020, 12, 2687–2696. [Google Scholar] [CrossRef]
- Sher, F.; Yaqoob, A.; Saeed, F.; Zhang, S.; Jahan, Z.; Klemeš, J.J. Torrefied biomass fuels as a renewable alternative to coal in co-firing for power generation. Energy 2020, 209, 118444. [Google Scholar] [CrossRef]
- Wang, J.; Liu, C.; Shuai, Y.; Cui, X.; Nie, L. Controlled release of anticancer drug using graphene oxide as a drug-binding effector in konjac glucomannan/sodium alginate hydrogels. Coll. Surf. B 2014, 113, 223–229. [Google Scholar] [CrossRef]
- Theras, J.E.M.; Kalaivani, D.; Jayaraman, D.; Joseph, V. Growth and spectroscopic, thermodynamic and nonlinear optical studies of L-threonine phthalate crystal. J. Cryst. Growth 2015, 427, 29–35. [Google Scholar] [CrossRef]
- Hospodarova, V.; Singovszka, E.; Stevulova, N. Characterization of cellulosic fibers by FTIR spectroscopy for their further implementation to building materials. Am. J. Anal. Chem. 2018, 9, 303–310. [Google Scholar] [CrossRef]
- Fertah, M.; Belfkira, A.; Taourirte, M.; Brouillette, F. Extraction and characterization of sodium alginate from Moroccan Laminaria digitata brown seaweed. Arab. J. Chem. 2017, 10, S3707–S3714. [Google Scholar] [CrossRef]
- Kongwudthiti, S.; Praserthdam, P.; Tanakulrungsank, W.; Inoue, M. The influence of Si–O–Zr bonds on the crystal-growth inhibition of zirconia prepared by the glycothermal method. J. Mater. Process. Tech. 2003, 136, 186–189. [Google Scholar] [CrossRef]
- Wei, W.; Shang, N.; Zhang, X.; Liu, W.; Zhang, T.; Wu, M. A green 3-step combined modification for the preparation of biomass sorbent from waste chestnut thorns shell to efficient removal of methylene blue. Bioresour. Technol. 2022, 360, 127593. [Google Scholar] [CrossRef] [PubMed]
- Chu, H.; Chen, K. Reuse of activated sludge biomass: II. The rate processes for the adsorption of basic dyes on biomass. Process Biochem. 2002, 37, 1129–1134. [Google Scholar] [CrossRef]
- Sreelakshmi, K.; Harshan, K. Dye Removal from Aqueous Solution using Bio-Sorbents, International Journal of Research in Engineering. Sci. Manag. 2019, 2, 915–923. [Google Scholar]
- Mahmoud, M.; Nabil, G.; Khalifa, M.; El-Mallah, N.; Hassouba, H. Effective removal of crystal violet and methylene blue dyes from water by surface functionalized zirconium silicate nanocomposite. J. Environ. Chem. Eng. 2019, 7, 103009. [Google Scholar] [CrossRef]
- Turgut, E.; Alayli, A.; Nadaroğlu, H. Preparation of chitosan, sunflower and nano-iron based core shell and its use in dye removal. Adv. Environ. Res. 2020, 9, 135–150. [Google Scholar]
- Hussain; Hussain, I.; Arif, M. Characterization of textile wastewater. J. Ind. Pollut. Control 2004, 20, 137–144. [Google Scholar]
- Aksu, Z.; Ertuğrul, S.; Dönmez, G. Methylene Blue biosorption by Rhizopus arrhizus: Effect of SDS (sodium dodecylsulfate) surfactant on biosorption properties. Chem. Eng. J. 2010, 158, 474–481. [Google Scholar] [CrossRef]
- Ghosh, K.; Bar, N.; Biswas, A.B.; Das, S.K. Removal of methylene blue (aq) using untreated and acid-treated eucalyptus leaves and GA-ANN modelling. Can. J. Chem. Eng. 2019, 97, 2883–2898. [Google Scholar] [CrossRef]
- Ghosh, I.; Kar, S.; Chatterjee, T.; Bar, N.; Das, S.K. Removal of methylene blue from aqueous solution using Lathyrus sativus husk: Adsorption study, MPR and ANN modelling. Process Saf. Environ. Prot. 2021, 149, 345–361. [Google Scholar] [CrossRef]
- Zhang, P.; O’Connor, D.; Wang, Y.; Jiang, L.; Xia, T.; Wang, L.; Tsang, D.C.; Ok, Y.S.; Hou, D. A green biochar/iron oxide composite for methylene blue removal. J. Hazard. Mater. 2020, 384, 121286. [Google Scholar] [CrossRef] [PubMed]
- Li, Y.; Zhang, Y.; Wang, G.; Li, S.; Han, R.; Wei, W. Reed biochar supported hydroxyapatite nanocomposite: Characterization and reactivity for methylene blue removal from aqueous media. J. Mol. Liq. 2018, 263, 53–63. [Google Scholar] [CrossRef]
- Hu, Y.; Guo, T.; Ye, X.; Li, Q.; Guo, M.; Liu, H.; Wu, Z. Dye adsorption by resins: Effect of ionic strength on hydrophobic and electrostatic interactions. Chem. Eng. J. 2013, 228, 392–397. [Google Scholar] [CrossRef]
- Elsherbiny, A.S.; El-Hefnawy, M.E.; Gemeay, A.H. Linker impact on the adsorption capacity of polyaspartate/montmorillonite composites towards methyl blue removal. Chem. Eng. J. 2017, 315, 142–151. [Google Scholar] [CrossRef]
- Tumin, N.D.; Chuah, A.L.; Zawani, Z.; Rashid, S.A. Adsorption of copper from aqueous solution by Elais Guineensis kernel activated carbon. J. Eng. Sci. Technol. 2008, 3, 180–189. [Google Scholar]
- Al-Ghouti, M.; Khraisheh, M.; Allen, S.; Ahmad, M. The removal of dyes from textile wastewater: A study of the physical characteristics and adsorption mechanisms of diatomaceous earth. J. Environ. Manag. 2003, 69, 229–238. [Google Scholar] [CrossRef]
- Manna, S.; Roy, D.; Saha, P.; Gopakumar, D.; Thomas, S. Rapid methylene blue adsorption using modified lignocellulosic materials. Process Saf. Environ. Prot. 2017, 107, 346–356. [Google Scholar] [CrossRef]
- Kahr, G.; Madsen, F. Determination of the cation exchange capacity and the surface area of bentonite, illite and kaolinite by methylene blue adsorption. Appl. Clay Sci. 1995, 9, 327–336. [Google Scholar] [CrossRef]
- Hameed, B.; Ahmad, A. Batch adsorption of methylene blue from aqueous solution by garlic peel, an agricultural waste biomass. J. Hazard. Mater. 2009, 164, 870–875. [Google Scholar] [CrossRef]
- Al-Degs, Y.S.; El-Barghouthi, M.I.; El-Sheikh, A.H.; Walker, G.M. Effect of solution pH, ionic strength, and temperature on adsorption behavior of reactive dyes on activated carbon. Dyes Pigment. 2008, 77, 16–23. [Google Scholar] [CrossRef]
- Saha, N.; Volpe, M.; Fiori, L.; Volpe, R.; Messineo, A.; Reza, M.T. Cationic dye adsorption on hydrochars of winery and citrus juice industries residues: Performance, mechanism, and thermodynamics. Energies 2020, 13, 4686. [Google Scholar] [CrossRef]
- Zaghouane-Boudiaf, H.; Boutahala, M.; Arab, L. Removal of methyl orange from aqueous solution by uncalcined and calcined MgNiAl layered double hydroxides (LDHs). Chem. Eng. J. 2012, 187, 142–149. [Google Scholar] [CrossRef]
- Ebelegi, A.N.; Ayawei, N.; Wankasi, D. Interpretation of adsorption thermodynamics and kinetics. Open J. Phys. Chem. 2020, 10, 166. [Google Scholar] [CrossRef]
- Fan, S.; Wang, Y.; Wang, Z.; Tang, J.; Tang, J.; Li, X. Removal of methylene blue from aqueous solution by sewage sludge-derived biochar: Adsorption kinetics, equilibrium, thermodynamics and mechanism. J. Environ. Chem. Eng. 2017, 5, 601–611. [Google Scholar] [CrossRef]
- Wu, F.C.; Tseng, R.L.; Juang, R.S. Characteristics of Elovich equation used for the analysis of adsorption kinetics in dye-chitosan systems. Chem. Eng. J. 2009, 150, 366–373. [Google Scholar] [CrossRef]
- Demir, H.; Top, A.; Balköse, D.; Ülkü, S. Dye adsorption behavior of Luffa cylindrica fibers. J. Hazard. Mater. 2008, 153, 389–394. [Google Scholar] [CrossRef] [PubMed]
- Ferrero, F. Dye removal by low cost adsorbents: Hazelnut shells in comparison with wood sawdust. J. Hazard. Mater. 2007, 142, 144–152. [Google Scholar] [CrossRef]
- Mustafa, I. Methylene blue removal from water using H2SO4 crosslinked magnetic chitosan nanocomposite beads. Microchem. J. 2019, 144, 397–402. [Google Scholar]
- Wang, Y.; Zhang, Y.; Li, S.; Zhong, W.; Wei, W. Enhanced methylene blue adsorption onto activated reed-derived biochar by tannic acid. J. Mol. Liq. 2018, 268, 658–666. [Google Scholar] [CrossRef]
- Güleç, F.; Williams, O.; Kostas, E.T.; Samson, A.; Stevens, L.A.; Lester, E. A comprehensive comparative study on methylene blue removal from aqueous solution using biochars produced from rapeseed, whitewood, and seaweed via different thermal conversion technologies. Fuel 2022, 330, 125428. [Google Scholar] [CrossRef]
- Güleç, F.; Özen, A.; Niftaliyeva, A.; Aydın, A.; Şimşek, E.H.; Karaduman, A. A kinetic study on methylation of naphthalene over Fe/ZSM-5 zeolite catalysts. Res. Chem. Intermed. 2018, 44, 55–67. [Google Scholar] [CrossRef]
- Lian, Q.; Yao, L.; Ahmad, Z.U.; Konggidinata, M.I.; Zappi, M.E.; Gang, D.D. Modeling mass transfer for adsorptive removal of Pb (II) onto phosphate modified ordered mesoporous carbon (OMC). J. Contam. Hydrol. 2020, 228, 103562. [Google Scholar] [CrossRef] [PubMed]
- Tran, H.N.; You, S.-J.; Nguyen, T.V.; Chao, H.-P. Insight into the adsorption mechanism of cationic dye onto biosorbents derived from agricultural wastes. Chem. Eng. Commun. 2017, 204, 1020–1036. [Google Scholar] [CrossRef]
- Salazar-Rabago, J.J.; Leyva-Ramos, R.; Rivera-Utrilla, J.; Ocampo-Perez, R.; Cerino-Cordova, F.J. Biosorption mechanism of Methylene Blue from aqueous solution onto White Pine (Pinus durangensis) sawdust: Effect of operating conditions. Sustain. Environ. Res. 2017, 27, 32–40. [Google Scholar] [CrossRef]
- Dinh, V.-P.; Le, H.M.; Nguyen, V.-D.; Dao, V.-A.; Hung, N.Q.; Tuyen, L.A.; Lee, S.; Yi, J.; Nguyen, T.D.; Tan, L. Insight into the adsorption mechanisms of methylene blue and chromium (III) from aqueous solution onto pomelo fruit peel. RSC Adv. 2019, 9, 25847–25860. [Google Scholar] [CrossRef]
- Shelke, B.N.; Jopale, M.K.; Kategaonkar, A.H. Exploration of biomass waste as low cost adsorbents for removal of methylene blue dye: A review. J. Indian Chem. Soc. 2022, 99, 100530. [Google Scholar] [CrossRef]
- Oliveira, L.S.; Franca, A.S.; Alves, T.M.; Rocha, S.D. Evaluation of untreated coffee husks as potential biosorbents for treatment of dye contaminated waters. J. Hazard. Mater. 2008, 155, 507–512. [Google Scholar] [CrossRef]
- Ponnusami, V.; Vikram, S.; Srivastava, S. Guava (Psidium guajava) leaf powder: Novel adsorbent for removal of methylene blue from aqueous solutions. J. Hazard. Mater. 2008, 152, 276–286. [Google Scholar] [CrossRef]
- Malash, G.F.; El-Khaiary, M.I. Methylene blue adsorption by the waste of Abu-Tartour phosphate rock. J. Coll. Interface Sci. 2010, 348, 537–545. [Google Scholar] [CrossRef]
- Kumar, P.S.; Ramalingam, S.; Sathishkumar, K. Removal of methylene blue dye from aqueous solution by activated carbon prepared from cashew nut shell as a new low-cost adsorbent. Korean J. Chem. Eng. 2011, 28, 149–155. [Google Scholar] [CrossRef]
- Özer, D.; Dursun, G.; Özer, A. Methylene blue adsorption from aqueous solution by dehydrated peanut hull. J. Hazard. Mater. 2007, 144, 171–179. [Google Scholar] [CrossRef] [PubMed]
- Sen, T.K.; Afroze, S.; Ang, H. Equilibrium, kinetics and mechanism of removal of methylene blue from aqueous solution by adsorption onto pine cone biomass of Pinus radiata. Water Air Soil Pollut. 2011, 218, 499–515. [Google Scholar] [CrossRef]
- Pavan, F.A.; Lima, E.C.; Dias, S.L.; Mazzocato, A.C. Methylene blue biosorption from aqueous solutions by yellow passion fruit waste. J. Hazard. Mater. 2008, 150, 703–712. [Google Scholar] [CrossRef]
- Bestani, B.; Benderdouche, N.; Benstaali, B.; Belhakem, M.; Addou, A. Methylene blue and iodine adsorption onto an activated desert plant. Bioresour. Technol. 2008, 99, 8441–8444. [Google Scholar] [CrossRef]
- Hameed, B.; Mahmoud, D.; Ahmad, A. Equilibrium modeling and kinetic studies on the adsorption of basic dye by a low-cost adsorbent: Coconut (Cocos nucifera) bunch waste. J. Hazard. Mater. 2008, 158, 65–72. [Google Scholar] [CrossRef]
- Thirunavukkarasu, A.; Nithya, R.; Sivashankar, R. Continuous fixed-bed biosorption process: A review. Chem. Eng. J. Adv. 2021, 8, 100188. [Google Scholar] [CrossRef]
Disclaimer/Publisher’s Note: The statements, opinions and data contained in all publications are solely those of the individual author(s) and contributor(s) and not of MDPI and/or the editor(s). MDPI and/or the editor(s) disclaim responsibility for any injury to people or property resulting from any ideas, methods, instructions or products referred to in the content. |
© 2023 by the authors. Licensee MDPI, Basel, Switzerland. This article is an open access article distributed under the terms and conditions of the Creative Commons Attribution (CC BY) license (https://creativecommons.org/licenses/by/4.0/).