
Effect of Drying–Wetting Cycle and Vibration on Strength Properties of Granite Residual Soil

Abstract
1. Introduction
2. Experimental Setup
2.1. Test Materials
2.2. Test Methods
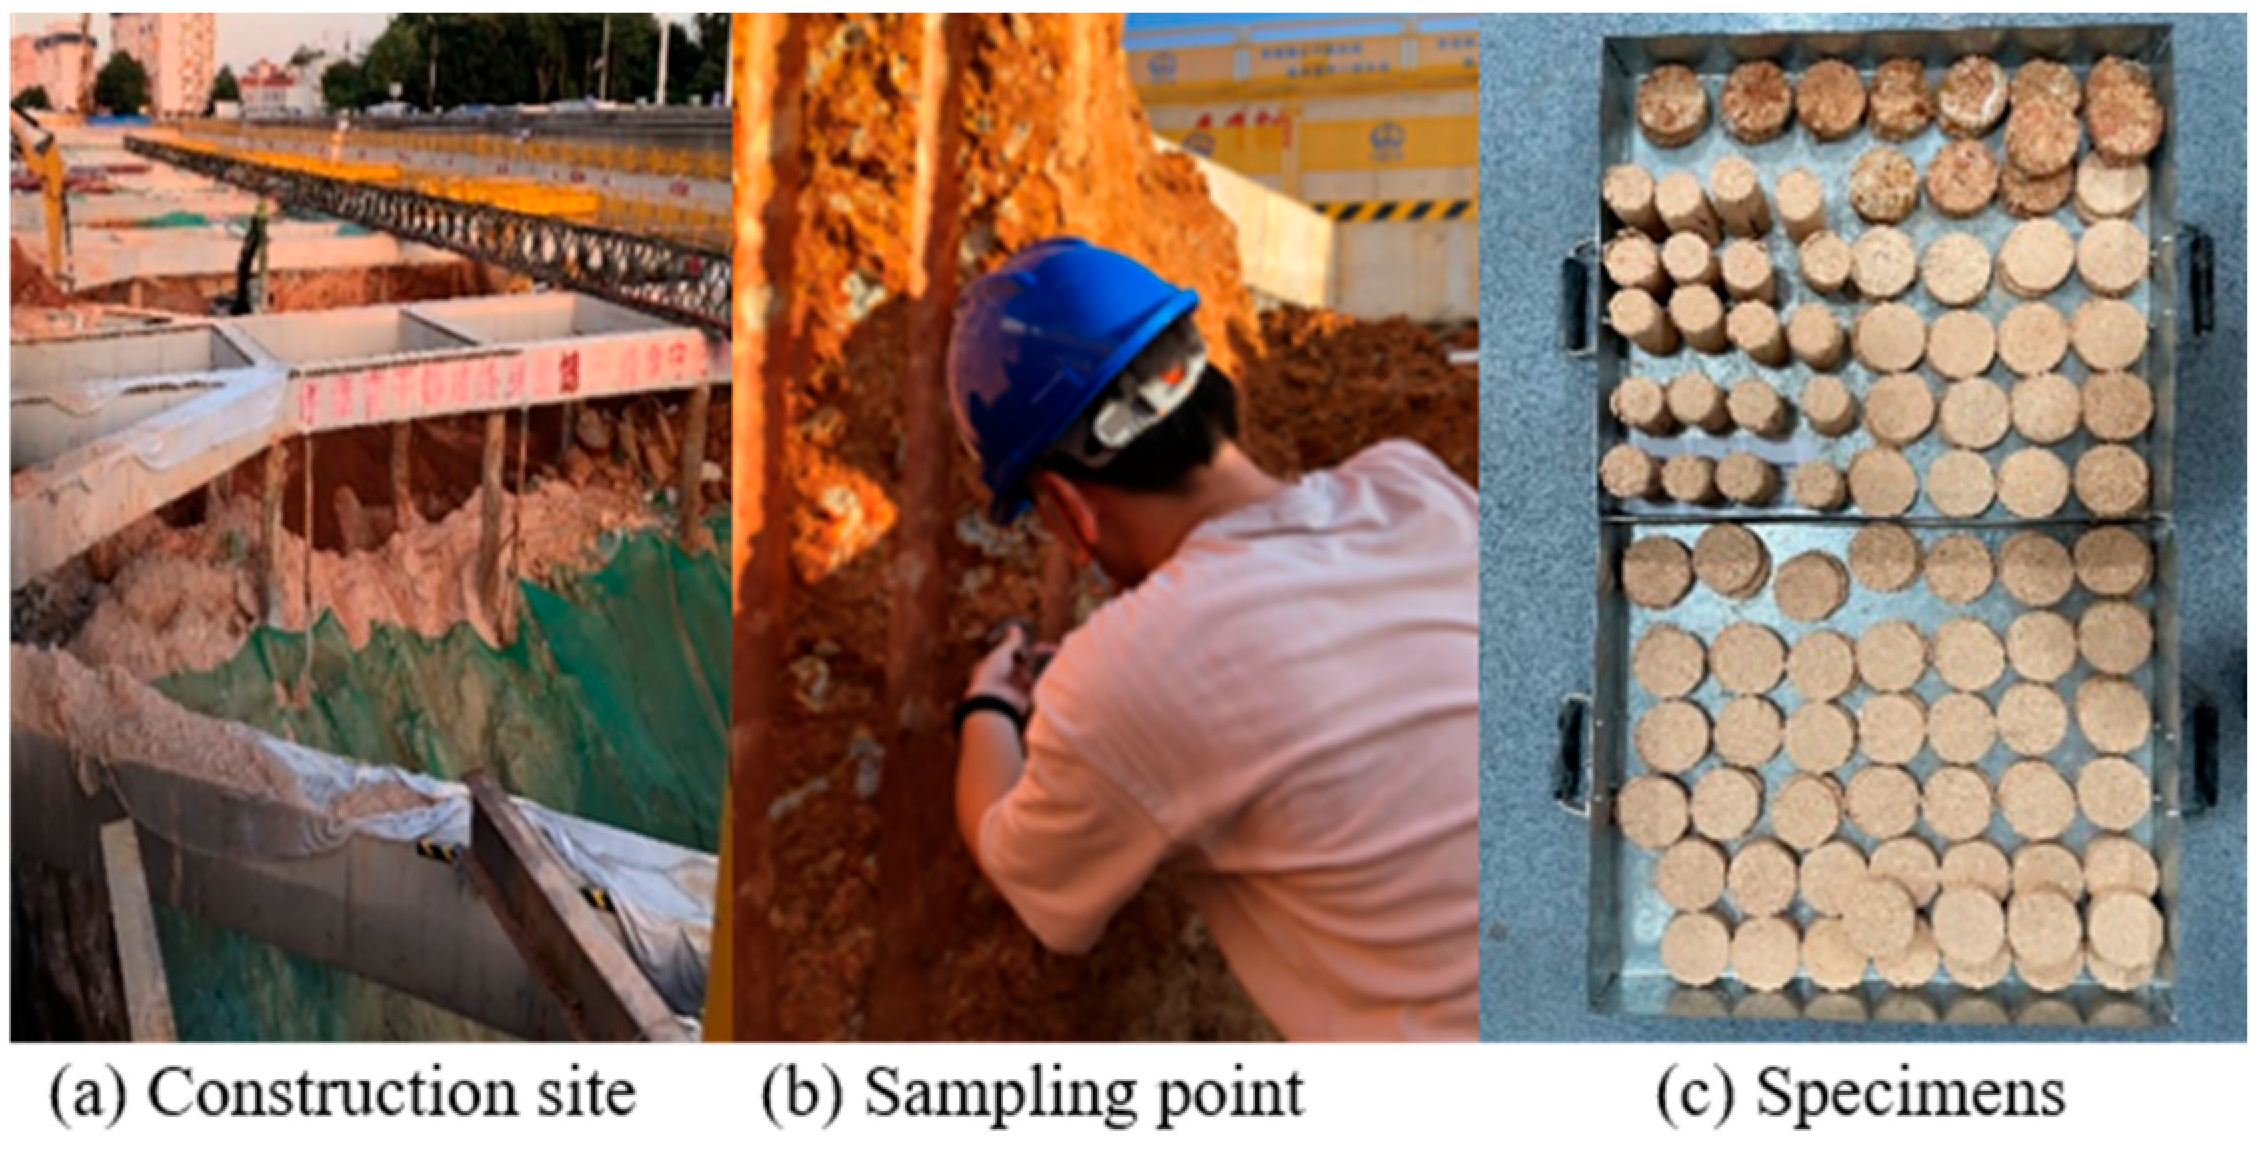
2.2.1. Sample Preparation
2.2.2. Vibration Simulation and Drying–Wetting Cycle Process
- (1)
- Vibration simulation
- (2)
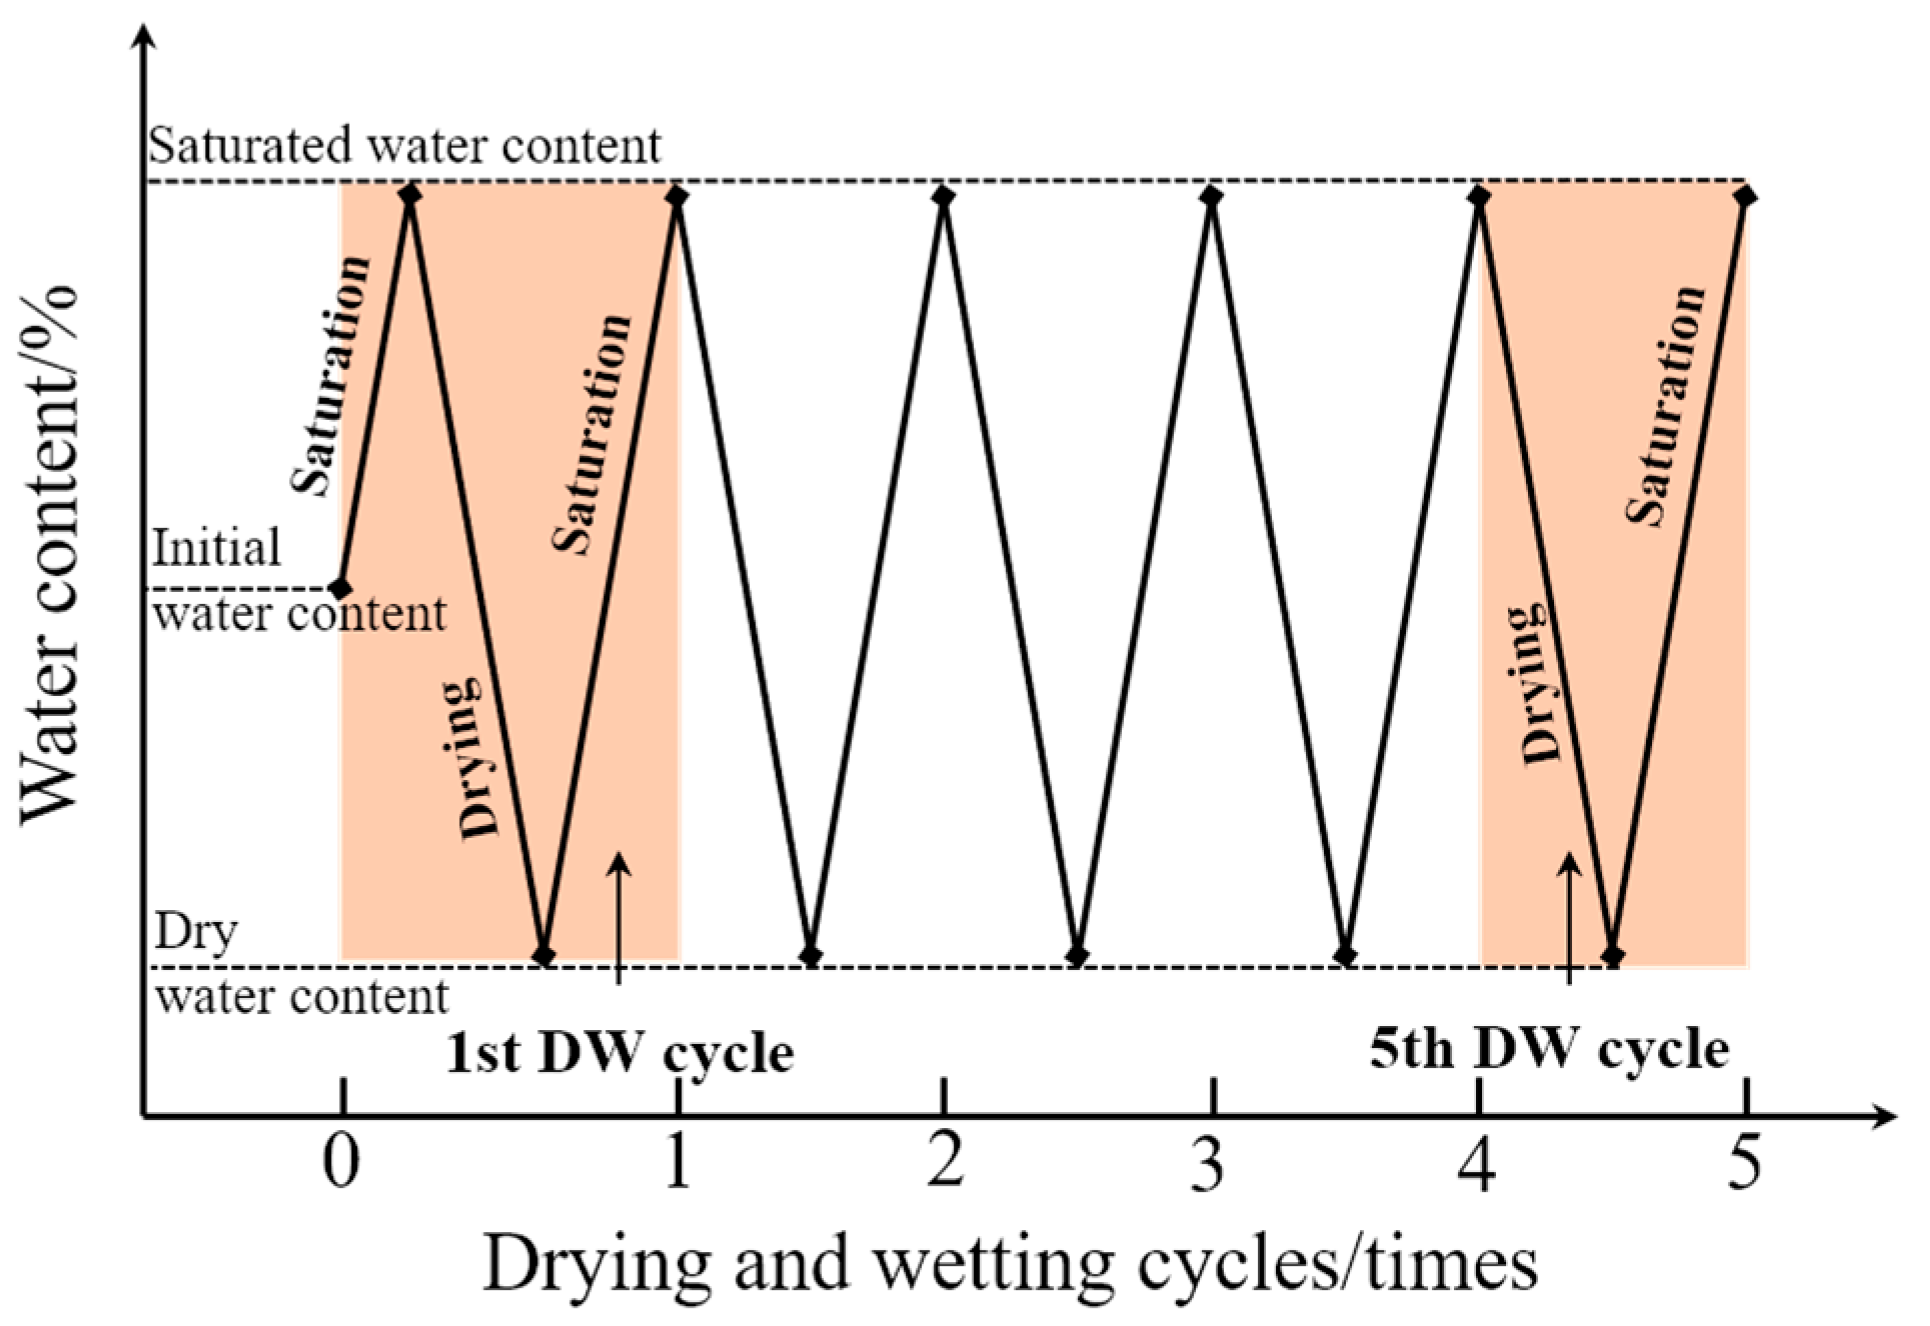
- Drying–wetting cycle process
2.2.3. Mechanical Test
- (1)
- Direct shear test
- (2)
- Unconfined compression strength test
3. Test Results and Analysis
3.1. Analysis of Direct Shear Test Results
3.1.1. Characteristics of Stress–Strain Curve in Direct Shear Test
3.1.2. Variation in Shear Strength Parameters
- (1)
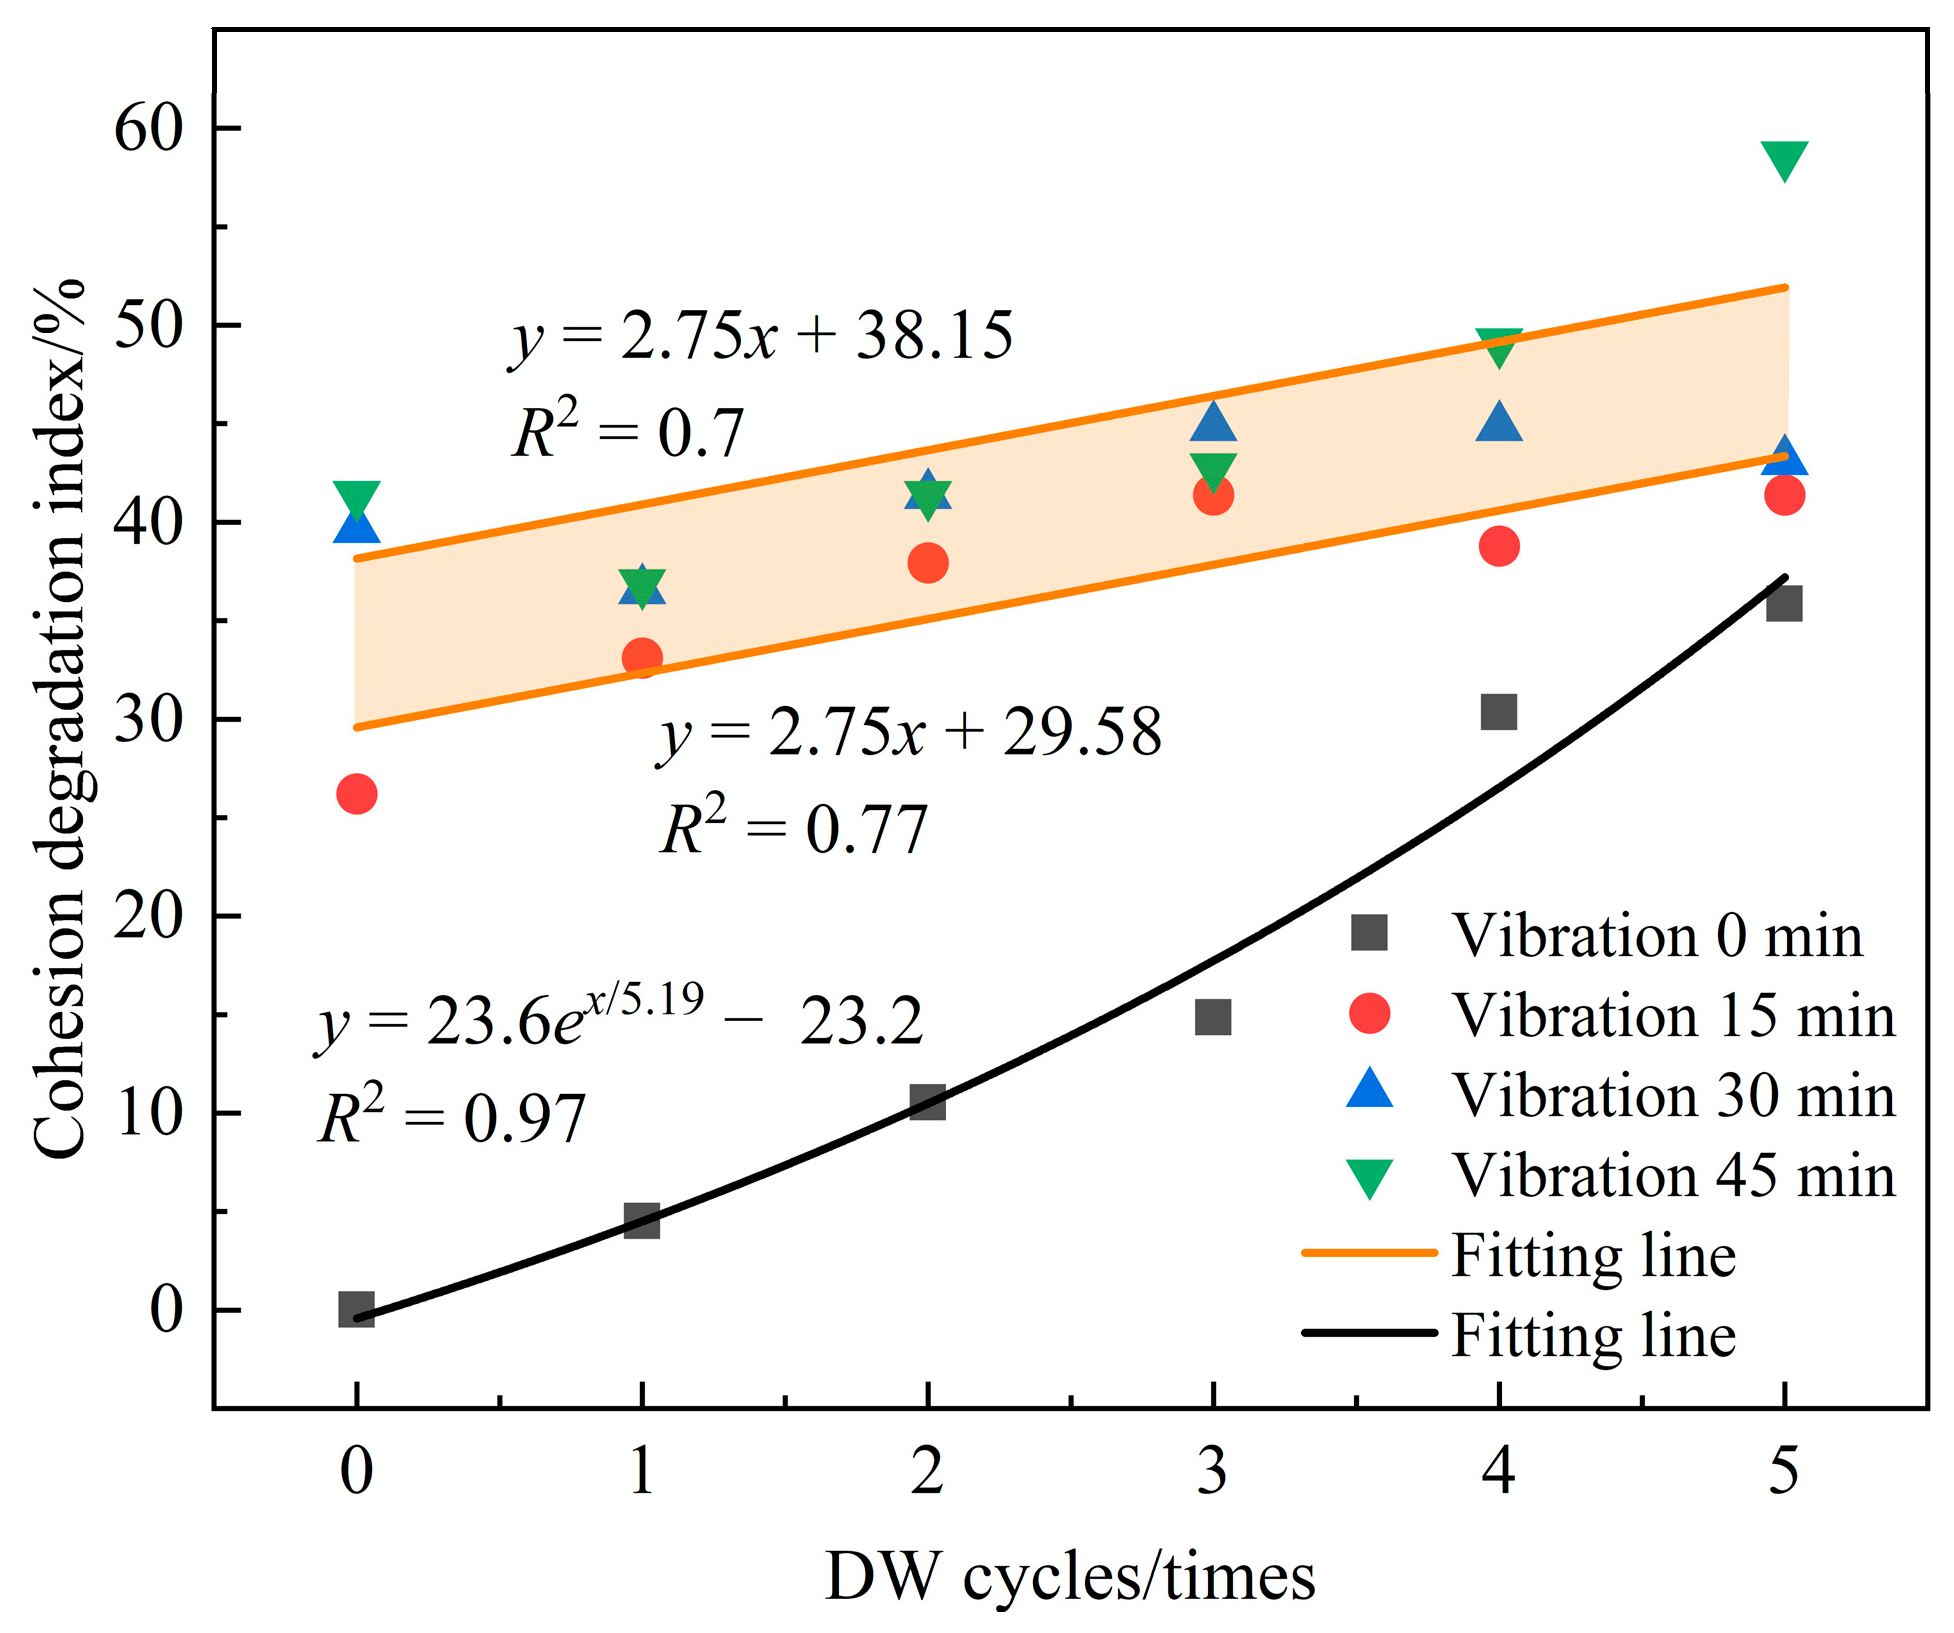
- Cohesion
- (2)
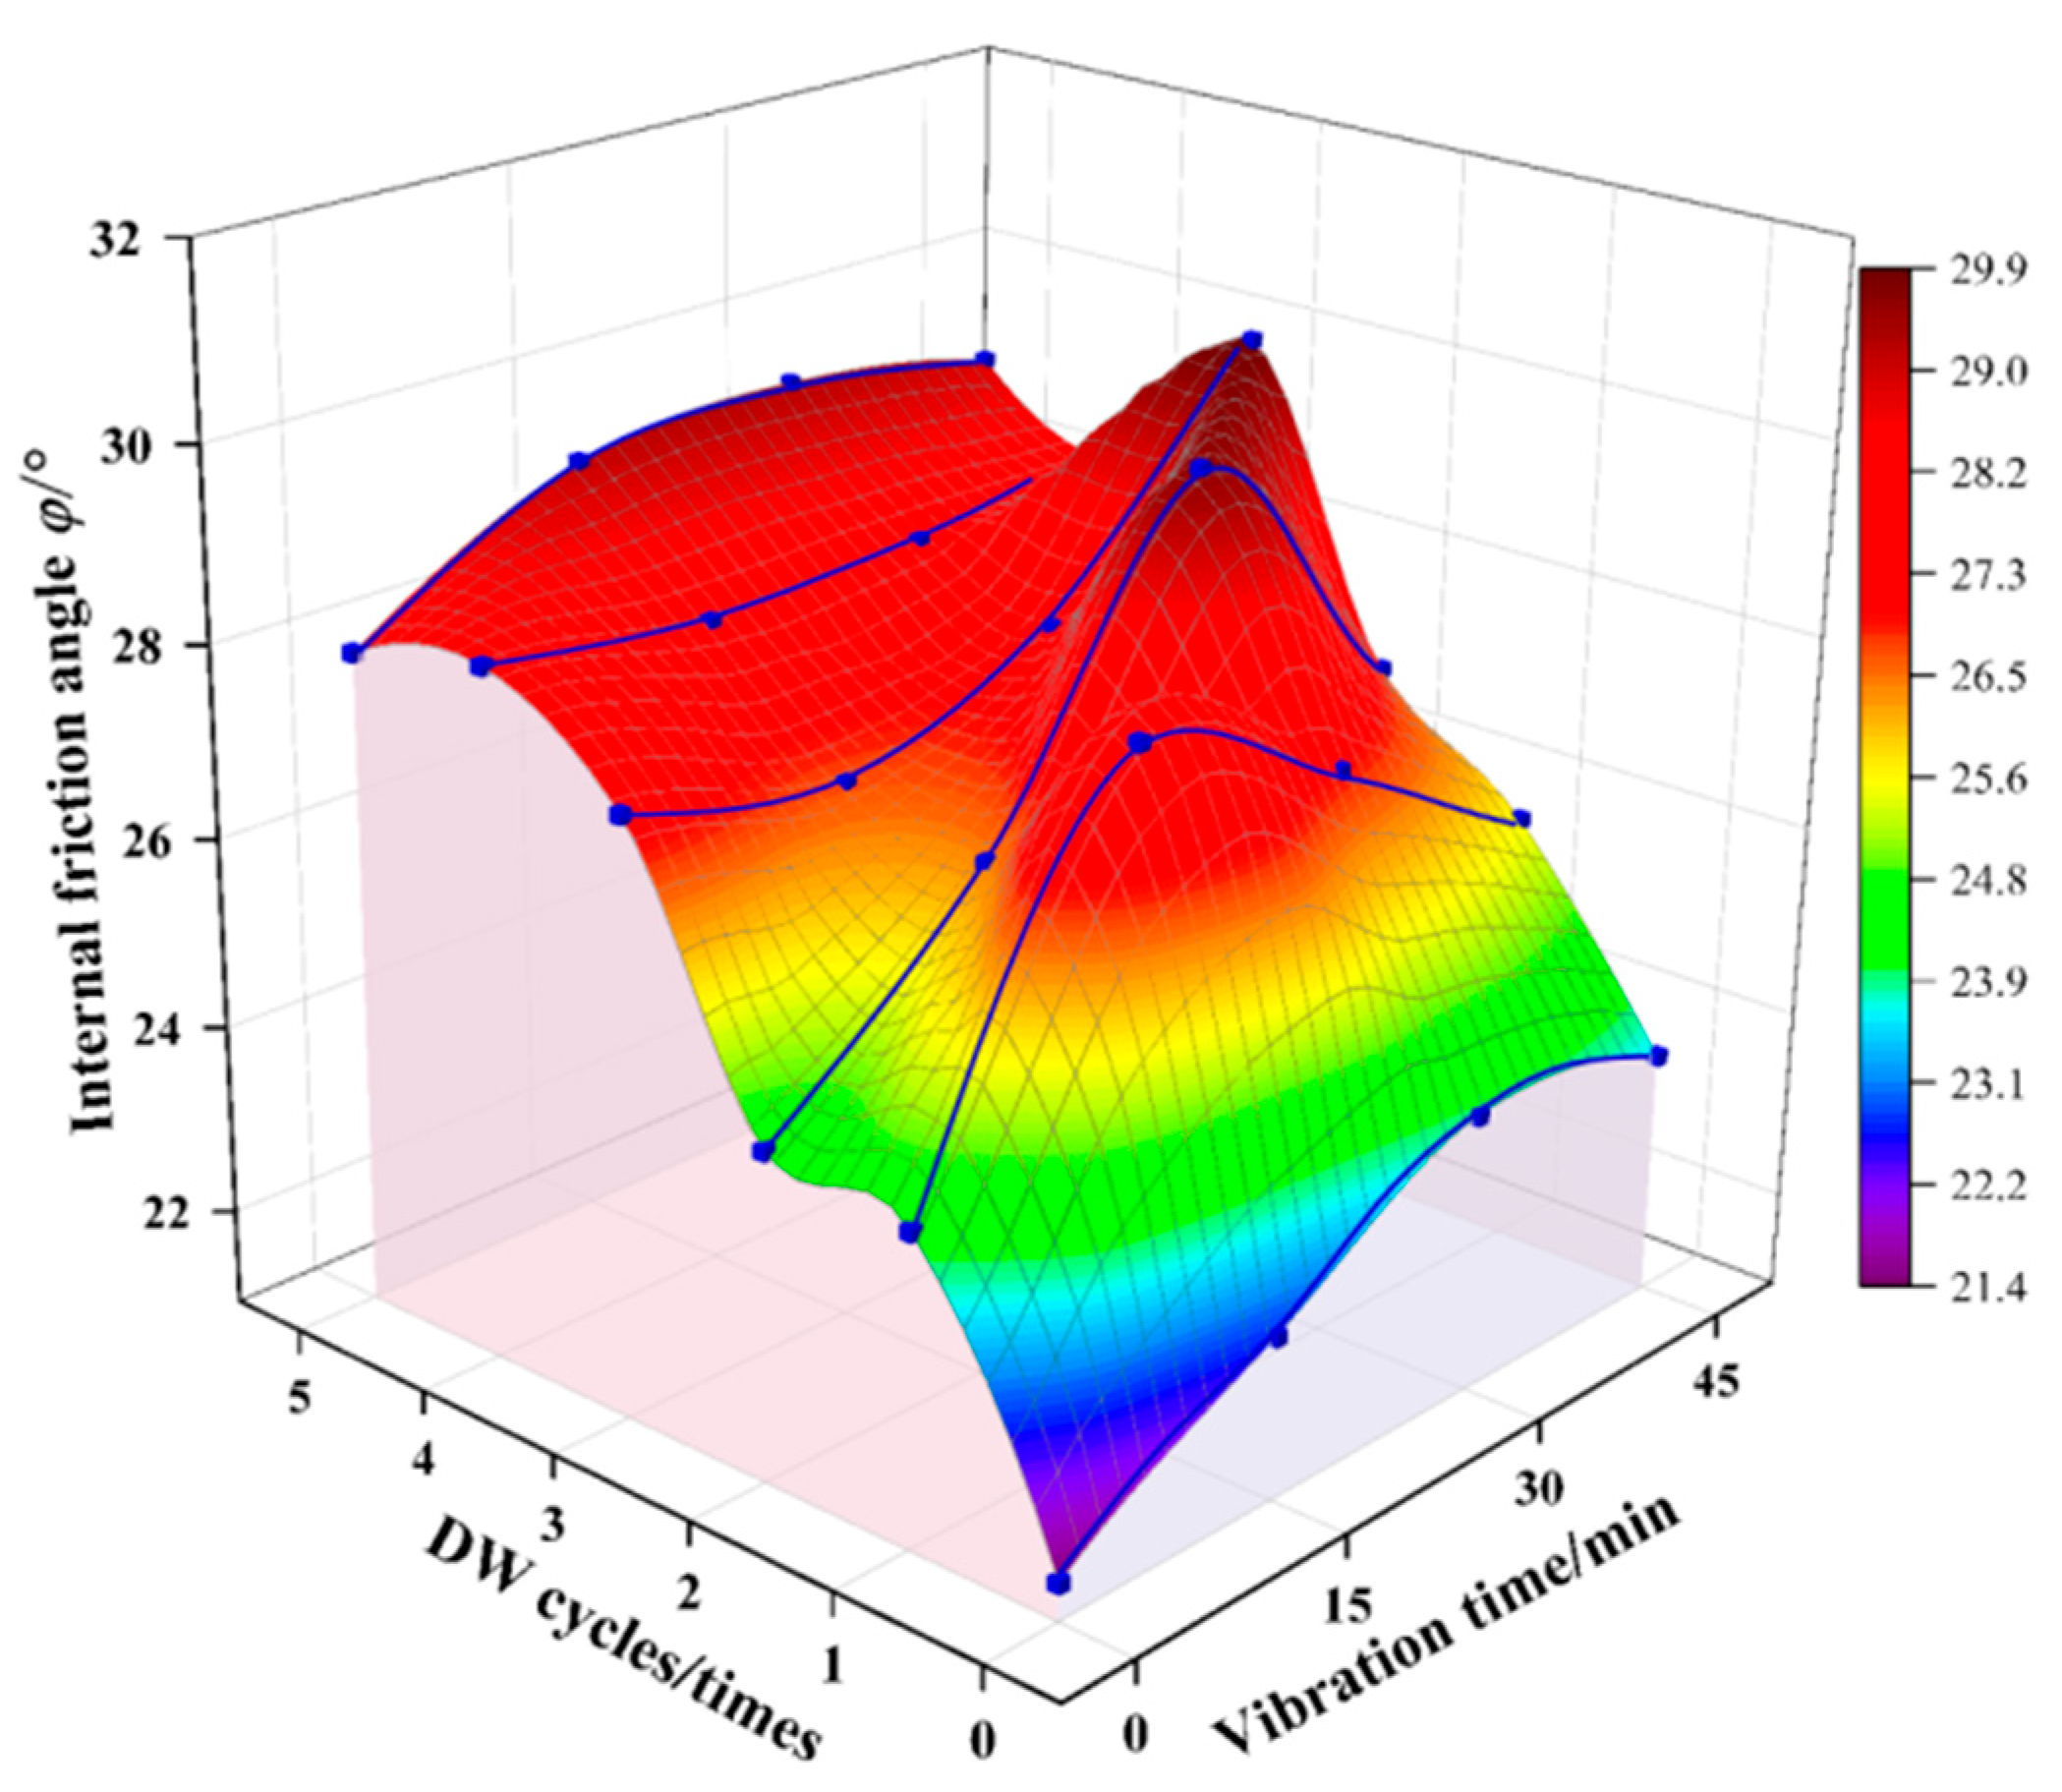
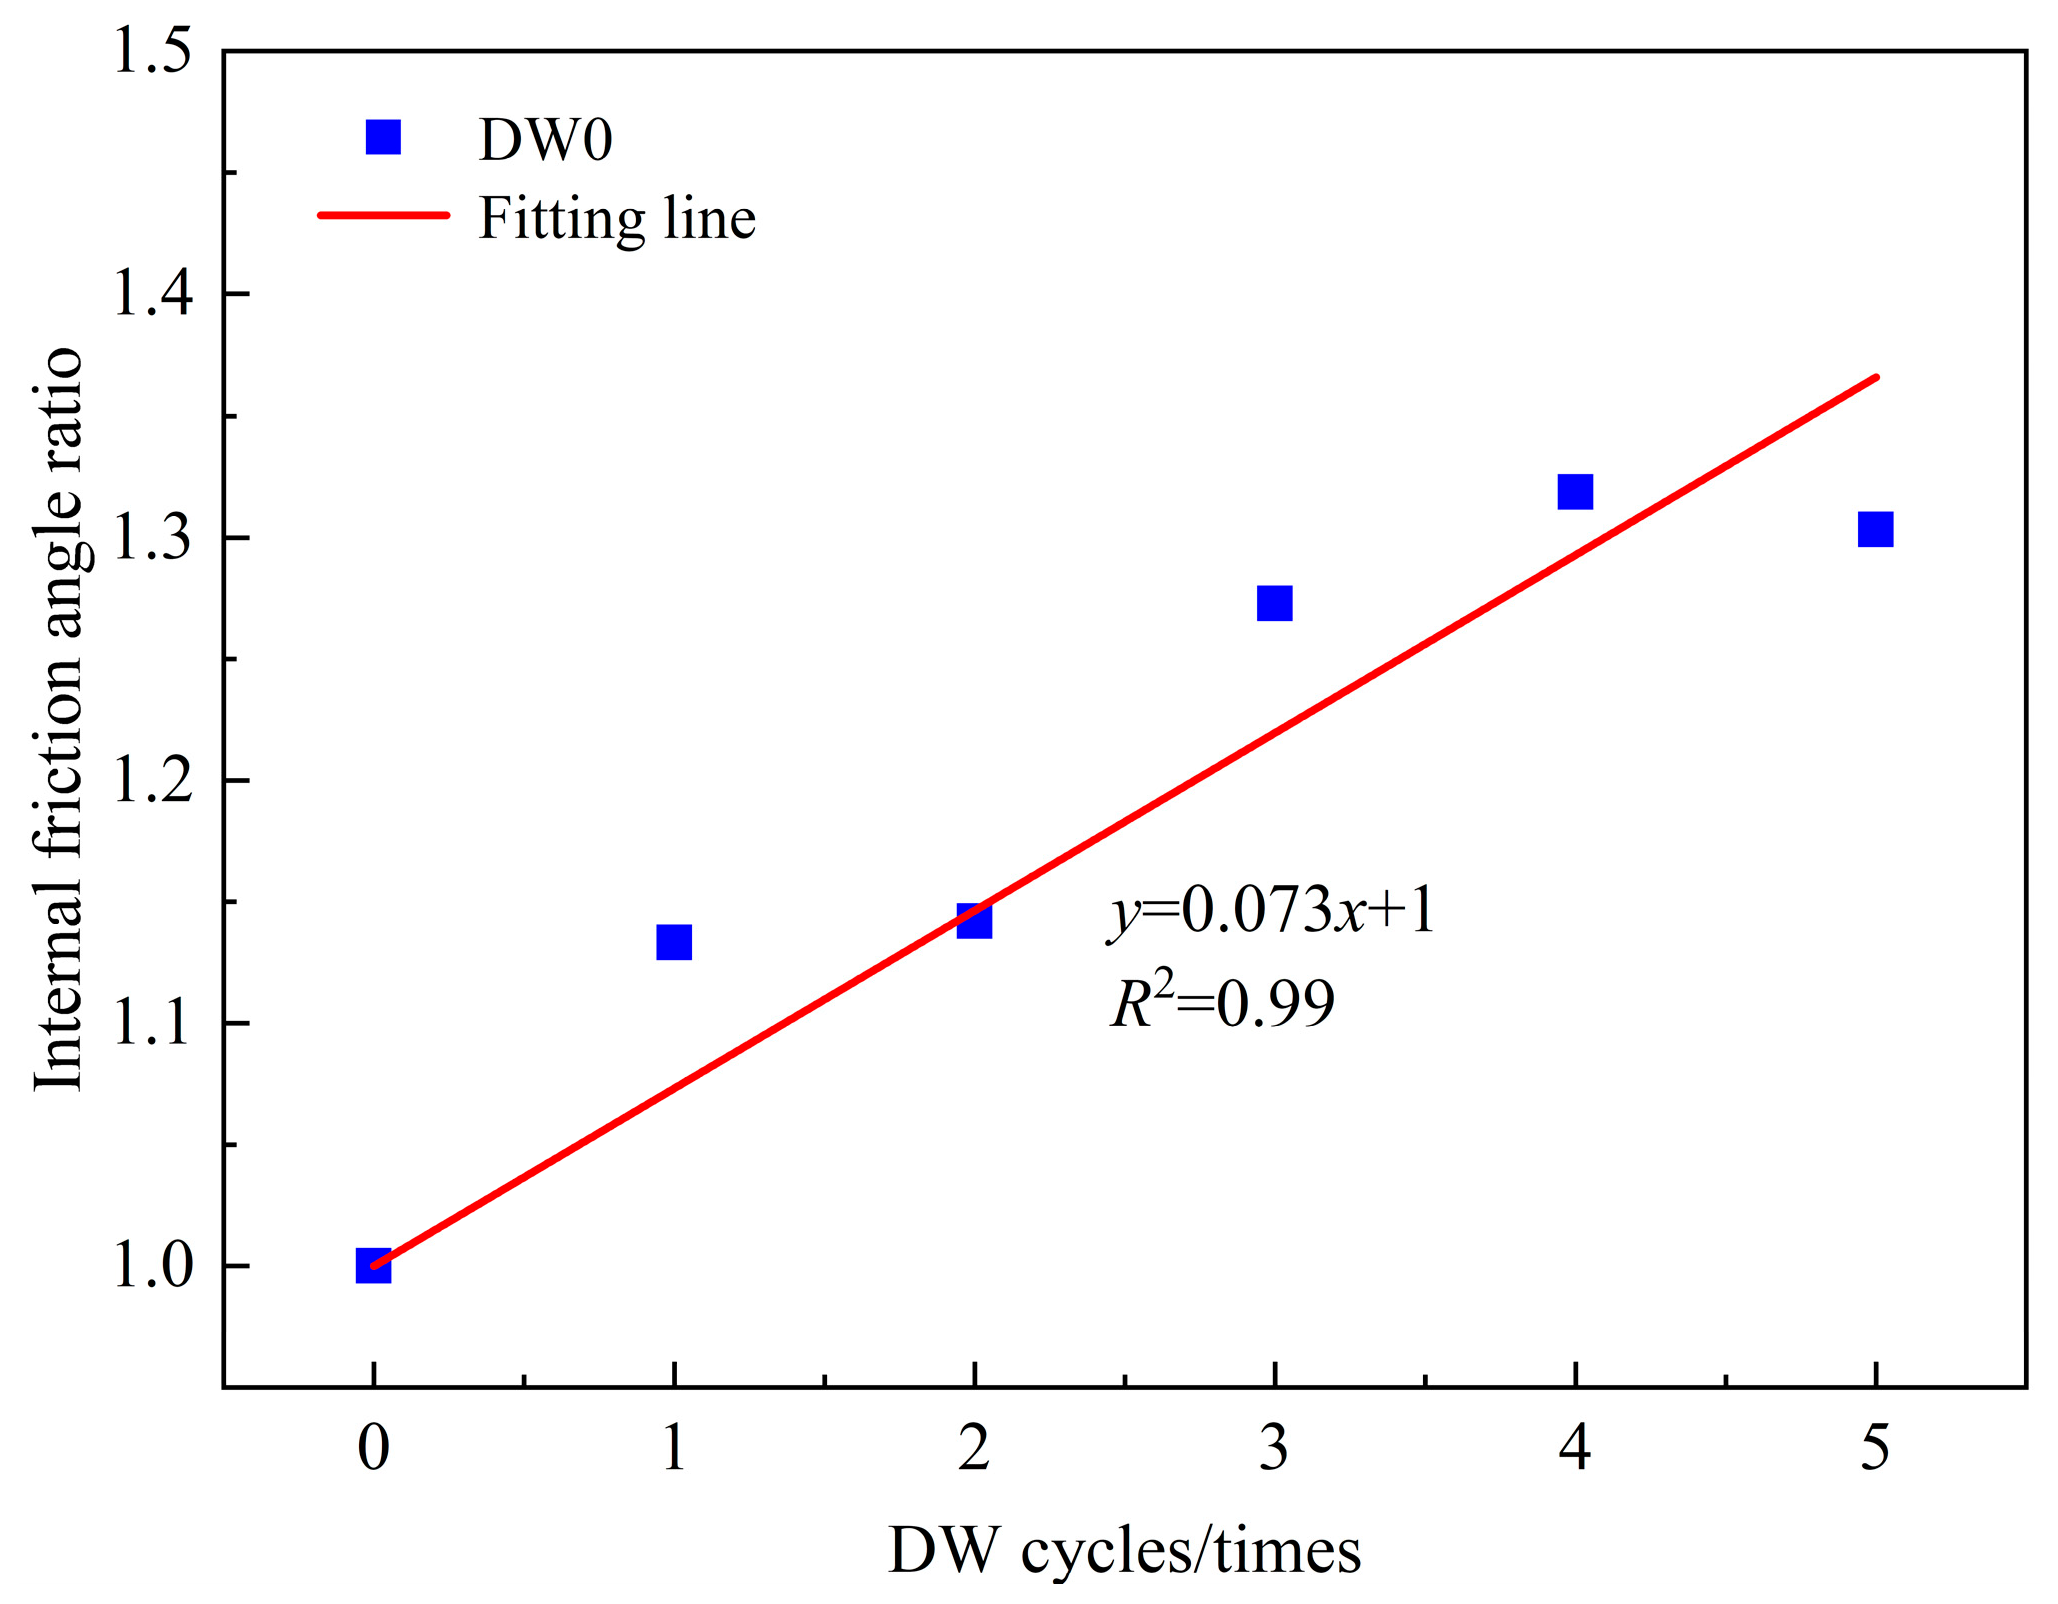
- Internal friction angle
3.1.3. Modification of the Shear Strength Formula
3.2. Analysis of Unconfined Compression Strength Test Results
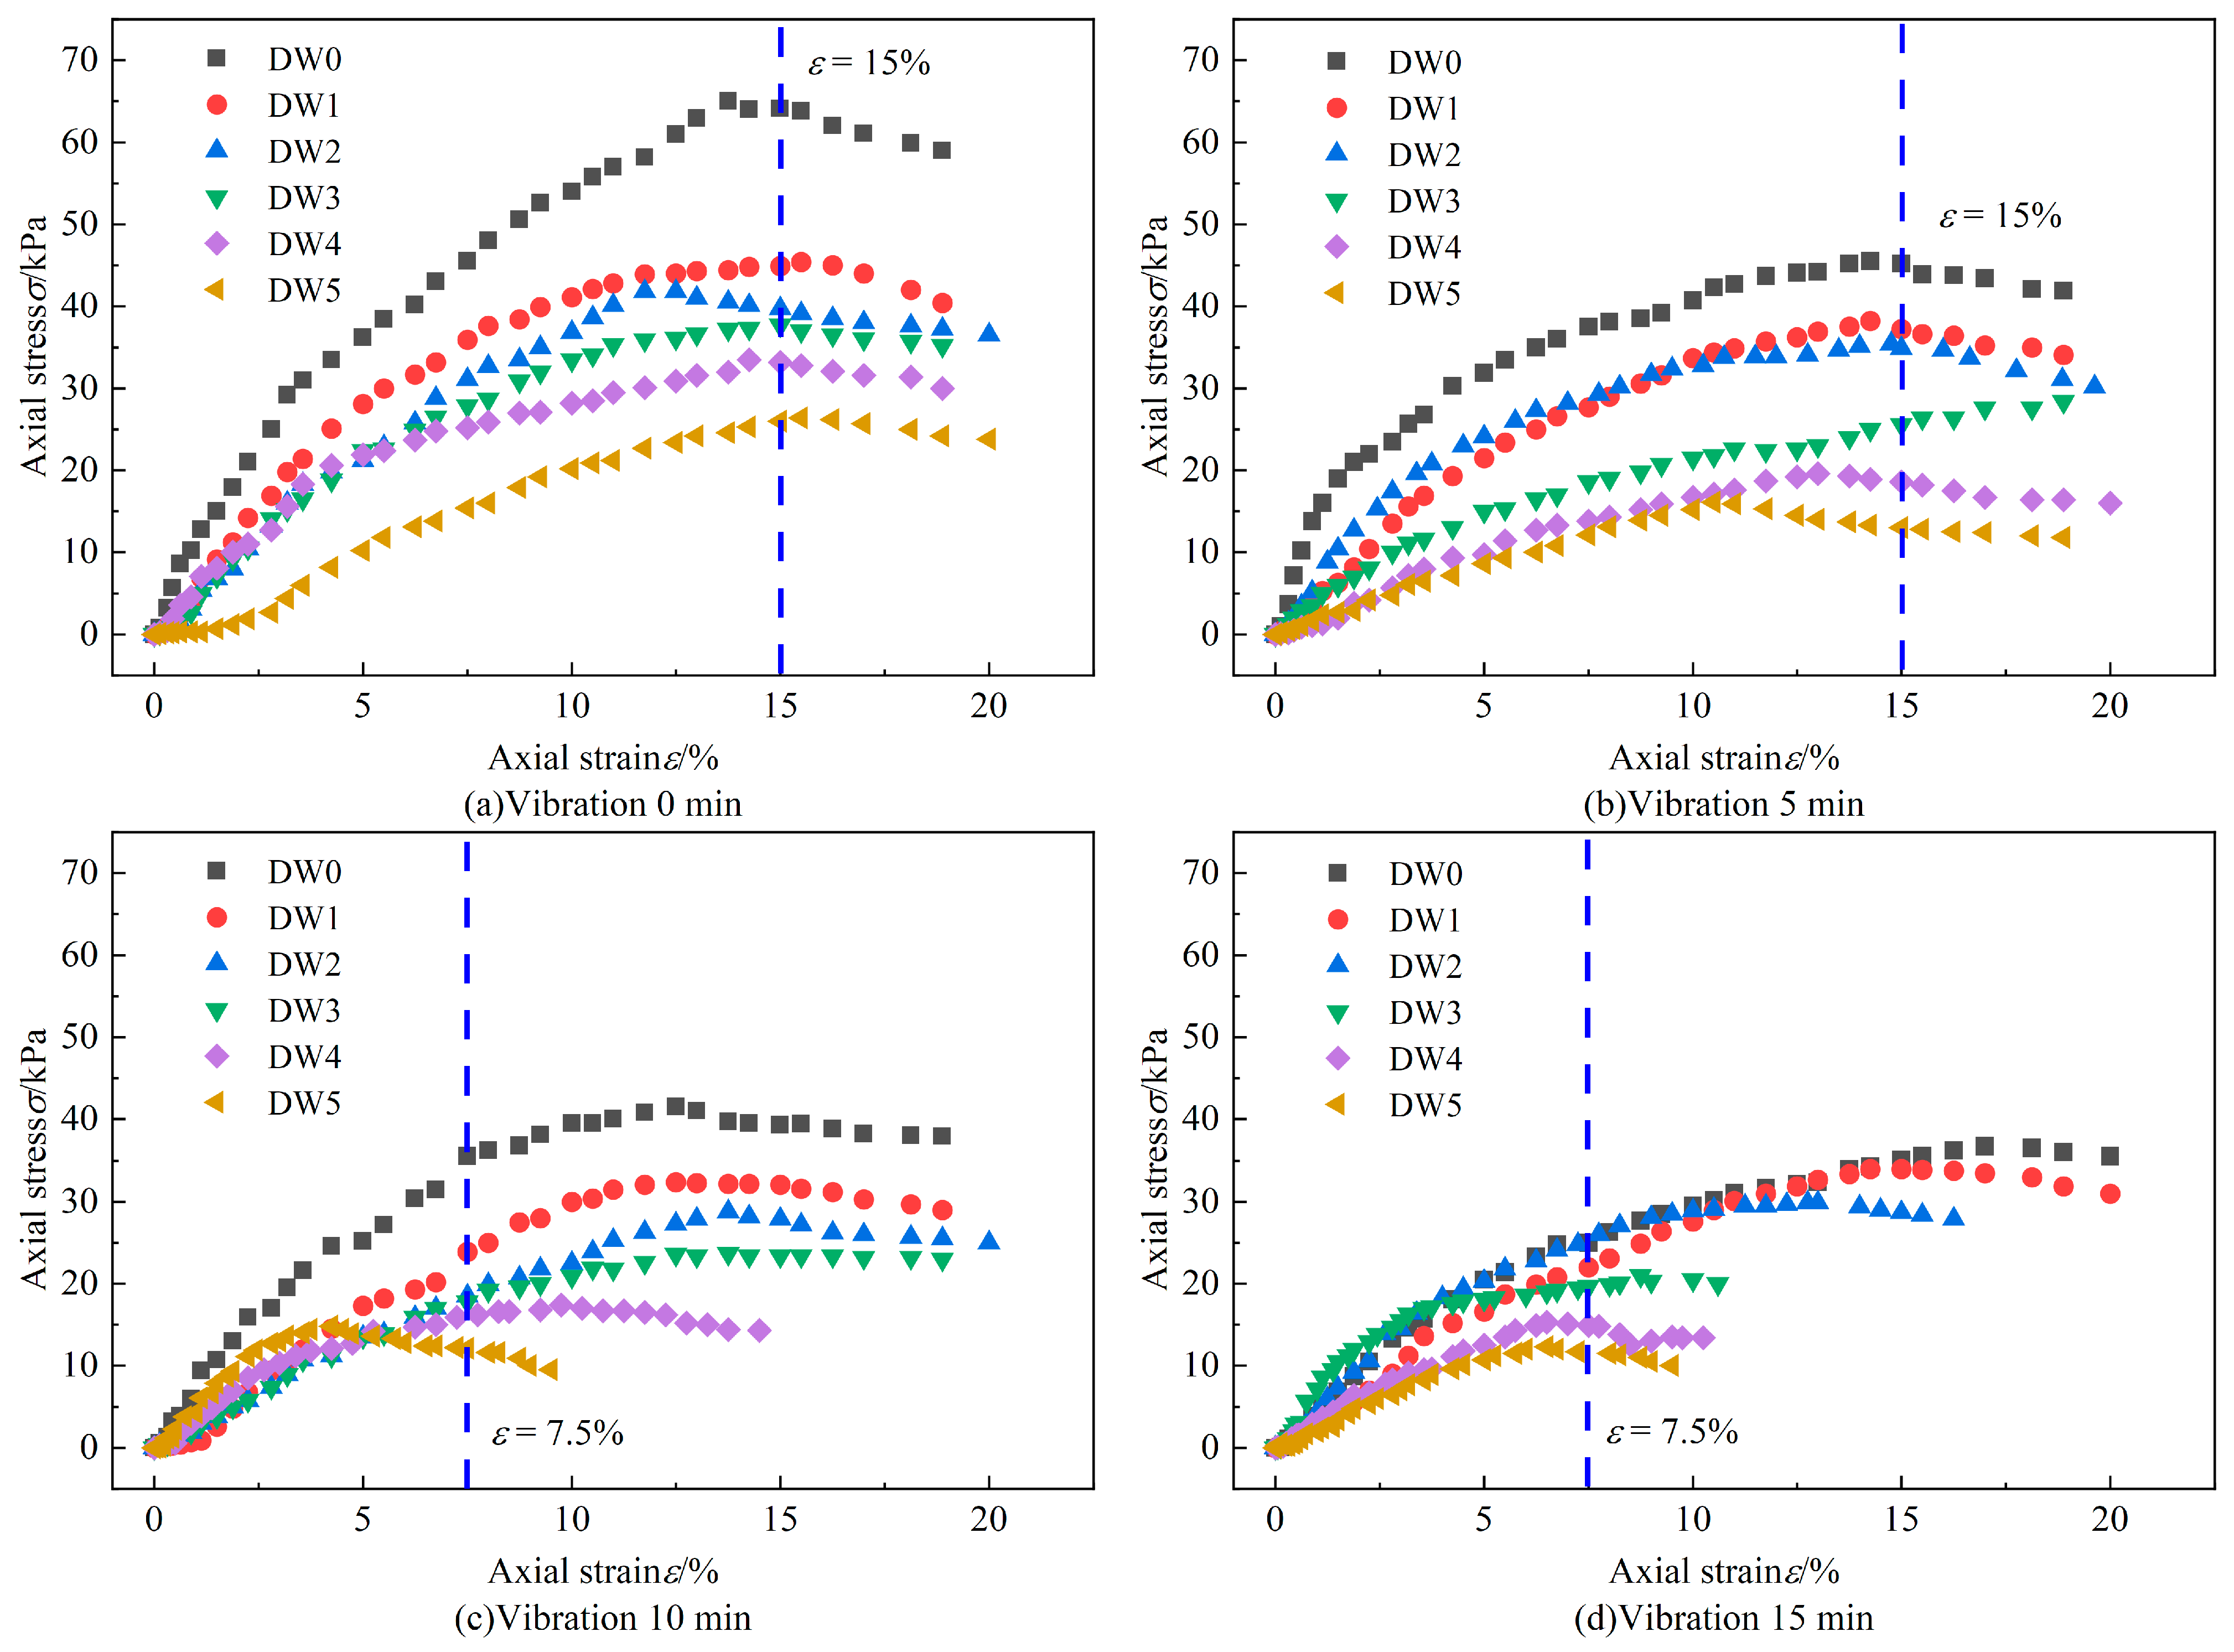
3.2.1. Characteristics of Stress–Strain Curve in UCS Test
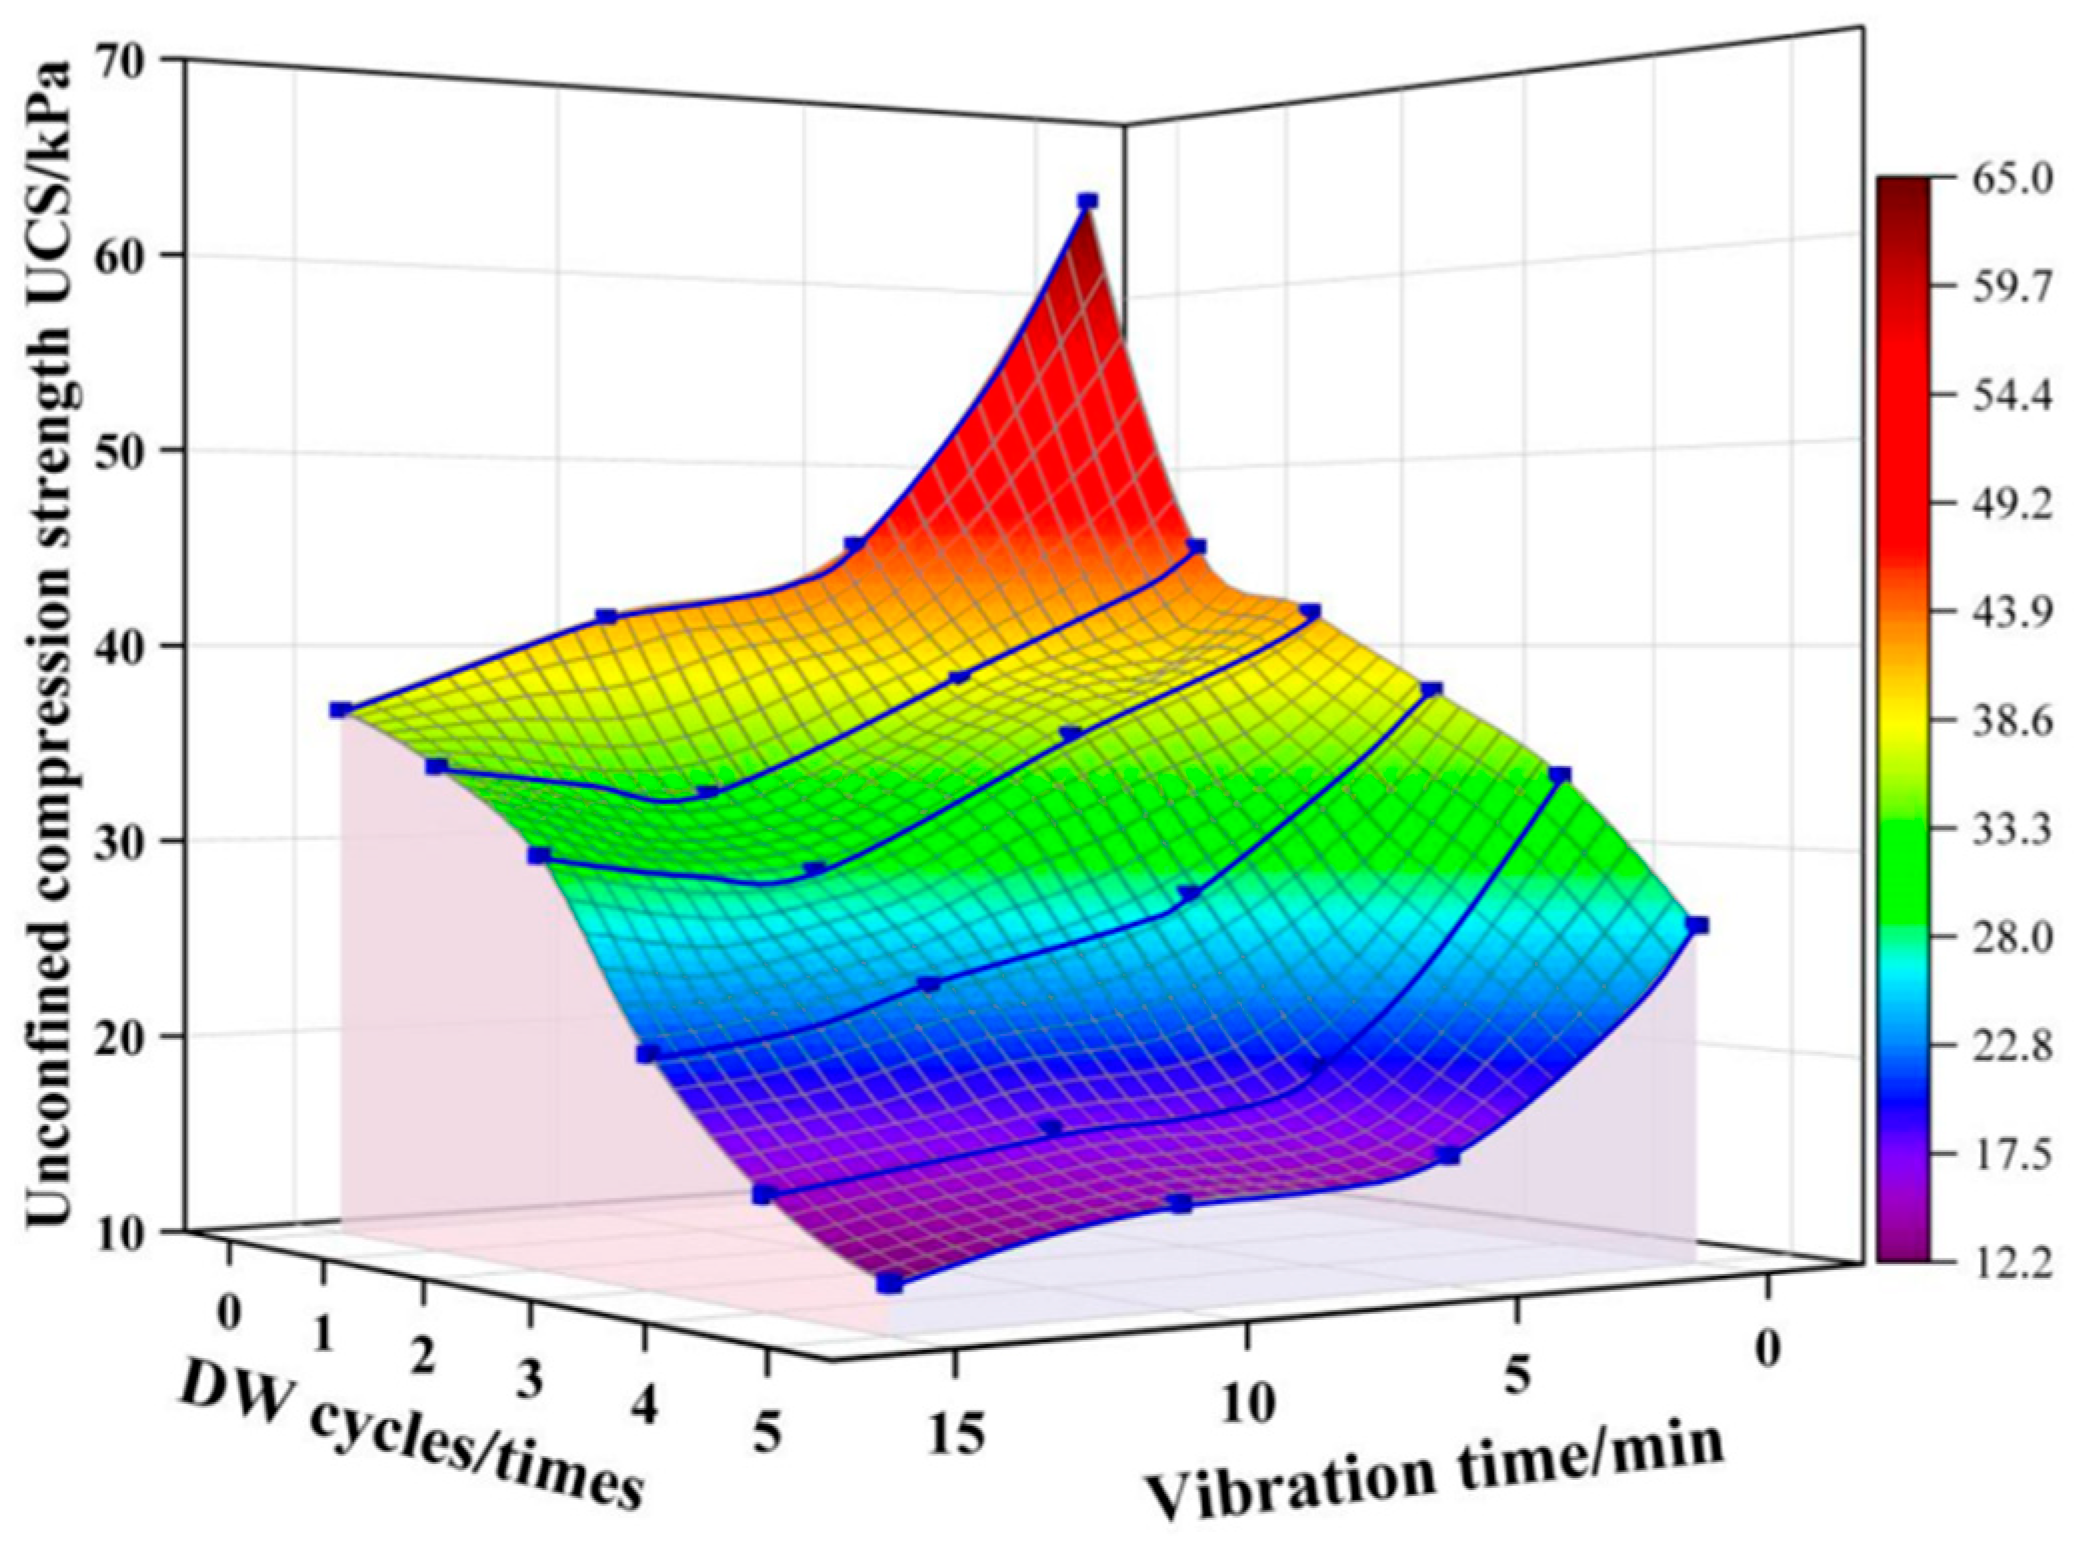
3.2.2. Unconfined Compression Strength
4. Conclusions
- (1)
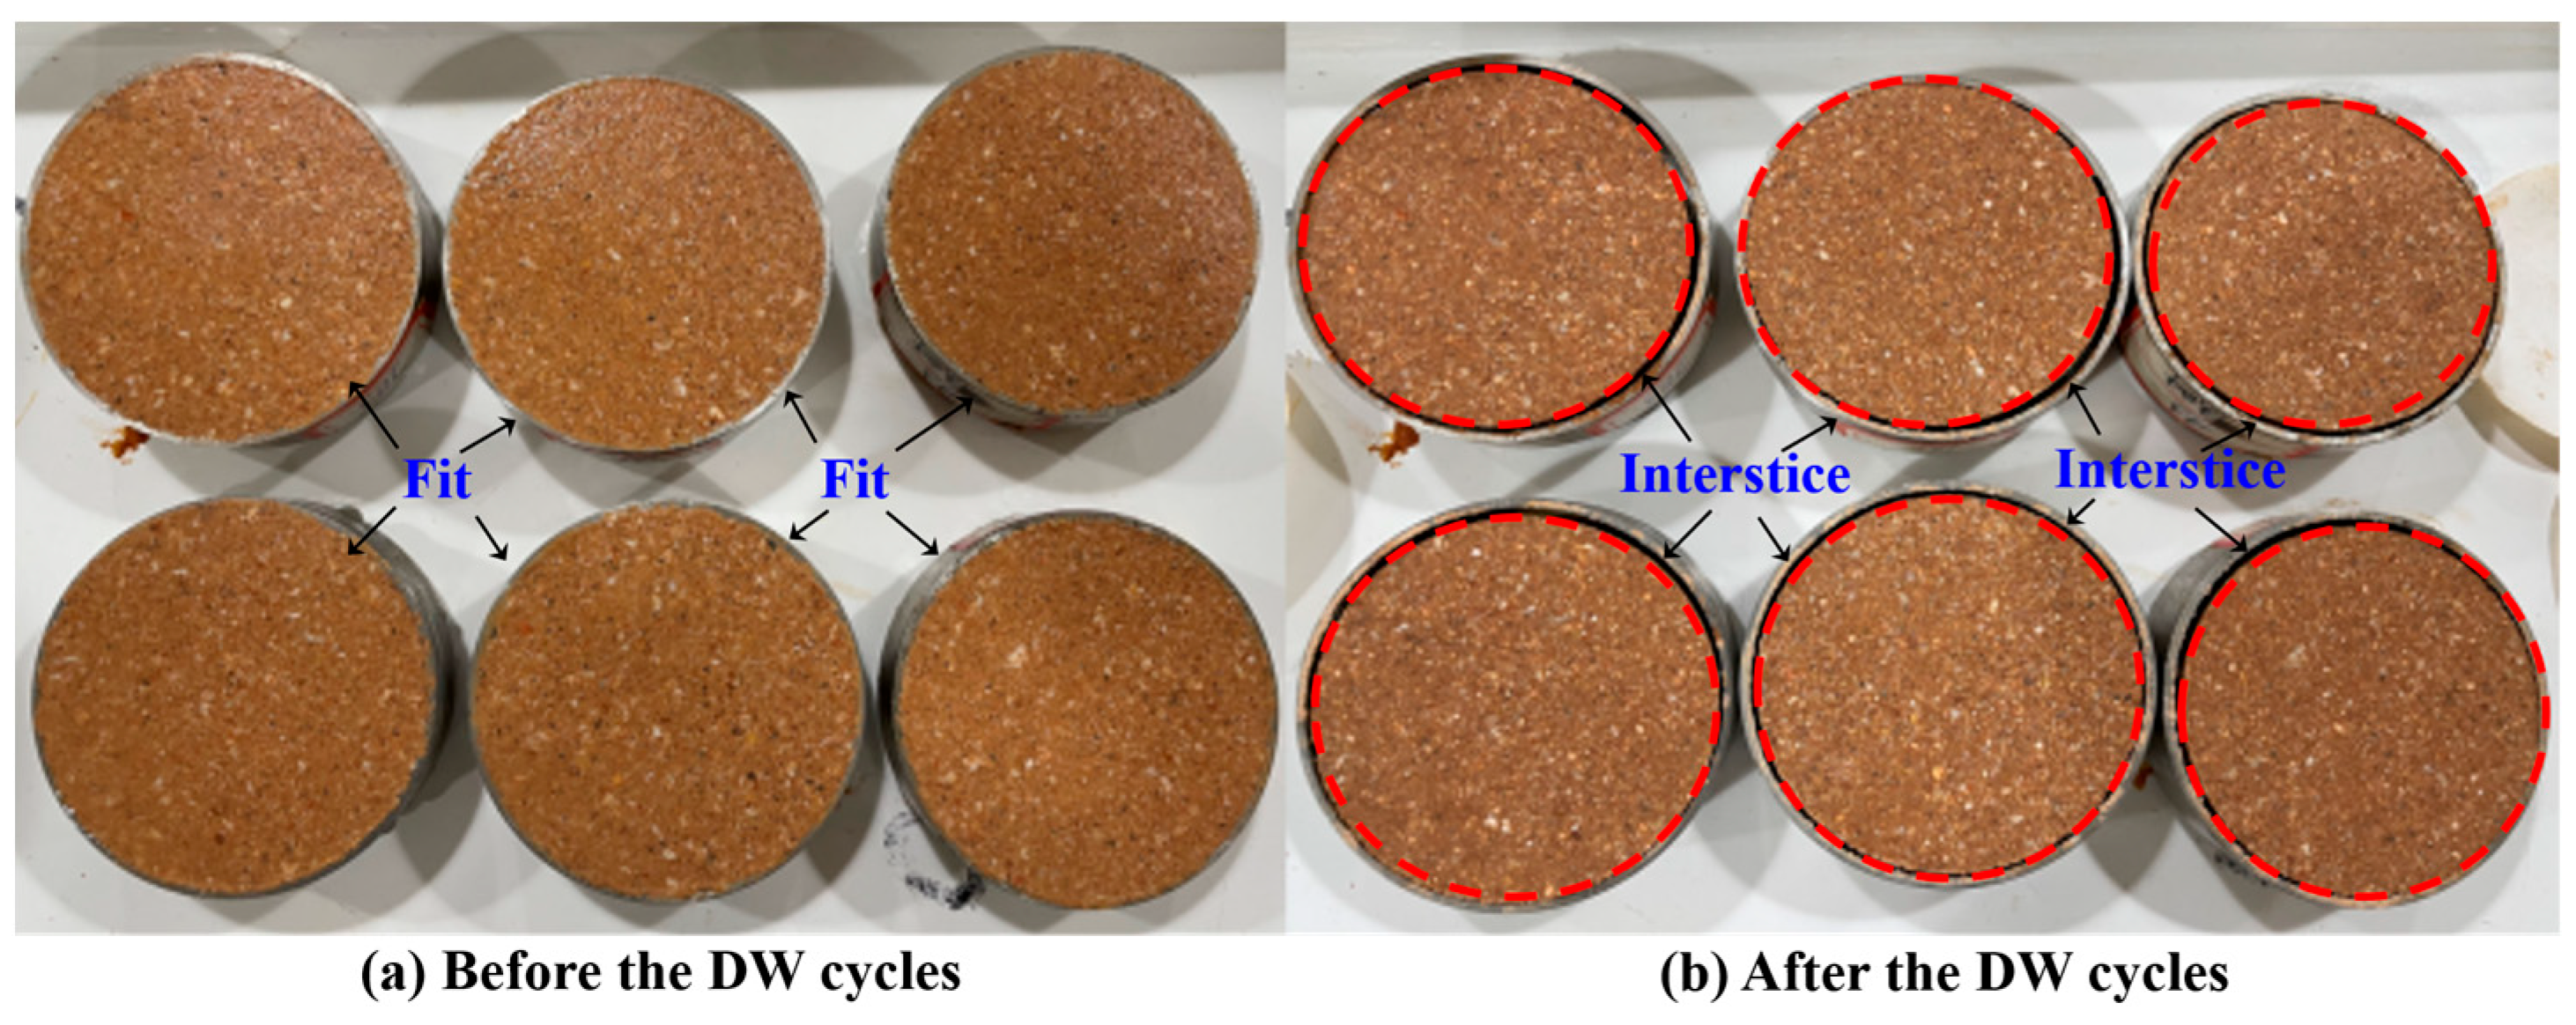
- The stress–strain curve of shear strength mainly exhibited strain-hardening characteristics. Due to the volume shrinkage caused by DW cycles and vibration, the shear compressibility of the sample increased with the number of DW cycles and the vibration time. The stress–strain curve of unconfined compression strength showed strain-softening characteristics, with a significant decrease in the stress peak due to DW cycles and vibration, and their combined effect shifted the stress peak forward in the stress–strain curve.
- (2)
- The cohesion decreased nonlinearly with the increase in the number of DW cycles and the vibration time, and the degradation of cohesion reached 58.6% under their combined effect, but the degradation effect was not simply additive. The compaction effect of DW cycles on the soil caused a fluctuating increase in the internal friction angle with the increase in the number of DW cycles. The influence of vibration on the internal friction angle decreased with the increase in the number of DW cycles.
- (3)
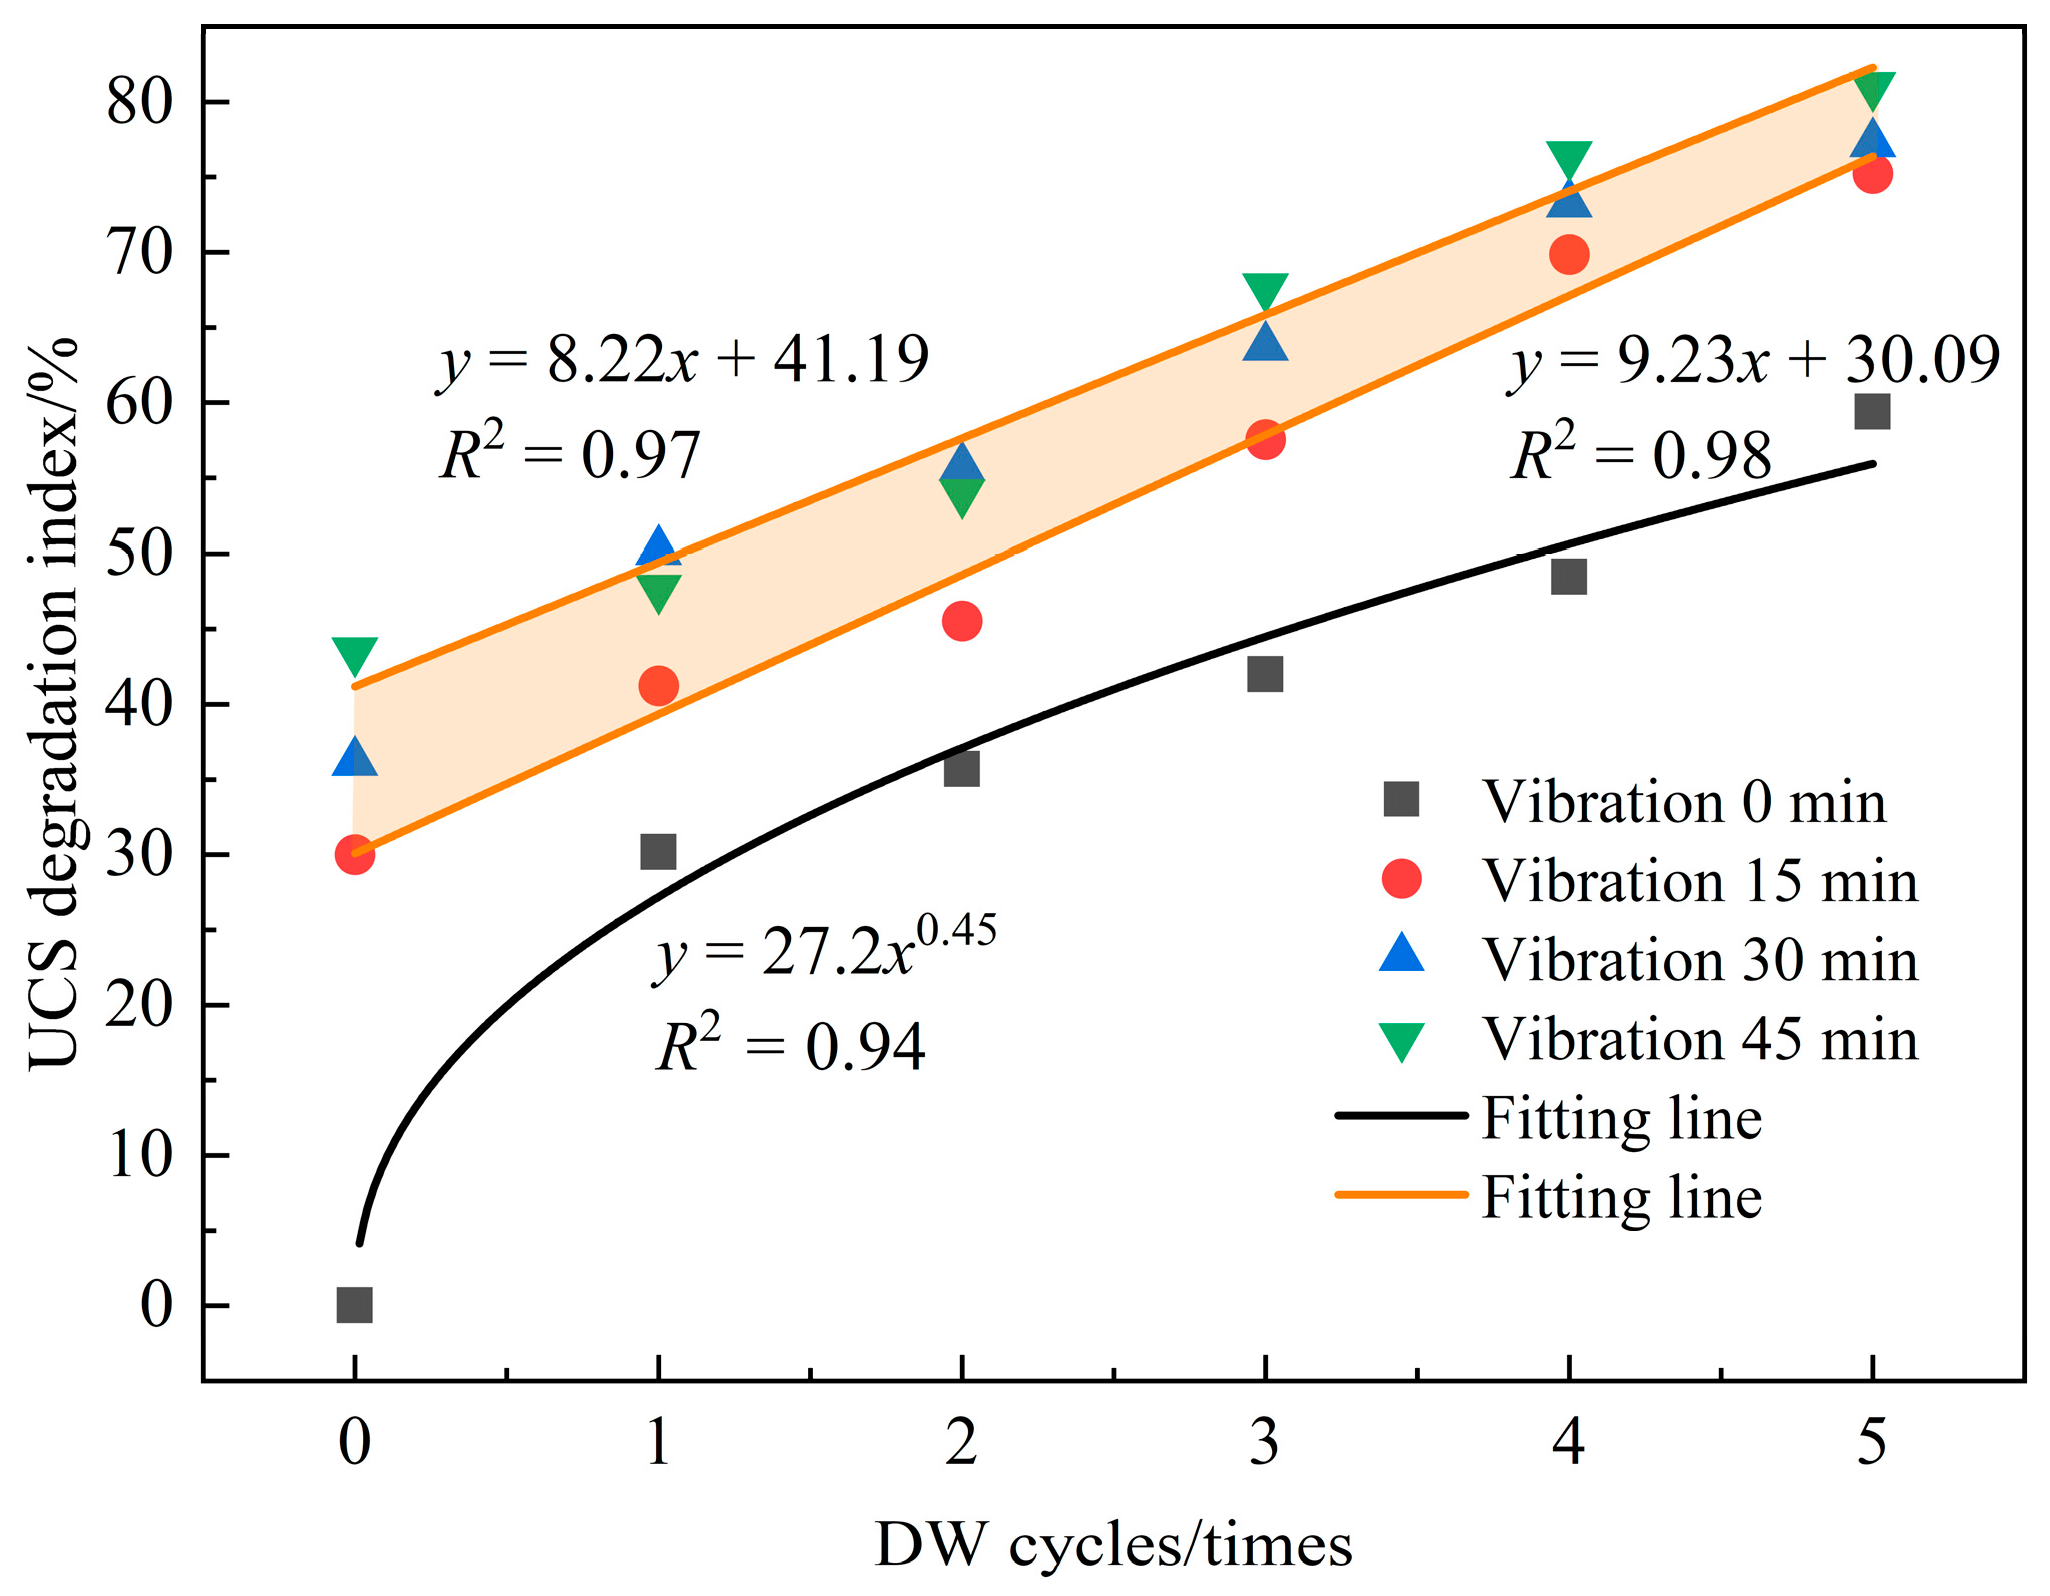
- The UCS rapidly decreased and then stabilized with the increase in the number of DW cycles and vibration time. The degradation effect of UCS due to DW cycles and vibration was significant, with a maximum degradation of 81.1%. Without vibration, the degradation of UCS increased nonlinearly with the number of DW cycles, while after experiencing vibration, the degradation of UCS increased linearly with the number of DW cycles.
- (4)
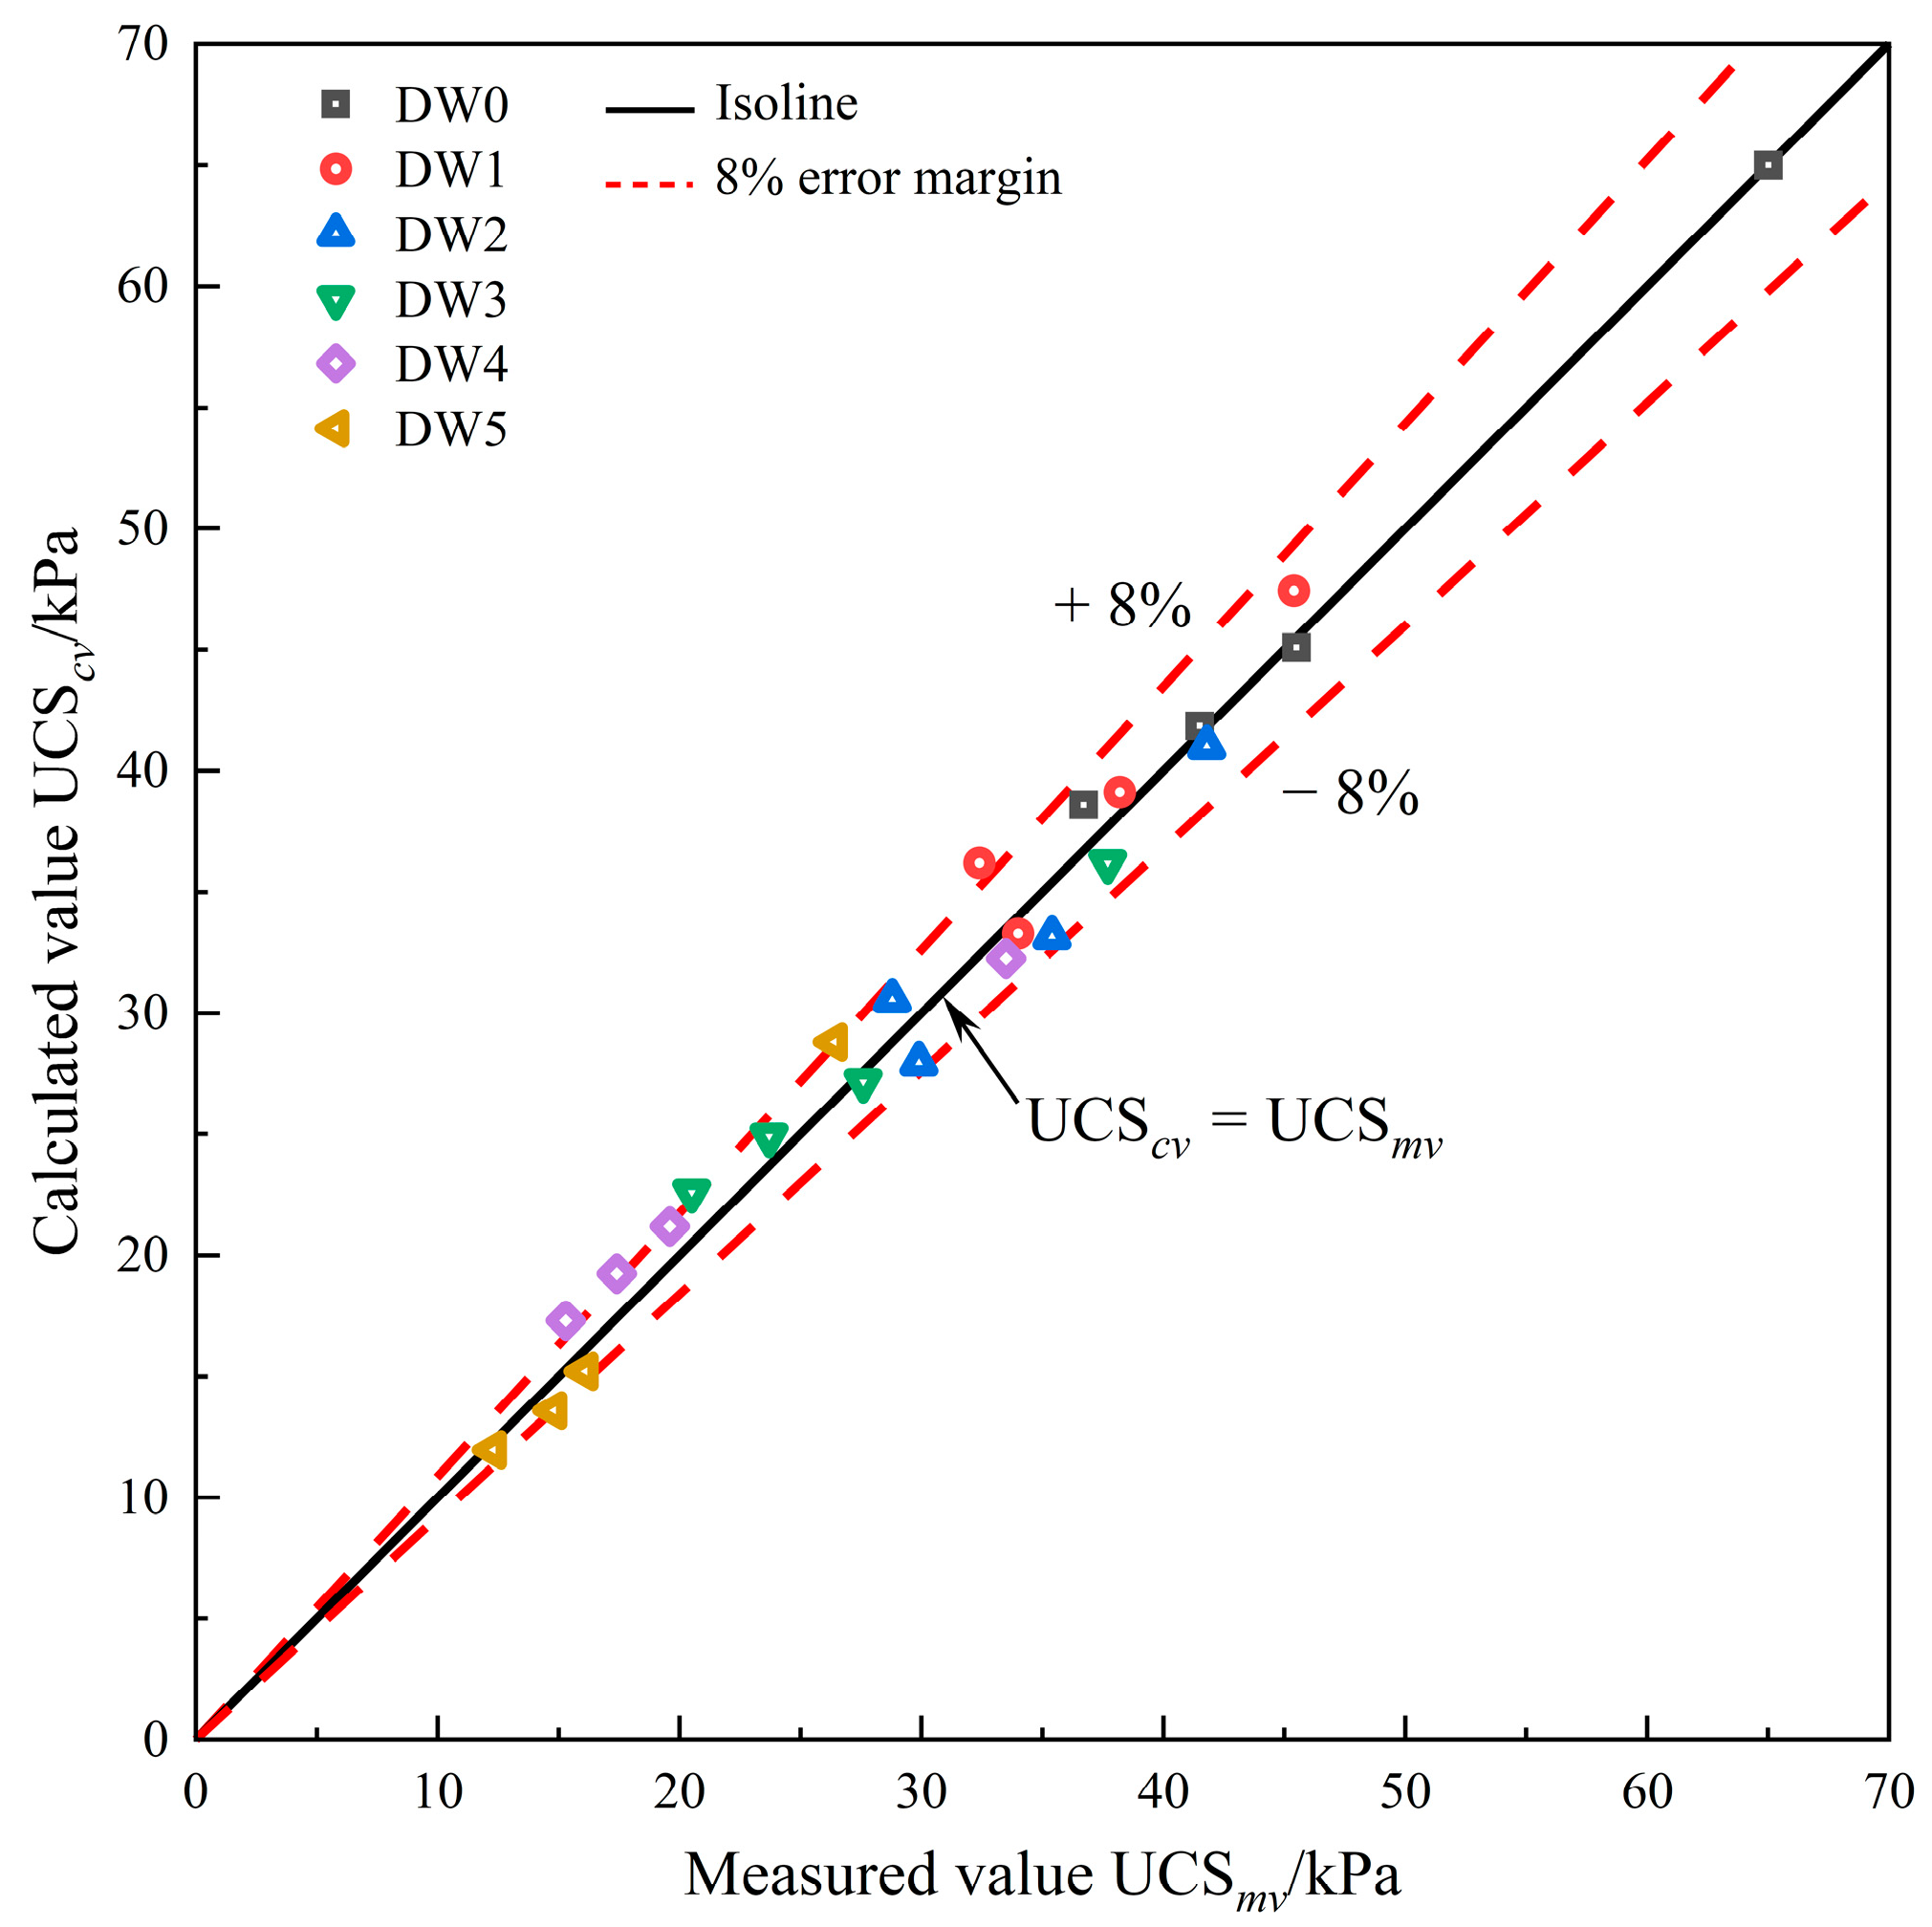
- Modified formulas considering the effects of DW cycles and vibration on shear strength and UCS were established. The calculated values of the two modified formulas were within a reasonable range of error compared to the measured values, indicating that the modified formulas can effectively predict the effects of DW cycles and vibration on shear strength and UCS.
Author Contributions
Funding
Institutional Review Board Statement
Informed Consent Statement
Data Availability Statement
Conflicts of Interest
References
- Wang, T.H.; Dai, J.; Shui, W.H. Research on the Deformation Calculation Method for Settlement of Residual Soil Foundation; China Architecture & Building Press: Beijing, China, 2011. [Google Scholar]
- Wang, G.; Zhang, X.W.; Liu, X.Y.; Xu, Y.Q.; Lu, J.F. Microscopic evolution of pore characteristics and particle orientation of granite residual soil in one-dimensional compression. Geofluids 2022, 2022, 8380656. [Google Scholar] [CrossRef]
- An, R.; Kong, L.W.; Li, C.S.; Luo, X.Q. Strength attenuation and microstructure damage of granite residual soils under hot and rainy weather. Chin. J. Rock Mech. Eng. 2020, 39, 1902–1911. [Google Scholar] [CrossRef]
- An, R.; Zhang, X.W.; Kong, L.W.; Liu, X.Y.; Chen, C. Drying-wetting impacts on granite residual soil: A multi-scale study from macroscopic to microscopic investigations. Bull. Eng. Geol. Environ. 2022, 81, 447. [Google Scholar] [CrossRef]
- Wang, H.B.; Zhou, Y.; Yu, G.; Zhou, B.; Zhang, A.-J. A triaxial test study on structural granite residual soil. Rock Soil Mech. 2021, 42, 991–1002. [Google Scholar]
- Zhou, X.W.; Liu, P.; Hu, L.M.; He, Y.B.; Zhao, S. An experimental study of shear yield characteristics of structured granite residual soil. Rock Soil Mech. 2015, 36, 157–163. [Google Scholar]
- Tang, L.S.; Sang, H.T.; Song, J.; Liu, F.T.; Yan, B.; Zhang, P.C. Research on soil particle joint function and brittle-elastoplastic cement damage model of unsaturated granite residual soil. Rock Soil Mech. 2013, 34, 2877–2888. [Google Scholar]
- An, R.; Li, C.S.; Kong, L.W.; Guo, A.-G. Effects of drilling disturbance and unloading lag on in-situ mechanical characteristics of granite residual soil. Chin. J. Geotech. Eng. 2020, 42, 109–116. [Google Scholar]
- Shu, R.J.; Kong, L.W.; Wang, J.T.; Jian, T.; Zhou, Z.-H. Mechanical behavior of granite residual soil during wetting considering effects of initial unloading. Chin. J. Geotech. Eng. 2022, 44, 154–159+165. [Google Scholar]
- Chen, D.X.; Tang, J.R.; Yang, X.F. Effects of drying-wetting cycle and fines content on hysteresis and dynamic properties of granite residual soil under cyclic loading. Appl. Sci. 2023, 13, 6660. [Google Scholar] [CrossRef]
- Yang, X.F.; Chen, D.X.; Liu, Y. Crack development and slope stability of granite residual soil under dry-wet cycles. J. Xiamen Univ. (Nat. Sci.) 2022, 61, 591–599. [Google Scholar]
- Yin, S.; Kong, L.W.; Zhang, X.W. Experimental study on stiffness characteristics of residual soil at small strain under hot and rainy climate. Chin. J. Geotech. Eng. 2017, 39, 743–751. [Google Scholar]
- Jian, W.B.; Hu, H.R.; Luo, Y.H.; Tang, W.Y. Experimental study on deterioration of granite residual soil strength in wetting-drying cycles. J. Eng. Geol. 2017, 25, 592–597. [Google Scholar]
- Yu, J.J.; Chen, D.X.; Wang, H.; Zhang, B. Analysis of the shear strength of granite residual soil and slope stability under wetting-drying cycles. J. Xiamen Univ. (Nat. Sci.) 2019, 58, 614–620. [Google Scholar]
- Liu, P.; Chen, R.P.; Wu, K.; Kang, X. Effects of drying-wetting cycles on the mechanical behavior of reconstituted granite-residual soils. J. Mater. Civ. Eng. 2020, 32, 04020199. [Google Scholar] [CrossRef]
- Liu, Y.; Chen, D.X.; Wang, H.; Yu, J.J. Response analysis of residual soil slope considering crack development under drying-wetting cycles. Rock Soil Mech. 2021, 42, 1933–1943+1982. [Google Scholar]
- An, R.; Kong, L.W.; Zhang, X.W.; Guo, A.G.; Bai, W. A multi-scale study on structure damage of granite residual soil under wetting-drying environments. Chin. J. Rock Mech. Eng. 2023, 42, 758–767. [Google Scholar]
- An, R.; Kong, L.W.; Zhang, X.W.; Guo, A.; Bai, W.; Singh, D.N. Weathering degree effects on strength indexes of residual soil based on in-situ borehole shear tests. J. Basic Sci. Eng. 2022, 30, 1275–1286. [Google Scholar]
- Hu, Q.; Xu, S.F.; Chen, R.P.; Long, R. Influence of soil disturbance on metro tunnel in soft clay due to excavation of deep foundation pit. Chin. J. Geotech. Eng. 2013, 35, 537–541. [Google Scholar]
- Shen, S.L.; Tang, C.P.; Pang, X.M. Disturbance and strength recovery of surrounding clays around soil-cement columns installed by different mixing methods. Rock Soil Mech. 2006, 1827–1830. [Google Scholar] [CrossRef]
- Chen, Y.M.; Hu, Q.; Chen, R.P. Soil disturbance by the collapse of retaining wall for a pit excavation and the induced additional settlement: A case study of Hangzhou Metro Xianghu Station. China Civ. Eng. J. 2014, 47, 110–117. [Google Scholar]
- Gomes, R.C. Effect of stress disturbance induced by construction on the seismic response of shallow bored tunnels. Comput. Geotech. 2013, 49, 338–351. [Google Scholar] [CrossRef]
- Deng, Y.F.; Liu, S.Y. Effect of sample disturbance on soft soil strength. Chin. J. Rock Mech. Eng. 2007, 1940–1944. Available online: https://kns.cnki.net/kcms2/article/abstract?v=vs6GoGUIqCObModo75s4TXHmDPfM4uDQ9oFScd7csBOcteNiO9xSxrIsTDyR0I5eW700gIdDq78nHRqKBvxl8haAhMaxJM-HDNBIRFtWZPSC0MiOC0P-AbkiljyHOGAae7m7oTDXAr8=&uniplatform=NZKPT&language=CHS (accessed on 1 December 2023).
- Chen, H.; Ma, K.S. Study on effect of moisture to strength recovery of disturbed silt. Sci. Technol. Eng. 2015, 15, 184–188. [Google Scholar]
- Bai, S.Y.; Wang, W.J.; Xie, X.Y.; Zhu, D.-L. Experimental study on HS-small model parameters of soil considering disturbance and its application in foundation pit engineering. Rock Soil Mech. 2023, 44, 206–216. [Google Scholar]
- Zhou, Y.M.; Deng, Z.W.; Fan, Z.J.; Liu, W.J. Shear strength deterioration of compacted residual soils under a wind turbine due to drying-wetting cycles and vibrations. Adv. Civ. Eng. 2021, 2021, 8628842. [Google Scholar] [CrossRef]
- Du, W.B.; Huang, B.; Wang, M.Y.; Lu, J.Z.; Zheng, Y.D. Influence of salinity on mechanical properties of marine clay and pre-consolidation test of disturbance. Yangtze River 2020, 51, 189–193. [Google Scholar]
- Liu, J.H. Study on Deformation of Granite Residual Soil Foundation Pit Considering Disturbance and Water Content Change. Master’s Thesis, Fuzhou University, Fuzhou, China, 2020. [Google Scholar]
- Liu, J.J.; Zeng, G.H.; Meng, L.S.; He, W.B. Study on the effect of disturbance on the thixotropic strength increasing of silt. Chin. J. Undergr. Space Eng. 2016, 12, 1294–1299. [Google Scholar]
- Liu, G.Y.; Yang, S.S.; Wang, Y.P.; Yu, Y. Study on effect of moisture to strength recovery of disturbed silt. Sichuan Build. Sci. 2016, 42, 51–55. [Google Scholar]
- Liu, J.M.; Qiu, Y.; Guo, T.T.; Song, W.Z.; Gu, C. Comparative experimental study on static shear strength and postcyclic strength of saturated silty clay. Rock Soil Mech. 2020, 41, 773–780. [Google Scholar]
- GB/T50123—2019; Standard for Geotechnical Testing Method. Ministry of Water Resources of the People’s Republic of China: Beijing, China, 2019.
- DBJ-15-31-2016; Design code for building foundation. Department of Housing and Urban-Rural Development of Guangdong: Beijing, China, 2016.
- Wang, Y.; Xue, Q.; Wu, Y.; Zhao, L.Y. Mechanical properties and micromechanisms of compacted clay during drying-wetting cycles. Rock Soil Mech. 2015, 36, 2815–2824. [Google Scholar]
- Tu, Y.L.; Liu, X.R.; Zhong, Z.L.; Wang, S.; Wang, Z.J.; Ke, W. Experimental study on strength and deformation characteristics of silty clay during wetting-drying cycles. Rock Soil Mech. 2017, 38, 3581–3589. [Google Scholar]


| Natural Density ρ/g·cm−3 | Water Content w/% | Dry Density ρd/g·cm−3 | Specific Gravity Gs | Liquid Limit LL/% | Plastic Limit PL/% | Plasticity Index PI/% | Void Ratio e |
|---|---|---|---|---|---|---|---|
| 2.01 | 17.4 | 1.71 | 2.72 | 31.92 | 18.83 | 13.09 | 0.58 |
| Test Name | Vibration Duration/min | DW Cycles /Times | Normal Load /kPa | Number of Specimens/pc |
|---|---|---|---|---|
| Direct shear test | 0, 15, 30, 45 | 0, 1, 2 3, 4, 5 | 100, 200 300, 400 | 288 |
| UCS test | — | 72 |
| Vibration Time/mins | Cohesion Degradation Index ξt,n/% | |||||
|---|---|---|---|---|---|---|
| DW Cycles/Times | ||||||
| 0 | 1 | 2 | 3 | 4 | 5 | |
| 0 | 0.0 | 4.5 | 10.5 | 14.8 | 30.3 | 35.9 |
| 15 | 26.2 | 33.1 | 37.9 | 40.3 | 38.8 | 42.6 |
| 30 | 39.7 | 36.6 | 40.6 | 44.8 | 44.8 | 43.1 |
| 45 | 41.4 | 36.9 | 41.4 | 42.8 | 49.1 | 58.6 |
| Vibration Time/mins | UCS Degradation Index ηt,n/% | |||||
|---|---|---|---|---|---|---|
| DW Cycles/Times | ||||||
| 0 | 1 | 2 | 3 | 4 | 5 | |
| 0 | 0.0 | 30.2 | 35.7 | 42.0 | 48.5 | 59.4 |
| 5 | 30.0 | 41.2 | 45.5 | 57.5 | 69.8 | 75.2 |
| 10 | 36.2 | 50.2 | 55.7 | 63.7 | 73.2 | 77.2 |
| 15 | 43.5 | 47.7 | 54.0 | 67.7 | 76.5 | 81.1 |
Disclaimer/Publisher’s Note: The statements, opinions and data contained in all publications are solely those of the individual author(s) and contributor(s) and not of MDPI and/or the editor(s). MDPI and/or the editor(s) disclaim responsibility for any injury to people or property resulting from any ideas, methods, instructions or products referred to in the content. |
© 2024 by the authors. Licensee MDPI, Basel, Switzerland. This article is an open access article distributed under the terms and conditions of the Creative Commons Attribution (CC BY) license (https://creativecommons.org/licenses/by/4.0/).
Share and Cite
Tang, J.; Chen, D. Effect of Drying–Wetting Cycle and Vibration on Strength Properties of Granite Residual Soil. Appl. Sci. 2024, 14, 458. https://doi.org/10.3390/app14010458
Tang J, Chen D. Effect of Drying–Wetting Cycle and Vibration on Strength Properties of Granite Residual Soil. Applied Sciences. 2024; 14(1):458. https://doi.org/10.3390/app14010458
Chicago/Turabian StyleTang, Jiarun, and Dongxia Chen. 2024. "Effect of Drying–Wetting Cycle and Vibration on Strength Properties of Granite Residual Soil" Applied Sciences 14, no. 1: 458. https://doi.org/10.3390/app14010458
APA StyleTang, J., & Chen, D. (2024). Effect of Drying–Wetting Cycle and Vibration on Strength Properties of Granite Residual Soil. Applied Sciences, 14(1), 458. https://doi.org/10.3390/app14010458