Article

Vision-Based Hand Rotation Recognition Technique with Ground-Truth Dataset

1
Department of ICT Industrial Engineering, Dong-eui University, Busan 47340, Republic of Korea
2
Department of Artificial Intelligence Engineering, Dong-eui University, Busan 47340, Republic of Korea
*
Author to whom correspondence should be addressed.
Appl. Sci. 2024, 14(1), 422; https://doi.org/10.3390/app14010422
Submission received: 12 November 2023 / Revised: 18 December 2023 / Accepted: 21 December 2023 / Published: 3 January 2024
(This article belongs to the Special Issue 2nd Edition: Mobile Health Interventions)

Abstract

:
The existing question-and-answer screening test has a limitation in that test accuracy varies due to a high learning effect and based on the inspector’s competency, which can have consequences for rapid-onset cognitive-related diseases. To solve this problem, a behavioral-data-based screening test is necessary, and there are various types of tasks that can be adopted from previous studies, or new ones can be explored. In this study, we came up with a continuous hand movement, developed a behavioral measurement technology, and conducted validity verification. As a result of analyzing factors that hinder measurement accuracy, this measurement technology used a web camera to measure behavioral data of hand movements in order to lower psychological barriers and to pose no physical risk to subjects. The measured hand motion is a hand rotation that repeatedly performs an action in which the bottom of the hand is seen in front. The number of rotations, rotation angle, and rotation time generated by the hand rotation are derived as measurements; and for calculation, we performed hand recognition (MediaPipe), joint data detection, motion recognition, and motion analysis. To establish the validity of the derived measurements, we conducted a verification experiment by constructing our own ground-truth dataset. The dataset was developed using a robot arm with two-axis degrees of freedom and that quantitatively controls the number, time, and angle of rotations. The dataset includes 540 data points comprising 30 right- and left-handed tasks performed three times each at distances of 57, 77, and 97 cm from the camera. Thus, the accuracy of the number of rotations is 99.21%, the accuracy of the rotation angle is 91.90%, and the accuracy of the rotation time is 68.53%, making the overall rotation measurements more than 90% accurate for input data at 30 FPS for measuring the rotation time. This study is significant in that it not only contributes to the development of technology that can measure new behavioral data in health care but also shares image data and label values that perform quantitative hand movements in the image processing field.

1. Introduction

A growing body of evidence shows substantial increases in diseases related to cognitive ability, such as mild cognitive impairment and dementia [1,2]. Because there is currently no cure for cognitive-related diseases, the best solution is to manage them with continuous treatment and monitoring based on early detection. The first step is regular cognitive screening to determine whether the patient needs subsequent clinical examination for further neuropsychological testing [3]. However, commonly used tests such as MMSE have several problems, including long retest duration resulting from a strong learning effect [4,5,6]. Moreover, these tests have been repeatedly shown to be related to educational attainment [7,8,9], with results decreasing as age increases [10,11,12]; they are also affected by social class and socioeconomic status [12,13,14].
In the case of rapidly progressive dementia, a single misdiagnosis can lead to fatal consequences for the patient [15]. Preemptive solutions whereby people can easily test themselves to see whether they need serious tests are helpful. To solve this problem, several researchers have developed cognitive ability measurement technology based on behavioral data that can be assessed without a heavily trained professional and that also often has lower learning effects [16,17]. However, these methods also have shortcomings. For example, gait tracking data require a large space because there is a risk of patient accidents, such as falls [18,19,20]. However, existing cognitive testing studies using hand movements [21,22,23] have limitations in quantitatively collecting and managing patient condition data because the tester qualitatively judges the accuracy of hand movements. Additionally, in one study that measured hand behaviors using virtual devices [24,25], psychological barriers arose from using unfamiliar devices.
Our goal is to devise biometric behavioral measures that can be systematically captured and that reduce spatial constraints, have a lower learning curve, reduce subjects’ accident risk, have fewer instructions, require less equipment, and be less physically invasive. To be clear, we are not attempting to replace clinical testing, but we hope to come up with a screening method that is measured through a digital system. During this research, we selected a continuous wrist-rotating movement, defined its measurement through a common webcam device, and conducted an experiment with a dataset with a robot arm capable of precise control. As wrist-rotating movement is a continuous behavior, it is hard to make a person rotate at a certain speed or angle. Therefore, we have constructed a ground-truth dataset using a robot. After defining the hand gesture recognition methodology for rotation, we assigned various tasks to the dataset: defining 30 types of different rotation setting to mimic human movements; and we tested the accuracy of our algorithm to calculate the rotation movements. We calculated the prediction accuracy and tested the feasibility of the tasks.

2. Related Works

2.1. Cognitive Ability Assessment Based on Behavior Data

There is a strong body of recent research on cognitive function measurement based on behavioral data such as gait cycles and hand movements. To measure cognitive function based on gait data, a gait is divided into gait cycles [18,20], for which normal walking [26] and walking faster than usual are measurement targets [19]. In each study, researchers calculated various temporal and spatial variables calculated based on the measured motion data and conducted a correlation analysis of cognitive functioning. In the case of measurement research based on hand movement data, studies were conducted on imitations of static [21,22] and dynamic gestures [23] for one or both hands and on daily life performance abilities [24]. Research based on hand movement data is broadly divided into studies examining hand movement imitation and rule-based performance measurement. The measured movements used in hand movement imitation research are divided into simple hand movements using one hand and complex hand movements using both hands, depending on their complexity. Previous studies measured the imitation ability of static movements using either one or both hands. Measurements have been made, and recently, research has been conducted on the imitation of hand movements that are both static and dynamic [23] or do not have the same meaning [27]. Most hand movement imitation studies have measured accuracy based on the examiner’s subjective judgment, and Negin et al. developed a deep learning algorithm to measure the accuracy of subjects’ imitation movements [23]. The movements performed by the subjects are one-handed movements and two-handed movements. When making a movement using one hand, a representative movement outlines the shape of a fox [21,22], and in some movements, only specific fingers are opened while a fist is clenched. For example, patients are asked to spread their index and middle fingers to form a V-shape [22]. In the case of movements that require the use of both hands, one representative movement symbolizes a pigeon, and the performed movements involve the fingers of each hand coming into contact. One simple example is touching the tips of the index and ring fingers of both hands together [27]. In the case of rule-based performance measurement, variables used in studies related to performance in daily life include measurement of completion time for hand movements such as “putting on and buttoning a shirt correctly” [28] and on participants completing tasks correctly within a set time. We calculated the ’ability measure’—a score based on the number of attempts and the percentage of attempts in which the patient correctly performed the task [25]—and a measure of the subject’s hand movement performance ability [24] through measurements of hand movement trajectory, hand movement speed, and task completion [24]. In this study, the ability measure corresponds to rule-based performance measurement, and we derived the number of rotations, rotation angle, and rotation time from the presented motion (see Section 4.1.1).

2.2. Behavioral Data Measurement Technologies

Behavioral data measurement movements fall broadly into two types: walking and hand movements. For the walking behavioral data measurement technology, we developed a three-axis acceleration sensor as a wearable device [15] for the subject’s nondominant hand, and we conducted an experiment to collect data on the subject’s walking speed, stride length, and stride length variability. Uitto (2021) used a markless motion-capture system (Kinect 2.0) to target the measurement index for the degree of joint bending through collection and calculation of skeleton landmarks. The GAITRite system is a professional gait analysis device [29]. The GAITRite mat has a length of 4.88 m and a width of 0.69 m, leaving 1.5 spaces at the front and rear of the mat to allow the subject to walk, and 1 cm sensors are arranged vertically every 1.27 cm. It is possible to collect measurement indicators such as step time and cycle time. Hand-movement–based behavioral data measurement technology mainly uses two types of measurement devices. In the case of imitation-based movement, Negin et al. (2018) collected the position and shape information of the subject’s hand using a motion capture system (Kinect 2.0) and then calculated accuracy through a deep learning model and measured rule-based performance. In the case of using everyday activities, researchers evaluated the subject’s performance in a virtual experimental environment using a virtual reality device [24,25]. Measurement of behavioral data with virtual reality devices posed difficulties in collecting accurate measurement indicators because of the psychological effects of using unfamiliar new technology. Therefore, our focus is to develop measurement technology that uses a web camera, which is less invasive. For image-based detection of hand movements, previous research mostly focused on detecting static poses, such as sign language [30], or was based on finger detection, such as finger-tapping movement [31]. For hand rotation movement, detection is more challenging, as we need to detect the whole hand, and the movement includes changes in the depth of the hand from the camera’s perspective.

2.3. Image-Processing-Based Hand Recognition
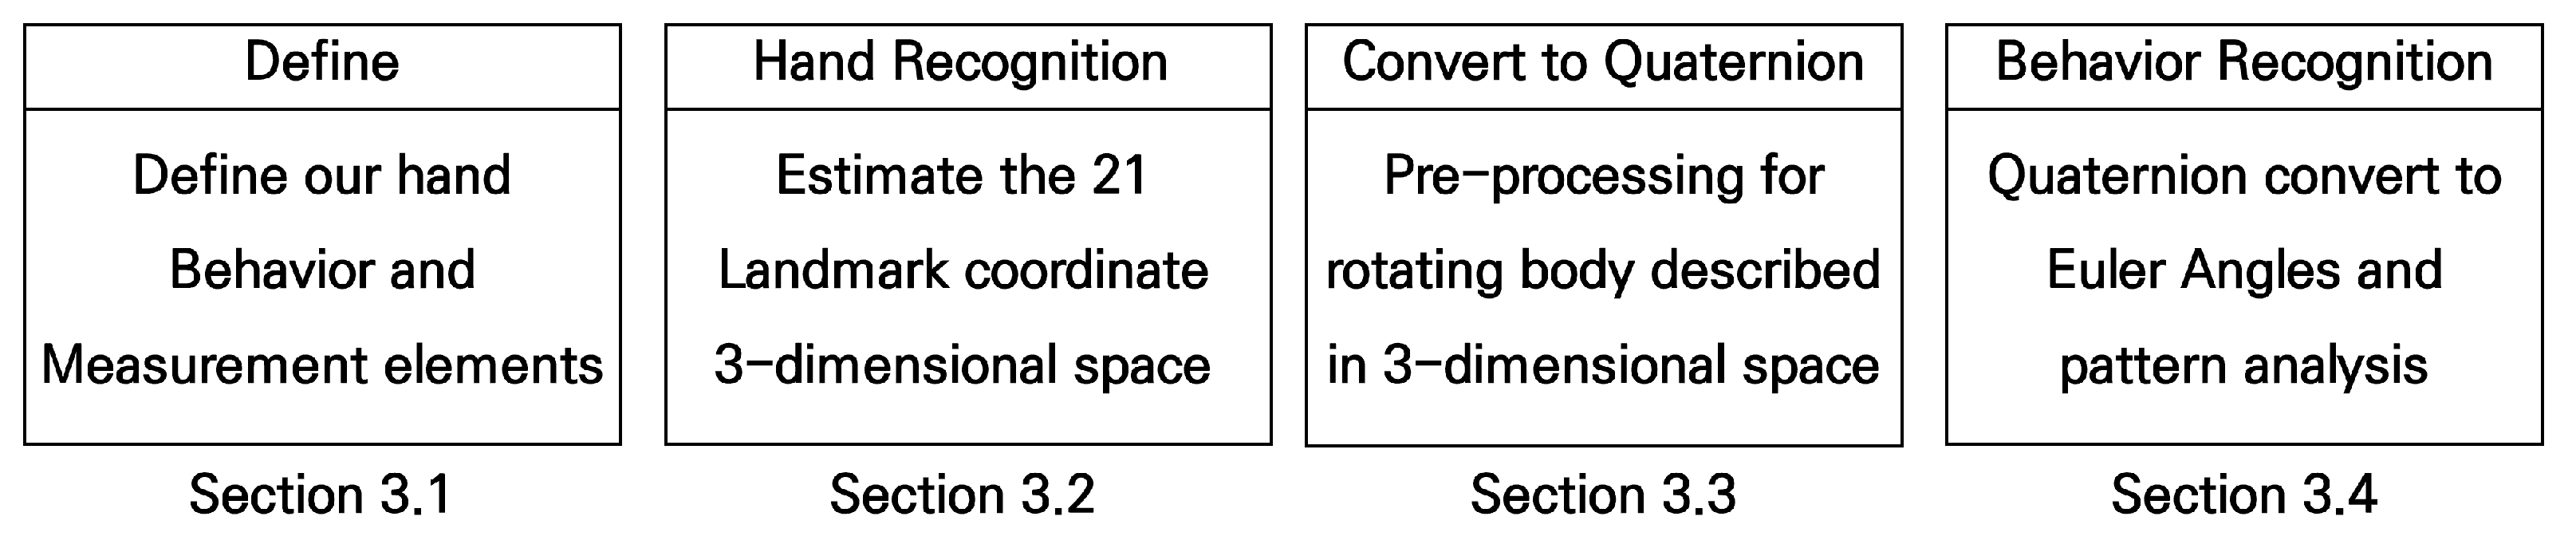
Recognizing dynamic hand movements in three dimensions is a difficult task in the field of CV. In general, studies [32,33,34,35] have been conducted on hand tracking recognition using CNN-based prediction models, and Zhang et al. (2020) uses a single RGB camera to derive 2.5-dimensional coordinates with excellent performance [35]. However, in the case of dynamic hand movements, it is important to be aware of the relationship to the previous frame after tracking. Watanabe et al. (2023) solved this relationship problem with a hybrid deep learning model that tracks dynamic hand movements while writing letters and numbers in the air, saves the movements as images, and classifies the images according to a hybrid model based on CNN and BiLSTM to create a prediction system [36]. In this study, rotation information based on the z-axis must be derived in three dimensions rather than in the two-dimensional (x–y) plane of the hand, so a representative rotating body vector that can represent the rotation of the hand was selected and then rotated. The relationship according to each change was calculated according to pattern analysis.

3. Methods

In this work, we propose a wrist rotation recognition system for which the architecture is presented in Figure 1. First, the system must recognize hands captured by the web camera. Using a MediaPipe hand model on the video streams, we detected hand joints on each video frame. For each hand, we detected 21 joints, and the joint coordinates had three-dimensional data (x, y, z). Next, we defined the rotating body representing hand rotation as a position vector from the wrist to the tip of the thumb. The next step was to convert the rotating body position vector to quaternion [37]. This is a data preprocessing step that made it possible to measure the rotation of the three dimensions. Finally, the system calculates from unit quaternion to Euler angles to indicate the change in the angle of the rotating body, and the determined change angles α , β and γ are returned. After that, using this γ of calculation values and the motion pattern analysis algorithm, the system conducts motion analysis and derives hand behavior data such as number, angle, and time of rotations. We explain each specific step taken in this study in the following subsections. The full dataset with the settings as labels and videos is posted online (link: https://bit.ly/47sO8wz (accessed on 20 December 2023)).

3.1. Defining Hand Behavior and Measurement Elements

In this study, the target measurement behavior was hand rotation. To capture the rotation movements, we needed to define how they could be captured and interpreted imagistically. From the camera’s view, if a person first shows his/her palm to the camera, one rotation consists of flipping his/her hands to show the back of his/her hands and then flipping them back to show his/her palms. More specifically, the axis of hand rotation can be a normal vector of the x–y-plane passing through the wrist, and the rotating body can be a position vector from the wrist to the tip of the thumb. This simple hand rotation is shown in Figure 2. It is an exemplary hand rotation with a rotation of 1 and a rotation angle of 360° captured through 30 frames. The three stages of hand rotation are increase, keeping, and decrease, and depend on the state of rotation angle change. The total rotational momentum is the sum of the increase in the rotation angle of the rotating body and the decrease in the rotating angle of the rotating body, and the unit is degrees. We used these to calculate the angle of rotation as the sum of the change angles of the increasing state and the decreasing state, and the time of rotation is the sum of the number of frames of all states. Because the input video was unified at 30 FPS, each frame was approximately 0.03 s.

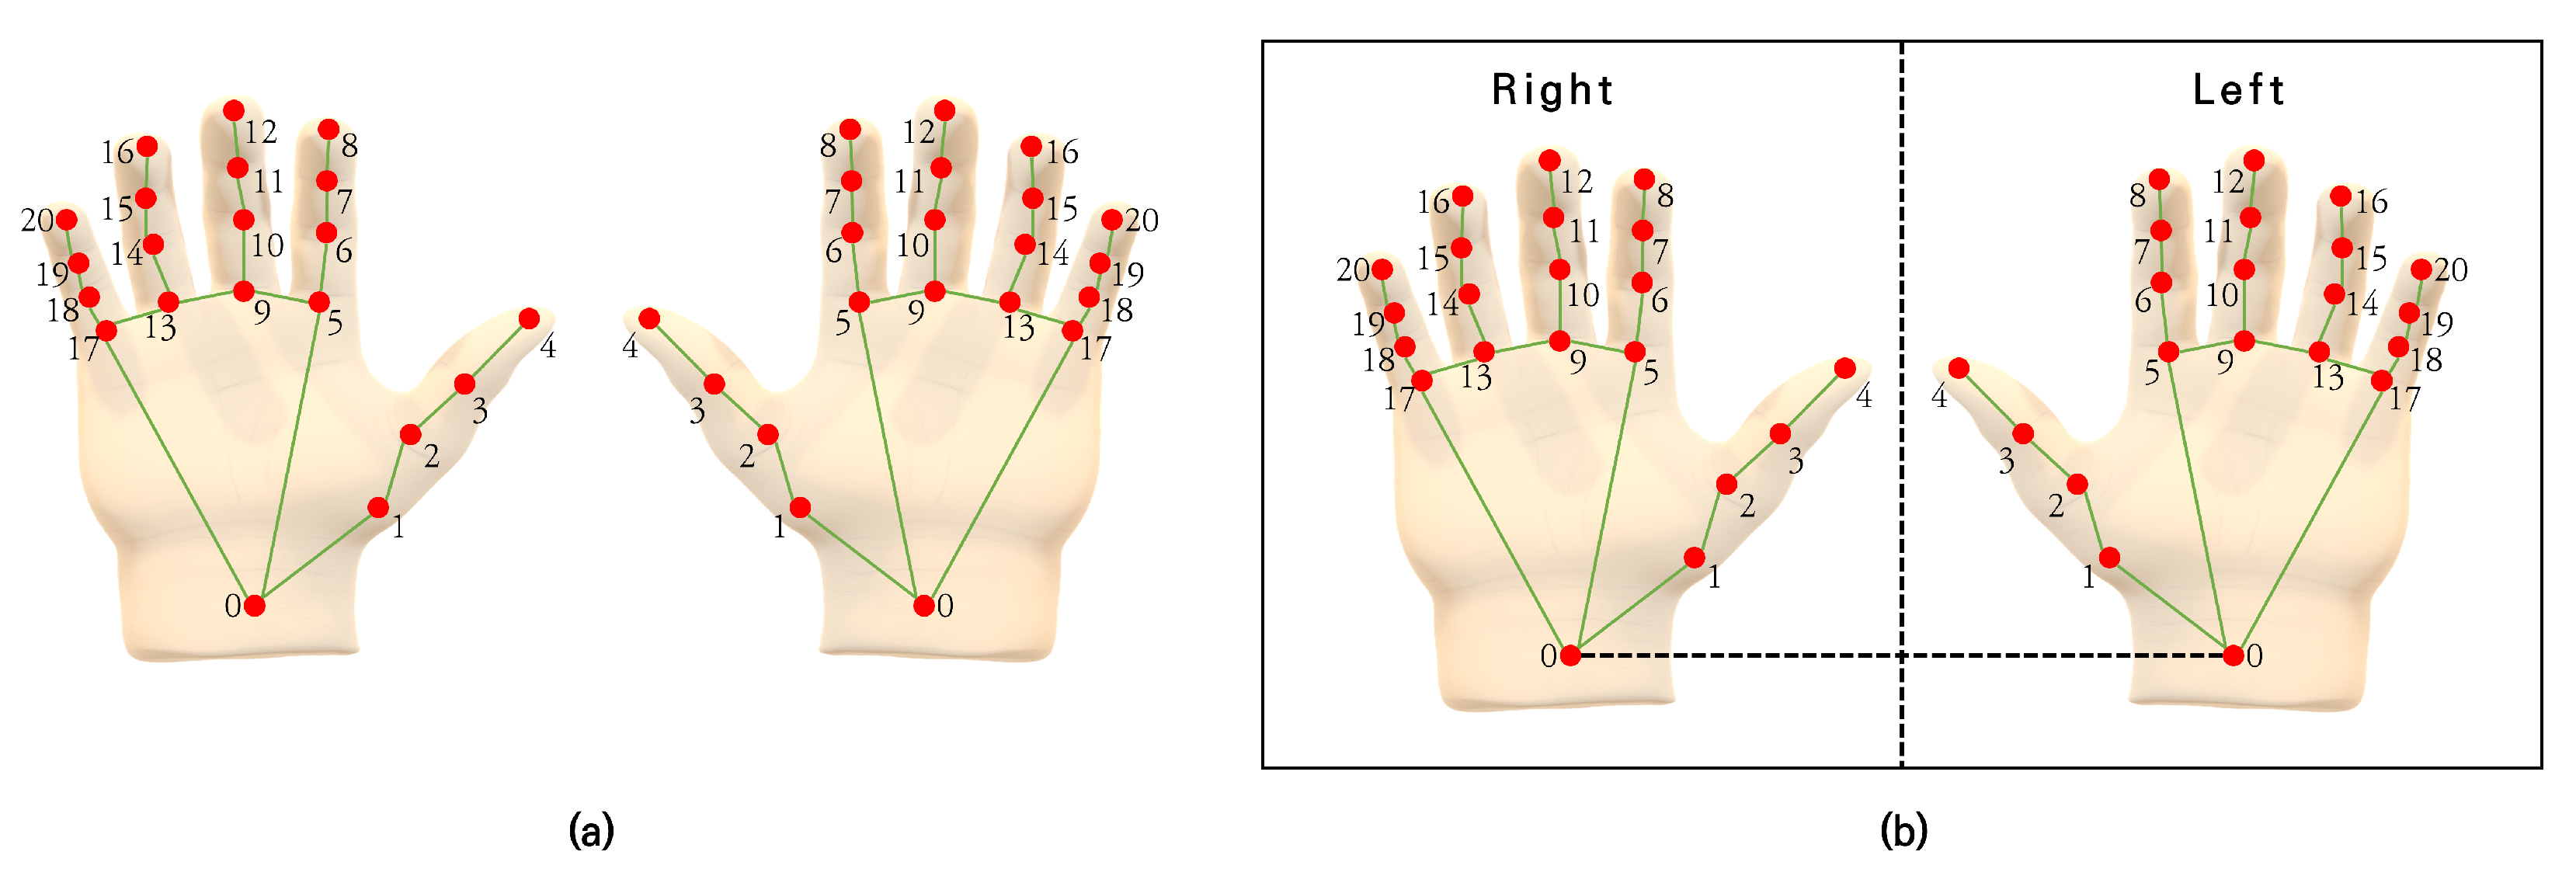
3.2. Hand Recognition

We used a MediaPipe hand model [35] for hand recognition and hand skeleton coordinate estimation. The MediaPipe hand model is an API proposed by Google for real-time hand tracking and joint coordinate estimation. A simple output example of the MediaPipe hand model is shown in Figure 3a. In detail, we ran the model with an ML pipeline in which two models (a palm detector and a hand landmark model) worked together. After the ML pipeline is run, the model has three outputs: 21 hand landmarks, a hand flag indicating probability, and a binary classification of handedness. We needed estimated landmarks for three-dimensional hand data (i.e., x, y, and relative depth) and binary classification, but we used only the landmarks because the hand rotations function caused many self-occlusions and blurring that affected error classification. Therefore, when we detected two hands in the input image, the x-coordinate of the center point of both hands’ landmark 0 was obtained using Equation (1). After that, the x-coordinate value of landmark 0 and the center x-coordinate value were compared, and the x-coordinate value of landmark 0 was classified as ’left hand’ when the x-coordinate value of landmark 0 was large and ’right hand’ when it was small, as shown in Figure 3b.
c e n t e r x = m i n l a n d m a r k 0 x + f i r s t l a n d m a r k 0 x s e c o n d l a n d m a r k 0 x 2   m i n l a n d m a r k 0 x = M i n ( f i r s t l a n d m a r k 0 x , s e c o n d l a n d m a r k 0 x )

3.3. Converting to Quaternion

This section explains the preprocessing step to convert the detected coordinate values into calculable data. First, the wrist to the tip of the thumb on the rotating body was a position vector that used landmark 0 and landmark 4 within the estimated landmarks. Next, we converted to unit quaternions for rotation in a 3-dimensional space. We defined a quaternion q H as a summation of both real and imaginary numbers, as in Equation (2).
q = w + i x + i y + k z
where the components of the 4-tuple are w , x , y , z R and three imaginary numbers i , j , k S 3 , V are required, as in Equation (3). Also, when w = 0 , it is called a pure quaternion, which corresponds to a vector in a 3-dimensional space.
i 2 = j 2 = k 2 = i j k = 1

3.4. Behavior Recognition

3.4.1. Quaternion to Euler Angles

We converted the quaternion to Euler angles to check the amount of change in the rotating body, as shown in Equation (4).
α = atan 2 ( 2 ( q w q x q y q z ) / s , ( 1 2 ( q x 2 + q y 2 ) ) / s ) β = asin ( 2 ( q x q z + q w q y ) ) γ = atan 2 ( 2 ( q w q z q x q y ) / s , ( 1 2 ( q y 2 + q z 2 ) ) / s ) s = 2 ( q x q z + q w q y )
The rotation angles are α , β , and γ with respect to each of the x-, y-, and z-axes. Next, we constructed continuous data by calculating the Euler angles on the rotating bodies of both hands in all frames of the input images and stored the values in the system.

3.4.2. Pattern Analysis

In this system, behavior was recognized by analyzing patterns of γ within the continuous data. As mentioned in Section 3.1, hand rotation falls into three stages: increase, keeping, and decrease. Accordingly, we used our pattern-analysis algorithm to find the inflection points of γ and compared the gradient signs to find those three states in this continuous data. Our algorithm consists of five stages, as shown in Figure 4.
  • Input the continuous data: γ of both hands within the continuous data
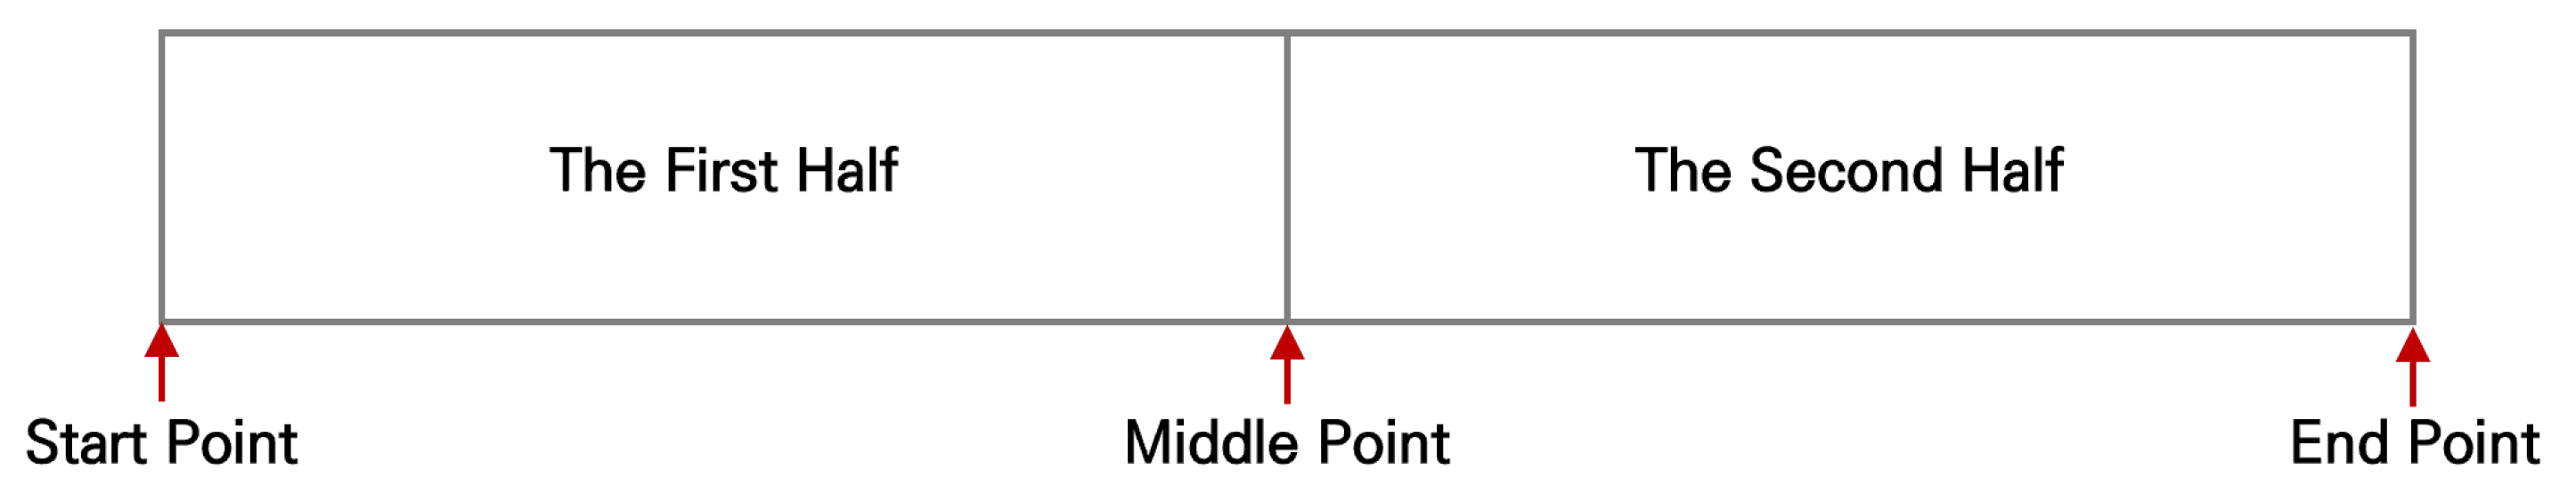
  • Slice data: Clip shape as in Figure 5 and set the initial values of the start point, middle point, and end point to 1, 5, and 10, respectively.
  • Calculate gradient: Calculate gradient values for the first half and the second half. If the absolute value of the gradient is less than 0.1, treat it as 0.
  • Compare gradient: Gradient sign compared between the first half and second half
    (a)
    First half gradient = 0: Add 5 to every point and return to process 2.
    (b)
    Equivalence: Add 5 to Middle point and End Point and return to process 2.
    (c)
    Difference: Go to process 5.
  • Output: If the sign is minus, the rotation is in the decrease state, whereas if the sign is plus, the rotation is in the increase state. Angle and time of state are calculated by Equations (5) and (6), respectively.
| F i r s t h a l f m a x |   +   | F i r s t h a l f m i n |
E n d p o i n t F r a m e S t a r t p o i n t F r a m e
Repeat the process explained in Section 3.4.2 until the endpoint becomes the last frame of the input video. Our proposed system measures a pair of decreasing and increasing states in hand rotation. Additionally, the angle and time of hand rotation are the sums of the angles and times, respectively, for each state.

4. Experiment

We conducted an experiment to evaluate the performance of our suggested method to capture hand rotation. To obtain performance evaluation and refraction correction values while taking into consideration camera refraction, the experiment imposed different distances between the camera and the experimental robot. The selection criteria for the distances was: 57 cm based on the minimum distance at which both hands can stably enter the camera angle, 77 cm with the left and right hands of the experimental robot on the same line on the three-division baseline, and 97 cm with both hands of the experimental robot at the center when we divided the input image into nine division grid cells. Because the purpose of the experiment was to measure the accuracy of the behavioral data measurement index, we established the following hypotheses for variables that may occur during hand rotation. The situations in which the hypotheses occur comprised 30 tasks, as shown in Table 1.
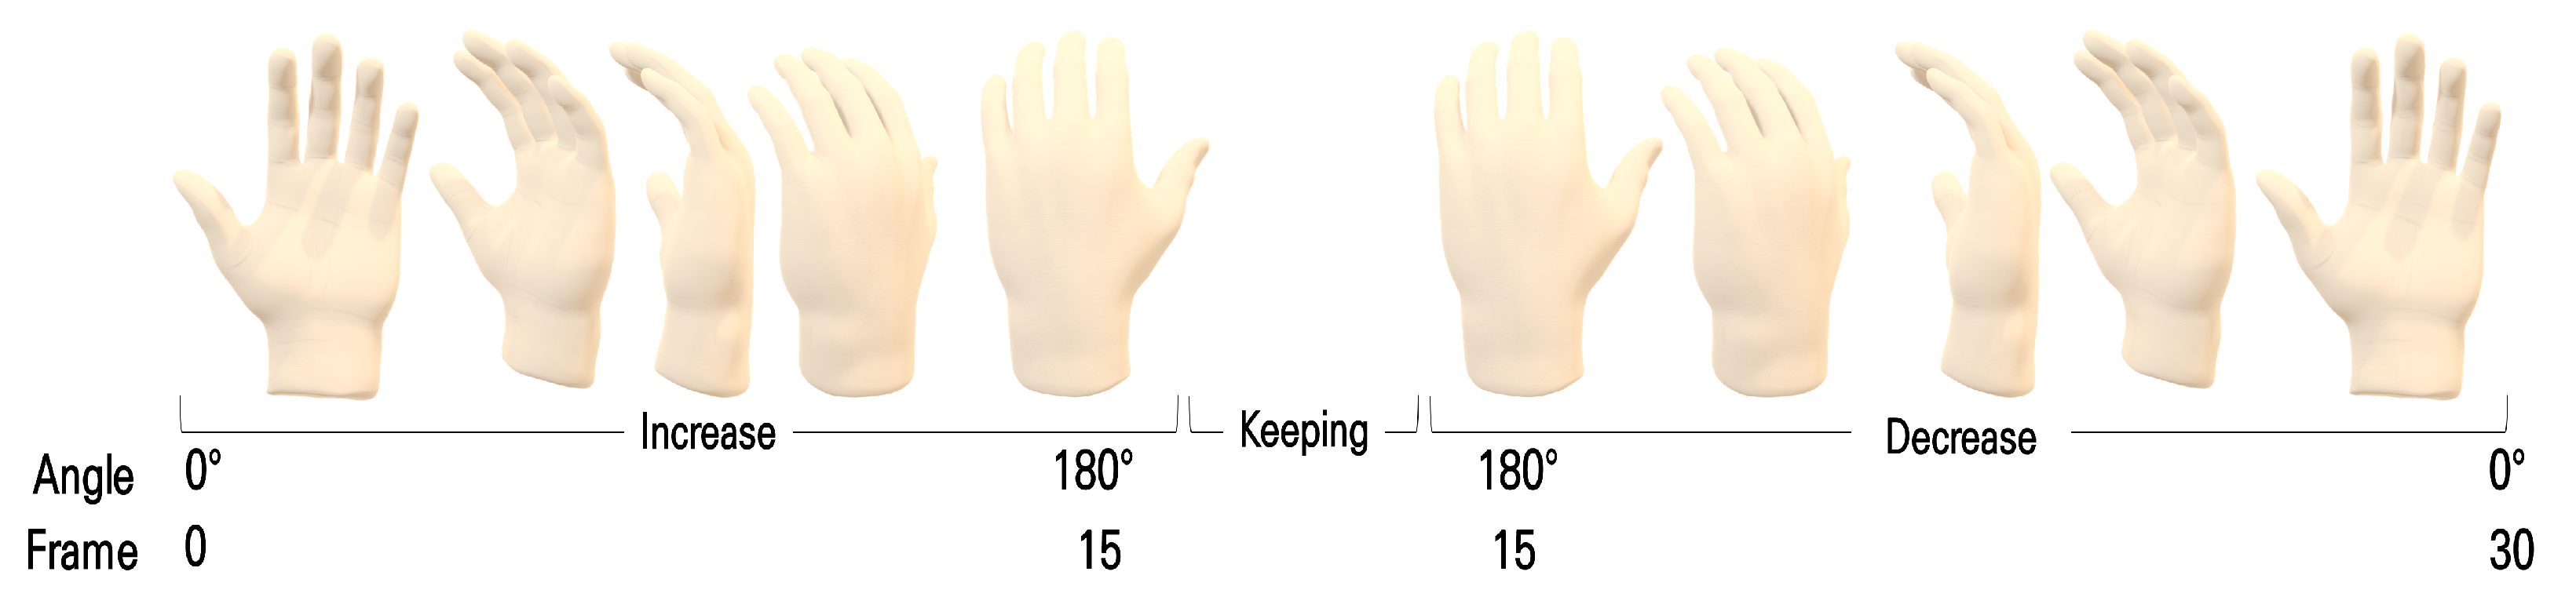
  • Human-to-human hand rotation angle difference.
  • Changes over time between rotations while performing rotational actions.
  • Change in rotational speed while performing rotational action.
  • Rotation angle change while performing rotational action.
  • Synchronization changes between both hands during rotation, e.g., increasingly, synchronization between both hands is wrong.
In order to carry out the five hypotheses listed above, we constructed the variables shown in Table 1 as the following: angle of rotation, number of rotations, time between rotations (TBR), time of keeping state (TOK), time of rotation change amount (TCA), and angle of rotation change amount (ACA). To describe each variable in detail, the angle of rotation and number of rotations represent the angle or number of rotations performed by the robot arm, as indicated by the variable name. TBR and TOK are variables representing the retention time of the rotation between each rotation time in milliseconds. For example, if there is a three-rotation 50 TBR, the time between the first and second rotations is 50 ms, the time between the second and third rotations is 100 ms, and the time between the rotations is equal to TBR. TOK is applied to the keeping state described in Section 3.1 with the same principle. Finally, TCA and ACA also form an equal sequence in units of TCA and ACA. TCA represents the amount of change in the total time it takes to perform one rotation. Simply put, if TCA is negative, the rotational speed increases as the number of rotations increases, and in the case of a positive number, rotational speed decreases. ACA represents a unit of rotation angle change, and in the case of negative numbers, as the number of rotations increases, the rotation angle performed by the robot arm becomes smaller, and in the case of positive numbers, the rotation angle becomes wider and wider.
We derived the average by performing 30 tasks three times each. We measured the right hand and left hand for the designated task execution rotation time, average rotation angle, and total hand rotation speed. We used the mean absolute percentage error (MAPE) to verify the accuracy of the measurement index, as depicted by Equation (7). A t is the actual value performed by the experimental robot arm, F t is the value predicted by the system proposed in this paper, and MAPE expresses the accuracy of the value predicted by the system as a ratio, so it was used to calculate the performance accuracy of this system because it can intuitively check and compare the accuracy of measurement elements with different units:
M A P E = 100 n t = 1 n A t F t A t A c c u r a c y = 100 M A P E
In addition, correction processing for refraction according to the internal parameters of the camera is required. As a simple explanation of camera refraction, an object appears large when the distance between the camera and the object is small, which means that because the object appears large, it seems to have less mobility in the image; and if the distance is far, an object appears relatively small in the image, so the same movement that occurred in the previous case would look small. Because this is fatal to the indicators for measuring the angle of hand rotations, we applied a correction constant according to the camera distance. We extracted the camera distance correction constant using the distance between the robot arm and the camera 57 cm 180° hand rotation image; and the correction constant 0.018319779725, which is added as the distance between the robot arm and the camera, increases by 1 cm at 57 cm using the difference between the value extracted using the 180° hand rotation image. We extracted the basic constant using the distance between the robot arm and the camera, and the angle of rotation measurement index was refracted according to distance, as shown as follows in Equation (8).
A n g l e o f r o t a t i o n = ( D i s t a n c e 57 ) × 0.018319779725 + 0.28953692
We use SPSS for statistical analysis on a computer with an Intel(R) Core(TM) i7-11700 KF processor, 128 GB RAM, an ABKO QHD 1944P webcam as the video input device, and Windows 10 Education 64-bit. The specific specifications of the web camera used in the experiment are: five resolutions enabled (QHD (2592 × 1944 pixels), 2K (2048 × 1536), FHD (1920 × 1080), HD (1280 × 730), and SD (640 × 480)); pixels with five megapixels, 80° field of view; 30 fps framerate; and a glass lens.
The tasks were constructed to implement the aforementioned movements from Section 4 using the experimental robot arm. The first hypothesis implementation of Section 4 corresponds to Task 1 to Task 6, and only the value of the angle of rotation variable changes. The second hypothesis corresponds to Task 7 to Task 12, and the value of the angle of rotation variable and the value of the TOK variable change according to the task number. The third hypothesis corresponds to Task 13 to Task 18, and the value of the angle of rotation variable and the value of the TCA variable change according to the task number. The fourth hypothesis corresponds to Task 19 to Task 24, and the value of the angle of rotation variable and the value of the ACA variable change according to the task number. In the previous four hypotheses, both hands of the experimental robot arm receive the same variable values and act in synchronization, while in order to implement the fifth hypothesis, all other variable values except for the angle of rotation were implemented differently from Task 25 to Task 30. The changes to the variables according to the task number can be easily confirmed in Figure 6.

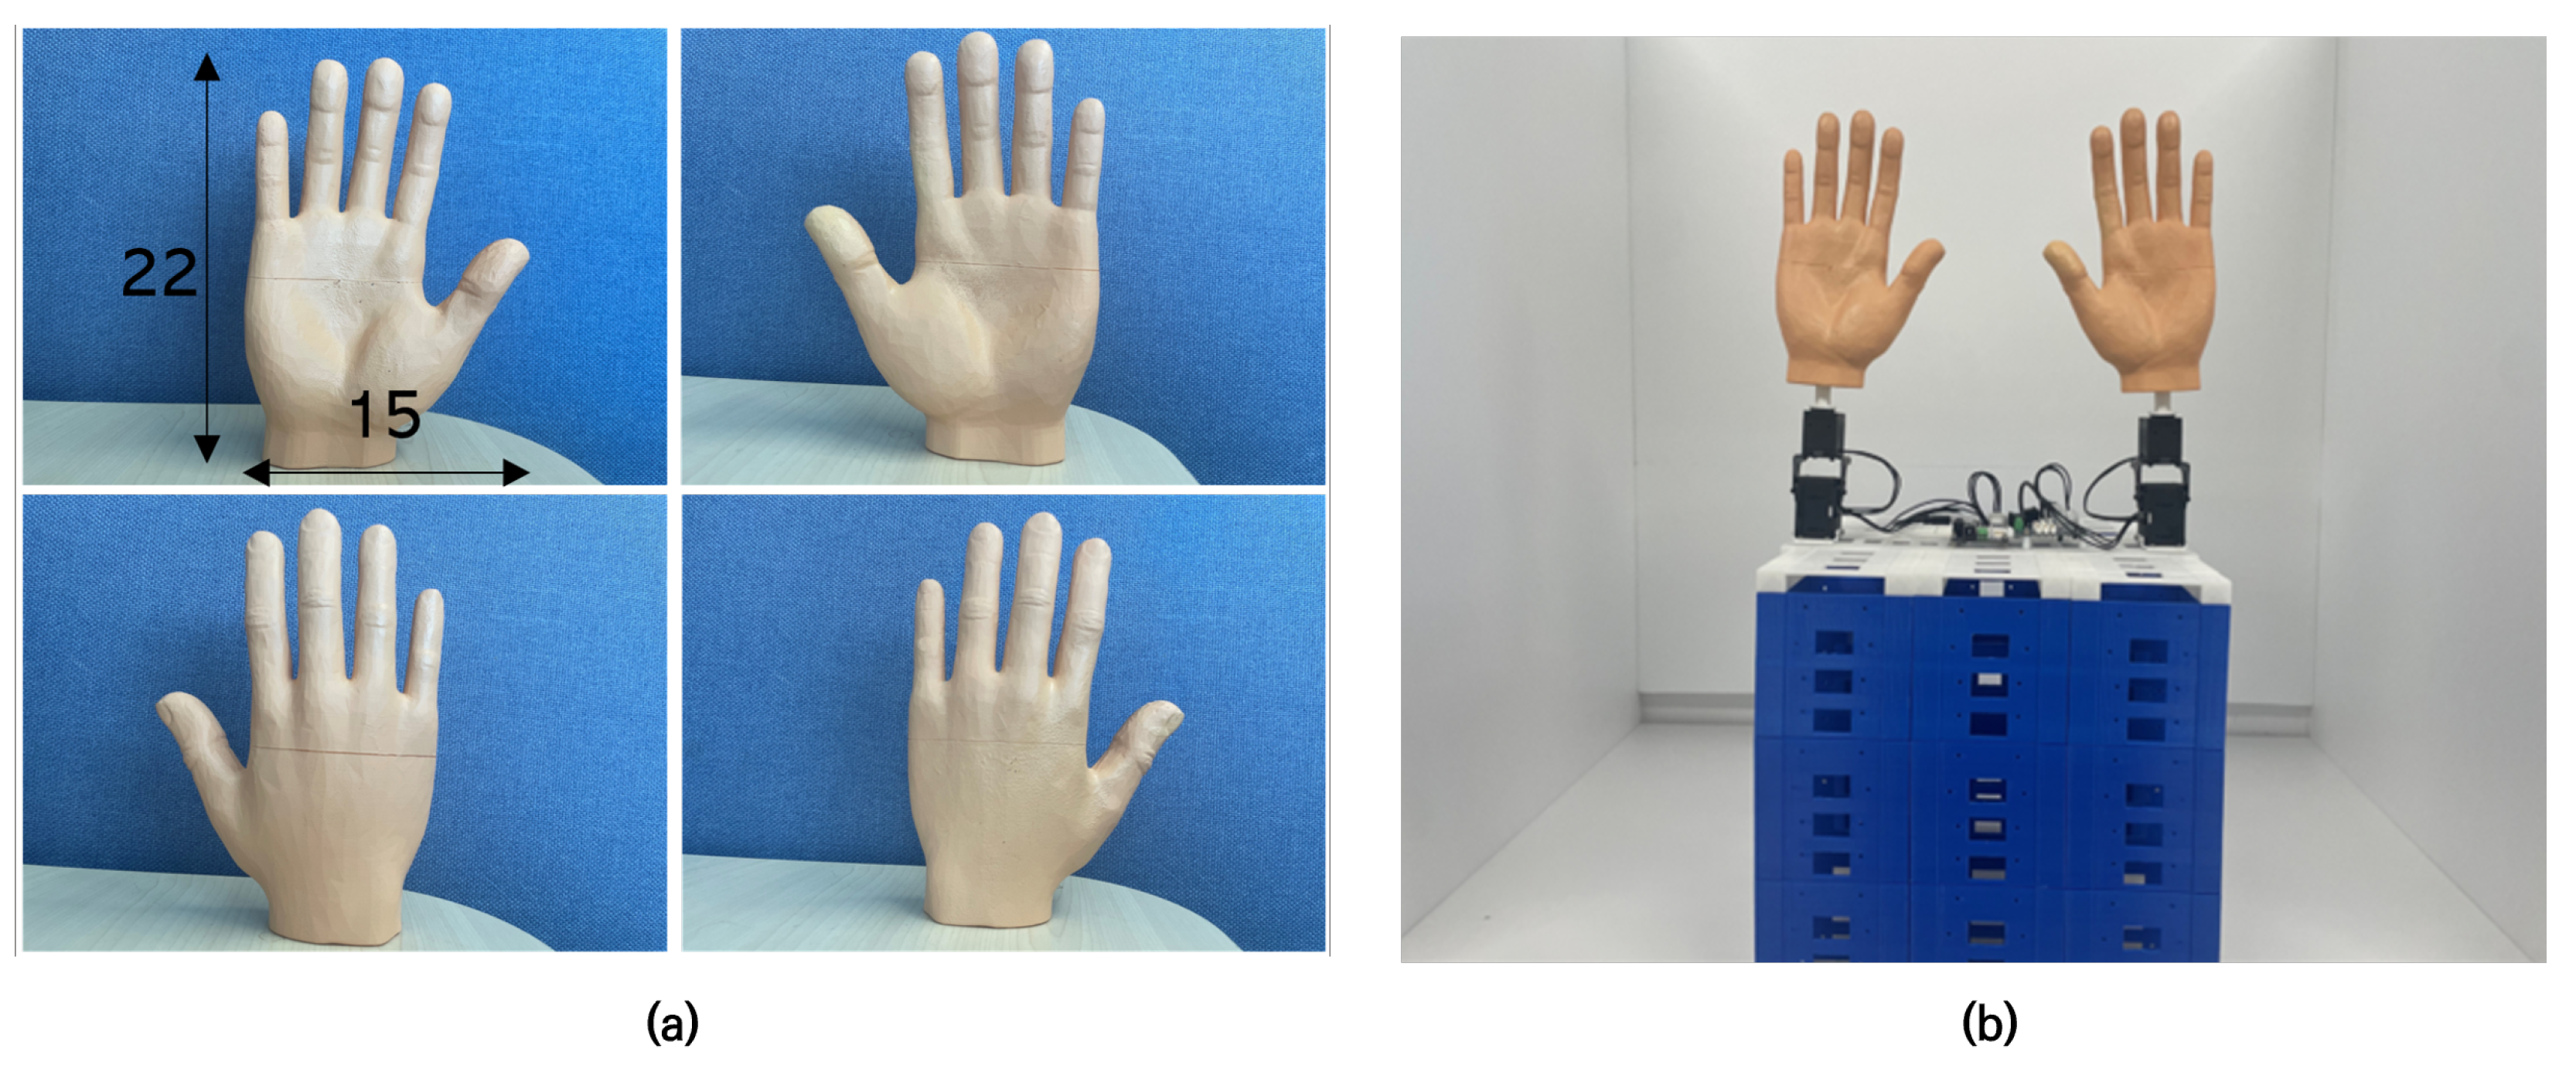
4.1. Experimental Apparatus

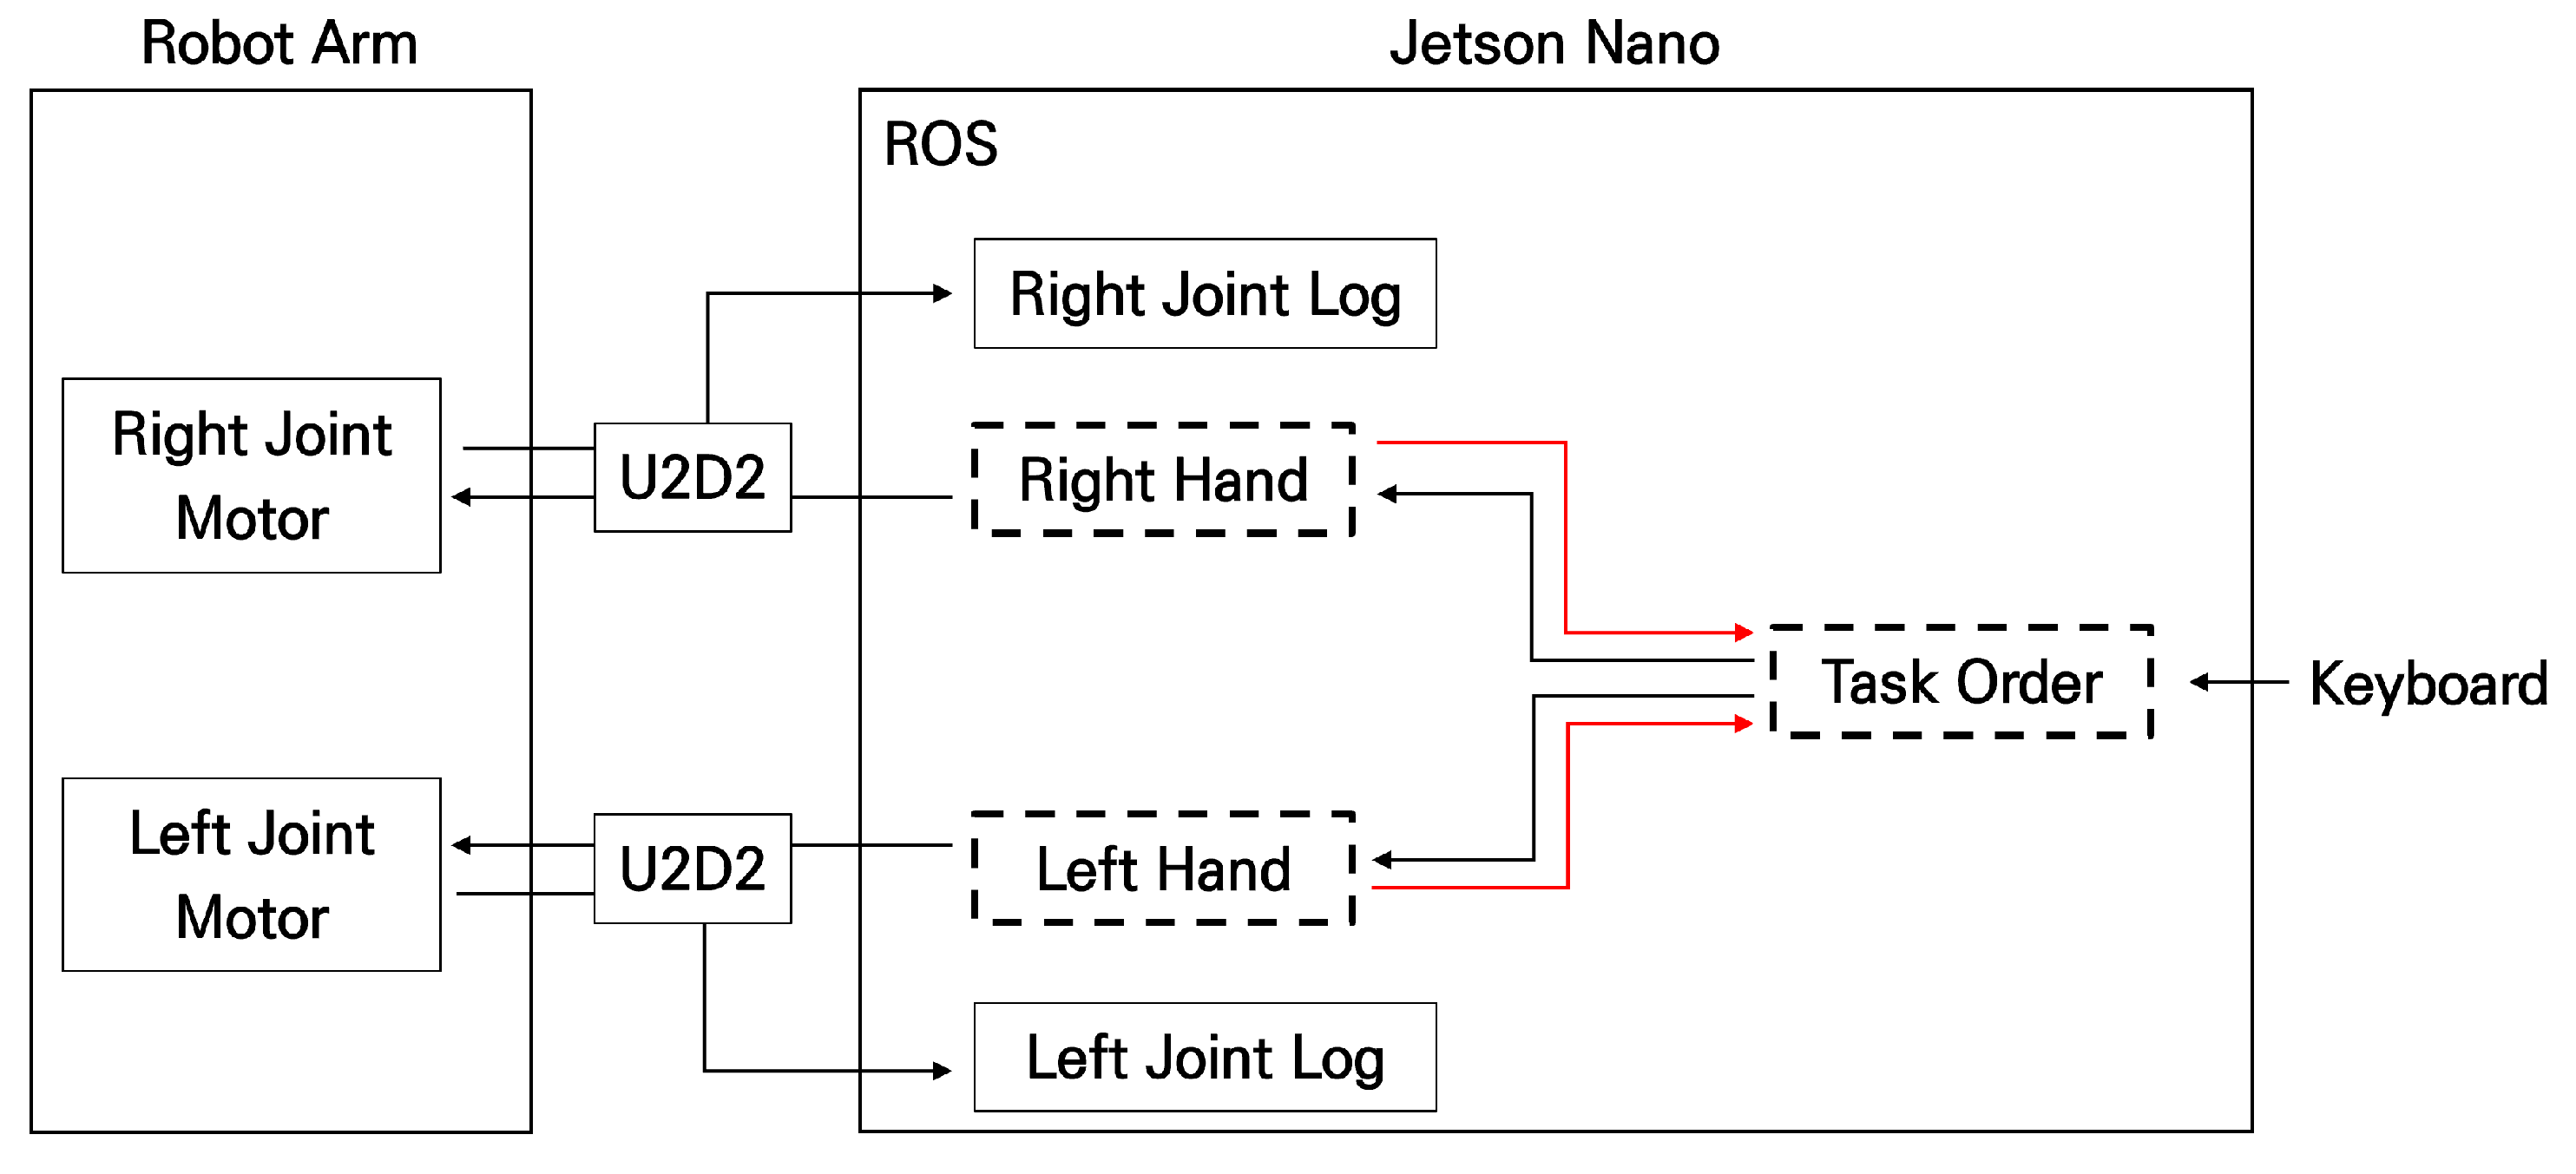
4.1.1. Hardware Configuration

The robot arm hardware in question consists of a model hand, joint motor, and saucer and has a total height of 65 cm, width of 35 cm, and thickness of 35 cm. The model hand was manufactured through 3D modeling and has a height of 22 cm, a width of 15 cm, a thickness of 5 cm, and an apricot color with a hex color code of #fbceb, as shown in Figure 7a. Next, the joint motors can be position- and speed-controlled at the same time, and the Dynamixel motor was built by combining the model hand to synchronize and control the joint motors of both hands. In the case of joint motors, different motors were used and are divided into upper and lower ends, as shown in Figure 7b.
The upper motor is model XC430-W150-T, and the lower motor is model XL430-W250-T. For the upper motor, the controller is an ARM CORTEX-M3 (72 MHz, 32 bit) with a maximum speed of 99 RPM and 360 degrees of rotation that can be precisely controlled in 0.088° increments with values from 0 to 4095. The lower motor controls the rotation axis of the hand rotation and serves to control the shaft shaking caused by the operation of the upper motor, and the upper motor, MCU, and gear ratio are the same except that it has a maximum RPM of 83. Finally, to minimize recoil caused by motor driving, we manufactured a support plate of 30 cm in height, 35 cm in width, and 35 cm in thickness to fix the drive motor. In addition, we used an NVIDIA (Santa Clara, CA, USA) Jetson Nano as the computer for motor control and two U2D2 (electric signal converters) for each port for simultaneous control of the right and left hands. The motor power was provided via SMPS 12V power through a U2D2 PWH (power hub).

4.1.2. Software Configuration
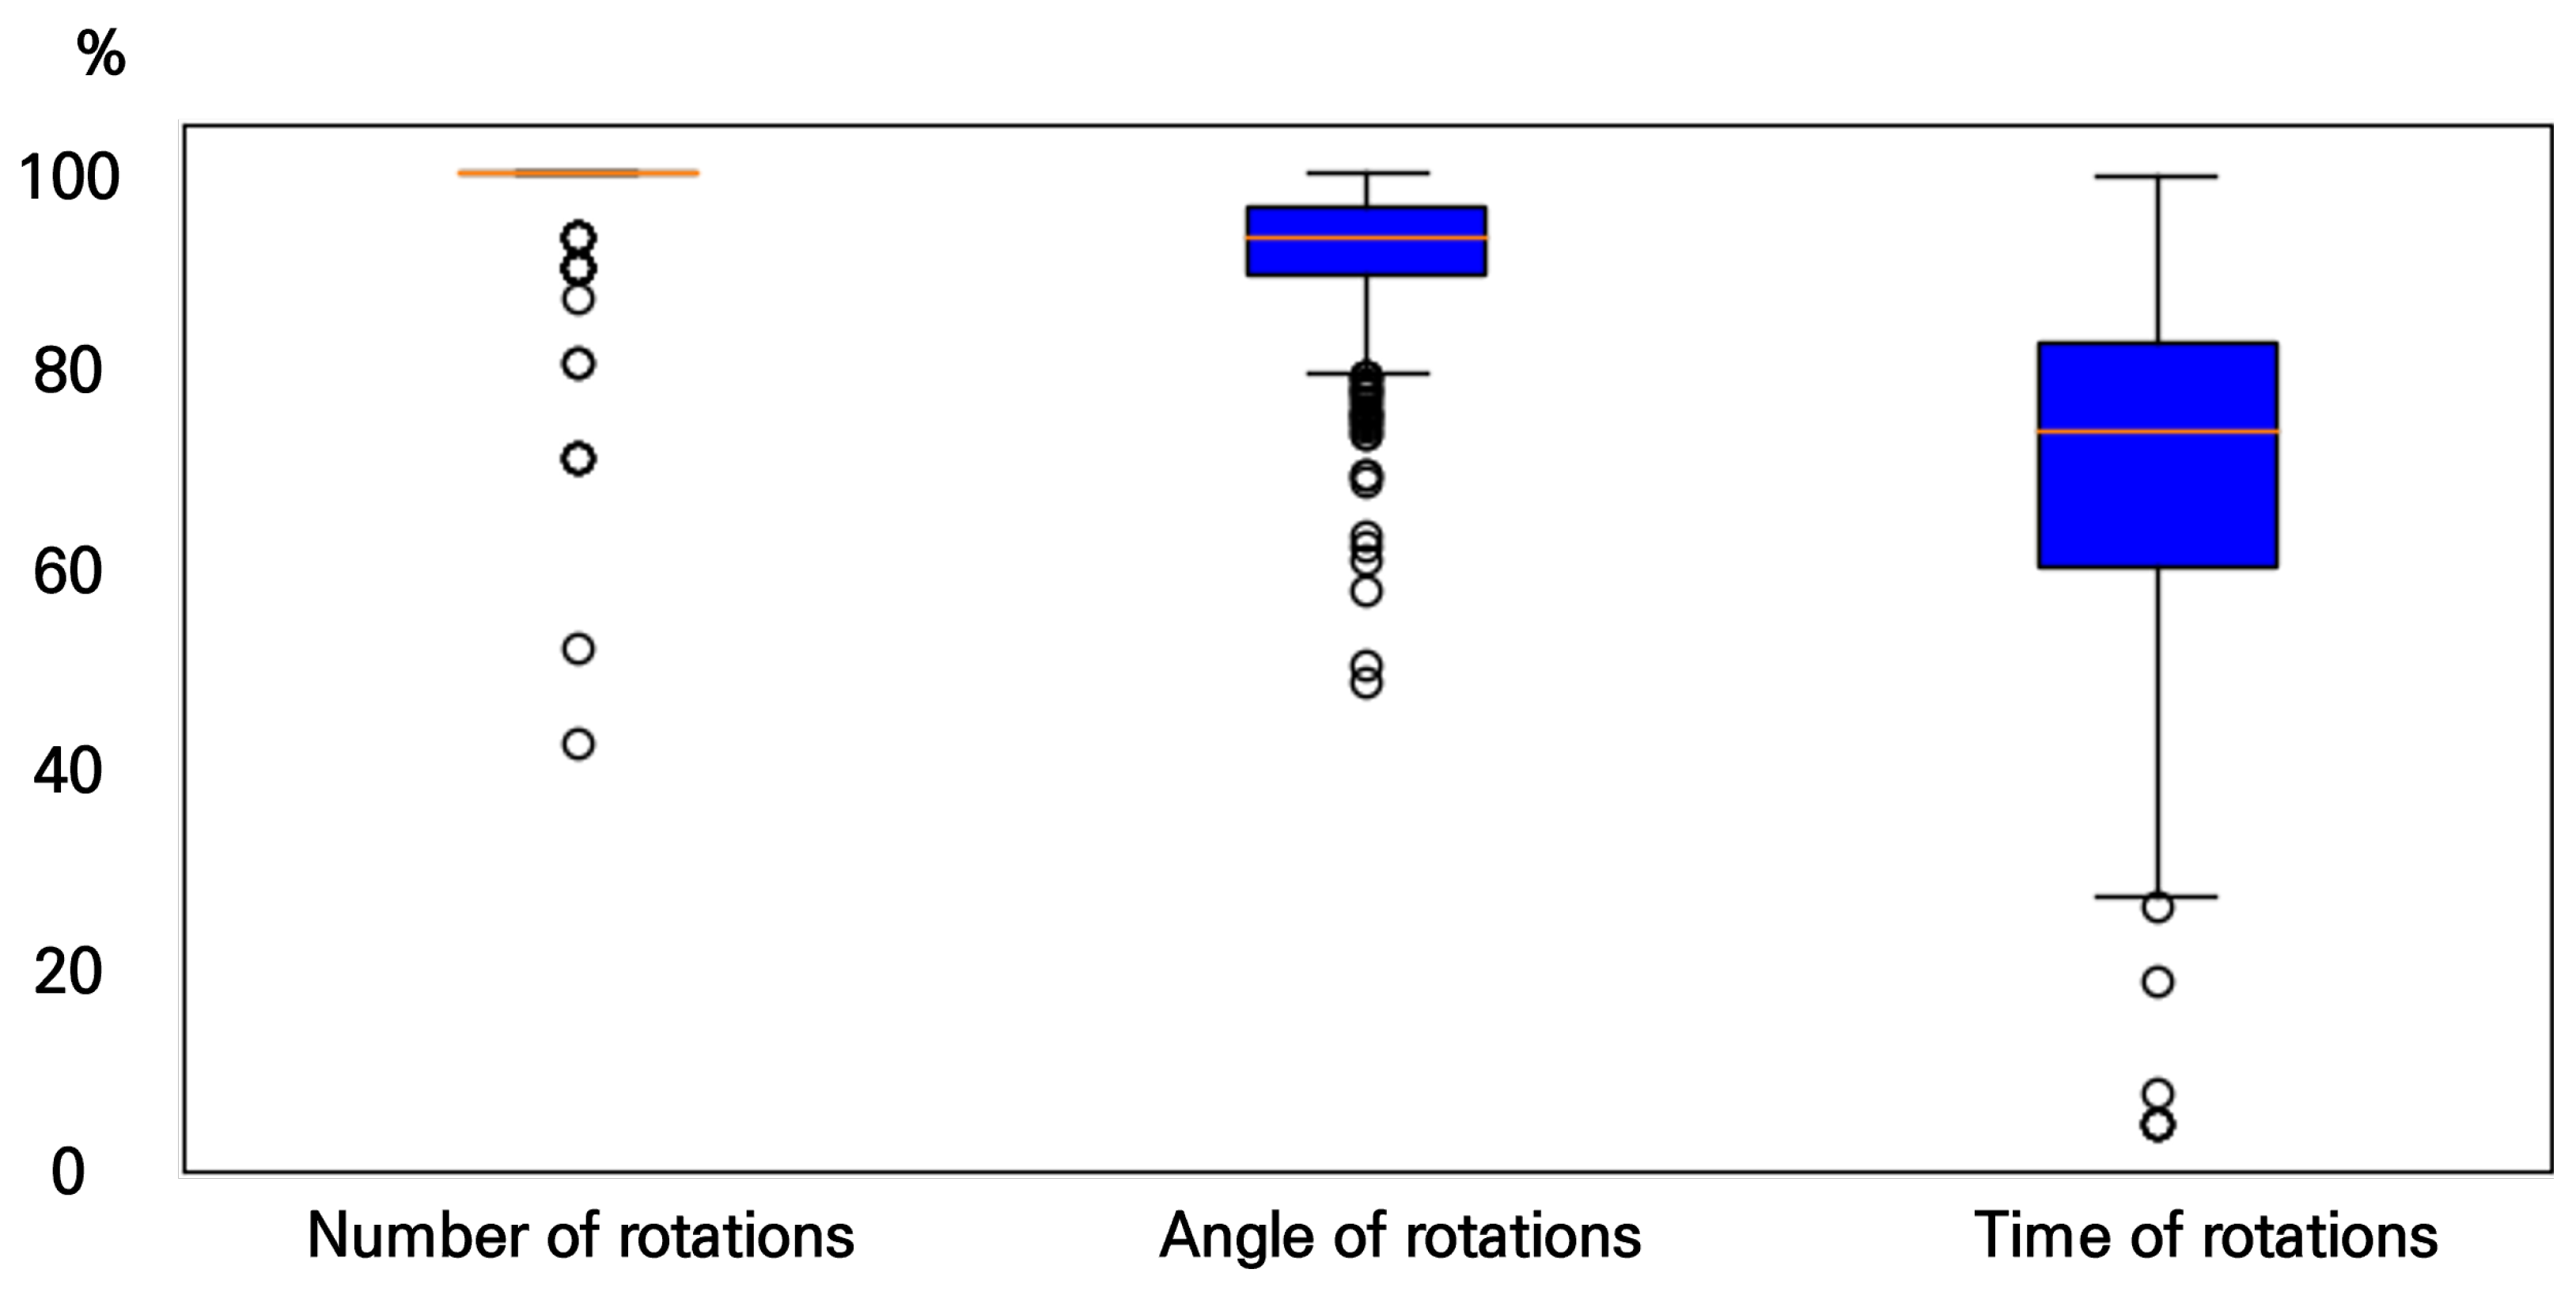
The robotic arm software used ROS Melodic and Python 3.7 in the Ubuntu LTS 18.04 operating system, the joint motor MCU firmware was set to V45, and the operating mode was set to time-based position mode. In the case of the ROS node, when the task number is entered through the task order node with the task order and the right hand and left hand, the task values in Table 1 are transmitted to the right hand and left hand nodes to operate the joint motor and and store the log values. Figure 8 below briefly shows the software flow of the robot arm. A red arrow shows a connection through a subscription to receive drive values before the software is activated, while a black arrow shows the flow from task input to the joint motor drive.

5. Results

In this study, the aforementioned ground-truth dataset was used to verify behavioral data measurement technology through hand rotation recognition. We verified our method for measurement by using the predicted values through the relevant hand motion recognition technology and the label values stored in the log of robot arm’s actual driving value, as shown in Figure 8. As shown in Table 2 and Figure 9, the average accuracy for the number of rotations is 99.21% (4.64), the average accuracy for the angle of rotation is 91.90% (6.98), and the average accuracy for the time of rotation is 68.67% (16.59).
Figure 9 is a visualization of Table 2 and shows the accuracy and standard deviation for each measurement element in the entire dataset used in the experiment (N = 540). In detail, as can be easily seen, the number of rotations showed very high accuracy of 99.21%, while the angle of rotations also showed high accuracy of 91%. However, the time of rotations shows relatively low accuracy at 68.67%, which is considered to be the compliance accuracy considering that the FPS of the input device used in the system proposed in this study was 30 and the unit of measurement of the time of rotations was ms.
Additionally, when we classified the experimental results by task, they appear as shown in Table 3. The MAPEs for the inference value (N = 18) of the right hand and the left hand are repeated three times for each distance of 97 cm, 77 cm, and 57 cm. To explain the accuracy evaluation metric mentioned in Experiment Section 4 again easily, when the predicted value is 11 but the ground-truth value is 10, accuracy is 90%; likewise, when the predicted value is 110°, accuracy is equally 90% when the ground-truth value is 100°. At this time, the sample (N) values are all ones. As such, this calculation method has the advantage of conveniently comparing performance between measurement indicators by expressing measurement indicators with different units as percentages, but it is not easy to understand how many errors occurred in the number of rotations or how many degrees of error the angle of rotations had. For this reason, MAE, which can represent actual errors, is additionally indicated in Table 3. MAE was calculated using Equation (9), where A t means ground-truth value and F t is the value predicted by this system when calculating accuracy.
M A E = A t F t A t
The meaning of the MAE evaluation metric can be explained by an example situation for which the sample (N) is one: When the ground truth of the number of rotations is 10, if the predicted value is 11, the MAE is expressed as 0.1, indicating that the value of the error is 0.1. When the ground truth of another measurement index, the angle of rotation, is 100 degrees, if the predicted value is 110 degrees, MAE is expressed as 10, and the known error angle means 10 degrees. Likewise, the MAE of the time of rotation is also expressed with the measured unit (ms), indicating the actual absolute error value in the same unit as the measurement index.
The results of the accuracy and MAE performance indicators for each task can be found in Table 3. As previously confirmed through Figure 9, the number of rotations shows high accuracy regardless of the task number, and in the case of the angle of rotation, an error of 6.95° occurs on average, which confirms the tendency of having a lower accuracy based due to an increased ratio when the angle of rotation of the ground truth is small. In addition, it can be seen that the time of rotation metric shows a similar trend, and the characteristic part represents larger MAEs from Task 25 to Task 30, which corresponds to the fifth hypothesis of Section 4. Finally, the average accuracy of each variable in the task configuration is shown as follows in Table 4.

6. Discussion

In this paper, we define measurement behavior for extraction technology and propose an image-processing-technology-based measurement system for novel behavior indicators needed for early screening of cognitive-ability-based diseases. The measurement motion of hand rotation places less physical burden on the subject and enables periodic examination because of its low learning effect. The system uses a web camera to minimize psychological barriers that may arise during cognitive ability screening tests through unfamiliar instruments. In addition, to verify the validity of the technology, we formulated hypotheses for situations that may occur during hand rotation and established a hand rotation ground-truth dataset for experimentation. As a result of the experiment, the number of rotations and angle of rotation indicators, excluding time of rotation, showed average accuracies of more than 90%, and the time of rotation indicator also has a convincing average accuracy considering that the input image was measured every 0.03 s on 30 FPS video. In particular, it is also encouraging that the analysis of the experimental results of the angle of rotation according to task variables TCA and ACA, which indicate the variability in hand rotation angle, increase or decrease based on hand rotation angles that can occur during actual hand rotation, for which case they show at least 85% accuracy.
First, it is necessary to clearly understand the structure of the ground-truth dataset proposed in this paper. As mentioned in Section 4, we perform 30 tasks three times at three distances to provide 270 image data points and 540 structured data points (.csv) for each right and left hand in the image. Since it is good to be able to learn as many cases as possible in the training set for machine learning, we initially recommend randomly selecting two out of three trials and including them in the training set. In other words, the training set should have at least 180 image data points, including all tasks at all distances, and the 360 pieces of structured data corresponding to them. Next, the test set is selected from the remaining trials that were excluded from the training set. At this time, in order to ensure that all variables are properly included in the test set, 60 image data points and 120 structured data points are formed as a test set by arbitrarily selecting two out of three distances for each task, and for the remaining data not included in the test set, it is recommended that the data be assigned to the training set: the final training set is 210 image data points and 420 structured data points, and the test set is 60 image data points and 120 structured data points for a training to test ratio of 8 to 2.
Unfortunately, in the case of the experiments conducted in this study, there is significant diversity of tasks and inadequate segments in the blurred part. First, in the case of tasks performed by the experimental robot arm, the data do not fully cover the numerous cases that can occur when a person performs a hand turn. The second limitation is the limit to the experimental robot’s axial freedom. In humans, for example, as the hand rotates, the gap between the two hands gradually increases, several joints of the arms move at the same time, and the wrist joints move forward (along with the axis of rotation). However, this study focuses on the definition of hand rotation, the development of hand rotation recognition technology, and the establishment of hand movement ground-truth data, and it does not replicate situations that may occur in all hand rotation movements. We think it is possible to implement more diverse situations by increasing the performance of and the number of motors constituting the experimental robot in future studies. Another problem was the reduction in measurement accuracy due to blurring of input images. In this study, because a webcam was used as a subject-friendly device, there was an inevitable problem with deterioration of the quality of the input images because of camera performance. However, this problem could be solved by adding a preprocessing process for input images through the addition of a blur restoration deep learning model to the system configuration rather than changing the input device in subsequent studies.

7. Conclusions

We proposed image-processing-based behavioral data measurement technology that can be used for cognitive ability screening. Our system used a web camera to minimize psychological barriers to the subject and to reduce physical risk while collecting behavioral data. We first defined the measurement motion as hand rotation with the back of the hand facing the subject’s face and the palm facing the camera, and then hand rotation with the palm facing the subject and the back of the hand facing the camera. We then selected the number of hand rotations, hand rotation angle, and hand rotation time as measurement indicators. Next, we implemented measurement technology using image processing technology. First, using the MediaPipe hand model, we calculated measurement elements through Euler angles and pattern analysis in quaternion as a preprocessing process for rotating body transformation with hand recognition and, secondly, to Euler angles for three-dimensional behavior inference. After that, we developed a robot arm that can perform quantitative hand rotation to verify the validity of such measurement technology. We established 30 tasks based on five hypotheses that can occur during actual hand rotation and built a ground-truth dataset to conduct the experiment. Experimental results showed that the accuracy for the number of hand rotations, hand rotation angle, and hand rotation time were 99.21%, 91.90%, and 68.67%, respectively. The use of the behavioral data measurement technology proposed in this study is significant in that it makes it possible to measure quantitative indicators that can be used for diagnostic screening and prognosis prediction for diseases related to cognitive ability caused by an aging population. It also has advantages in that it uses simple hand behavior and measures behavior data using measurement devices familiar to the subject; thus, the results are not affected by the subject’s physical risk burden and the psychological barrier generation caused by unfamiliar measurement devices. In addition, given that it is difficult to find an video dataset that shares quantitative momentum in the existing image processing field, we expect the hand motion ground-truth dataset used in this study can be used for kinetic and video-based motion research within the image processing field.

Author Contributions

Conceptualization and methodology, H.-J.K., J.-S.K. and S.-H.K.; software, H.-J.K. and J.-S.K.; validation, H.-J.K.; formal analysis and data curation, H.-J.K.; writing—original draft preparation, H.-J.K.; writing—review and editing, S.-H.K.; project administration, S.-H.K.; funding acquisition, S.-H.K. All authors have read and agreed to the published version of the manuscript.

Funding

This research was supported by the MSIT (Ministry of Science and ICT), Korea, under the Grand Information Technology Research Center support program (IITP-2023-2020-0-01791) supervised by the IITP (Institute for Information & Communications Technology Planning & Evaluation) and by National Research Foundation of Korea Grant, grant number NRF-2019R1C1C1005508.

Institutional Review Board Statement

The study was conducted according to the guidelines of the Declaration of South Korea, and approved by the University of Dong-eui Institutional Review Board (protocol code DIRB-202307-HR-E-20 on 24 July 2023).

Informed Consent Statement

Informed consent was obtained from all subjects involved in the study.

Data Availability Statement

Data are contained within the article.

Conflicts of Interest

The authors declare no conflict of interest.

References

  1. Lu, K.; Xiong, X.; Li, M.; Yuan, J.; Luo, Y.; Friedman, D.B. Trends in prevalence, health disparities, and early detection of dementia: A 10-year nationally representative serial cross-sectional and cohort study. Front. Public Health 2023, 10, 1021010. [Google Scholar] [CrossRef]
  2. Halonen, P.; Enroth, L.; Jämsen, E.; Vargese, S.; Jylhä, M. Dementia and related comorbidities in the population aged 90 and over in the vitality 90+ study, Finland: Patterns and trends from 2001 to 2018. J. Aging Health 2023, 35, 370–382. [Google Scholar] [CrossRef] [PubMed]
  3. Woodford, H.J.; George, J. Cognitive assessment in the elderly: A review of clinical methods. QJM Int. J. Med. 2007, 100, 469–484. [Google Scholar] [CrossRef] [PubMed]
  4. van Belle, G.; Uhlmann, R.F.; Hughes, J.P.; Larson, E.B. Reliability of estimates of changes in mental status test performance in senile dementia of the Alzheimer type. J. Clin. Epidemiol. 1990, 43, 589–595. [Google Scholar] [CrossRef] [PubMed]
  5. Moms, J.; Heyman, A.; Mohs, R.; Hughes, J.; van Belle, G.; Fillenbaum, G.; Mellits, E.; Clark, C. The Consortium to Establish a Registry for Alzheimer’s Disease (CERAD). Part I. Clinical and neuropsychological assesment of Alzheimer’s disease. Neurology 1989, 39, 1159. [Google Scholar] [CrossRef] [PubMed]
  6. Peters, C.A.; Potter, J.F.; Scholer, S.G. Hearing impairment as a predictor of cognitive decline in dementia. J. Am. Geriatr. Soc. 1988, 36, 981–986. [Google Scholar] [CrossRef]
  7. Murden, R.A.; McRae, T.D.; Kaner, S.; Bucknam, M.E. Mini-Mental State Exam scores vary with education in blacks and whites. J. Am. Geriatr. Soc. 1991, 39, 149–155. [Google Scholar] [CrossRef]
  8. Brayne, C.; Calloway, P. The association of education and socioeconomic status with the Mini Mental State Examination and the clinical diagnosis of dementia in elderly people. Age Ageing 1990, 19, 91–96. [Google Scholar] [CrossRef]
  9. O’connor, D.; Pollitt, P.; Treasure, F. The influence of education and social class on the diagnosis of dementia in a community population. Psychol. Med. 1991, 21, 219–224. [Google Scholar] [CrossRef]
  10. Folstein, M.; Anthony, J.C.; Parhad, I.; Duffy, B.; Gruenberg, E.M. The meaning of cognitive impairment in the elderly. J. Am. Geriatr. Soc. 1985, 33, 228–235. [Google Scholar] [CrossRef]
  11. Magaziner, J.; Bassett, S.S.; Rebel, J.R. Predicting performance on the Mini-Mental State Examination: Use of age-and education-specific equations. J. Am. Geriatr. Soc. 1987, 35, 996–1000. [Google Scholar] [CrossRef] [PubMed]
  12. Kay, D.; Henderson, A.; Scott, R.; Wilson, J.; Rickwood, D.; Grayson, D. Dementia and depression among the elderly living in the Hobart community: The effect of the diagnostic criteria on the prevalence rates. Psychol. Med. 1985, 15, 771–788. [Google Scholar] [CrossRef] [PubMed]
  13. Cavanaugh, S.A.; Wettstein, R.M. The relationship between severity of depression, cognitive dysfunction, and age in medical inpatients. Am. J. Psychiatry 1983, 140, 495–496. [Google Scholar] [PubMed]
  14. Uhlmann, R.F.; Larson, E.B. Effect of education on the Mini-Mental State Examination as a screening test for dementia. J. Am. Geriatr. Soc. 1991, 39, 876–880. [Google Scholar] [CrossRef] [PubMed]
  15. Yoon, E.; Bae, S.; Park, H. Gait speed and sleep duration is associated with increased risk of MCI in older community-dwelling adults. Int. J. Environ. Res. Public Health 2022, 19, 7625. [Google Scholar] [CrossRef] [PubMed]
  16. Huang, G.; Tran, S.N.; Bai, Q.; Alty, J. Hand gesture detection in tests performed by older adults. arXiv 2021, arXiv:2110.14461. [Google Scholar]
  17. Li, X.; Shen, M.; Han, Z.; Jiao, J.; Tong, X. The gesture imitation test in dementia with Lewy bodies and Alzheimer’s disease dementia. Front. Neurol. 2022, 13, 950730. [Google Scholar] [CrossRef]
  18. Kharb, A.; Saini, V.; Jain, Y.; Dhiman, S. A review of gait cycle and its parameters. IJCEM Int. J. Comput. Eng. Manag. 2011, 13, 78–83. [Google Scholar]
  19. Callisaya, M.L.; Launay, C.P.; Srikanth, V.K.; Verghese, J.; Allali, G.; Beauchet, O. Cognitive status, fast walking speed and walking speed reserve—the Gait and Alzheimer Interactions Tracking (GAIT) study. Geroscience 2017, 39, 231–239. [Google Scholar] [CrossRef]
  20. Buracchio, T.; Dodge, H.H.; Howieson, D.; Wasserman, D.; Kaye, J. The trajectory of gait speed preceding mild cognitive impairment. Arch. Neurol. 2010, 67, 980–986. [Google Scholar] [CrossRef]
  21. Yamaguchi, H.; Maki, Y.; Yamagami, T. Yamaguchi fox-pigeon imitation test: A rapid test for dementia. Dement. Geriatr. Cogn. Disord. 2010, 29, 254–258. [Google Scholar] [CrossRef] [PubMed]
  22. Nagahama, Y.; Okina, T.; Suzuki, N. Impaired imitation of gestures in mild dementia: Comparison of dementia with Lewy bodies, Alzheimer’s disease and vascular dementia. J. Neurol. Neurosurg. Psychiatry 2015, 86, 1248–1252. [Google Scholar] [CrossRef] [PubMed]
  23. Negin, F.; Rodriguez, P.; Koperski, M.; Kerboua, A.; Gonzàlez, J.; Bourgeois, J.; Chapoulie, E.; Robert, P.; Bremond, F. PRAXIS: Towards automatic cognitive assessment using gesture recognition. Expert Syst. Appl. 2018, 106, 21–35. [Google Scholar] [CrossRef]
  24. Park, J.; Seo, K.; Kim, S.E.; Ryu, H.; Choi, H. Early Screening of Mild Cognitive Impairment through Hand Movement Analysis in Virtual Reality Based on Machine Learning: Screening of MCI Through Hand Movement in VR. J. Cogn. Interv. Digit. Health 2022, 1, 1. [Google Scholar] [CrossRef]
  25. Chua, S.I.L.; Tan, N.C.; Wong, W.T.; Allen, J.C., Jr.; Quah, J.H.M.; Malhotra, R.; Østbye, T. Virtual reality for screening of cognitive function in older persons: Comparative study. J. Med. Internet Res. 2019, 21, e14821. [Google Scholar] [CrossRef]
  26. Zhong, Q.; Ali, N.; Gao, Y.; Wu, H.; Wu, X.; Sun, C.; Ma, J.; Thabane, L.; Xiao, M.; Zhou, Q.; et al. Gait kinematic and kinetic characteristics of older adults with mild cognitive impairment and subjective cognitive decline: A cross-sectional study. Front. Aging Neurosci. 2021, 13, 664558. [Google Scholar] [CrossRef]
  27. Baumard, J.; Lesourd, M.; Remigereau, C.; Lucas, C.; Jarry, C.; Osiurak, F.; Le Gall, D. Imitation of meaningless gestures in normal aging. Aging Neuropsychol. Cogn. 2020, 27, 729–747. [Google Scholar] [CrossRef]
  28. Curreri, C.; Trevisan, C.; Carrer, P.; Facchini, S.; Giantin, V.; Maggi, S.; Noale, M.; De Rui, M.; Perissinotto, E.; Zambon, S.; et al. Difficulties with fine motor skills and cognitive impairment in an elderly population: The progetto veneto anziani. J. Am. Geriatr. Soc. 2018, 66, 350–356. [Google Scholar] [CrossRef]
  29. Lindh-Rengifo, M.; Jonasson, S.B.; Ullen, S.; Stomrud, E.; Palmqvist, S.; Mattsson-Carlgren, N.; Hansson, O.; Nilsson, M.H. Components of gait in people with and without mild cognitive impairment. Gait Posture 2022, 93, 83–89. [Google Scholar] [CrossRef]
  30. Liang, X.; Kapetanios, E.; Woll, B.; Angelopoulou, A. Real time hand movement trajectory tracking for enhancing dementia screening in ageing deaf signers of British sign language. In Proceedings of the Machine Learning and Knowledge Extraction: Third IFIP TC 5, TC 12, WG 8.4, WG 8.9, WG 12.9 International Cross-Domain Conference, CD-MAKE 2019, Canterbury, UK, 26–29 August 2019; Springer: Berlin/Heidelberg, Germany, 2019; pp. 377–394. [Google Scholar]
  31. Amprimo, G.; Masi, G.; Pettiti, G.; Olmo, G.; Priano, L.; Ferraris, C. Hand tracking for clinical applications: Validation of the Google MediaPipe Hand (GMH) and the depth-enhanced GMH-D frameworks. arXiv 2023, arXiv:2308.01088. [Google Scholar]
  32. Oikonomidis, I.; Kyriazis, N.; Argyros, A.A.; Computational Vision and Robotics Lab., Institute of Computer Science, FORTH; Computer Science Department, University of Crete. Efficient model-based 3D tracking of hand articulations using Kinect. In Proceedings of the BmVC, Dundee, UK, 29 August–2 September 2011; Volume 1, p. 3. [Google Scholar]
  33. Zimmermann, C.; Brox, T. Learning to estimate 3d hand pose from single rgb images. In Proceedings of the IEEE International Conference on Computer Vision, Venice, Italy, 22–29 October 2017; pp. 4903–4911. [Google Scholar]
  34. Deng, X.; Zhang, Y.; Yang, S.; Tan, P.; Chang, L.; Yuan, Y.; Wang, H. Joint hand detection and rotation estimation using CNN. IEEE Trans. Image Process. 2017, 27, 1888–1900. [Google Scholar] [CrossRef] [PubMed]
  35. Zhang, F.; Bazarevsky, V.; Vakunov, A.; Tkachenka, A.; Sung, G.; Chang, C.L.; Grundmann, M. Mediapipe hands: On-device real-time hand tracking. arXiv 2020, arXiv:2006.10214. [Google Scholar]
  36. Watanabe, T.; Maniruzzaman, M.; Hasan, M.A.M.; Lee, H.S.; Jang, S.W.; Shin, J. 2D Camera-Based Air-Writing Recognition Using Hand Pose Estimation and Hybrid Deep Learning Model. Electronics 2023, 12, 995. [Google Scholar] [CrossRef]
  37. Kim, S.; Kim, M. Rotation Representations and Their Conversions. IEEE Access 2023, 11, 6682–6699. [Google Scholar] [CrossRef]
Figure 1. Process of our method.
Applsci 14 00422 g001
Figure 2. Example of hand rotation for 360° over 30 frames.
Applsci 14 00422 g002
Figure 3. Example of MediaPipe hand model: (a) model output image with 21 landmarks and (b) distinction between right and left hands.
Applsci 14 00422 g003
Figure 4. Process of pattern analysis for behavior recognition.
Applsci 14 00422 g004
Figure 5. Data-sliced shape used for pattern analysis.
Applsci 14 00422 g005
Figure 6. Curve trends for variables by task number.
Applsci 14 00422 g006
Figure 7. Our robot arm used for ground truth: (a) hands made by modeling, the unit is cm; (b) robot arms.
Applsci 14 00422 g007
Figure 8. Architecture of our robot arm. The black arrow represents the task flow, and the red color represents the flow receiving status information.
Applsci 14 00422 g008
Figure 9. Boxplot of experimental results by measurement element. The blue box indicates the interquartile range from 25 percentile to 75 percentile. The orange line is the median value.
Applsci 14 00422 g009
Table 1. Table showing variables by task.
TaskHandAngle of RotationNumber of RotationsTBR (ms)TOK (ms)TCA (ms)ACA
Task 1Both180°10000
Task 2Both120°10000
Task 3Both100°10000
Task 4Both80°10000
Task 5Both60°10000
Task 6Both40°10000
Task 7Both180°100500
Task 8Both120°100500
Task 9Both100°100500
Task 10Both80°100500
Task 11Both60°100500
Task 12Both40°100500
Task 13Both180°100050
Task 14Both120°100050
Task 15Both100°100050
Task 16Both80°100050
Task 17Both60°100050
Task 18Both40°100050
Task 19Both180°10000−4.4°
Task 20Both120°10000−2.64°
Task 21Both100°10000−0.88°
Task 22Both80°100000.88°
Task 23Both60°100002.64°
Task 24Both40°100004.4°
Task 25Left180°15505050−4.4°
Right180°103010030−4.84°
Task 26Left120°15505050−2.64°
Right120°103010030−3.08°
Task 27Left100°15505050−0.88°
Right100°103010030−1.32°
Task 28Left80°155050500.88°
Right80°1030100301.32°
Task 29Left60°155050502.64°
Right60°1030100303.08°
Task 30Left40°155050504.4°
Right40°1030100304.84°
Table 2. Accuracy results between ground-truth dataset and predicted values as measured by robot arm elements.
Measurement FactorNAverage (std)MinimumMaximum
Number of rotations54099.21 (4.64)%40.00%100.00%
Angle of rotations54091.90 (6.98)%46.29%99.97%
Time of rotations54068.67 (16.59)%0.00%99.77%
Table 3. Accuracy and MAE results between ground-truth dataset and predicted values by task.
Task (N)Evaluation MetricNumber of RotationsAngle of RotationTime of Rotation
Task 1 (18)Accuracy100.00 (0.00)%94.88 (3.49)%85.13 (1.29)%
MAE0.009.21°4.52 (ms)
Task 2 (18)Accuracy100.00 (0.00)%94.16 (3.15)%74.06 (2.84)%
MAE0.007.13°5.47 (ms)
Task 3 (18)Accuracy100.00 (0.00)%94.88 (2.50)%69.51 (4.69)%
MAE0.005.26°5.65 (ms)
Task 4 (18)Accuracy100.00 (0.00)%93.80 (5.26)%85.13 (9.75)%
MAE0.005.16°4.83 (ms)
Task 5 (18)Accuracy100.00 (0.00)%91.54 (3.73)%74.06 (6.94)%
MAE0.005.41°4.53 (ms)
Task 6 (18)Accuracy100.00 (0.00)%80.60 (4.52)%69.51 (7.88)%
MAE0.008.66°3.82 (ms)
Task 7 (18)Accuracy100.00 (0.00)%94.93 (3.45)%76.12 (1.46)%
MAE0.009.13°7.25 (ms)
Task 8 (18)Accuracy100.00 (0.00)%89.76 (2.71)%64.08 (2.65)%
MAE0.0012.50°7.68 (ms)
Task 9 (18)Accuracy100.00 (0.00)%93.72 (2.03)%59.46 (3.75)%
MAE0.006.57°7.57 (ms)
Task 10 (18)Accuracy100.00 (0.00)%93.12 (4.43)%51.73 (5.54)%
MAE0.005.73°7.55 (ms)
Task 11 (18)Accuracy100.00 (0.00)%92.37 (4.02)%43.43 (5.25)%
MAE0.004.88°7.24 (ms)
Task 12 (18)Accuracy93.33 (10.28)%80.37 (5.39)%21.43 (14.36)%
MAE0.678.77°7.95 (ms)
Task 13 (18)Accuracy100.00 (0.00)%94.22 (3.70)%87.04 (0.85)%
MAE0.0010.42°4.60 (ms)
Task 14 (18)Accuracy100.00 (0.00)%93.09 (2.79)%83.67 (2.60)%
MAE0.008.44°4.98 (ms)
Task 15 (18)Accuracy100.00 (0.00)%94.56 (1.67)%83.10 (2.45)%
MAE0.005.70°4.97 (ms)
Task 16 (18)Accuracy100.00 (0.00)%93.74 (5.17)%82.99 (3.38)%
MAE0.005.22°4.82 (ms)
Task 17 (18)Accuracy97.77 (7.32)%93.24 (4.36)%85.55 (3.48)%
MAE0.224.33°3.98 (ms)
Task 18 (18)Accuracy90.00 (18.47)%69.18 (11.73)%86.37 (8.68)%
MAE1.0013.76°3.62 (ms)
Task 19 (18)Accuracy100.00 (0.00)%97.10 (2.19)%84.32 (0.52)%
MAE0.004.65°4.30 (ms)
Task 20 (18)Accuracy100.00 (0.00)%94.47 (1.59)%76.92 (2.32)%
MAE0.006.10°4.50 (ms)
Task 21 (18)Accuracy100.00 (0.00)%94.71 (2.48)%76.10 (2.36)%
MAE0.005.36°4.29 (ms)
Task 22 (18)Accuracy100.00 (0.00)%93.42 (4.51)%68.25 (3.36)%
MAE0.005.74°5.06 (ms)
Task 23 (18)Accuracy99.44 (2.35)%92.74 (4.26)%63.33 (5.12)%
MAE0.065.51°5.15 (ms)
Task 24 (18)Accuracy99.44 (3.35)%95.16 (3.49)%56.05 (8.75)%
MAE0.063.12°5.38 (ms)
Task 25 (18)Accuracy99.62 (1.57)%95.72 (3.06)%72.53 (9.05)%
MAE0.066.61°9.42 (ms)
Task 26 (18)Accuracy100.00 (0.00)%89.22 (4.35)%67.07 (12.84)%
MAE0.0011.47°9.52 (ms)
Task 27 (18)Accuracy99.62 (1.57)%92.65 (3.86)%67.53 (13.68)%
MAE0.067.28°9.05 (ms)
Task 28 (18)Accuracy100.00 (0.00)%92.31 (5.12)%61.09 (16.08)%
MAE0.006.85°10.39 (ms)
Task 29 (18)Accuracy99.25 (2.15)%92.97 (5.11)%60.72 (19.51)%
MAE0.115.50°9.83 (ms)
Task 30 (18)Accuracy97.96 (4.14)%94.41 (4.30)%59.14 (21.73)%
MAE0.283.88°9.80 (ms)
Total (540)Accuracy99.21 (4.64)%91.91 (6.98)%68.68 (16.60)%
MAE0.086.95°6.26 (ms)
Table 4. Accuracy results between ground-truth dataset and predicted values by variable.
VariableValue (N)Number of RotationsAngle of RotationTime of Rotation
HandLeft (270)99.17 (3.64)%93.33 (6.93)%71.10 (16.07)%
Right (270)99.26 (5.47)%90.48 (6.75)%66.26 (16.79)%
Number of rotations10 (486)99.26 (4.81)%91.44 (7.18)%67.49 (17.04)%
15 (54)99.01 (2.72)%96.08 (2.18)%79.39 (3.62)%
TOK0 (360)99.11 (5.41)%91.72 (7.80)%72.94 (14.28)%
50 (126)99.26 (2.79)%93.39 (4.78)%64.52 (18.55)%
100 (54)99.81 (1.36)%89.68 (4.37)%49.97 (9.34)%
TBR0 (324)99.26 (5.17)%91.98 (7.78)%75.33 (11.00)%
30 (54)99.81 (1.36)%89.68 (4.37)%49.97 (9.34)%
50 (162)98.93 (4.21)%92.50 (5.77)%61.60 (19.84)%
TCA0 (324)99.57 (2.91)%92.33 (5.72)%64.64 (15.98)%
30 (54)99.81 (1.36)%89.68 (4.37)%49.97 (9.34)%
50 (162)98.31 (7.30)%91.81 (9.44)%82.99 (4.94)%
ACA−4.84° (9)100.00 (0.00)%95.16 (3.65)%63.91 (0.71)%
−4.4° (24)99.72 (1.36)%97.03 (2.30)%83.08 (2.15)%
−3.08° (9)100.00 (0.00)%85.46 (2.60)%54.69 (2.15)%
−2.6° (24)100.00 (0.00)%93.98 (1.71)%77.95 (2.37)%
−1.32° (9)100.00 (0.00)%89.19 (1.06)%54.45 (1.90)%
−0.88° (24)99.72 (1.36)%94.92 (2.36)%78.08 (3.23)%
0° (342)98.98 (5.66)%90.94 (7.98)%69.42 (17.72)%
0.88° (24)100.00 (0.00)%94.25 (4.12)%71.82 (4.59)%
1.32° (9)100.00 (0.00)%87.42 (1.04)%45.59 (2.60)%
2.6° (24)99.44 (1.88)%94.30 (4.51)%68.58 (9.48)%
3.08° (9)100.00 (0.00)%88.11 (1.15)%42.13 (3.43)%
4.4° (24)98.47 (3.68)%95.70 (3.05)%64.00 (14.21)%
4.84° (9)98.89 (3.33)%92.75 (5.47)%39.04 (7.71)%
Disclaimer/Publisher’s Note: The statements, opinions and data contained in all publications are solely those of the individual author(s) and contributor(s) and not of MDPI and/or the editor(s). MDPI and/or the editor(s) disclaim responsibility for any injury to people or property resulting from any ideas, methods, instructions or products referred to in the content.

