1. Introduction
The cloud computing environment allows consumers to access and utilize various resources without owning the infrastructure. The cloud environment consists of various features, such as service types, cloud protocols, and activities, as well as cloud deployment models that include public, private, community, and hybrid models. In addition, it contains three service models: software as a service (SaaS), infrastructure as a service (IaaS), and platform as a service (PaaS). Cloud consumers are given access to the resources in accordance with the service level agreement (SLA). Cloud technology enables consumers to gain several benefits, such as minimizing operating costs, improving flexibility, and increasing mobility. However, to ensure a high level of consumer satisfaction, both consumers and cloud service providers (CSPs) should consider the quality of service (QoS). Consumers pay for cloud services, whereas CSPs provide on-demand services. In general, the service contract (or SLA) specifies the cloud service’s cost based on the quantity and quality of service. According to SLA standards, identifying an effective solution for handling consumers’ requests is required even as the number of cloud consumers grows [
1]. Service providers such as Amazon and Google have introduced a variety of cloud services in response to the rapid development of cloud computing, enabling users to manage enormous datasets operating on remote servers without having to install and execute on local devices [
2].
Management of the resources required to fulfill consumer needs falls under the purview of the service provider. CSPs schedule consumer tasks and efficiently allocate computing resources by using a variety of scheduling techniques. Various kinds of pre-configured virtual machines (VMs) are used to provide these computing resources. The VM instances can be selected by consumers depending on their application needs and concerns related to cost. In a cloud environment, task-scheduling algorithms aim to support the scheduling of tasks to suitable cloud resources so that optimal performance can be attained. The execution of tasks in a particular order and how resources are allocated to tasks affect the performance of cloud systems. Through effective task scheduling and resource management, service providers seek to boost revenues and fully utilize resources.
Scheduling techniques, such as particle swarm optimization (PSO) [
3], the genetic algorithm (GA) [
4], and game theory [
5], are commonly used to schedule consumers’ tasks in a cloud environment. These tasks are managed while considering various criteria, such as the load and size of the task, the execution time, and the availability of resources [
6]. To effectively handle the resources, a resource management system that can vigorously schedule and allocate resources is required [
7]. For a specific task that will boost performance and must be finished on time, cloud consumers search for the most resources possible. Cloud services provided by different service providers differ in terms of their performance. Due to the various data centers and technologies applied, services provided by the exact service provider can also vary in terms of performance. Globally, data center capacity in different forms is quickly rising. Inadequate load balancing against available resource allocation is the primary cause of rising server interruption rates. The most commonly used criteria for evaluating cloud service performance are the QoS attributes. To address the issue of measuring cloud-based services, the Cloud Services Measurement Initiative Consortium (CSMIC) has suggested a hierarchical Standard Measurement Index (SMI) [
8]. Usability, accountability, assurance, agility, security and privacy, financial aspects, and performance are the seven categories that the framework uses to measure cloud-based services. In addition, three or more attributes are included in each category, resulting in a total of 51 sub-attributes. For instance, criteria such as accessibility, suitability, operability, learnability, client personnel requirements, installability, transparency, and understandability are used to further enhance usability.
The consumers of today encounter difficulties when trying to select the most appropriate service provider with respect to various considerations, such as available budgets, operational needs, and performance duration, due to the rapid rise of online cloud services and providers. The most suitable service provider should be determined by a consumer’s evaluation of various QoS attributes, such as dependability, security, cost, and performance. The consumer’s requirements must be matched with the features of the cloud services provided by different service providers to determine which CSP is most suitable. A thorough investigation and a reliable ranking methodology are needed to select an appropriate CSP. Since this incorporates the inherent linkages among several QoS criteria, this can be classified as a multi-criteria decision-making (MCDM) problem. Recent years have seen a tremendous increase in investigations of CSP selection while relying on the MCDM method. For example, Al-Faifi et al. [
9] applied K-means algorithms with a DEMATEL–analytic network process (ANP) to rank CSPs with respect to the interdependence among the performance measurements. Furthermore, Hussain et al. [
10] applied a hybrid method by integrating the analytic hierarchy process (AHP) with the Induced OWA (IOWA) operator to assist cloud consumers with selecting the optimal service provider. The Conditional Preference Networks (CP-nets) framework was proposed by Alashaikh and Alanazi [
11] to select the optimal CSP while considering a group of attributes with complex interdependencies.
This study explains how to evaluate all parties (CSP, resources, and tasks) by using the MCDM method. Then, the tendencies of tasks based on upper and lower thresholds are defined, and these are calculated based on the results of applying the MCDM method. Finally, a simple mechanism for optimizing the process of assigning customers’ tasks to the best available CSP/resource is adopted.
2. Related Work
In a cloud environment, different stakeholders have different interests, which presents a major challenge [
12]. Adopting techniques such as the MCDM method can help decision makers overcome these challenges. Additionally, the effectiveness and efficiency of job offloading can be enhanced by adopting MCDM methods, such as AHP [
13,
14]. Krishankumar et al. [
15] stated that the Technique for Order of Preference by Similarity to the Ideal Solution (TOPSIS) and the AHP are the most commonly adopted MCDM techniques in cloud environments. The problem of cloud task scheduling was investigated by Rafieyan et al. [
16] based on the integration of an MCDM method—namely, the Best Worst Method (BWM)—and the VIekriterijumsko KOmpromisno Rangiranje (VIKOR) (or Multi-criteria Optimization and Compromise Solution) method. Task priorities were specified by implementing the VIKOR method and by considering various levels of priorities, such as the resource, scheduling, and task levels. The authors argued that the integration of the BWM and VIKOR enhanced factors such as the waiting time, throughput, and the utilization of VMs. Lai et al. [
17] integrated the double-normalization-based multiple aggregation (DNMA) approach into the Z-number environment to overcome limitations in the existing MCDM method for CSP selection. The presented method considered various qualitative and quantitative factors, such as cost and target types, for sustainable service provider development. Lai et al. [
18] ranked different CSPs based on a combined compromise solution (CoCoSo) method. The authors introduced a maximum variance optimization framework to ensure consistent results. Neeraj et al. [
19] compared different MCDM techniques, such as TOPSIS, the AHP, VIKOR, and the Preference Ranking Organization Method for Enrichment of Evaluations (PROMETHEE) II, to find the most efficient method in terms of time consumption and robustness in a cloud environment. The results showed that the AHP and TOPSIS were equivalent in terms of robustness. Kumar et al. [
20] proposed a workflow scheduling algorithm for a cloud environment based on the integration of TOPSIS with the entropy weight method (EWM). The proposed method considered various significant criteria, such as reliability, time, cost, and energy consumption. The main objective of their study was to reduce costs, energy consumption, and execution time. Based on the VIKOR approach, Radi et al. [
21] provided a service broker policy for choosing the optimal data center in cloud computing. Through consideration of variables including cost, response time, and data center processing time, the policy sought to maximize user priorities.
A multi-criteria-based resource score heuristic for cloud workflow scheduling was introduced by Chitra [
22]. The heuristic was created with the aim of lowering the makespan while taking the probability of the physical resources’ temporal availability for the VMs into consideration. Following the creation of an initial schedule based on a priority list of tasks, the task-to-VM mapping was refined in real time to adapt to dynamic changes in the availability of cloud resources. A comparative investigation of MCDM techniques in the backfilling process for executing tasks with deadlines in a cloud environment was proposed by Nayak et al. [
23]. In the backfilling algorithm, proper resources were supplied by the backfill tasks. When there were similar tasks, some of the tasks were classified as backfill tasks, resulting in a difficult problem. The backfilling algorithm was simulated alongside the AHP, VIKOR, and TOPSIS to prevent scheduling conflicts among identical tasks. Meesariganda and Ishizaka [
24] presented a mapping/scaling technique based on the AHP to solve strategic decision problems in a cloud environment. The proposed model considered six criteria, including risk, financial benefits, core competency, and customer satisfaction. These criteria were weighted to evaluate three alternatives, which were integrated, hardware, and no entry. Achieving a QoS that met customers’ requirements within a certain cost range by using the GA was addressed by Devarasetty and Reddy [
4]. SELCLOUD is a framework proposed by Jatoth et al. [
25] to help with selecting the best CSP based on the integration of the AHP with Grey TOPSIS. An uncertainty-based approach for edge computing with balanced resource provision and cost regarding energy utilization was developed by Xu et al. [
26]. In order to accomplish cost- and energy-effective dynamic resource allocation, multi-objective dynamic allocation with balanced scheduling methods were adopted. Youssef [
27] presented a model for selecting the best CSP based on the integration of the BWM with TOPSIS. Various significant criteria, such as response time, security, maintainability, reliability, sustainability, usability, cost, and scalability, were evaluated by using BWM–TOPSIS. Kumar et al. [
28] introduced a model for selecting a suitable CSP based on the AHP integrated with TOPSIS. The authors used an AHP importance scale ranging from one to nine to determine the weight of each service provider while considering a number of attributes, such as data privacy, accuracy, assurance of data integrity, and reliability. Sun et al. [
29] evaluated the interdependence of criteria with regard to cloud service selection with criterion interactions. The interdependencies of the criteria were evaluated based on a fuzzy measure and the Choquet integral, and the importance of the criteria was determined by using pairwise comparisons. A Fuzzy–Euclidean–Taxicab-distance-based method was proposed by Garg [
30] to select the suitable cloud deployment model. The introduced model consisted of four cloud deployment models as alternatives, as well as three decision parameters that included 17 sub-parameters.
Nawaz et al. [
31] proposed a cloud broker architecture for selecting the best service provider while considering changes in cloud consumers’ preferences. The authors adopted the BWM to rank the available services, and the findings showed that better performance could be achieved when using the BWM rather than other MCDM techniques, such as the AHP. Alhubaishy and Aljuhani [
32] proposed a framework for prioritizing cloud tasks while considering consumers’ preferences by using the BWM. The proposed framework allowed consumers to evaluate a broad range of criteria with more flexibility in terms of adding or altering criteria to meet their preferences. Nazeri and Khorsand [
33] studied the management of energy consumption in a cloud environment when executing applications. The authors integrated the fuzzy AHP with TOPSIS to prioritize various cloud solutions with respect to consumers’ requirements. Malhotra et al. [
34] introduced the integer multiplication (IM) method based on the AHP as a simplified and effective prioritization technique. IM assisted cloud consumers with making quick decisions with respect to their preferences when selecting a suitable CSP. In addition, the IM method was used to evaluate important decision-making criteria, such as performance, safety, memory, and cost, as well as several sub-criteria, such as availability, reliability, throughput, power consumption, response time, and bandwidth. The authors compared the IM method’s results with those of the existing geometric mean (GM) method to prove the power of the IM method over the GM method. Saha et al. [
35] used the ANP integrated with VIKOR to determine the best CSP. The ANP is a general version of the AHP, and it allows decision makers to model decision elements in different clusters. The authors used the ANP to rank local service providers and used VIKOR for the global ranking. The ANP network contained criteria such as accountability, agility, flexibility, adaptability, security, performance, and serviceability. These criteria were evaluated with respect to different goals, such as benefits and opportunities, to rank three service providers and select the most suitable one.
Table 1 presents a comparison of several algorithms based on task rankings and when they should be used, including the GA, Ant Colony Optimization (ACO) algorithms, First Come First Service (FCFS), Short Job First Scheduling (SJF), and the BWM.
3. Framework
The proposed mechanism seeks to effectively prioritize tasks and efficiently assign them to a VM before the actual allocation of the VM to a PM. Therefore, the proposed mechanism is considered a task scheduling mechanism [
37].
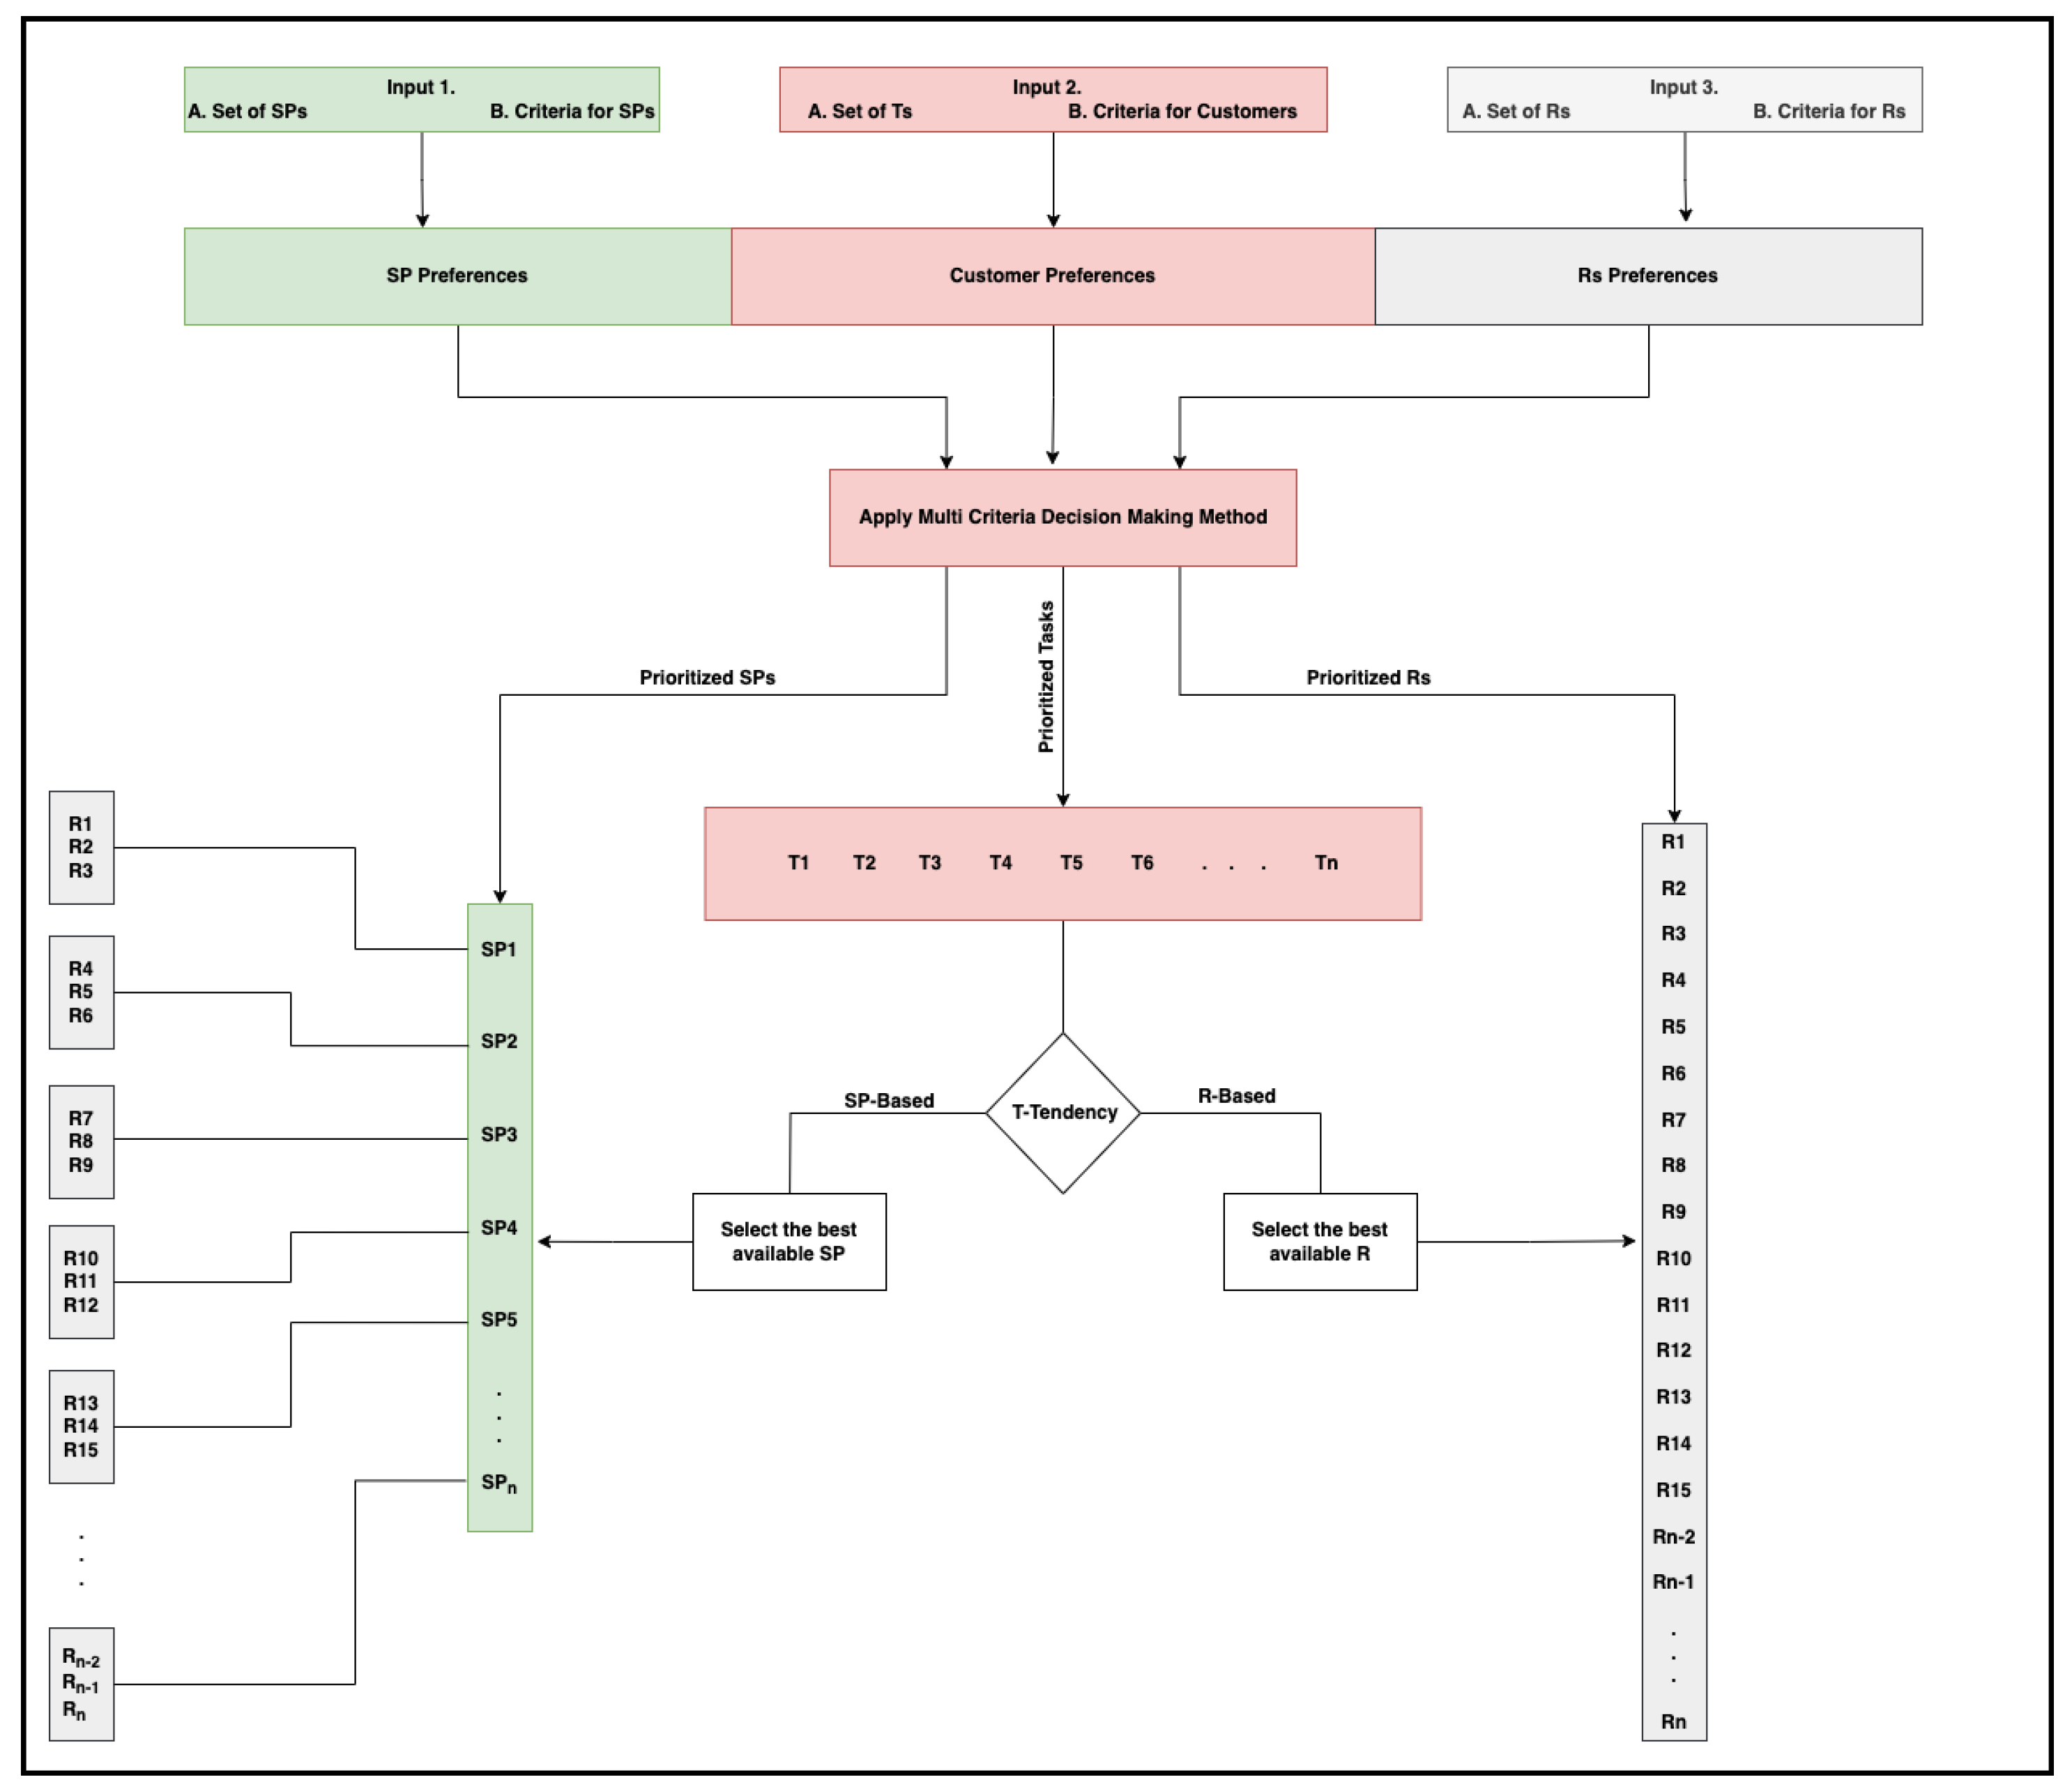
Figure 1 shows the proposed multi-criteria task scheduling mechanism. The first component of the framework consists of three sets of inputs to initiate the evaluation and assignment of tasks to the best-matched resources. The first set contains all available service providers (SPs) in the cloud, along with the set of important criteria used to evaluate the SPs. The second set contains all available tasks that the model needs to efficiently assign to the best-matched resources along with the criteria that the customer will use to evaluate the tasks. The last set of inputs contains all available resources in the cloud along with the criteria for evaluating these resources.
The second component of the framework acquires the preferences of the SPs and customers to initiate the prioritization process. These preferences are fed to the MCDM method in the next component of the framework. “Preference” refers what is more important to the SP (or customer) in order to help the framework find the best assignment. For example, one SP is more concerned with reputation than other criteria, while another SP prefers executing tasks with a high price, and so on. Similarly, one customer might prefer the execution of tasks with a low price over those requiring a short time, while another customer is more concerned with the availability of the service than the price, and so on. In the third component of the framework, the actual prioritization process takes place to provide the prioritized list of SPs, customers, and resources.
As mentioned in the literature review, various MCDM methods, such as the AHP ([
37,
38]), the ANP [
35], and the BWM [
16], have proven their ability in cloud task scheduling. Each MCDM method has its advantages and disadvantages. Regardless of the underlying MCDM, which can certainly influence the effectiveness of the framework, we consider the selection of a suitable MCDM method that occurs during the implementation phase of the proposed framework. When implementing the framework, it is important to select the MCDM method during the early stages. However, differences regarding the type of information needed from the decision maker, SP, or customer should be considered when selecting the MCDM method. For example, the AHP and ANP require the decision maker to give pairwise comparisons between each pair of criteria, while the BWM requires the decision maker to select the best criterion and the worst criterion and give pairwise comparisons between only the best and worst criteria and all other criteria. Applying an MCDM method results in prioritized sets of SPs, tasks, and resources. The main reason to have separately prioritized SPs and prioritized resources is to enable task execution based on their tendency. “Task tendency” means that if the customer’s preference shows more of a tendency toward the execution of his/her tasks, the tasks will be assigned to the best available resources among the prioritized resources, regardless of the SPs that the resources belong to. On the other hand, if the customer is more concerned with criteria related to the overall evaluation of SPs, his/her tasks will be assigned to the resources of the best available SPs. To illustrate the task tendency, suppose that the framework has three criteria for evaluating tasks: completion time, availability, and reputation. Suppose that the customer’s evaluation shows that reputation is the most important criterion (80%), followed by availability (15%) and completion time (5%). In this case, we say that the task tends to the SPs more than the resources; therefore, we assign it to the best available SPs. Suppose that the results show the completion time (70%) to be the most important, followed by reputation (20%) and availability (10%). In this case, we say that the task tends to the resources more than the SPs; therefore, we assign it to the best available resource. We propose that the threshold for measuring the tendency of the tasks be based on (1) the number of SP-based/resource-based criteria and (2) the overall weight of the criteria resulting from the MCDM method. Finally, it is important to have a suitable mechanism for managing the load among the available resources; many mechanisms have been provided, as mentioned in the literature. However, the load fairness assignment is beyond the scope of this study; therefore, we examine the proposed method without considering this issue. Algorithms 1 and 2 show the steps of prioritizing and scheduling tasks.
| Algorithm 1: Prioritization of Tasks, Service Providers, and Resources |
| Input: 1. Sets of SPs, tasks, and resources. |
| 2. Sets of criteria for SPs, tasks, and resources. |
| Output: Prioritized SPs, tasks, and resources |
| 1. Select the MCDM method. |
| 2. Each SP evaluates its overall capability, and preferences are acquired. |
| 3. Each SP evaluates tasks, and preferences are acquired. |
4. Each SP evaluates the capability/performance of its resources, and
preferences are acquired. |
| 5. Apply the selected MCDM method to each evaluation. |
| 6. Calculate the overall weight of each set of criteria. |
| 7. Prioritize SPs. |
| 8. Prioritize tasks. |
| 9. Prioritize resources. |
| Algorithm 2: Scheduling of Tasks Based on Their Tendencies |
| Input: Prioritized SPs, tasks, and resources. |
| Output: Assignment of tasks to the best available resources. |
| 1. Calculate the tendency of each task based on a certain threshold. |
2. Based on the task tendency, store each task in either the “Ts-tendency-to-SPs” list
or “Ts-tendency-to-resources” list. |
| 3. Calculate the overall ranking of tasks for the “Ts-tendency-to-SPs” list. |
| 4. Calculate the overall ranking of tasks for the “Ts-tendency-to-resources” list. |
5. Assign each task in the “Ts-tendency-to-SPs” list to a resource in the best
available SPs. |
6. Assign each task in the “Ts-tendency-to- resources” list to the resource in the
best available resources regardless of its SPs. |
4. Experimental Results and Discussion
In the beginning, the criteria for evaluating SPs, cloud resources, and tasks should be determined. As stated in the introduction, the hierarchical SMI framework proposed by the CSMIC includes seven categories, and each category consists of several sub-attributes. Based on the SMI framework, criteria such as provider business stability, provider certifications, provider personnel requirements, profit or cost sharing, reputation, and trust can be used to evaluate various CSPs. In addition, criteria such as adaptability, portability, recoverability, reliability, performance, and cost can be used to evaluate cloud resources. However, in this study, four criteria were selected to measure the tendency of each task. These criteria were reputation, trust, performance, and cost.
In experiment 1 and 2, the AHP was applied to rank a set of SPs, resources, and tasks. The AHP method was introduced by Saaty [
39] as a theory of measurement to solve complex decision problems. A pairwise comparison matrix was used to derive the ratio scale in the AHP approach. The structure of the AHP consists of three levels, which are the goal, criterion, and alternative levels. At the goal level, the objective of applying the AHP or the decision problem that needs to be solved is identified. The criterion level contains all possible criteria related to the decision problem, and this affects the alternatives. In addition, the criterion level may include sub-criteria if they are needed during the structuring of the decision problem. The alternative level includes all possible solutions that are evaluated with respect to the selected criteria to find the optimal solution. However, in order to maintain consistency of judgment, the number of alternatives should be reasonably small; therefore, the AHP was adopted in Experiments 1 and 2 to consider a suitable number of alternatives. After structuring the decision problem, consumers provide their preferences for each AHP level and assess each element in the model. The preferences are entered into the pairwise comparisons in the AHP using the fundamental scale of comparisons. The Super Decision software (Version 2.10) [
40] was used to count the aggregation judgments for the AHP and ANP.
In Experiment 3, the ANP was applied; this is a generalized version of the AHP. The ANP’s structure is based on a network that contains several nodes or clusters. Each node consists of several elements that are needed for the decision problem. These nodes represent various criteria and their sub-criteria. In addition, the ANP network should include an alternative node that contains the proposed solutions. The main difference between the ANP and the AHP is that in the ANP, the interdependence among the network elements is taken into consideration and feedback is allowed within the network structure. In the ANP, feedback means that high-node elements can be evaluated with respect to the low-node elements, and this cannot be achieved in a hierarchical structure. Similarly to the AHP, consumers’ preferences are entered into the pairwise comparisons of the ANP using the fundamental scale of comparisons. The ANP allows decision makers to maintain more consistency with a large number of elements in the network with respect to its structure; therefore, it was adopted with large numbers in Experiment 3; however, the ANP method consumes more time than the AHP due to its complicated structure.
The BWM was applied in Experiment 4 to rank several SPs, resources, and tasks. The BWM was introduced by Rezaei [
41] to overcome the heavy calculations of the AHP, which makes the BWM a light pairwise decision method. The BWM proved its power and reliability in structuring decision problems and achieving consistent results when compared with other MCDM techniques. In comparison with the AHP and ANP, the BWM allows decision makers to include large numbers of decision elements while maintaining consistency and simplicity by reducing the number of computations needed. Therefore, the BWM was adopted in Experiment 4 with a larger number of elements than in the other experiments, and the Solver Linear BWM was used to calculate the judgments for the BWM adoption. The idea of the BWM is to compare the best attribute with all other attributes and to compare the worst attribute with all other attributes. Thus, the decision makers should determine the best and worst attributes at the beginning. The optimal weights of all attributes, including the best and worst attributes, are calculated based on the preferences that were entered by using the fundamental scale.
4.1. Experiment 1
In the first experiment, eight tasks were prioritized and assigned to the best-matched of two SPs and four resources. SPs and resources were prioritized based on the preferences of SPs, while tasks were prioritized based on the customers’ preferences. The underlying method for prioritization was the AHP.
Table 2 shows all prioritized SPs and their resources along with their weights and ranks.
The four criteria were then prioritized and ranked based on the customers’ preferences to prioritize all of the customers’ tasks. The overall results of prioritizing the criteria were found to be: reputation (0.32%), trust (0.44%), performance (0.15%), and cost (0.09%). Thus,
Table 3 shows all customers’ tasks, along with their weights and ranks.
To assign each task to either an SP or a resource in the cloud, we first needed to compute the thresholds to identify the tendency of each task. The upper threshold was considered to be the sum of all SP-based criteria weights, and the lower threshold was considered to be the sum of all R-based criteria weights. The sum of all SP-based criteria weights was 0.76 (the sum of reputation weights was 0.32, and that of trust weights was 0.44), and the sum of all R-based criteria weights was 0.24 (the sum of performance weights was 0.15, and the sum of cost weights was 0.09). Therefore, we determined all tasks for which the sum of the weights was less than the upper threshold, and we identified their tendency toward SPs. The weights of the rest of the tasks were greater than or equal to the lower threshold; therefore, their tendency was set toward resources. Note that the sum of weights considers the sum of the prioritized tasks; therefore, the rank and the threshold play important roles in determining which task tends to an SP and which does not. The results of the assignment are shown in
Table 4.
After classifying all tasks’ tendencies as either an SP-tendency or an R-tendency, we assigned each task to the best match with either the prioritized SPs or the prioritized resources. Any of the techniques mentioned earlier could be used for this assignment process. For simplicity, we assigned each task as follows.
For each
SP,
where
NTs is the number of tasks assigned to each
SP, N
SP-tendency is the number of tasks in the
SP tendency category, and
SPw is the weight of the
SP.
By applying Equation (
1), we calculated the number of tasks for each
SP. It is important to mention that the assignment process should start from the pool of the prioritized
SPs, i.e., the highest-ranked
SP down to the lowest-ranked
SP, in order to obtain efficient assignment. Similarly, tasks with the highest ranks should have the priority to be assigned to the best match among the available
SPs.
The assignment process for the second category—concerning the R-tendency—was conducted in a similar manner but by considering the pool of prioritized resources instead. Thus, we assigned each task to a resource as follows.
For each
R,
where
NTs is the number of tasks assigned to each
R, N
R-tendency is the number of tasks in the R-tendency category, and
Rw is the weight of the
R.
By applying Equation (
2), we calculated the number of tasks for each
R until we assigned all of the remaining tasks.
Table 4 shows the results, where each task was classified and assigned to a resource of a certain
SP or any other resource that could accommodate the customer’s preferences.
4.2. Experiment 2
The second experiment adopted the same underlying prioritization method, the AHP, but the difference was the increased number of SPs, resources, and tasks. The main reason for this experiment was to assess the applicability of the proposed model with a larger number of resources and tasks. An experiment was conducted to assign 12 tasks to 8 resources belonging to 5 SPs (see
Table 5).
The prioritization of tasks was acquired after prioritizing the four criteria. The results in this experiment differed and showed the following weights: reputation, 0.25%; trust, 0.40%; performance, 0.20%; cost, 0.15%.
Table 6 shows the final weights and prioritization of the 12 tasks.
The upper threshold was 0.65 and the lower threshold was 0.35, which resulted in the first five tasks tending to the SP-tendency category and seven tasks tending to the R-tendency category. Similarly, Equations (1) and (2) were adopted for the prioritized tasks, and they were matched with the best option in either the pool of prioritized SPs or the pool of prioritized resources based on each task’s tendency.
Table 7 shows the final assignment of each task with the best match.
4.3. Experiment 3
In the third experiment, we proposed the ANP as the underlying prioritization method to prioritize SPs, resources, and tasks. The experiment was conducted on 8 SPs, 12 resources, and 16 tasks.
Table 8 depicts the weights and ranks after conducting the prioritization process for the SPs’ preferences.
The calculated weights of the four prioritized criteria based on customers’ preferences were as follows: reputation, 0.51%; trust, 0.32%; performance, 0.12%; cost, 0.05%.
Table 9 shows the final weights and prioritization of the 16 tasks.
The upper threshold in this experiment was 0.83 and the lower threshold was 0.12, which, as expected, allowed more tasks to be assigned to an SP regardless of the characteristics of its resources. The results shown in
Table 10 illustrate the final assignment of all 16 tasks after applying Equations (1) and (2) to the prioritized SPs and resources.
4.4. Experiment 4
In the last experiment, we used the BWM as the underlying prioritization method to acquire the SPs’ and customers’ preferences and to prioritize 10 SPs, 16 resources, and 20 tasks. The results of adopting the BWM are shown in
Table 11.
Similarly to the previous experiments, we calculated the weights of the four criteria to prioritize the tasks accordingly. However, the result of this experiment showed different weights, which affected each task’s tendency. The weights were as follows: reputation, 0.11%; trust, 0.23%; performance, 0.38%; cost, 0.28%.
Table 12 shows the final weights and prioritization of the 20 tasks.
The upper threshold in this experiment was 0.34 and the lower threshold was 0.66, which, as expected, allowed more tasks to be assigned to a resource regardless of its SP’s characteristics. The results in
Table 13 illustrate the final assignment of all 16 tasks after applying Equations (1) and (2) to the prioritized SPs and resources.
4.5. Discussion
The results of the four experiments showed that the two algorithms were effective and correct. Regardless of the various numbers of inputs in each experiment, the main influence in the model was the underlying MCDM. Based on the conducted experiments, it is evident that each selected underlying prioritization method had a different structure for ranking and evaluating the SP and resource criteria. The AHP used in Experiments 1 and 2 used a hierarchical structure with fewer pairwise comparisons than the ANP, which was used in Experiment 3. However, the ANP allowed decision makers to represent more real problems by considering the interdependence among network elements. The time consumed by the ANP due to its complex calculations makes it less commonly used than the AHP and other ranking MCDM methods. The Super Decision software is an automated tool that can be used to facilitate calculations in both the AHP and ANP. In Experiment 4, the BWM was used as an underlying prioritization method, and the main concept of this method is to overcome the limitations of both the AHP and ANP by allowing decision makers to solve decision problems with less time and effort. The BWM depends on determining the best and worst criteria and then comparing these two over the other criteria within the decision problem with no need to evaluate each criterion with respect to all others. The maximum number of pairwise comparisons needed in the BWM is 2n − 3 comparisons, while the AHP, for example, requires n(n − 1)/2 comparisons. In this way, the number of pairwise comparisons is minimized, which makes the BWM more suitable for use with large numbers of criteria and alternatives.
It is important to mention that the model lacks the ability to infer useful information and prioritize the SPs, customers, and tasks based on historical data. Instead, the model was only tested and validated by creating sets of inputs; this could be the main threat to its validity. Therefore, validating the model with more real datasets that incorporate historical data and enabling the model to process these data to prioritize SPs, customers, and tasks can lead to an enhancement of the efficiency and the effectiveness of the model.
5. Conclusions and Future Work
This study proposed a task scheduling mechanism for properly prioritizing tasks and assigning them to various VMs before allocating them to PMs. The evaluation and task assignment process in the framework begins with three sets of inputs. All of the cloud-based SPs are included in the first set, along with a list of crucial attributes for assessing SP quality. Furthermore, the second set includes all available tasks and the criteria according to which the tasks should be evaluated by a cloud consumer. The final set of inputs includes all available cloud resources as well as the attributes used to assess them. Moreover, the proposed framework adopts an MCDM technique to prioritize different preferences and provide a prioritized list of SPs, tasks, and resources. Different MCDM techniques can be adopted in the presented framework. For example, in Experiments 1 and 2, the AHP was adopted as an MCDM, while the ANP and BWM were adopted in Experiments 3 and 4, respectively. The AHP allows decision makers to use a top-to-bottom structure, while the ANP structure depends on a network consisting of several nodes while considering elements’ interdependencies. On the other hand, the BWM structure depends on identifying the most-desired criterion and the least-desired criterion and then making a pairwise comparison with respect to these two criteria with no need to compare all of the model’s items. This reduces the time needed to evaluate each SP, resource, and task when using the BWM. The primary objective of having separately prioritized SPs and prioritized resources is to make it possible to execute tasks in accordance with their tendencies.
Future work can be carried out to extend the current model so that it includes various types of inputs. For example, a broker can accommodate historical data about the performance and other criteria of SPs and their resources to give a realistic evaluation and prioritization of all available SPs. Furthermore, the model can utilize/combine other MCDM methods to expedite the task scheduling mechanism. Finally, the model should be supplemented with a robust mechanism that assures fairness when assigning tasks, and validating this supplement with real data is important.


