Abstract
Reinforced masonry constructions and their elements must meet strength and stability requirements. These conditions determine wall structure safety during construction and operation. Safety depends on diagnostically aimed tests that check the objects’ quality or locate damages to structural elements that arise during operation. This article is focused on the experimental modal analysis research of reinforcement ceramic masonry elements. The aim of the research was to check whether it is possible to observe the damage in reinforced masonry structures and the accompanying vibration of signal transition functions by conducting pilot studies and using different types of reinforcements. The experiment was conducted on three samples of various types of reinforced brick walls. During the vibration tests, the segments were subjected to various loads, and it was observed how the increasing cracks and damage changed the courses of the measured functions of the vibration process, reflecting the damage to the segments. This made it possible to assess the variability of the vibration characteristics of the tested reinforced wall elements and the usefulness of the applied test method. The aim of the study was to check the assessed effectiveness by testing the degradation of the reinforced wall elements. The research confirmed the usefulness of the SISO methodology in identifying damages, which has been implemented in selected precast factories in Poland.
1. Introduction
Technical objects and masonry structures are exposed to high dynamic loads that appropriately reflect the vibration processes generated by them. These vibrations can affect the condition of the object, posing a threat to the integrity of the structure. The impact of vibrations on the structure manifests itself mainly in the form of additional stresses that add to the stresses of static loads. In addition, the structure is affected by other factors, including environmental influences and fatigue damage, which accelerate the deterioration of the structure. Dynamic loads can cause catastrophic effects in buildings of various types or lead to calamity failure.
In civil engineering, the vibrations accompanying any movement can be seen as harmful, beneficial and instructive phenomena. Vibrations treated as a process are primary, and their (secondary) effect is an acoustic signal treated as a longitudinal sound wave. Vibration and noise form the basis of the vibroacoustic scientific field. Contemporary buildings are accompanied by vibroacoustic phenomena, which threaten people and the environment. Trends in modern techniques and technologies consisting of increasing dynamic loads, increasing speed and dimensions and minimizing weight inevitably lead to an increase in vibration and noise. These trends, combined with the massive use of technical means, pose a threat to people, the environment and technical facilities [1,2,3,4,5].
The dynamic properties of the structure have a direct impact on the vibration level of the system, emitted noise, fatigue strength and stability of the structure. The analysis of dynamic properties in most cases encountered in practice is conducted on the basis of an analysis of the behavior of the structural model because the study of real objects is not always possible. In most applications, simple identification methods are used here, where changes in the values of m, k and c (mass, stiffness and damping) or changes in the parameters of the amplitude–frequency characteristics (spectrum) are determined. In addition, the available new methods of assessing the dynamics of structures—the finite element method and the modal analysis methods—can improve complex identification procedures [4,5,6,7,8,9].
These are relatively new tools in this area of research that are used to verify the effectiveness and improve the methodology of non-disassembly tests and to identify modern methods of obtaining and processing the vibration process aimed at assessing the quality of selected wall elements. In practice, the proposed research methodology can be used to better understand and describe the model behavior of structures under various loads, which allows for the optimization of the projection and assessment of the dangerous states of supervised objects [10,11].
New materials and technologies implemented in the construction industry as well as new construction solutions enable improvements in production efficiency and product quality, but they are often accompanied by high dynamic loads. Recently, increasing attention has been paid to this issue [12,13], particularly drawing attention to the need to improve the methods of testing the dynamic characteristics of structures, especially those accompanied by high dynamic loads. The analysis of dynamic properties most often used in practice is based on the behavior of the structure model. The structure model can be developed in the process of analytical transformations used to describe the dynamics of the system or based on the results of experiments carried out on a real object [14,15].
The analysis of the dynamic properties of objects in most cases encountered in practice is made on the basis of the analysis of the behavior of the structure model. The quality of the analysis depends on the reliability of the model, which is measured by the consistency of the behavior of the object and the model subjected to the same type of disturbances. The structure model can be created in the process of analytical transformations used to describe the dynamics of the system or based on the results of experiments performed on a real object [16,17]. The analysis of properties is carried out mainly via the analysis of the behavior of its dynamic model, which is conducted based on the analytical description of the quantities characterizing the dynamics of the system, or by using experimental methods that are conducted directly on real objects [18]. It has been proven by many authors [1,2,3,4,5,6,8,9,10,11,12,13,14,15,16,17] that it is possible to use this methodology in the research evaluation of mechanical properties in various structures. Later, authors such as those in [19,20] adapted this research methodology to civil engineering.
The purpose of this article is to conduct an experimental modal analysis according to the SISO methodology and to confirm its usefulness to identify the damages of reinforced masonry elements based on the FRF, transmittance and coherence functions in a damaged and undamaged object.
In the works of many authors [21,22,23], the possibilities of using this methodology in the evaluation of research on mechanical properties and their compositions in various structures and elements of technical mechanics have been described. Later, the authors of [24] conducted research to adapt this research methodology to civil engineering. Many years of laboratory tests and tests conducted on real building structures have resulted in the creation of a methodology dedicated to the use of materials and building elements, including masonry elements, in the testing procedures.
2. Materials and Methods
The developed field of vibration diagnostics as well as modal analysis methods used in construction are based on the vibration process and use various vibration estimators in research studies. The physical aspects of the vibration process are described in terms of time, frequency and amplitudes, giving in practice a large number of measures (often in excess) of energy flow containing substantial information about the examined processes (objects). Their practical use necessitates the extensive use of statistical methods in the development of research results for rational decision making.
The assessment of the dynamic state of machines and building structures using vibration energy propagation measures requires associating the structure features of the assessed object with a set of measures and assessments of the output processes. This is the basic content of vibration diagnostics, which is often already used in mechanical engineering and has been improved in the specificity of its use, e.g., in construction. Estimators as numerical measures of the vibration process are defined in three categories of signal description: time, frequency and amplitudes [24]. As determinate quantities reflecting the condition of the assessed material, they can be compared with the condition patterns of the tested materials and objects.
The available literature [4,9,10,22] presents definitions and properties of various vibration estimators, distinguishing eigen estimators as one signal and mutual estimators as two signals. Previous experience in the area of the vibration testing of constructions and building materials [13,15,25] indicates that certain estimators are often used to study the materials degradation.
2.1. Level of Vibration Amplitude
The most commonly used measure of the amplitude level of the vibration process is the RMS value Usk = URMS defined by the following relation.
It is a measure of the signal energy and is measured for different lifetimes (different destruction). It shows numerical changes in the quality of the destruction of the tested materials. The measurement of the effective value of the amplitude, such as displacements, velocities or accelerations, for different lifetimes of masonry elements indicates the trend of changes in a given measure, which can be used when examining the destruction of masonry elements [16,26].
2.2. Vibration Signal Correlation Function
It is a functional estimator of the signal u = (f,θ), which can be obtained by averaging the time domain and examining the interdependence between its two segments delayed by a time interval, T. It has the following form [4,27].
In practical applications, a sufficiently long observation time, T, is chosen so that the properties of the correlation estimator are independent of the averaging time, T. The necessary condition to obtain this property is the selection of T such that this time is much greater than the correlation time of process τk. The defined correlation function can take values within the range of (−1, 1). A very important and convenient property of this estimate is its relation to the power spectral density (for operational modal analysis) by Fourier transforms.
Thus, it can be seen that the correlation function and the power spectral density are the same estimators of the investigated process, but the domain of their determination is different. Therefore, certain properties of the process may be better captured in time delay domain τ than in frequency domain f.
2.3. Correlation Function
The purpose of examining the similarity of processes in two points of the material and checking whether there is only one source of vibration is to determine the correlation function. The primary vibration process (a symptom of damage) reaches measurement points x and y in two different ways through dynamic systems with impulse transition functions h1(t) and h2(t), creating new vibration processes marked x(t) and y(t) [4,12,18].
The cross-correlation function Rxy(τ), which in normalized form should be equal to one if the signals when x(t) and y(t) are the same, is defined as follows.
The cross-correlation function can be used to determine the delay time leading to important applications and the propagation paths of the signals under study.
2.4. Spectrum Density
While tracking the evolution of the vibration spectrum of the structure (wall element) from the moment of commissioning to the time of maintenance or repair, an intensive increase in the amplitude of separate bands is observed in each case. The ratio of the power contained in these bands to the total energy of the process also changes; therefore, the spectral power density of the signal should be used, which can be represented as follows:
where:
There are many methods of measuring this estimator, from simple analog filtering to advanced digital processing methods with FFT (Fast Fourier Transformation). For simple vibration evaluation applications, tunable filter analysis is quite sufficient.
2.5. FRF Function
The frequency response function (transition function) is the ratio of the spectrum of the output signal to the input signal as a function of frequency. It is a composite function and can be represented by the following formula [8,9,10]:
where denotes the response spectrum of system ; denotes input signal spectrum .
On the basis of this formula, it is possible to determine the natural frequency of the system. On the other hand, the coherence function is expressed by the following formula [10,11,12]:
where denotes the reciprocal power spectral density between input (reference) signal and exit signal (answers) ; denotes its own spectral density of input signal power ; denotes its own spectral density of response signal power . This formula describes the similarity of two signals as a function of frequency. If signals and come from the same source, the coherence function always assumes a value of 1.
Many authors of science publications [13,18,28] have proven that it is possible to use this methodology in evaluating the mechanical properties of building wall structures. Later, authors such as [15,16,19] adapted research methodology to all kinds of civil engineering constructions.
2.6. Transmitance
The dynamic properties of fixed-parameter linear systems are characterized by a pulse transition function. The block diagram of the circuit showing the dynamic properties defined based on input and output signals is shown in Figure 1.
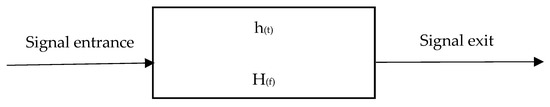
Figure 1.
A dynamical system is characterized in time domain h(t) or in frequency domain H(f).
These fully characterize the dynamic behavior (linear systems for which the superposition principle is satisfied) and are defined as the signal output–input ratio [17,18,23].
The time domain input to output transformation can be written as follows:
where y(t) and x(t) denote output and input signals; h(t) denotes the impulse transition function.
The transition function has been defined as a response of the system to the input in the form of a Dirac impulse.
The transmittance as frequency response is defined as follows:
where is the Fourier transform of the output signal; is the Fourier transform of the input signal.
The frequency characteristic (transmittance) is a complex quantity. It has a real part and an imaginary part.
The transmittance, H(jω), and the impulse response, h(t), are related to the following unambiguous relationship.
The characteristics (functional models) defined above are useful for solving many problems of analysis and synthesis. They are mainly used to perform the following:
- -
- Predict the system’s response to various inputs;
- -
- Describe the dynamics of real systems based on the ease of measurement;
- -
- Predict the effects after modifying the layout;
- -
- Identify the structure and parameters of the system.
Transmittance provides information about the behavior of materials under various loads. In this study, during the examination of masonry elements, the transfer function, changes in stiffness (real part) and damping (imaginary part) will be assessed, reflecting the changes in the destruction of the tested materials under various loads.
2.7. Eigenfrequencies
Eigen-frequencies are determined in modal experiments, the aim of which is to force the tested system to move and measure its response. On the basis of the measured values, dynamic characteristics are determined: natural frequencies and modes of vibrations. A characteristic feature of the measured characteristics is that the frequency for which the maximum value occurs is the eigenfrequency. The number of significant eigenfrequencies of the tested system is determined from stabilization diagrams obtained in special numerical procedures (Figure 2).
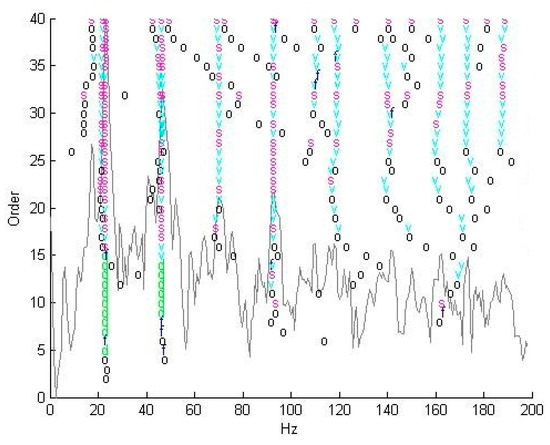
Figure 2.
Determination of natural frequency from the stabilization diagram.
Vibration measurements together with their physical interpretation are the basis for the information obtained in this study related to the destruction of selected building structures or their elements.
2.8. Coherence Function
The measure of two vibration processes x(t) and y(t) is called the coherence function defined, which is as follows [25,26,27,28].
When calculating the spectral densities for the formula given above, as a function of the density of source process u(t) and known transmittances H1(f) and H2(f), the results are as follows.
Gxy(f)= H1(f)H2(f)Guu(f)
Gxx(f)= [H1(f)]2Guu(f)
Gyy(f)= [H2(f)]2Guu(f)
From here, the following result is obtained:
The coherence function always takes the value 1 if only signals x(t) and y(t) come from the same source.
In the applications of this work, the coherence function will be smaller than unity now when any damage to the masonry element occurs. From the above calculations, it can be concluded that the coherence function has effective diagnostic properties because the appearance of a new fault signal violates the coherence of the previous ones, which reduces the coherence function.
Therefore, the coherence function, which is a local measure of the similarity of processes, has significant diagnostic properties in relation to the objects called linear and stationary in the domain of dynamic time T. Even greater possibilities of diagnostic applications of coherence functions can be found in complex systems.
Currently, research on the quality of construction segments is identified based on constructed structural models or experiments conducted on real objects. New tools in vibration research concern the possibility of using modal analysis methods for obtaining new diagnostic information.
The developed recommendations for the methodology and method of testing destruction were verified in terms of their usefulness on selected brick segments. Segments made of ceramic elements and silicate blocks were selected for verification tests, and for the purposes of the tests, they were marked depending on the execution method, which is shown in Table 1. The table also includes the determined values of the breaking force of segments on a testing machine. Considering the destructive values of the segment samples, the values of loads during the research were selected by the authors, as shown below, at the level of up to 200 kN.

Table 1.
Characteristics of tested wall segments.
The tested wall segments of ceramic bricks (as appropriately marked) were made without reinforcements, with steel mesh reinforcements, and Ruredil mesh reinforcements. Figure 3, Figure 4 and Figure 5 show the measured segment samples before and after testing. During the tests, they were subjected to a compression test to determine the failure limit of a given segment.
The samples were subjected to a variable load from the value of 0 kN to the value of the destructive force (the values of the destructive force for individual wall segments are given in Table 1). The courses of destruction from scratching to buckling to failure were observed in σ-ε diagrams. The waveform changes with respect to the value of the load force (in kN) from 0 to the failure limit allowed for the further selection of load points for each segment, and state destruction studies were carried out.
The following figures show the results of such a procedure presented successively: the excitation force waveforms; responses to the given excitations in the form of a vibration acceleration amplitude; vibration spectra of these signals; FRF waveforms; transmittance; and the coherence function.
C1 SAMPLE

Figure 3.
Ceramic brick wall segment without reinforcement, cross-section 12 × 25 cm: (a) from preparation; (b) under load; (c) destruction.
Figure 3.
Ceramic brick wall segment without reinforcement, cross-section 12 × 25 cm: (a) from preparation; (b) under load; (c) destruction.

CD1 SAMPLE

Figure 4.
Masonry segment made of ceramic bricks, cross-section 12 × 25 cm, reinforced with a steel mesh: (a) from preparation; (b) under load; (c) destruction.
Figure 4.
Masonry segment made of ceramic bricks, cross-section 12 × 25 cm, reinforced with a steel mesh: (a) from preparation; (b) under load; (c) destruction.

CR1 SAMPLE

Figure 5.
Masonry segment of ceramic bricks, cross-section 12 × 25 cm, reinforced with Ruredil mesh (a) from preparation; (b) under load; (c) destruction.
Figure 5.
Masonry segment of ceramic bricks, cross-section 12 × 25 cm, reinforced with Ruredil mesh (a) from preparation; (b) under load; (c) destruction.

3. Measurement Systems
The measurements of the vibration signal parameters were carried out using the APB-200 measurement and processing package included in the CADA-PC software. In a specific place of signal reception on the tested wall element, justified by the nature of the loads in the real walls of the building, a vibration signal was recorded in the form of a vibration acceleration amplitude. The vibration transducer was mounted in the middle of the tested segment, and the vibrations were forced with a modal hammer on the other side, each time for the recommended compressive load.
The modal test was carried out by forcing the samples to vibrate with a modal hammer. The SISO method was used in which the strokes were made at one point and the location of the response was recorded, the signal of which was received with the help of a glued piezoelectric sensor on a given wall of the sample.
SIEMENS LMS Test.Xpress measuring equipment (Figure 6) was used to measure the time histories of system excitations and responses. This software makes it easy to carry out a modal analysis of brick elements as well as any other building structures.
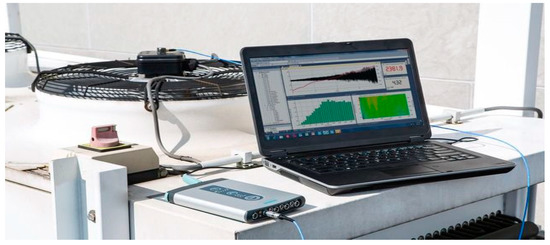
Figure 6.
SIEMENS LMS Test.Xpress measuring equipment.
As a result of the tests, the time courses of the excitation force (modal hammer) and the time courses of responses (piezoelectric sensor) were obtained, and their visualizations are presented in Figure 7.
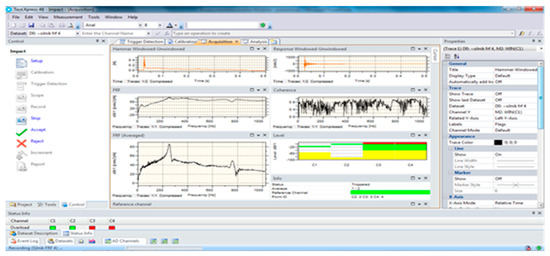
Figure 7.
Example view of measuring the time course of the vibration response as a function of time during the registration of measurements in the SIEMENS LMS Test.Xpress v.4.1 software.
The SIEMENS LMS SCADAS Recorder system is one of the most advanced measurement systems, which uses modal analysis methodology in the research of material degradation. This device is compatible with professional engineering software (Figure 8).

Figure 8.
SIEMENS LMS SCADAS Recorder.
SIEMENS LMS Test.Lab is a measurement system used for data acquisition, analysis and reporting. It includes structural and acoustic testing dedicated procedures, environmental testing and quality testing. It is used to provide data collected on real objects, and it integrates them into the simulation process. These data are described in time waveforms, stabilization diagrams, cross-power waveforms, etc. [17,28].
The condition of masonry elements should be tested via a simple and effective method, using the minimum number of measurements. This software can be used to easily conduct the modal analysis of masonry elements and any other building structures according to the developed degradation state analysis algorithm.
Correct measurement depends on obtaining the level of the exciting force that was previously determined and on the appropriate level of the response signal. Repeatable tests of waveforms concerning the measure of changes in material destruction states are the biggest advantages of the SIEMENS LMS measurement system.
4. Results
The measurement results using the vibration methodology of the tested brick segments with the use of various types of mesh reinforcement are presented below in Figure 9, Figure 10 and Figure 11.
The vibration signal measurements of tested C1 segments are shown on the X-axis.

Figure 9.
Vibration measures results for C1 segments.
Figure 9.
Vibration measures results for C1 segments.

The vibration signal measurements of tested CD1 segments are shown on the X-axis.

Figure 10.
Vibration measures results for CD1 segments.
Figure 10.
Vibration measures results for CD1 segments.

The vibration signal measurements of tested CR1 segments are shown on the X-axis.

Figure 11.
Vibration measures results for CR1 segments.
Figure 11.
Vibration measures results for CR1 segments.

The results of the fragmentary tests presented a behavioral picture of the selected masonry segments under load conditions, including their compression and buckling behavior, and mainly constituted the basis for the selection of loads for the tested segments in further vibration tests and research materials for further analyses.
The verification tests of the developed method continued on the segments for the three loads adopted from the above tests: 0 kN, the limit value of the segment failure force and the average value of the load force. The detailed values of the load forces adopted for the tests of individual wall segments are included in Table 2.
Table 2.
Numerical data for 5 signal measures for different loads on the tested segments.
The presented test results of the selected functions of the vibration signal transition through structural elements allow for qualitative assessments but do not allow for convenient quantitative inference about the change in damage and the impact of the load on the tested damage relative to wall segments. Therefore, all functional waveforms will be developed (digitized) numerically in the future, which will allow the creation of regression models that will be developed in the next stage of the authors’ research work.
5. Discussion
The generated FRF, transmittance and coherence functions show that there is a possibility to identify segment damage. This has already been shown in the graphs of vibration functions depending on the suitability or tested segment damage. There is a visible difference in the numerical values of surface areas, depending on the damage in tested reinforcement segments. This shows that by measuring the FRF, transmittance and coherence functions at various lifetimes of objects, it is possible to detect the occurring damages.
The presented test results of the selected functions of the vibration signal passage through structural elements allow for qualitative assessments but do not allow for quantitative conclusions about the change in damage and the impact of the load on the tested damage relative to wall segments. The same analyses were performed for various preferred sorts (selection of the main measure), and the final results of such an analysis are as follows:
- -
- Changes in the destruction of ceramic segments are well diagnosed by measures FRFr, H(f)r and coher;
- -
- Changes in the destruction of silicate segments are well diagnosed by measures FRFu, H(f)u and coher.
Therefore, it is possible to propose a functional method of testing changes in the state of the destruction of masonry structures (elements, segments and walls) using the EAM vibration signal and its measures FRFr, FRFu and coher. As part of further cognitive considerations, the given research procedure was implemented in several brickyards in Poland (in the Kuyavian-Pomeranian region). Due to this, it will be possible in the near future to obtain a larger number of tested and reinforced brick segments, which will help obtain a much larger test sample and allow for the development of a more detailed and dedicated procedure for determining the damage of these types of elements using non-destructive vibration methodology contained in the signal of cognitive information and showing the destruction of the tested structural elements.
6. Conclusions
The generated FRF, transmittance and coherence functions show that it is possible to identify failures of the examined segments. It has already been demonstrated in the tested vibration function’s graphic appearance, and it varies based on the damage of the tested segments. There is a visible difference in their graphical and numerical course in the tested segments of reinforcements. This proves that the FRF, transmittance and coherence functions in different periods of the life of an object (structure) are useful for detecting damage.
The achievements of the pilot laboratory studies shown above are as follows:
- Proving that the use of the modal analysis methodology is useful in determining the degradation state of reinforced structural elements;
- Showing the differences in the absolute values of the FRF function for serviceable structural brick elements reinforced with various types of meshes, as well as unreinforced brick elements, and the same type of damaged elements. Due to this numerical information, as well as graphical differences in the FRF function, it is possible to determine the visual and numerical characteristics showing the beginning of the damage stage of the tested structures;
- Showing the differences in the absolute values of the transmittance function for serviceable structural brick elements reinforced with various types of meshes, as well as unreinforced brick elements, and the same type of damaged elements. Due to this numerical information, as well as graphic differences in the course of the transfer function, it is possible to determine the visual and numerical characteristics showing the beginning of the damage stage of the tested structures.
- Showing the differences in the absolute values of the coherence function for serviceable structural brick elements reinforced with various types of meshes, as well as unreinforced brick elements, and the same type of damaged elements. Due to this numerical information, as well as graphical differences in the course of the coherence function, it is possible to determine the visual and numerical characteristics showing the beginning of the damage stage of the tested structures.
- The obtained results prove that it is possible to distinguish the state of the degradation properties of bricks, which affects the possibility of assessing their mechanical properties and the risk they pose. The test stand and operational tests confirmed the suitability of LMS devices for implementation in the operational modal analysis of real building structures.
- The practically verified sensitivity of the modal analysis satisfactorily shows the differences between the serviceable and damaged structures. It is, therefore, possible to determine the threats posed by building structures based on the study of natural frequencies and their characteristics using operational modal analysis.
Author Contributions
Conceptualization, M.Ż.; methodology, M.Ż.; validation, G.R. and P.O.; formal analysis, B.Ż. and M.Ż.; investigation, B.Ż. and M.Ż.; resources, G.R. and M.Ż.; writing—original draft preparation, M.Ż. and B.Ż.; writing—review and editing, T.W. and M.Ż.; visualization, G.R. and M.Ż. All authors have read and agreed to the published version of the manuscript.
Funding
This research received no external funding.
Institutional Review Board Statement
Not applicable.
Informed Consent Statement
Not applicable.
Data Availability Statement
Data are not publicly available. The data may be made available upon request from the corresponding author.
Conflicts of Interest
The authors declare no conflict of interest.
References
- Gupta, S.M. Support vector machines-based modelling of concrete strength. Int. J. Intel. Technol. 2007, 3, 12–18. [Google Scholar]
- Kim, J.I.; Kim, D.K. Application of neural networks for estimation of concrete strength. KSCE J. Civ. Eng. 2002, 6, 4. [Google Scholar] [CrossRef]
- Uhl, T. Computer-aided identification of mechanical structure models. WNT Sci. Technol. Publ. 1997, 3, 45–57. [Google Scholar]
- Roberts, G.W.; Meng, X.; Dodson, A.H. Integrating a Global Positioning System and Accelerometers to Monitor the Deflection of Bridges. J. Surv. Eng. 2004, 130, 65–72. [Google Scholar] [CrossRef]
- Nicoletti, V.; Arezzo, D.; Carbonari, S.; Gara, F. Expeditious methodology for the estimation of infill masonry wall stiffness through in-situ dynamic tests. Constr. Build. Mater. 2020, 262, 120807. [Google Scholar] [CrossRef]
- Li, B.; Cai, H.; Mao, X.; Huang, J.; Luo, B. Estimation of CNC Machine-tool Dynamic Parameters Based on Random Cutting Excitation Through Operational Modal Analysis. Int. J. Mach. Tools Manuf. 2013, 71, 26–40. [Google Scholar] [CrossRef]
- Żółtowski, M.; Liss, M. The use of modal analysis in the evaluation of welded steel structures. In Studies and Proceedings of Polish Association for Knowledge Management; Polskie Stowarzyszenie Zarządzania Wiedzą: Warsaw, Poland, 2016; Volume 79, pp. 233–248. [Google Scholar]
- Jain, H.; Rawat, A.; Sachan, A.K. A Review on Advancement in Sensor Technology in Structural Health Monitoring System. J. Struct. Eng. Manag. 2015, 2, 1–7. [Google Scholar]
- Żółtowski, B.; Żółtowski, M. Vibration Signals in Mechanical Engineering and Construction; ITE—PIB: Radom, Poland, 2015. [Google Scholar]
- He, C.; Xing, J.C.; Zhang, X. A New Method for Modal Parameter Identification Based on Natural Excitation Technique and ARMA Model in Ambient Excitation. Adv. Mater. Res. 2015, 1065, 1016–1019. [Google Scholar] [CrossRef]
- Żółtowski, M. Investigations of harbour brick structures by using operational modal analysis. Pol. Marit. Res. 2014, 21, 42–53. [Google Scholar] [CrossRef]
- Le, T.P.; Paultre, P. Modal identification based on the time-frequency domain decomposition of unknown-input dynamic tests. Int. J. Mech. Sci. 2013, 71, 41–50. [Google Scholar] [CrossRef]
- Reynders, E. System Identification Methods for (Operational) Modal Analysis: Review and Comparison. Arch. Comput. Methods Eng. 2012, 19, 51–124. [Google Scholar] [CrossRef]
- Yang, Y.C.; Nagarajaiah, S. Output-only modal identification with limited sensors using sparse component analysis. J. Sound Vib. 2013, 332, 4741–4765. [Google Scholar] [CrossRef]
- Powęzka, A.; Szulej, J.; Ogrodnik, P. Effect of high temperatures on the impact strength of concrete based on recycled aggregate made of heat-resistant cullet. Materials 2020, 13, 465. [Google Scholar] [CrossRef] [PubMed]
- Szulej, J.; Ogrodnik, P.; Klimek, B. Zeolite tuff and recycled ceramic sanitary ware aggregate in production of concreto. Sustainability 2019, 11, 1782. [Google Scholar] [CrossRef]
- Pan, B.; Yu, L.; Yang, Y.; Song, W.; Guo, L. Full-field transient 3D deformation measurement of 3D braided composite panels during ballistic impact using single-camera high-speed stereo-digital image correlation. Compos. Struct. 2016, 157, 25–32. [Google Scholar] [CrossRef]
- Gariboldi, E.; Naumenko, K.; Ozhoga-Maslovskaja, O.; Zappa, E. Analysis of anisotropic damage in forged Al–Cu–Mg–Si alloy based on creep tests, micrographs of fractured specimen and digital image correlations. Mater. Sci. Eng. A 2016, 652, 175–185. [Google Scholar] [CrossRef]
- Hagara, M.; Huňady, R.; Trebuňa, F. Stress Analysis Performed in the Near Surrounding of Small Hole by a Digital Image Correlation Method. Acta Mech. Slovaca 2015, 18, 74–81. [Google Scholar] [CrossRef]
- Passieux, J.C.; Navarro, P.; Périé, J.N.; Marguet, S.; Ferrero, J.F. A digital image correlation method for tracking planar motions of rigid spheres: Application to medium velocity impacts. Exp. Mech. 2014, 54, 1453–1466. [Google Scholar] [CrossRef]
- Hagara, M.; Hunady, R. The influence of sampling frequency on the results of motion analysis performed by high-speed digital image correlation. Appl. Mech. Mater. 2015, 816, 397–403. [Google Scholar] [CrossRef]
- Reu, P.L.; Rohe, D.P.; Jacobs, L.D. Comparison of DIC and LDV for practical vibration and modal measurements. Mech. Syst. Signal Process. 2017, 86, 2–16. [Google Scholar] [CrossRef]
- Ehrhardt, D.A.; Allen, M.S.; Yang, S.; Beberniss, T.J. Full-field linear and nonlinear measurements using continuous-scan laser doppler vibrometry and high speed three-dimensional digital image correlation. Mech. Syst. Signal Process. 2017, 86, 82–97. [Google Scholar] [CrossRef]
- Rutkowska, G.; Chalecki, M.; Żółtowski, M. Fly Ash from Thermal Conversion of Sludge as a Cement Substitute in Concrete Manufacturing. Sustainability 2021, 13, 4182. [Google Scholar] [CrossRef]
- Rutkowska, G.; Fronczyk, J.; Wichowski, P. Badania Możliwości Wykorzystania Popiołów Lotnych z Termicznego Przekształcania Osadów Ściekowych do Produkcji Betonów Zwykłych; Annual Set The Environment Protection; Środkowo-Pomorskie Towarzystwo Naukowe Ochrony Środowiska: Otwock, Poland, 2018; Volume 20, pp. 1113–1128. [Google Scholar]
- Rashidi, M.; Sharafi, P.; Alembagheri, M.; Bigdeli, A.; Samali, B. Operational modal analysis, testing and modelling of prefabricated steel modules with different LSF composite walls. Materials 2020, 13, 5816. [Google Scholar] [CrossRef] [PubMed]
- Żółtowski, B.; Cempel, C. Engineering of Diagnostics Machines; ITE—PIB: Radom, Poland, 2004. [Google Scholar]
- Żółtowski, M.; Martinod, R.M. Quality identification methodology applied to wall elements based on modal analysis. Civ. Eng. Athens Inst. Educ. Res. 2015, 1, 56–64. [Google Scholar]


Disclaimer/Publisher’s Note: The statements, opinions and data contained in all publications are solely those of the individual author(s) and contributor(s) and not of MDPI and/or the editor(s). MDPI and/or the editor(s) disclaim responsibility for any injury to people or property resulting from any ideas, methods, instructions or products referred to in the content. |
© 2023 by the authors. Licensee MDPI, Basel, Switzerland. This article is an open access article distributed under the terms and conditions of the Creative Commons Attribution (CC BY) license (https://creativecommons.org/licenses/by/4.0/).