Abstract
Blind Image Quality Assessment (BIQA) for synthetic and authentic distortions has attracted much attention in the community, and it is still a great challenge. The existing quality metrics are mildly consistent with subjective perception. Traditional handcrafted quality metrics can easily and directly extract low-level features, which mainly account for the outline, edge, color, texture, and shape features, while ignoring the important deep semantics of the distorted image. In the field of popular deep learning, multilevel features can be acquired easily. However, most of them either use only high-level features, ignoring the shallow features, or they simply combine features at different levels, resulting in limited prediction performance. Motivated by these, this paper presents a novel BIQA for synthetic and authentic distortions with hierarchical feature fusion in a flexible vision-Transformer framework. First, multiscale features are extracted from a strong vision-Transformer backbone. Second, an effective hierarchical feature fusion module is proposed to incorporate the features at different levels progressively. To eliminate redundant information, a simple but effective attention mechanism is employed after each fusion. Third, inspired by the human visual system, local and global features from the fusion features are extracted to represent different granularity distortions. Finally, these local and global features are mapped to the final quality score. Extensive experiments on three authentic image databases and two synthetic image datasets show that the proposed method is superior to the state-of-the-art quality metrics for both single-database testing and cross-database testing.
1. Introduction
As the main carrier of data transmission and information acquisition, images play an indispensable role in remote monitoring, medical and health care, digital entertainment, and many other fields. However, images inevitably suffer different degrees of distortion in acquisition, transmission, storage, and processing, which reduce the visual quality and limit the application scope [1,2,3,4,5,6,7]. Therefore, it is important to study how to evaluate the quality of a distorted image in order to monitor the image quality and provide reliable evaluation feedback for image processing systems. Generally, Image Quality Assessment (IQA) can be divided into two subcategories, subjective evaluation and objective evaluation. Subjective methods are the most reliable and direct, but they take a long time, are laborious, and cannot be applied to systems that require prompt feedback. The main idea of an objective evaluation is to construct a quality prediction model by extracting the quality-aware features of distorted images [8,9,10,11]. Compared with the former, it has the advantage of real-time batch processing of a large amount of data so, great efforts have been made to develop it in recent years. According to the use of clear images, objective assessment can be classified as a no-reference (blind) quality metric (NR-IQA), a reduced-reference quality metric (RR-IQA), and a full-reference quality metric (FR-IQA) [12,13,14,15,16,17,18,19,20]. In FR-IQA, in addition to the distorted image, a reference image without distortion is needed; in RR-IQA, the distorted image and some information of the clear image are needed; so, there is no complete reference image; and in NR-IQA, only the distorted image is given. In practice, there is no ideal reference image most of the time, so NR-IQA is more favored by researchers and is also the focus of this paper.
In the past decade, the research community has made great efforts, and numerous traditional NR-IQA metrics have been proposed, which can be divided into opinion-unaware and opinion-aware quality metrics. The former does not require the participation of subjective scores in the model construction. The idea is to first construct a standard quality model based on the clear images and then measure its distance from the distorted image. IL-NIQE [21], which is a typical example, extracts five types of Natural Scene Statistics (NSS) features from a series of clear images and uses these quality-aware features to learn a multivariate Gaussian model of the clear images without distortion. Then, this carefully designed model is used as a benchmark to measure the distance between distorted image blocks. The latter generally follows a two-step framework, feature extraction based on statistics and quality regression based on machine learning. A classic example is the BRISQUE, which first extracts 36 NSS features to quantify the naturalness of the distorted image in the spatial domain; then, the universal regression tool, the Support Vector Regressor (SVR), is used for quality evaluation [22]. Although the above two kinds of methods have achieved promising results in the evaluation of synthetic distortion, their performance still has room for improvement because it is difficult for handcrafted features to represent the semantic information, which is very important for the IQA. In addition, when facing authentic distortion, their performance deteriorates obviously, and satisfactory predictions are rare.
In recent years, more attention has been paid to deep-learning-based approaches, and as a result, several good algorithms have been produced. Ma et al. proposed a quality prediction model based on a multitask learning framework, called the MEON model [23]. It consisted of a distortion identification task and a quality regression task. First, the deep features were extracted based on a conventional Convolutional Neural Network (CNN). Then, the distortion identification network was trained by the image features. Finally, the quality features and the output of the distortion identification network were used to predict the visual quality. Bosse et al. proposed a weight-based quality metric, which focused on the local information of the distorted images. The local quality and local weights could be jointly learned [24]. With the support of CNN, the prediction performance of these algorithms was further improved and proved to be significantly better than the traditional handcrafted algorithms. However, most of them only used the features of a single scale, that is, the features of the highest level, and ignored the effective description of other scale features to the distortion. Therefore, this kind of method has much room for improvement. To alleviate this problem, researchers have focused on research algorithms based on multiscale features. For example, HyperNet [25] extracts deep features at each level, capturing both local and global distortions. However, multilevel features are only gathered together by a simple concatenation operation, and there is a lack of research and exploration on the relationship between levels. Compared with the former, this kind of algorithm can often obtain better performance. However, how to integrate multilevel features effectively needs further research and discussion. Although deep learning-based IQA methods have made significant progress in both synthetic and authentic distortions, there is still much room for improvement.
Inspired by the above, we propose a novel blind image quality index for synthetic and authentic distortions with hierarchical feature fusion, dubbed HFNet. First, multiscale quality-aware features are extracted in a strong vision transformer network. Then, an effective hierarchical feature fusion module is proposed to incorporate features at different levels progressively. In order for the model to focus on more important information during learning, an attention mechanism is used after each fusion process. Then, to simulate human visual characteristics, local and global features from the fusion features are extracted to represent different granularity distortions. Finally, these elaborate features are mapped to the quality of the distorted image. Extensive experiments on synthetic distortion datasets and authentic distortion datasets show the superiority of the proposed HFNet in terms of both single-database testing and cross-database testing. The contributions of the proposed HFNet are summarized as follows:
- •
- Different from the previous simple stitching-based method, the proposed HFNet gradually integrates the features of different levels; so, the low-level features to high-level features can be used to represent the different types and degrees of distortion more effectively.
- •
- It has been proved in the literature that people always view images in a combination of local and global ways in order to better understand the content of images. To simulate this visual property, we propose to extract local and global features to understand the distortion more comprehensively.
- •
- We conducted extensive experiments on both synthetic and authentic distortion datasets, and the proposed HFNet is compared with both the traditional and deep learning state-of-the-art quality metrics. The superiority of the proposed HFNet is verified by extensive experiments.
This paper consists of five sections, first introducing the motivation for this work and then describing two types of related work, providing some of the early groundwork. Then the main modules of the proposed HFNet are introduced in detail, and its performance is verified by extensive experiments. The last section summarizes this paper.
2. Related Work
In this section, the two areas most relevant to the research in this paper are briefly reviewed, blind image quality assessment and the vision transformer network. These contents are expected to help readers quickly understand the background and foundation of the research in this paper. The details are described as follows.
2.1. Blind Image Quality Assessment
Traditional quality metrics rely on extracting discriminating handcrafted features to construct prediction models. BRISQUE [22] extracts multiple sets of features to represent all kinds of distortions; thus, in theory, it can deal with all the distortions. CORNIA [26] verified the possibility of learning to distinguish the quality-aware features directly from the original pixel information and adopted unsupervised feature learning methods, soft task coding, and a maximum pooling layer to obtain image representation, which achieved good image prediction results. In [27], the authors constructed a quality evaluation method that did not require subjective scores or prior knowledge, NIQE for short. Based on codebook construction and high-order statistics aggregation, the authors constructed an image quality evaluation method called HOSA [28]. BLIINES-II [29] uses DCT coefficients as features and combines coefficients with statistical models of natural scenes to enrich the extraction of image features. Feature vectors are directly mapped to subjective scores through regression methods. The above quality metrics to study the various possible feature extraction methods used different regression strategies and tools (such as SVR and RF), but the handcrafted features do not completely conform to the vision mechanisms, and it is difficult to express image semantic information. Thus, the improvement in performance of the NR-IQA metrics was limited, so researchers began to explore quality metrics based on deep learning.
With the success of deep learning in computer vision, researchers have applied it to IQA. The research community has been working to build high-performance high-generalization quality prediction models. In [23], the authors constructed some convolutional layers as shared feature extractors and then designed distortion discriminator and quality regression subnetworks. To obtain better performance, the features of the discriminant network were integrated into the prediction network to provide more information. DeepBIQ [30] extracted image features by using the pretraining model in ImageNet and then returned the image features to the image quality score. In [31], the feature extractor consisted of several groups of residual blocks, and multilevel features were extracted by a simple encoder. Then, these multiscale features were stitched together and used as quality regression. In [32], the model extracted multiscale deep features from a CNN network to describe the macro and micro information of the images, respectively, and then predicted the quality score through full connection or traditional regression. In [33], the authors conducted quality evaluation by constructing a CNN containing some general operations. Finally, the features of different layers were fused together to obtain more distinctive features. The fusion of local and global features is not studied further for IQA in this paper. BIECON [34] first predicts the scores of the image blocks and then aggregates the scores together. In [35], a probabilistic quality representation (PQR) was proposed. During training, a more robust loss function was employed. For the distorted image, the generated adversarial network was used to generate the restored image, and the distorted image and the restored image were input into the evaluation network together to generate the quality score [36]. In [37], the paper paid more attention to the influence of the content variation of the image on the NR-IQA quality models. Some unique opinions were analyzed in the experiments. To take advantage of traditional handcrafted features, a naturalness-aware BIQA metric was designed in [38]. This metric took the prediction of the handcrafted features as a subtask to assist in the quality prediction subtask. In [39], a two-stream BIQA model was proposed for both synthetic and authentic distortions. As discussed in [39], the two-stream model was versatile and extensible. Wu et al. proposed a cascade model based on biological vision to deal with different types of distortion [40]. Based on image restoration, Pan et al. proposed a high-performance algorithm for BIQA. A restoration task was used to aid the image quality evaluation. In this restoration network, multilevel features of an encoder and decoder were extracted to account for the distortions. More recently, quality metrics based on vision transformer have also been proposed for higher performance [41].
2.2. Vision Transformer Network
VTN is derived from Transformer, and it is a encoder–decoder framework and self-attention mechanism. Due to Transformer’s remarkable achievements in Natural Language Processing (NLP), it has replaced Recurrent Neural Networks (RNN). RNN was the most used in NLP before Transformer was produced. RNN is a weak neural network for parallel computing, resulting in its inability to process very long sequences, whereas Transformer uses a self-attention structure to process sequences. Therefore, the largest advantage of Transformer compared to RNN is that it can compute in parallel.
The success of Transformer in computer vision has attracted the attention of researchers. Compared with the current mainstream network CNN, which obtains information through convolution and cannot obtain global information in a shallow network, Transformer’s multihead attention mechanism can well obtain global features. So far, the research community has conducted a series of studies around VTN, which have achieved remarkable results; for example, DETR [42] was the first proposed for end-to-end object detection with transformers. SegFormer [43] was designed based on transformers and is a semantic segmentation model. A transformer-based network called Trackformer [44] was proposed for multiobject tracking. DALL-E [45] was a transformer-based network, utilized to generate images from text. All these transformer-based methods have achieved impressive performance.
ViT [46] is one of the most popular networks out of all the Transformer-based networks and was designed to block and splice images for image classification. In view of the problem that the improved ViT needs to be trained first in the JFT-300M dataset, DeiT [47] proposed a token-based distillation strategy, which achieved good results even when only trained on ImageNet. The T2T-ViT [48] solved the problem of the ViT having a poor effect due to the redundant attention structure in the pretraining of medium data sets. PVTv1 [49] partitioned the image intensively and achieved high output resolution. At the same time, a progressively shrinking pyramid was used to reduce the computation of large feature maps. On the basis of the PVTv1, PVTv2 [50] modified the linear complexity attention layer, overlapping patch embedding and a convolutional feedforward network to reduce the computational complexity. In order to solve the deficiency of the patch embedding module, the structure of the transformer in transformer was introduced in TNT [51], and SW-MSA was designed in Swin Transformer [52].
3. Proposed Method
The use of multiscale features can effectively improve the performance of the algorithm, which has been proved in object detection and person re-identification. In addition, a desired IQA metric should simultaneously consider both the local content and the global distortion, which is also consistent with the human vision in terms of the perceptual characteristics. With these considerations in mind, as shown in Figure 1, we propose a novel Vision-Transformer-based BIQA method with hierarchical feature fusion, called HFNet. The proposed HFNet consists of four cleverly designed modules: a multiscale feature extraction module, a hierarchical feature fusion module, a local and global feature aggregation module, and a deep quality regression module. They are described in detail in the following subsections.
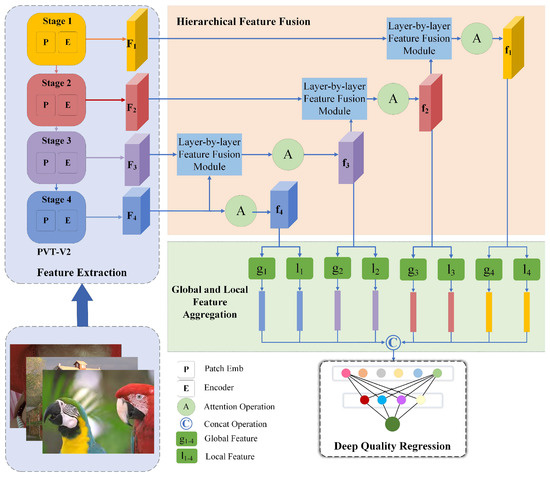
Figure 1.
The framework of the proposed metric. It consists of four elaborate modules: (1) a PVT-based multiscale feature extraction module; (2) a hierarchical feature fusion module; (3) a local and global feature aggregation module; and (4) a deep quality regression module.
3.1. Multiscale Feature Extraction
Transformer has been a great success in the field of natural language processing and has naturally attracted extensive attention from researchers in the field of computer vision. Recently, many Transformer networks have been proposed for computer vision tasks, and encouraging progress has been shown. Compared to CNN, one advantage of vision transformer is that it can freely extract the different depth global information of an image, which is vital to IQA. Inspired by this, a feature extraction module is designed in the vision transformer framework. Specifically, we use a universal Pyramid Vision Transformer v2 (PVTv2) [50], which has great advantages in both accuracy and model size.
The input of the PVTv2 is an image with a size of H×W×3, which passes through four stages and outputs four features of different scales, namely and . Each stage has a similar structure and is composed of overlapping patch embedding and a Transformer encoder. In the first stage, the input is an image, and the output is the first feature . In the other stage, the feature map obtained in the previous stage is used as input to obtain the feature map. So, at stage i, the input is feature map with the size of , which is divided into patches, each of which has a size of . Then, convolution is used to implement overlapping patch embedding, where the stride of the convolution is , the kernel size is , the padding size is , the number of kernels is , and the output size is . After that, we feed the embedded patches to a Transformer encoder, each of which is composed of a linear spatial-reduction attention (SRA) layer and a feed-forward layer.
From the above processes, we can extract the preliminary feature from the distorted image. These features contain the detailed and semantic information, which is crucial for image quality perception.
3.2. Hierarchical Feature Fusion
Features from the PVTv2 have preliminary quality perception ability, which can deal with slight distortion to a certain extent. However, they find it difficult to handle complex distortion; hence, how to effectively use these features is extremely important. A direct processing method is to perform concat operations by upsampling or downsampling features to a unified scale. The effect of this processing method is generally not good, and the features are not fused. The features of different scales contain different information, and the fusion between features can mine more useful information.
Based on the above analysis, we propose a hierarchical feature fusion module to cope with this challenge; the diagram of this module is shown in Figure 2. We adjusted the feature scale to always by deconvolution, concat the two features and then use one convolution to reduce the feature channel; finally, we used an attention module to enhance the features and obtain the fused features. Only feature does not need to be fused with the other features, and can be obtained directly through the attention operation, the size of is , and the size of is . Feature needs to be fused with the features of , and the size of is . Initially, the size of is deconvolved to . After that, the and are concated, and the size of the feature is . Then, the number of channels is reduced by a convolution. At last, the attention operation is performed to obtain the fusion feature of and , and the size of is . In the same way, the feature and are fused to obtain the fusion feature , and the size of is ; the feature and are fused to obtain the fusion feature , and the size of is . Taking the fusion of features and as an example, the whole process can be described by:
where is the deconvolution operation, is the convolution operation, and “©” denotes the concat operation.
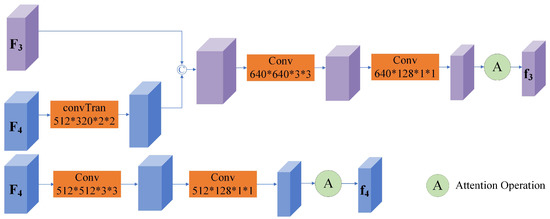
Figure 2.
The architecture of the proposed hierarchical features fusion module.
Among them, the attention module mainly included two important aspects of the feature maps, the channel-domain module and spatial-domain module; the detailed process is shown in Figure 3. The input feature map is . Firstly, the channel attention module aimed to explore “what" the image is by extruding the spatial dimension of the input feature. Two one-dimensional vectors were obtained by the maximum pooling and average pooling of the input features. The two vectors were forwarded to a shared network containing a multilayer perception and a single-layer hidden layer, and the channel was generated by mapping . Secondly, the spatial attention module was a channel axis, which squeezes the input features, focusing on the image information as the “where". The maximum pooling and average pooling operations were applied to the input features along the channel axis, and they were connected together to obtain the feature map with two channels. A convolution operation was used to obtain . In short, the attention module was computed as:
where ⨂ denotes the element-wise multiplication, and ⨁ stands for the element-wise addition. is the feature after the spatial attention manipulation. is the feature after the spatial attention and the spatial attention manipulation. denotes the feature of the final output.
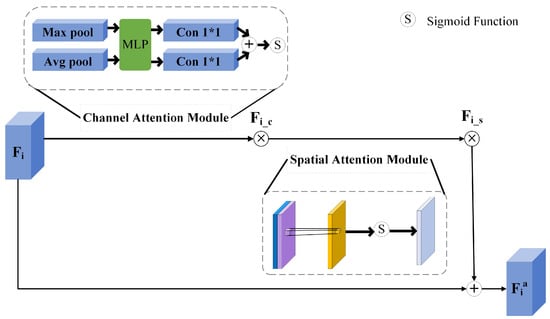
Figure 3.
The architecture of the attention module.
3.3. Local and Global Feature Aggregation
The human visual system perceives the global area roughly first and then perceives the image quality of the local area in detail [41]. To simulate this mechanism, after the process mentioned above, this module further processed the features of multisize aggregation to obtain a more robust and expressive representation. Specifically, it included two parts, the local feature extraction and the global feature extraction.
3.3.1. Local Feature Extraction
To be specific, after passing through a convolution layer, the Local Average Pooling (LAP) and the Local Max Pooling (LMP) were carried out, which are formulated as:
where denotes the local feature of , ⨁ denotes the element-wise addition, and the operation turns a parameter into a vector.
3.3.2. Global Feature Extraction
Similar to the local feature extraction, the Global Average Pooling (GAP) and the Global Max Pooling (LMP) were carried out after the convolution layer, which are formulated as:
where denotes the global feature of .
After obtaining the local representation and the global representation of the distortion, we combined these two aspects as the final distortion representation. Finally, the concat operation was performed on the local extraction feature vectors and the global extraction feature vectors .
3.4. Deep Quality Regression
How to map the extracted features to quality scores is an important part of constructing an image quality evaluation model. Most of the traditional methods use machine learning tools to complete the quality regression task. In contrast, deep-learning-based approaches can accomplish this with the help of simple fully connected layer. In this paper, the extracted deep features were input into the fully connected layer, and the number of nodes of the fully connected layer was set according to experience. Finally, we just needed to set the node to 1 as the output, namely, the predicted score. The mean square error function, which is commonly used in the field of image quality evaluation, was adopted [53,54]:
where and are the predicted score and the subjective score of the i-th image.
4. Experiments
4.1. Databases
The objective of this work was to design a high-performance BIQA metric for both the synthetic distortion and authentic distortion. Therefore, we conducted experiments on both the synthetic distortion and authentic distortion databases. To be specific, the synthetic image databases included the CSIQ [55] and the TID2013 [56]; the authentic image databases included the BID [57], the LIVE Challenge (LIVEC) [58], and the KONIQ-10k [59]. The details of these datasets are described below and are also shown in Table 1.

Table 1.
Detailed information of five distorted image databases. RIN: number of reference images; DIN: number of distorted images; DTN: number of distortion types; SST: subjective score’s type; SSR: subjective score’s range.
- The CSIQ consists of 866 synthetically distorted images, which contain a total of six distortion types. The database was rated by 25 observers, with a DMOS value ranging from 0 to 1. The higher the DMOS value, the lower the quality of the image.
- The TID2013 contains 3000 synthetically distorted images, with four times the number of distortion types of the CSIQ. The database was rated by 971 observers from five different countries with an MOS ranging from 0 to 9, with a higher MOS associated with better image quality.
- The BID was scored by about 180 observers; it is a distorted image dataset with blur. It contains 586 images with realistic blur distortions, such as the common out of focus and motion blur, etc.
- The LIVEC consists of 1162 distorted images, which were rated by 8100 observers; the MOS value of each image was averaged by 175 observers individually.
- The Konik-10k consists of 10,073 distorted images that were rated by 1459 observers. The MOS values of both databases were between 0 and 100, and the higher the MOS value, the better the image quality.
4.2. Implementation Details and Evaluation Criteria
The present mainstream framework PVTv2 was selected as the feature extractor for the experiment. PVTv2 is less computationally complex than other networks such as Swin [52] or Pyramid Vision Transformer (PVTv1) [49]; yet, it provides better performance in computing tasks. The backbone of the proposed HFNet was the PVTv2-b5, which was pretrained in Imagenet-1K [60]. The Adam optimization model with a weight decay of 5× 10⁻⁴ was used, the batch size was set to 24, the learning rate was set as 1× 10⁻⁴, and there were 16 epochs.
Spearman’s rank order correlation coefficient (SRCC) and Pearson’s linear correlation coefficient (PLCC) were adopted to measure the prediction monotonicity and the prediction accuracy. The SRCC is computed as:
where N represents the image number in the testing database, and is the difference between the i-th image’s ranks in the objective and subjective evaluations. The PLCC calculates the accuracy between the predicted scores and the ground truths, which is defined as:
where and are the i-th image’s subjective rating and the mean of the overall , respectively; and are the i-th image’s converted objective score after nonlinear regression and their mean value, respectively. The higher the two indices, the better the performance of the quality metric.
4.3. Performance Evaluation on Synthetic Distortion
In this subsection, we describe the verification of the performance of the proposed HFNet on the synthetic distortion datasets. For performance comparison, this paper selected 18 state-of-the-art BIQA algorithms to perform the same test. Among them, there were six handcrafted quality methods, including DIIVINE [61], BRISQUE [22], CORNIA [26], NIQE [27], ILNIQE [21], and HOSA [28], and 12 representative deep-learning-based quality metrics, including BIECON [34], PQR [35], WaDIaM-NR [24], RAN4IQA [36], SFA [37], NSSADNN [38], HyperNet [25], DBCNN [39], CaHDC [40], UNIQUE [62], CLRIQA [63], and VCRNet [64]. The experimental results of the synthetic image databases are shown in Table 2, where the top two results are shown in bold.
Table 2.
Experimental results of the proposed HFNet and the compared algorithms on the synthetic image databases.
It can be seen from these results that the proposed HFNet achieved excellent performance. For the CSIQ database, the proposed HFNet achieved the highest SRCC value and the second best PLCC value. The WaDIaM-NR [24] achieved comparable performance to the proposed HFNet. Further observation shows that the performance of the DBCNN and VCRNet were similar and better than other algorithms. For the TID2013 database, the proposed HFNet obtained the optimal SRCC and PLCC of 0.893 and 0.911, respectively. Although the proposed HFNet ranked first, its performance value was far lower than its performance on CSIQ database. This is not hard to understand, as the TID2013 contains more distortion types and levels, which itself is more challenging. In addition, most of the deep-learning-based quality methods were superior to the traditional handcrafted methods. From the results in the table and the above analysis, it can be seen that the proposed metric showed excellent performance in evaluating the synthetic distortion.
4.4. Performance Evaluation on Authentic Distortion
An excellent quality metric should not only achieve good performance in synthetic distortion but also evaluate authentic distortion accurately. Therefore, the performance of the proposed HFNet was evaluated on the authentic distortion datasets, which is described in this subsection. For performance comparison, the same verification was conducted by 20 representative quality metrics. Specifically, it contained the same six handcrafted quality methods as in the previous subsection and 14 deep-learning-based quality metrics, including BIECON [34], PQR [35], WaDIaM-NR [24], RAN4IQA [36], SFA [37], NSSADNN [38], HyperNet [25], DBCNN [39], CaHDC [40], UNIQUE [62], CLRIQA [63], VCRNet [64], MetaIQA+ [8], and IEIT [41]. The experimental results of the authentic image databases are shown in Table 3, where the top two results are shown in bold.
Table 3.
The experimental results of the proposed HFNet and the compared algorithms on the authentic image databases.
It can be observed from the table that the proposed HFNet achieved promising results. For the BID dataset, the HFNet was superior to all the other compared algorithms, producing 0.883 and 0.897 for the SRCC and PLCC, respectively. Although HyperNet achieved second place, both indexes were significantly lower than the two indexes of the proposed HFNet. In contrast, the other algorithms achieved only modest results. For the LIVEC, the performance of the proposed HFNet was higher than that of the other algorithms. It achieved 0.901 for the SRCC and 0.908 for the PLCC, both of which were significant improvements over the previous algorithms. The MetaIQA+ and DBCNN achieved similar results. For KonIQ-10k, both NSSADNN and the proposed HFNet showed promising results. HyperNet and MetaIQA+ achieved similar results. In addition, the traditional methods had lower results than the deep-learning-based methods in terms of the average performance. As summarized in the section on the related work, they have difficulty dealing with complex authentic distortion. From the above analysis and results, it can be confirmed that the proposed HFNet achieved a SOTA performance, which depended on the proposed hierarchical feature fusion strategy and the mechanism of simulating the human visual system.
4.5. Ablation Studies
In a quality metric, the selection of the backbone network and the design of the main modules are very important to the performance. So, we conducted an ablation studies experiment in two parts, the impact of the backbone on the performance and the local and global features on the performance.
The first part tested the effect of different versions of backbone on the performance of the proposed HFNet. According to the existing literature reports, PVT-V2 is outstanding in computer vision tasks. However, it has several different versions, depending on the network configuration. To be specific, this network included PVTv2-b0, PVTv2-b1, PVTv2-b2, PVTv2-b3, PVTv2-b4, and PVTv2-b5 [50]. The performances (SRCC and PLCC) of the different backbones on the LIVEC database are shown in Figure 4. As seen in the figure, the performance values were highest when using the PVTv2-b5 as the backbone. In contrast, the PVTv2-b0 had the worst performance due to its inadequate configuration. Based on these results, the PVTv2-b5 was selected as the backbone and was applied in all the experiments.
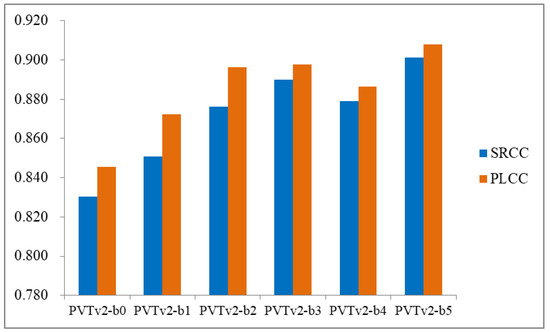
Figure 4.
The performances (SRCC and PLCC) of the different backbones on the LIVEC database.
The second part of the experiment was to study the influence of the experimental results of the local and global features in the feature fusion module. When testing the contribution of the local features to the measurement, we extracted only the local features for fusion in the fusion module but not the global features, and the opposite was true when testing the global features. The experiments were carried out on five databases, namely, two synthetic distortion databases (CSIQ and TID2013) and three authentic distortion databases (BID, LIVEC, and KONIQ-10K). The experimental results of the synthetic distortion databases are shown in Table 4, and the experimental results of the authentic distortion databases are shown in Table 5, where the best performances are shown in bold. As can be seen from the table, both the local and global features achieved a moderate performance. The performance was further improved when the two parts were combined. The results of the ablation experiments showed that the capture of both the local and global features was necessary to evaluate the image quality. Moreover, it also proved the necessity of combining the local feature and global feature in the proposed HFNet.
Table 4.
The experimental results of the local feature and the global feature on the synthetic distortion databases. Local: local feature; Global: global feature.
Table 5.
The experimental results of the local feature and the global feature on the authentic distortion databases. Local: local feature; Global: global feature.
4.6. Generalization Ability Study
An excellent quality evaluation algorithm should not only achieve good performance in the single dataset experiment but also perform well in the face of unknown distortion, which is the premise for its successful application. To this end, we tested the generalization capabilities through cross-database experiments on internal databases that were either authentic distortions or synthetic distortions. The results of the cross-database tests of the synthetic distortion are shown in Table 6, and the results of the cross-database tests of the authentic distortion are shown in Table 7.
Table 6.
The SRCC of the cross-database tests on the synthetic distortion.
Table 7.
The SRCC of the cross-database tests on the authentic distortion.
For the synthetic cross-database tests, we selected seven methods for comparison, namely DIIVINE [61], BRISQUE [22], BLIINES-II [29], HOSA [28], WaDIaM-NR [24], PQR [35], and DBCNN [39]. The proposed HFNet achieved the best performance with 0.531, when the CSIQ was the training set, and 0.823, when the TID2013 was the training set. The other compared algorithms were obviously inferior to the proposed HFNet. With the same synthetic distortion, the performance of these two cases was quite different. One of the main reasons is that the TID2013 contained more distortion types and categories, so that it was difficult for the models trained on CSIQ to obtain high performances. For the authentic distortion, the three most competitive methods, the PQR [35], the DBCNN [39], and HyperNet [25], were selected for comparison. In six authentic cross-database tests, the proposed HFNet achieved the best performance five times; in particular, the SRCC, when using the LIVEC as the training set and the BID as the testing set, was 0.045 higher than that of the second metric. From these results, it is indicated that the proposed HFNet has strong generalization ability, which is desired in real-world applications.
5. Conclusions
No-reference image quality assessment is a basic problem in the field of computer vision and also a research hotspot. The research community has put a lot of effort into building high-performance models. Despite the strides made in this field, there is still much room for improvement. To this end, we proposed a novel blind image quality index for synthetic and authentic distortions with hierarchical feature fusion. The underlying idea of the proposed metric was to simulate the hierarchical information processing mechanism and the local and global combination mechanism of the human visual system. A flexible vision transformer framework was used to extract the preliminary features, and then an efficient fusion module was proposed to integrate the features of different scales. Unlike the previous quality metrics, not only were the features at the highest level used for quality regression, but the features at every level were used for quality regression. In order to more realistically simulate human observation, local features and global features were extracted and input into the quality regression network. Sufficient experimental results showed that the proposed metric was superior to the compared algorithms in terms of both the prediction performance and the generalization ability.
Although the proposed method achieved good performance, it cannot indicate where and what kind of distortion exists in the distorted image, which is of great concern in the industrial community. Therefore, we will study how to construct a model that can mark the distortion region and type in the future. In addition, the hierarchical feature fusion methods that are usually used on top of deep architectures, such as DCA and CCA, will be explored for more robust performance. Finally, time complexity is important for an algorithm, and it is very much expected in applications. To this end, studying lightweight CNN architectures (e.g., PCANet [65] and MDFNet [66]) will help improve the efficiency of the algorithm.
Author Contributions
Investigation, B.H.; Methodology, L.H. and T.Z.; Resources, W.Y.; Supervision, B.H.; Writing—original draft, L.H.; Writing—review and editing, J.P. All authors have read and agreed to the published version of the manuscript.
Funding
This work was supported partially by the Science and Technology Research Program of Chongqing Municipal Education Commission under Grants KJQN202201904, KJQN202100628, KJQN202200638, and KJQN201901908 and partially by the National Natural Science Foundation of China under Grant 62101084.
Institutional Review Board Statement
Not applicable.
Informed Consent Statement
Informed consent was obtained from all subjects involved in the study.
Data Availability Statement
Not applicable.
Conflicts of Interest
The authors declare no conflict of interest.
References
- Mohan, C.; Kiran, S.; Vasudeva, V. Improved procedure for multi-focus image quality enhancement using image fusion with rules of texture energy measures in the hybrid wavelet domain. Appl. Sci. 2023, 13, 2138. [Google Scholar] [CrossRef]
- You, N.; Han, L.; Zhu, D.; Song, W. Research on image denoising in edge detection based on wavelet transform. Appl. Sci. 2023, 13, 1837. [Google Scholar] [CrossRef]
- Hu, B.; Li, L.; Liu, H.; Lin, W.; Qian, J. Pairwise-comparison-based rank learning for benchmarking image restoration algorithms. IEEE Trans. Multimed. 2019, 21, 2042–2056. [Google Scholar] [CrossRef]
- Hu, B.; Li, L.; Wu, J.; Qian, J. Subjective and objective quality assessment for image restoration: A critical survey. Signal Process. Image Commun. 2020, 85, 1–20. [Google Scholar] [CrossRef]
- Ribeiro, R.; Trifan, A.; Neves, A. Blind image quality assessment with deep learning: A replicability study and its reproducibility in lifelogging. Appl. Sci. 2023, 13, 1837. [Google Scholar] [CrossRef]
- Athar, S.; Wang, Z. Degraded reference image quality assessment. IEEE Trans. Image Process. 2023, 32, 822–837. [Google Scholar] [CrossRef]
- Ryu, J. A Visual saliency-based neural network architecture for no-reference image quality assessment. Appl. Sci. 2022, 12, 9567. [Google Scholar] [CrossRef]
- Zhu, H.; Li, L.; Wu, J.; Dong, W.; Shi, G. Generalizable no-reference image quality assessment via deep meta-learning. IEEE Trans. Circuits Syst. Video Technol. 2022, 32, 1048–1060. [Google Scholar] [CrossRef]
- Hu, B.; Li, L.; Wu, J.; Wang, S.; Tang, L.; Qian, J. No-reference quality assessment of compressive sensing image recovery. Signal Process. Image Commun. 2017, 58, 165–174. [Google Scholar] [CrossRef]
- Hu, B.; Li, L.; Qian, J. Internal generative mechanism driven blind quality index for deblocked images. Multimed. Tools Appl. 2019, 78, 12583–12605. [Google Scholar] [CrossRef]
- Wu, Q.; Li, H.; Ngan, K.; Ma, K. Blind image quality assessment using local consistency aware retriever and uncertainty aware evaluator. IEEE Trans. Circuits Syst. Video Technol. 2018, 28, 2078–2089. [Google Scholar] [CrossRef]
- Xue, W.; Zhang, L.; Mou, X.; Bovik, A. Gradient magnitude similarity deviation: A highly efficient perceptual image quality index. IEEE Trans. Image Process. 2014, 23, 684–695. [Google Scholar] [CrossRef]
- Zhang, L.; Shen, Y.; Li, H. VSI: A visual saliency-induced index for perceptual image quality assessment. IEEE Trans. Image Process. 2014, 23, 4270–4281. [Google Scholar] [CrossRef] [PubMed]
- Chang, H.; Yang, H.; Gan, Y.; Wang, M. Sparse feature fidelity for perceptual image quality assessment. IEEE Trans. Image Process. 2013, 22, 4007–4018. [Google Scholar] [CrossRef]
- Ma, L.; Li, S.; Zhang, F.; Ngan, K. Reduced-reference image quality assessment using reorganized DCT-based image representation. IEEE Trans. Multimed. 2011, 13, 824–829. [Google Scholar] [CrossRef]
- Liu, Y.; Zhai, G.; Gu, K.; Liu, X.; Zhao, D.; Gao, W. Reduced reference image quality assessment in free-energy principle and sparse representation. IEEE Trans. Multimed. 2018, 20, 379–391. [Google Scholar] [CrossRef]
- Wu, J.; Liu, Y.; Li, L.; Shi, G. Attended visual content degradation based reduced reference image quality assessment. IEEE Access 2018, 6, 12493–12504. [Google Scholar] [CrossRef]
- Zhu, W.; Zhai, G.; Min, X.; Hu, M.; Liu, J.; Guo, G.; Yang, X. Multi-channel decomposition in tandem with free-energy principle for reduced reference image quality assessment. IEEE Trans. Multimed. 2019, 21, 2334–2346. [Google Scholar] [CrossRef]
- Gu, K.; Wang, S.; Zhai, G.; Ma, S.; Yang, X.; Lin, W.; Zhang, W.; Gao, W. Blind quality assessment of tone-mapped images via analysis of information, naturalness, and structure. IEEE Trans. Multimed. 2016, 18, 432–443. [Google Scholar] [CrossRef]
- Zhu, H.; Li, L.; Wu, J.; Dong, W.; Shi, G. MetaIQA: Deep meta-learning for no-reference image quality assessment. In Proceedings of the 2020 IEEE/CVF Conference on Computer Vision and Pattern Recognition (CVPR), Seattle, WA, USA, 13–19 June 2022; pp. 14131–14140. [Google Scholar]
- Zhang, L.; Zhang, L.; Bovik, A. A feature-enriched completely blind image quality evaluator. IEEE Trans. Image Process. 2015, 24, 2579–2591. [Google Scholar] [CrossRef]
- Mittal, A.; Moorthy, A.; Bovik, A. No-reference image quality assessment in the spatial domain. IEEE Trans. Image Process. 2012, 21, 4695–4708. [Google Scholar] [CrossRef] [PubMed]
- Ma, K.; Liu, W.; Zhang, K.; Duanmu, Z.; Wang, Z.; Zuo, W. End-to-end blind image quality assessment using deep neural networks. IEEE Trans. Image Process. 2018, 27, 1202–1213. [Google Scholar] [CrossRef] [PubMed]
- Bosse, S.; Maniry, D.; M¨¹ller, K.; Wiegand, T.; Samek, W. Deep neural networks for no-reference and full-reference image quality assessment. IEEE Trans. Image Process. 2018, 27, 206–219. [Google Scholar] [CrossRef]
- Su, S.; Yan, Q.; Zhu, Y.; Zhang, C.; Ge, X.; Sun, J.; Zhang, Y. Blindly assess image quality in the wild guided by a self-adaptive hyper network. In Proceedings of the 2020 IEEE/CVF Conference on Computer Vision and Pattern Recognition (CVPR), Seattle, WA, USA, 13–19 June 2020; pp. 3664–3673. [Google Scholar]
- Ye, P.; Kumar, J.; Kang, L.; Doermann, D. Unsupervised feature learning framework for no-reference image quality assessment. In Proceedings of the 2012 IEEE conference on computer vision and pattern recognition, Providence, RI, USA, 16–21 June 2012; pp. 1098–1105. [Google Scholar]
- Mittal, A.; Soundararajan, R.; Bovik, A. Making a “completely blind” image quality analyzer. IEEE Signal Process. Lett. 2013, 20, 209–212. [Google Scholar] [CrossRef]
- Xu, J.; Ye, P.; Li, Q.; Du, H.; Liu, Y.; Doermann, D. Blind image quality assessment based on high order statistics aggregation. IEEE Trans. Image Process. 2016, 25, 4444–4457. [Google Scholar] [CrossRef]
- Saad, M.; Bovik, A.; Charrier, C. Blind image quality assessment: A natural scene statistics approach in the DCT domain. IEEE Trans. Image Process. 2012, 21, 3339–3352. [Google Scholar] [CrossRef]
- Bianco, S.; Celona, L.; Napoletano, P.; Schettini, R. On the use of deep learning for blind image quality assessment. Signal Image Video Process. 2018, 12, 355–362. [Google Scholar] [CrossRef]
- Kim, J.; Nguyen, A.; Ahn, S.; Luo, C.; Lee, S. Multiple level feature-based universal blind image quality assessment model. In Proceedings of the 2018 IEEE International Conference on Image Processing (ICIP), Athens, Greece, 7–10 October 2018; pp. 291–295. [Google Scholar]
- Gao, F.; Yu, J.; Zhu, S.; Huang, Q.; Tian, Q. Blind image quality prediction by exploiting multi-level deep representations. Pattern Recognit. 2018, 81, 432–442. [Google Scholar] [CrossRef]
- Sang, Q.; Wu, L.; Li, C.; Wu, X. No-reference quality assessment for multiply distorted images based on deep learning. In Proceedings of the 2017 International Smart Cities Conference (ISC2), Wuxi, China, 14–17 September 2017; pp. 6373–6382. [Google Scholar]
- Kim, J.; Lee, S. Fully deep blind image quality predictor. IEEE J. Sel. Top. Signal Process. 2017, 11, 206–220. [Google Scholar] [CrossRef]
- Zeng, H.; Zhang, L.; Bovik, A. A probabilistic quality representation approach to deep blind image quality prediction. In Proceedings of the 2018 25th IEEE International Conference on Image Processing (ICIP), Athens, Greece, 7–10 October 2018; pp. 609–613. [Google Scholar]
- Ren, H.; Chen, D.; Wang, Y. RAN4IQA: Restorative adversarial nets for no-reference image quality assessment. In Proceedings of the AAAI Conference on Artificial Intelligence (AAAI), San Francisco, CA, USA, 4–9 February 2018; pp. 7308–7314. [Google Scholar]
- Li, D.; Jiang, T.; Lin, W.; Jiang, M. Which has better visual quality: The clear blue sky or a blurry animal? IEEE Trans. Multimed. 2019, 21, 1221–1234. [Google Scholar] [CrossRef]
- Yan, B.; Bare, B.; Tan, W. Naturalness-aware deep no-reference image quality assessment. IEEE Trans. Multimed. 2019, 21, 2603–2615. [Google Scholar] [CrossRef]
- Zhang, W.; Ma, K.; Yan, J.; Deng, D.; Wang, Z. Blind image quality assessment using a deep bilinear convolutional neural network. IEEE Trans. Circuits Syst. Video Technol. 2020, 30, 36–47. [Google Scholar] [CrossRef]
- Wu, J.; Ma, J.; Liang, F.; Dong, W.; Shi, G.; Lin, W. End-to-end blind image quality prediction with cascaded deep neural network. IEEE Trans. Image Process. 2020, 29, 7414–7426. [Google Scholar] [CrossRef]
- Song, T.; Li, L.; Chen, P.; Liu, H.; Qian, J. Blind image quality assessment for authentic distortions by intermediary enhancement and iterative training. IEEE Trans. Circuits Syst. Video Technol. 2022, 32, 7592–7604. [Google Scholar] [CrossRef]
- Carion, N.; Massa, F.; Synnaeve, G.; Usunier, N.; Kirillov, A.; Zagoruyko, S. End-to-end object detection with transformers. arXiv 2020, arXiv:2005.12872,. [Google Scholar]
- Xie, E.; Wang, W.; Yu, Z.; Anandkumar, A.; Alvarez, J.; Luo, P. SegFormer: Simple and Efficient Design for Semantic Segmentation with Transformers. In Proceedings of the 2021 Neural Information Processing Systems (NeurIPS), Montreal, QC, Canada, 6–14 December; pp. 1–18.
- Meinhardt, T.; Kirillov, A.; Leal-Taixe, L.; Feichtenhofer, C. Trackformer: Multi-object tracking with transformers. In Proceedings of the IEEE/CVF Conference on Computer Vision and Pattern Recognition (CVPR), New Orleans, LA, USA, 21–24 June; pp. 8844–8854.
- Ramesh, A.; Pavlov, M.; Goh, G.; Gray, S.; Voss, C.; Radford, A.; Chen, M.; Sutskever, I. Zero-shot text-to-image generation. arXiv 2021. [Google Scholar] [CrossRef]
- Dosovitskiy, A.; Beyer, L.; Kolesnikov, A.; Weissenborn, D.; Zhai, X.; Unterthiner, T.; Dehghani, M.; Minderer, M.; Heigold, G.; Gelly, S.; et al. An image is worth 16 × 16 words: Transformers for image recognition at scale. In Proceedings of the International Conference on Learning Representations (ICLR), Venna, Austria, 4–8 May 2021; pp. 1–21. [Google Scholar]
- Touvron, H.; Cord, M.; Douze, M.; Massa, F.; Sablayrolles, A.; Jgou, H. Training data-efficient image transformers and distillation through attention. arXiv 2021. [Google Scholar] [CrossRef]
- Yuan, L.; Chen, Y.; Wang, T.; Yu, W.; Shi, Y.; Jiang, Z.; Tay, F.; Feng, J.; Yan, S. Tokens-to-token vit: Training vision transformers from scratch on imagenet. arXiv 2021, arXiv:2101.11986. [Google Scholar]
- Wang, W.; Xie, E.; Li, X.; Fan, D.; Song, K.; Liang, D.; Lu, T.; Luo, P.; Shao, L. Pyramid vision transformer: A versatile backbone for dense prediction without convolutions. In Proceedings of the 2021 IEEE/CVF International Conference on Computer Vision (ICCV), Montreal, QC, Canada, 10–17 October 2021; pp. 548–558. [Google Scholar]
- Wang, W.; Xie, E.; Li, X.; Fan, D.; Song, K.; Liang, D.; Lu, T.; Luo, P.; Shao, L. PVTv2: Improved baselines with pyramid vision transformer. Comput. Vis. Media 2022, 8, 415–424. [Google Scholar] [CrossRef]
- Han, K.; Xiao, A.; Wu, E.; Guo, J.; Xu, C.; Wang, Y. Transformer in transformer. arXiv 2021, arXiv:2103.00112. [Google Scholar]
- Liu, Z.; Lin, Y.; Cao, Y.; Hu, H.; Wei, Y.; Zhang, Z.; Lin, S.; Guo, B. Swin transformer: Hierarchical vision transformer using shifted windows. In Proceedings of the 2021 IEEE/CVF International Conference on Computer Vision (ICCV), Montreal, QC, Canada, 10–17 October 2021; pp. 9992–10002. [Google Scholar]
- Rasheed, M.; Ali, A.; Alabdali, O.; Shihab, S.; Rashid, A.; Rashid, T.; Hamad, S. The effectiveness of the finite differences method on physical and medical images based on a heat diffusion equation. J. Phys. Conf. Ser. 2021, 1999, 012080. [Google Scholar] [CrossRef]
- Abdulrahman, A.; Rasheed, M.; Shihab, S. The analytic of image processing smoothing spaces using wavelet. J. Phys. Conf. Ser. 2021, 1879, 022118. [Google Scholar] [CrossRef]
- Larson, E.; Chandler, D. Most apparent distortion: Full-reference image quality assessment and the role of strategy. J. Electron. Imaging 2010, 19, 1–21. [Google Scholar]
- Ponomarenko, N.; Jin, L.; Ieremeiev, O.; Lukin, V.; Egiazarian, K.; Astola, J.; Vozel, B.; Chehdi, K.; Carli, M.; Battisti, F.; et al. Image database TID2013: Peculiarities, results and perspectives. Signal Process. Image Commun. 2015, 30, 57–77. [Google Scholar] [CrossRef]
- Ciancio, A.; Costa, A.; Silva, E.; Said, A.; Samadani, R.; Obrador, P. No-reference blur assessment of digital pictures based on multifeature classifiers. IEEE Trans. Image Process. 2011, 20, 64–75. [Google Scholar] [CrossRef] [PubMed]
- Ghadiyaram, D.; Bovik, A. Massive online crowdsourced study of subjective and objective picture quality. IEEE Trans. Image Process. 2016, 25, 372–387. [Google Scholar] [CrossRef]
- Hosu, V.; Lin, H.; Sziranyi, T.; Saupe, D. Koniq-10k: An ecologically valid database for deep learning of blind image quality assessment. IEEE Trans. Image Process. 2020, 29, 4041–4056. [Google Scholar] [CrossRef]
- Russakovsky, O.; Deng, J.; Su, H.; Krause, J.; Satheesh, S.; Ma, S.; Huang, Z.; Karpathy, A.; Khosla, A.; Bernstein, M.; et al. Imagenet large scale visual recognition challenge. Int. J. Comput. Vis. 2015, 115, 211–252. [Google Scholar] [CrossRef]
- Moorthy, A.; Bovik, A. Blind image quality assessment: From natural scene statistics to perceptual quality. IEEE Trans. Image Process. 2011, 20, 3350–3364. [Google Scholar] [CrossRef]
- Zhang, W.; Ma, K.; Zhai, G.; Yang, X. Uncertainty-aware blind image quality assessment in the laboratory and wild. IEEE Trans. Image Process. 2021, 30, 3474–3486. [Google Scholar] [CrossRef]
- Qu, F.; Wang, Y.; Li, J.; Zhu, G.; Kwong, S. A novel rank learning based no-reference image quality assessment method. IEEE Trans. Multimed. 2022, 24, 4197–4211. [Google Scholar]
- Pan, Z.; Yuan, F.; Lei, J.; Fang, Y.; Shao, X.; Kwong, S. VCRNet: Visual compensation restoration network for no-reference image quality assessment. IEEE Trans. Image Process. 2022, 31, 1613–1627. [Google Scholar] [CrossRef] [PubMed]
- Chan, T.; Jia, K.; Gao, S.; Lu, J.; Zeng, Z.; Ma, Y. PCANet: A simple deep learning baseline for image classification. IEEE Trans. Image Process. 2015, 24, 5017–5032. [Google Scholar] [CrossRef] [PubMed]
- Aiadi, O.; Khaldi, B.; Saadeddine, C. MDFNet: An unsupervised lightweight network for ear print recognition. J. Ambient. Intell. Humaniz Comput. 2022, 18, 1–14. [Google Scholar] [CrossRef] [PubMed]
Disclaimer/Publisher’s Note: The statements, opinions and data contained in all publications are solely those of the individual author(s) and contributor(s) and not of MDPI and/or the editor(s). MDPI and/or the editor(s) disclaim responsibility for any injury to people or property resulting from any ideas, methods, instructions or products referred to in the content. |
© 2023 by the authors. Licensee MDPI, Basel, Switzerland. This article is an open access article distributed under the terms and conditions of the Creative Commons Attribution (CC BY) license (https://creativecommons.org/licenses/by/4.0/).