
Structural and Vibro-Acoustics Optimization of a Car Body Rear Part

 ,
,  ,
, 
Abstract
1. Introduction
2. Numerical Modal Analysis
2.1. FEM Model


- CTRIA3—defines a triangular plate element of the structural model. This element uses a 6 dofs (degree-of-freedoms) per node formulation;
- CQUAD4—defines a quadrilateral plate element of the structural model. This element uses a 6 dofs per node formulation;
- RIGID—defines 1D elements with 2 nodes used to model rigid connections;
- WELD—defines elements with 2 nodes used to model welded connections;
- CONCENTRATED MASS—defines 0D elements with a single node that allows the assignment of concentrated mass to the model in order to represent a physical part that may not be modeled with another FE idealization.
2.1.1. Body in White Model
2.1.2. Trimmed Body
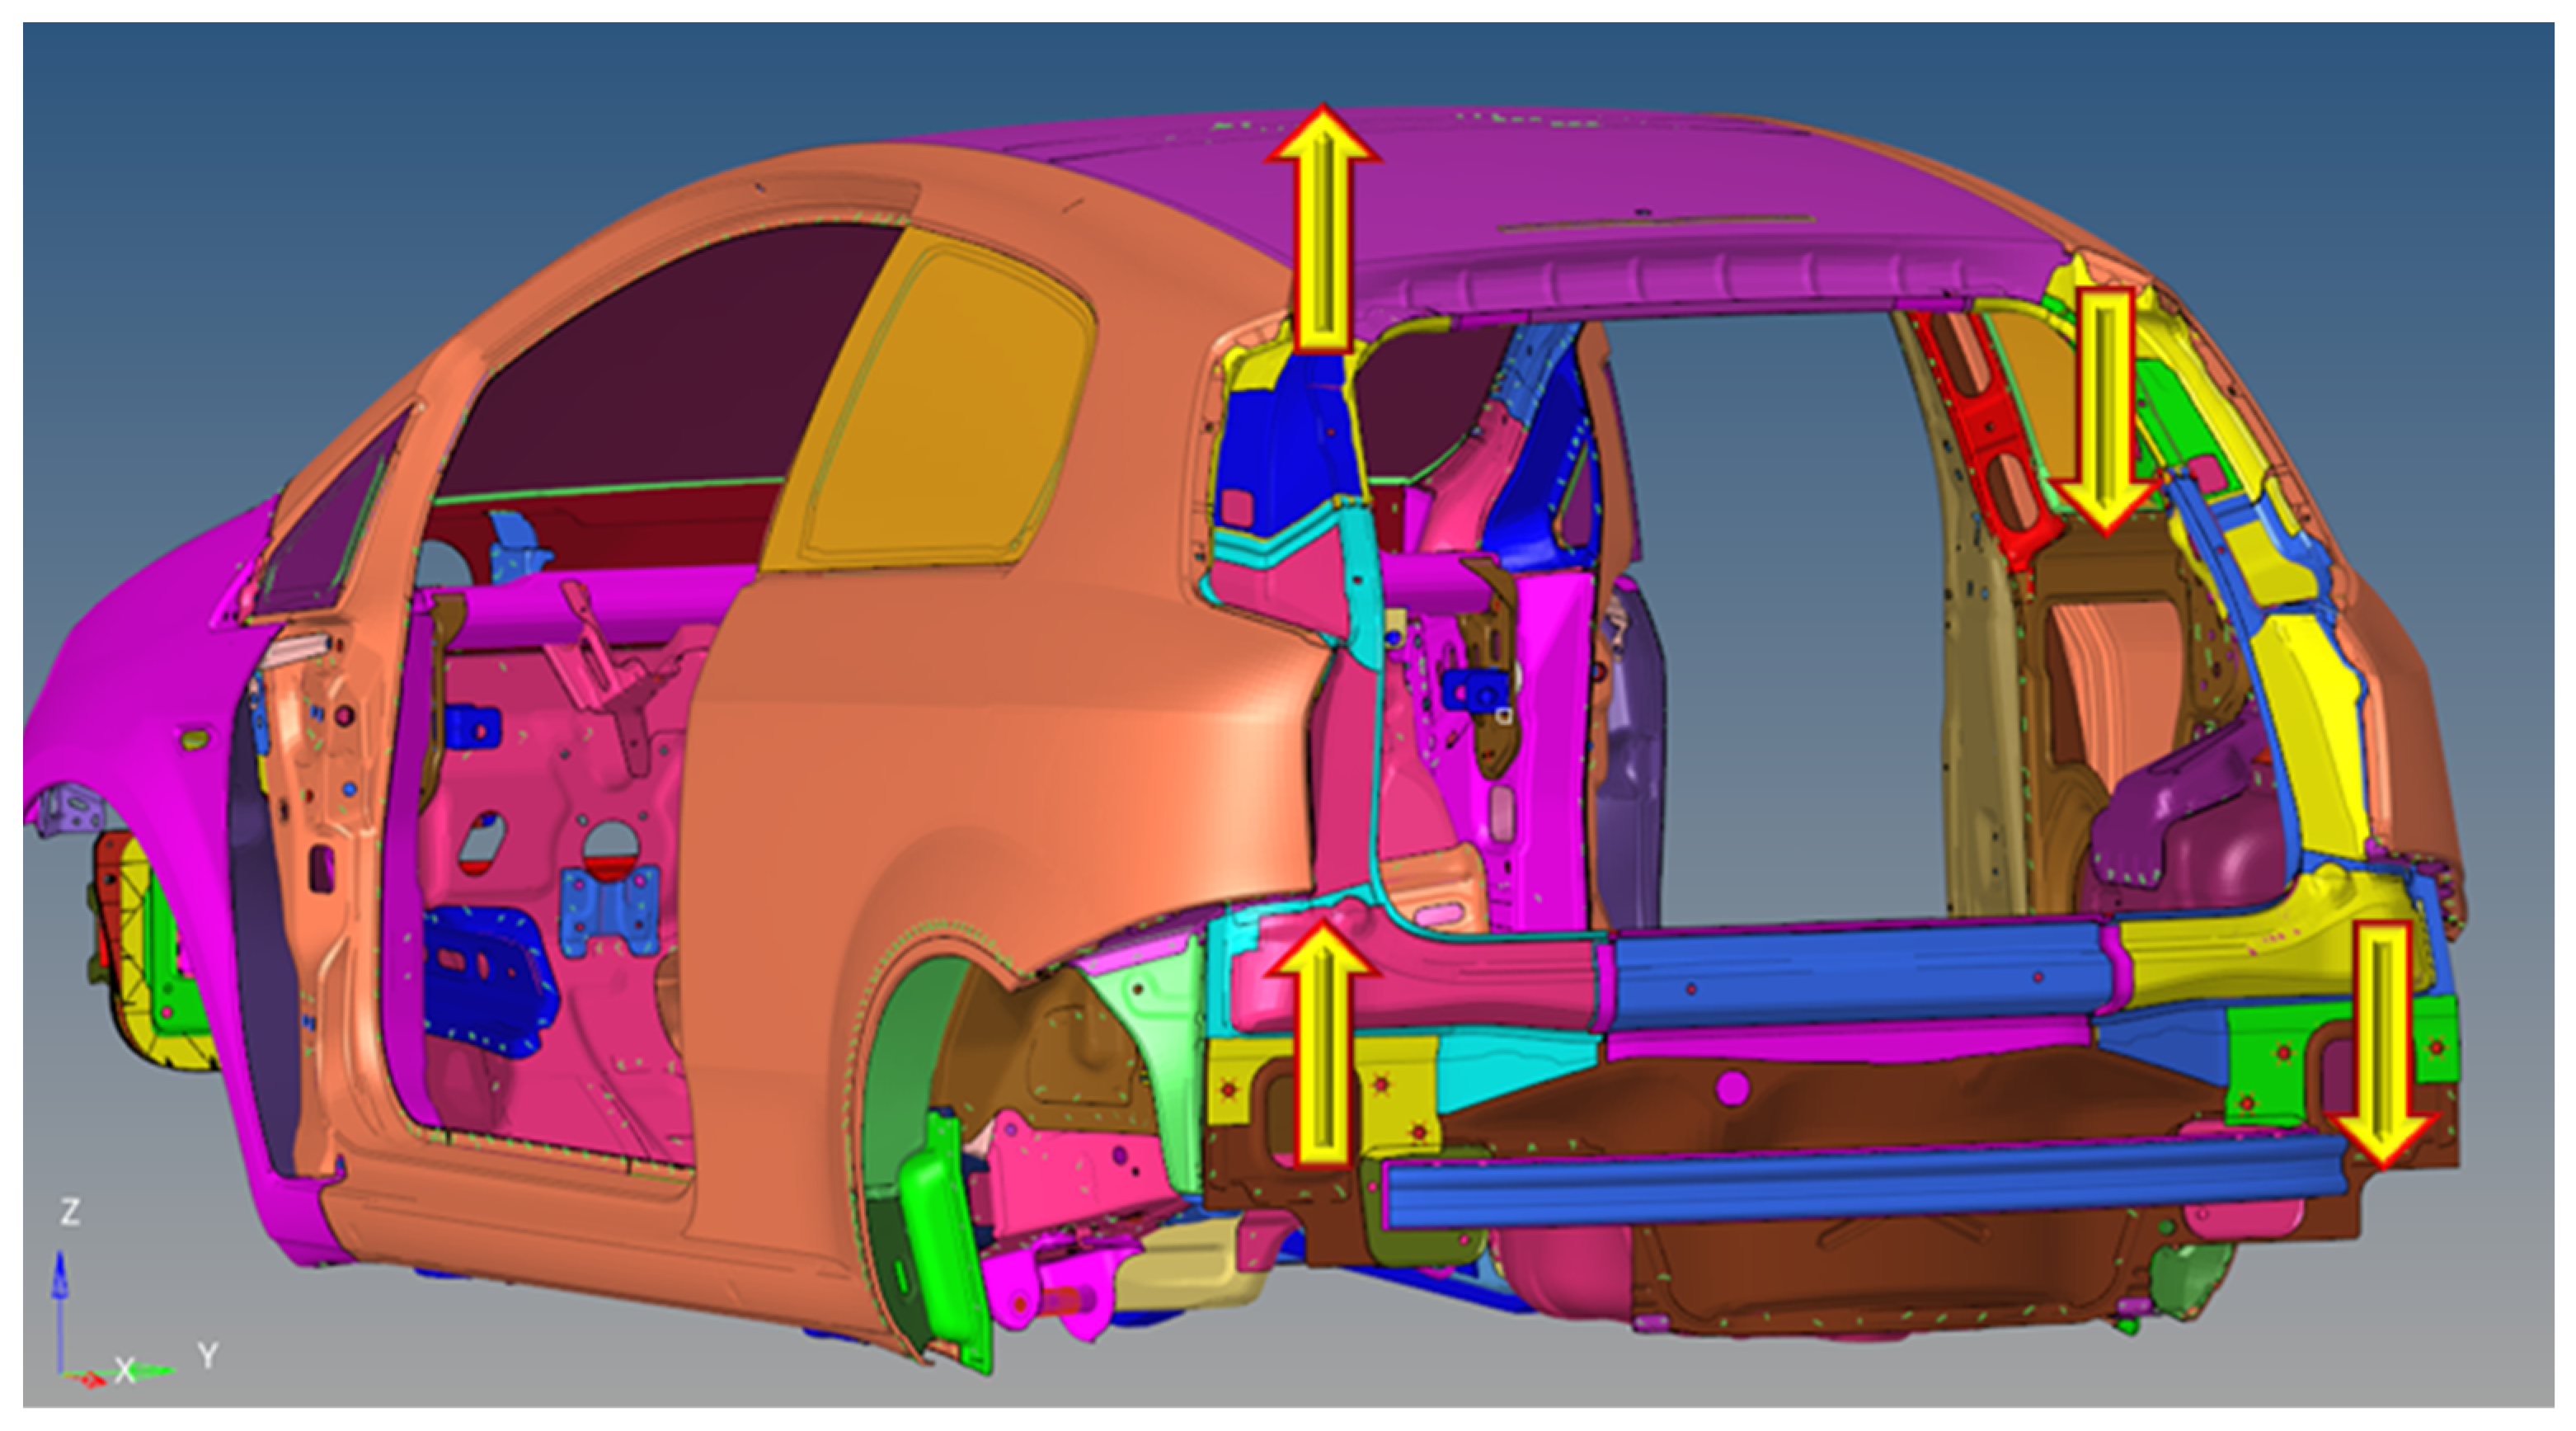
3. Sensitivity Analysis
4. Topological Optimization of the Rear Part of the Car Body
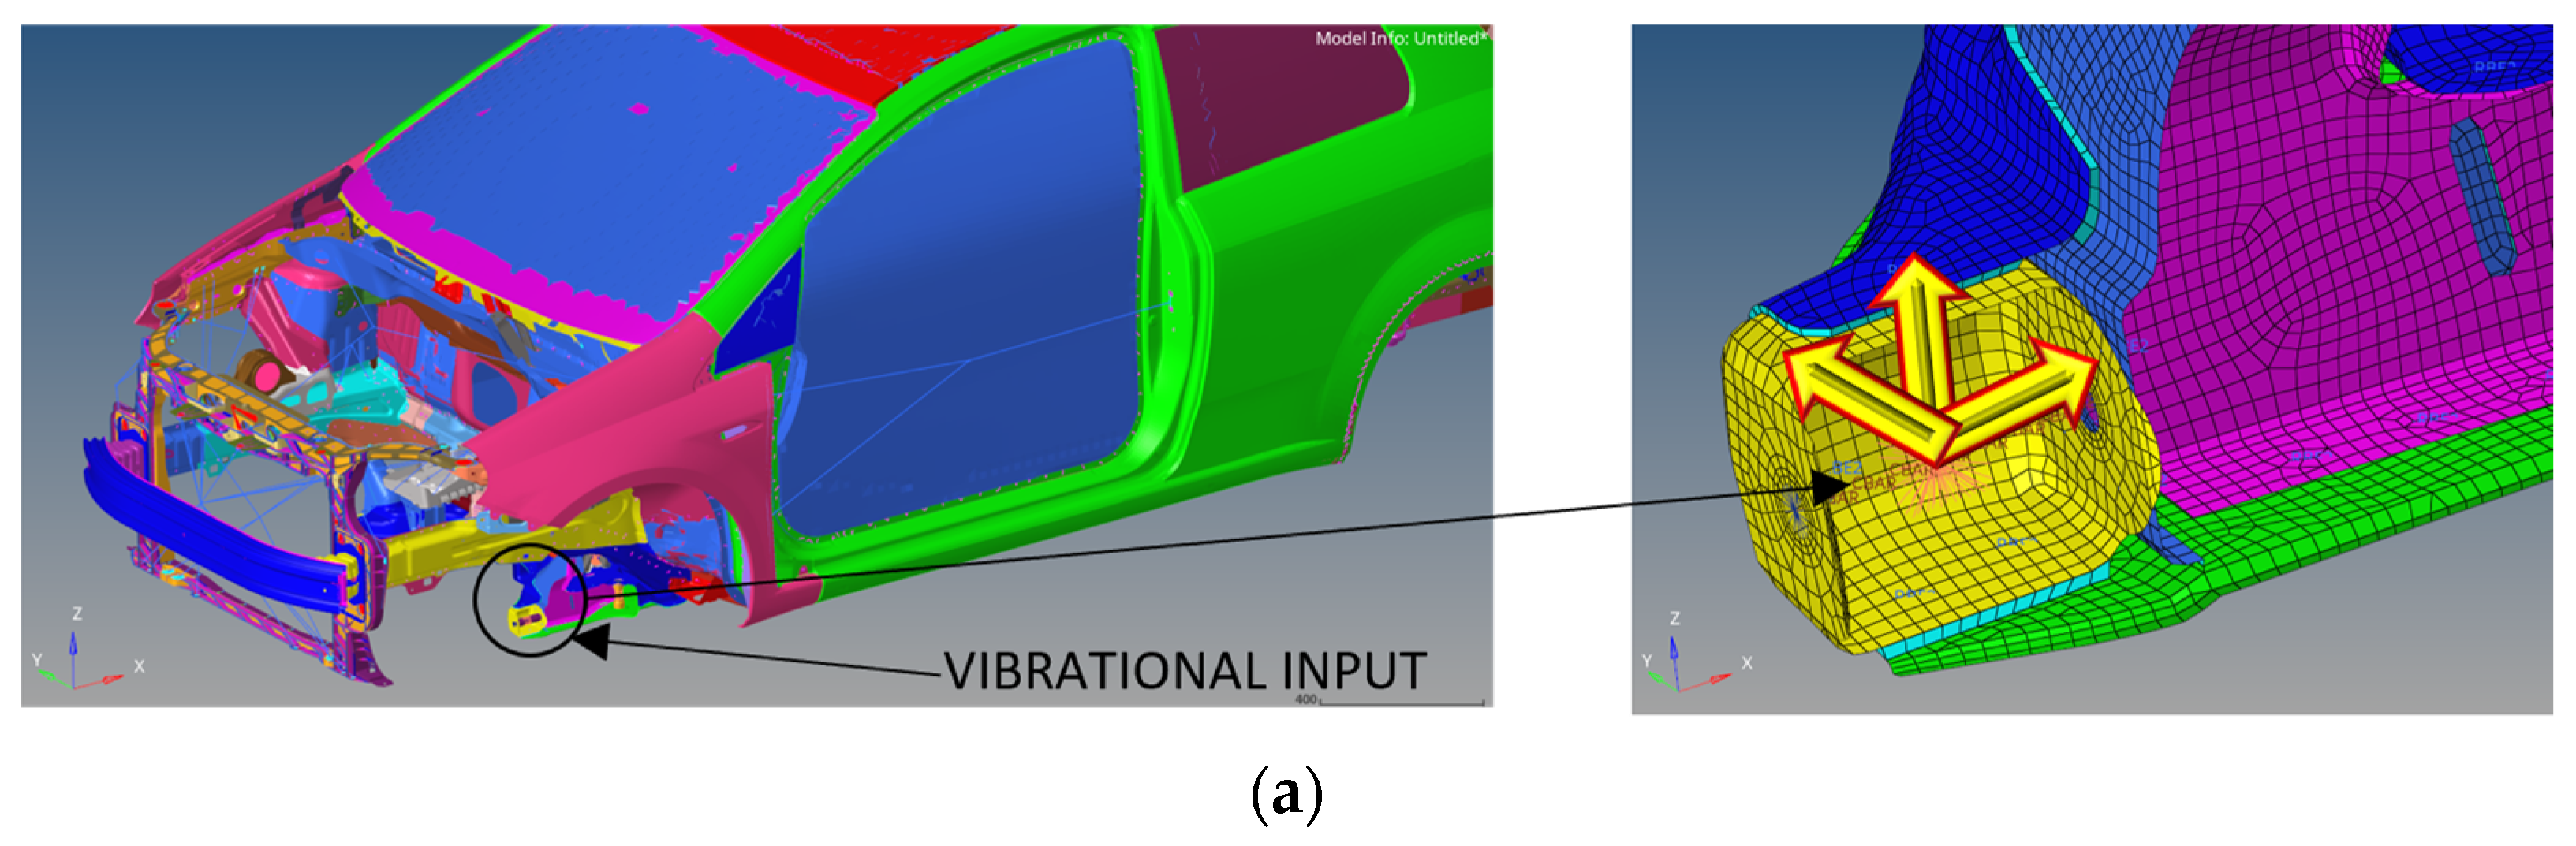
4.1. Preliminary Modeling of the Rear Part before Optimization Start
4.2. Connections of Rear Part with the Steel Structure
- -
- Using glue (Figure 11) to connect the upper part of the new rear ring with the roof, the side wings with the chassis, and, finally, the lower part of the rear car body with the rear crash bar.
- -
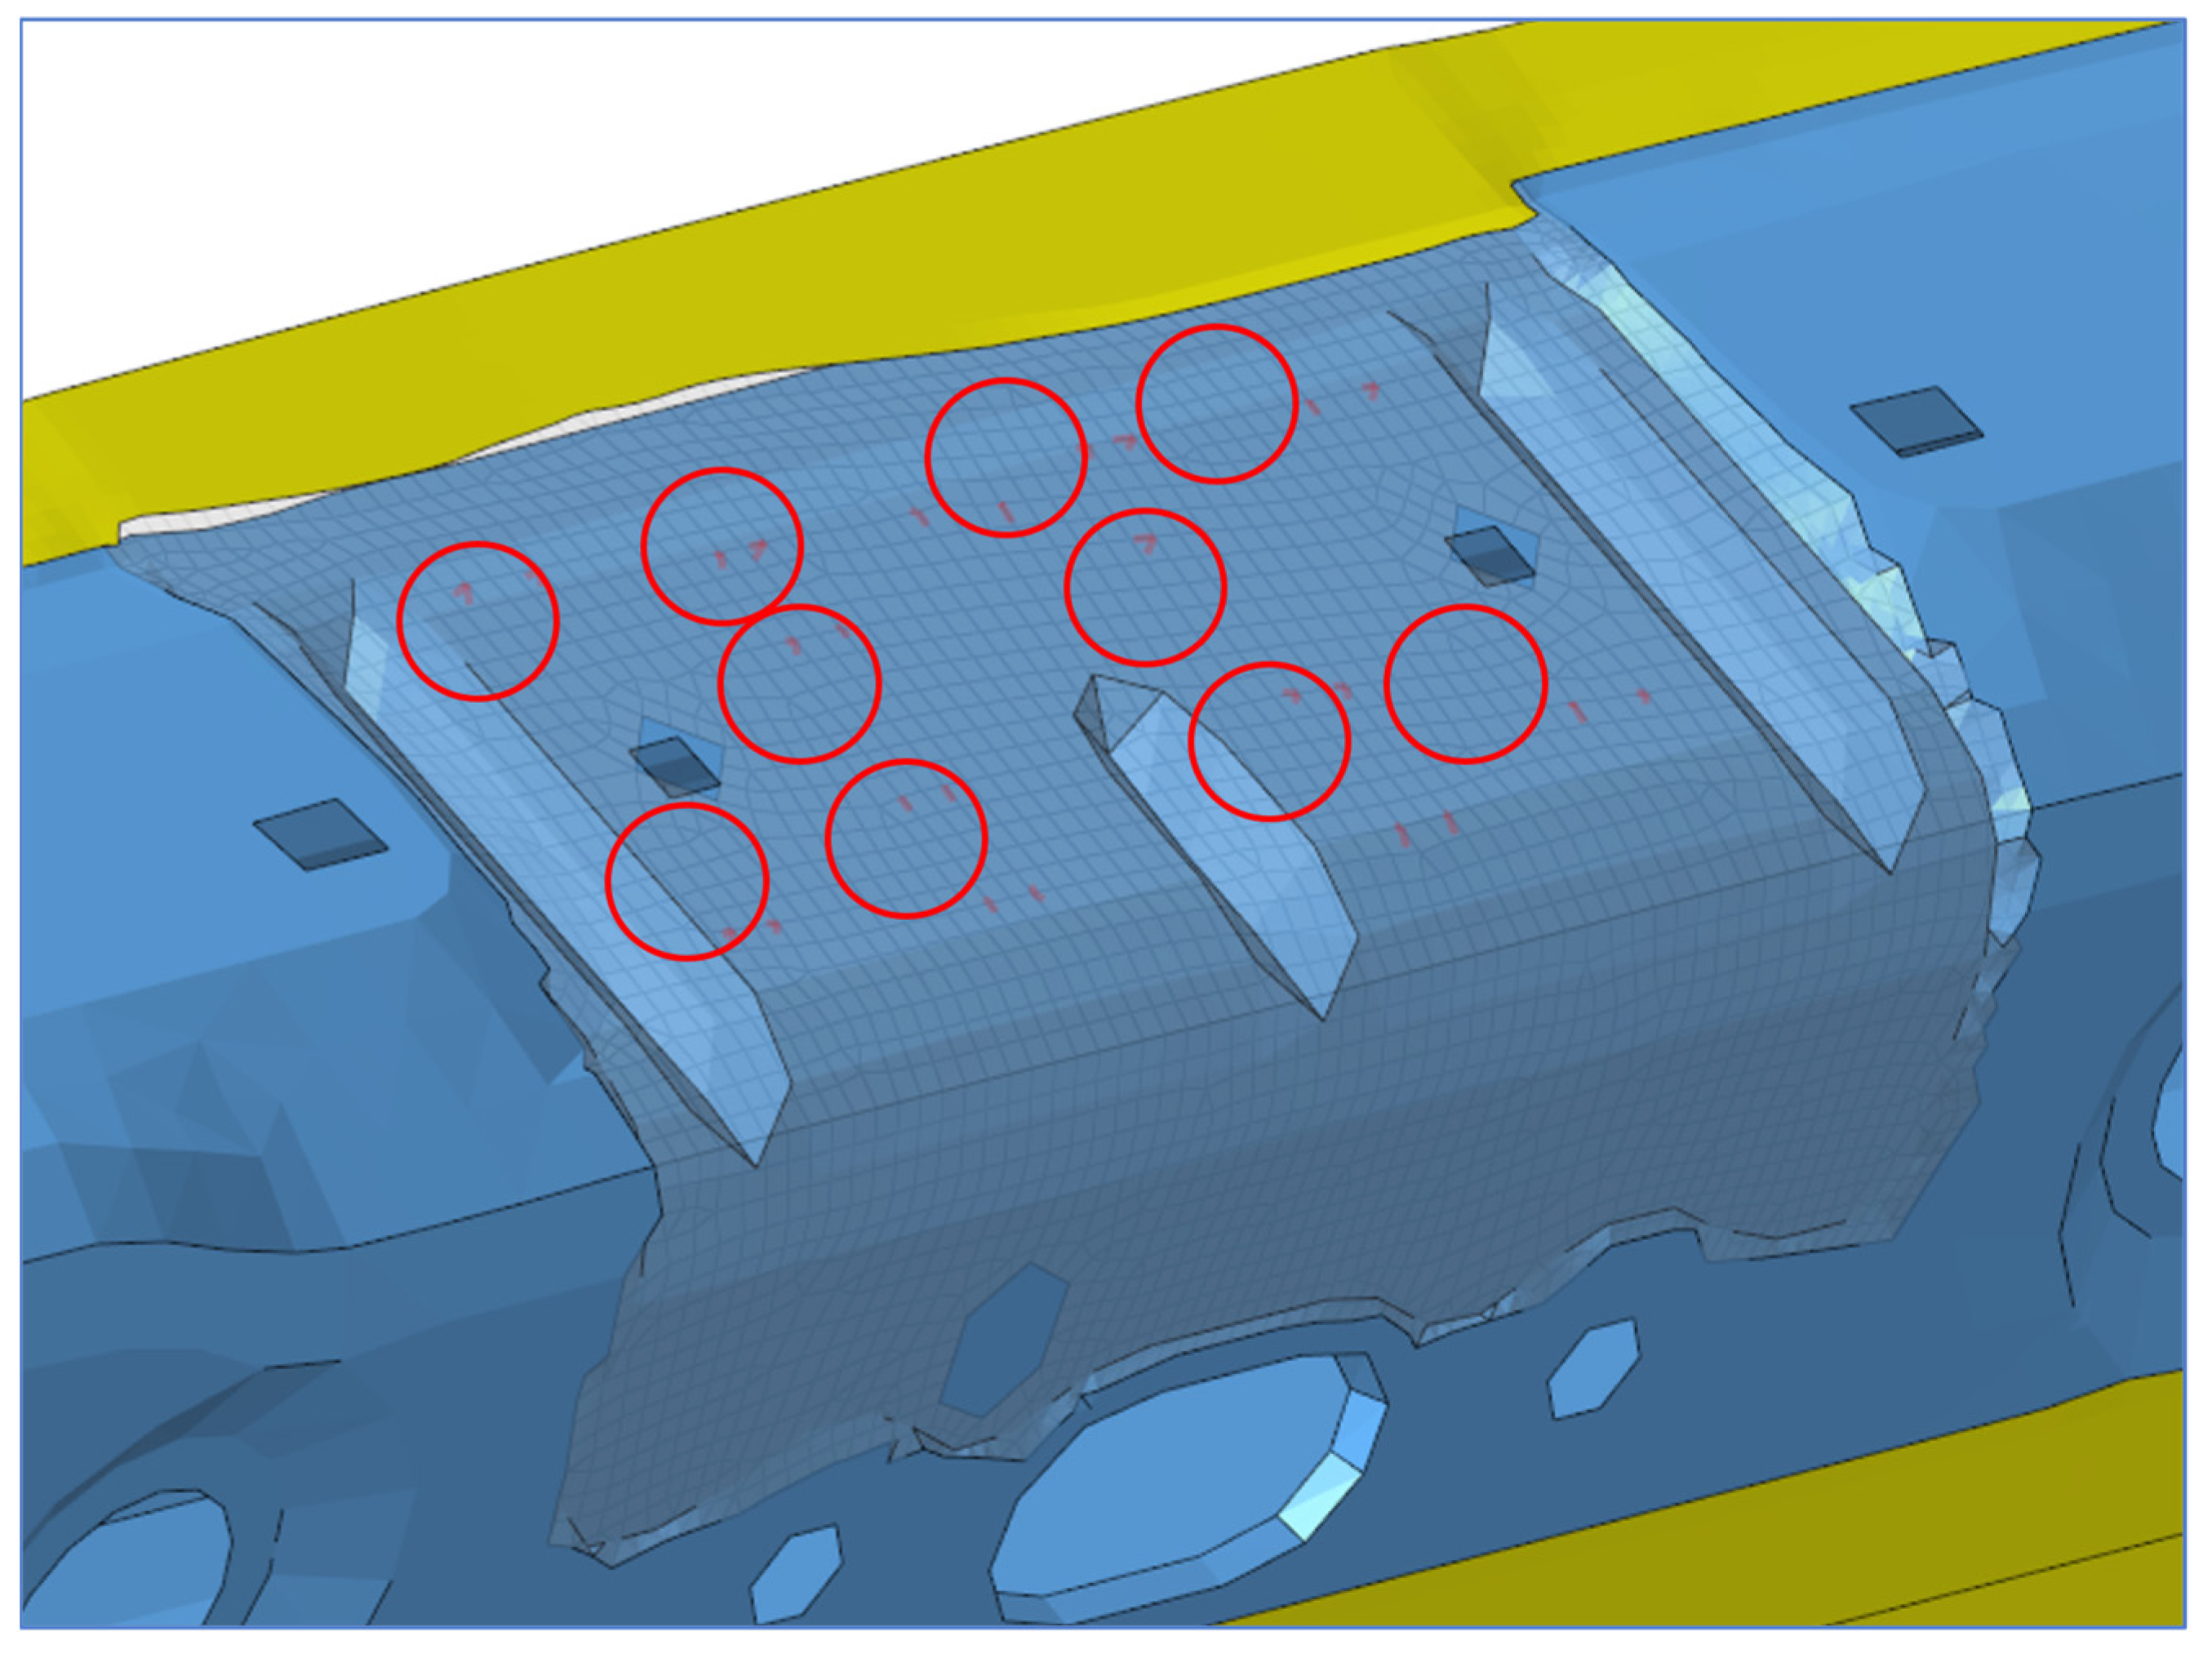
- Using screws (Figure 12) all arranged in the same direction of travel and connecting the upper, lower, and side parts. Screws were added to glue in those areas with a need for a stiffer connection.
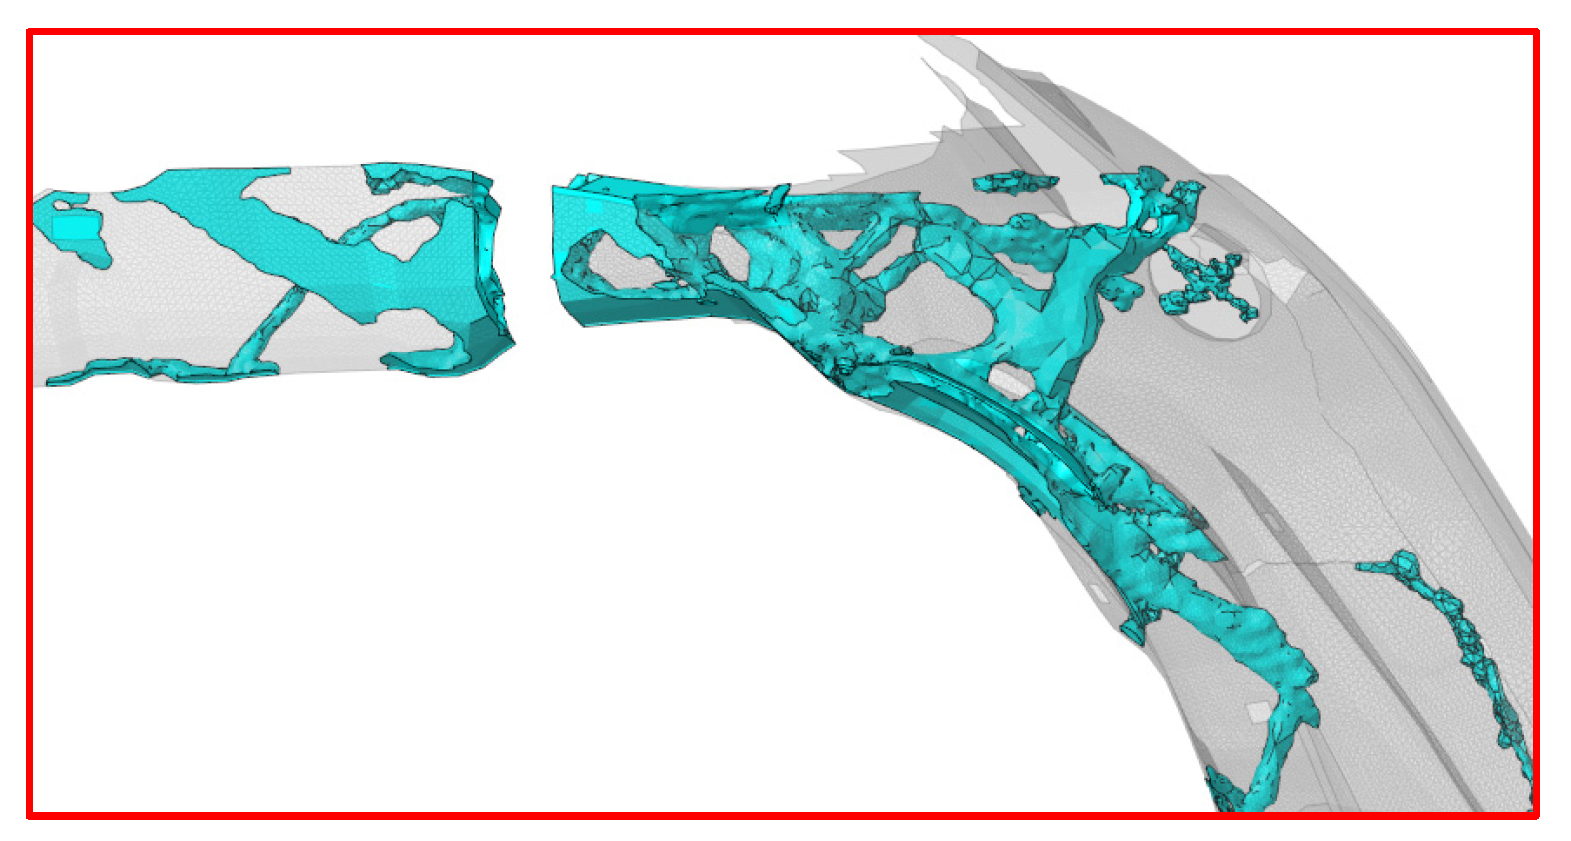
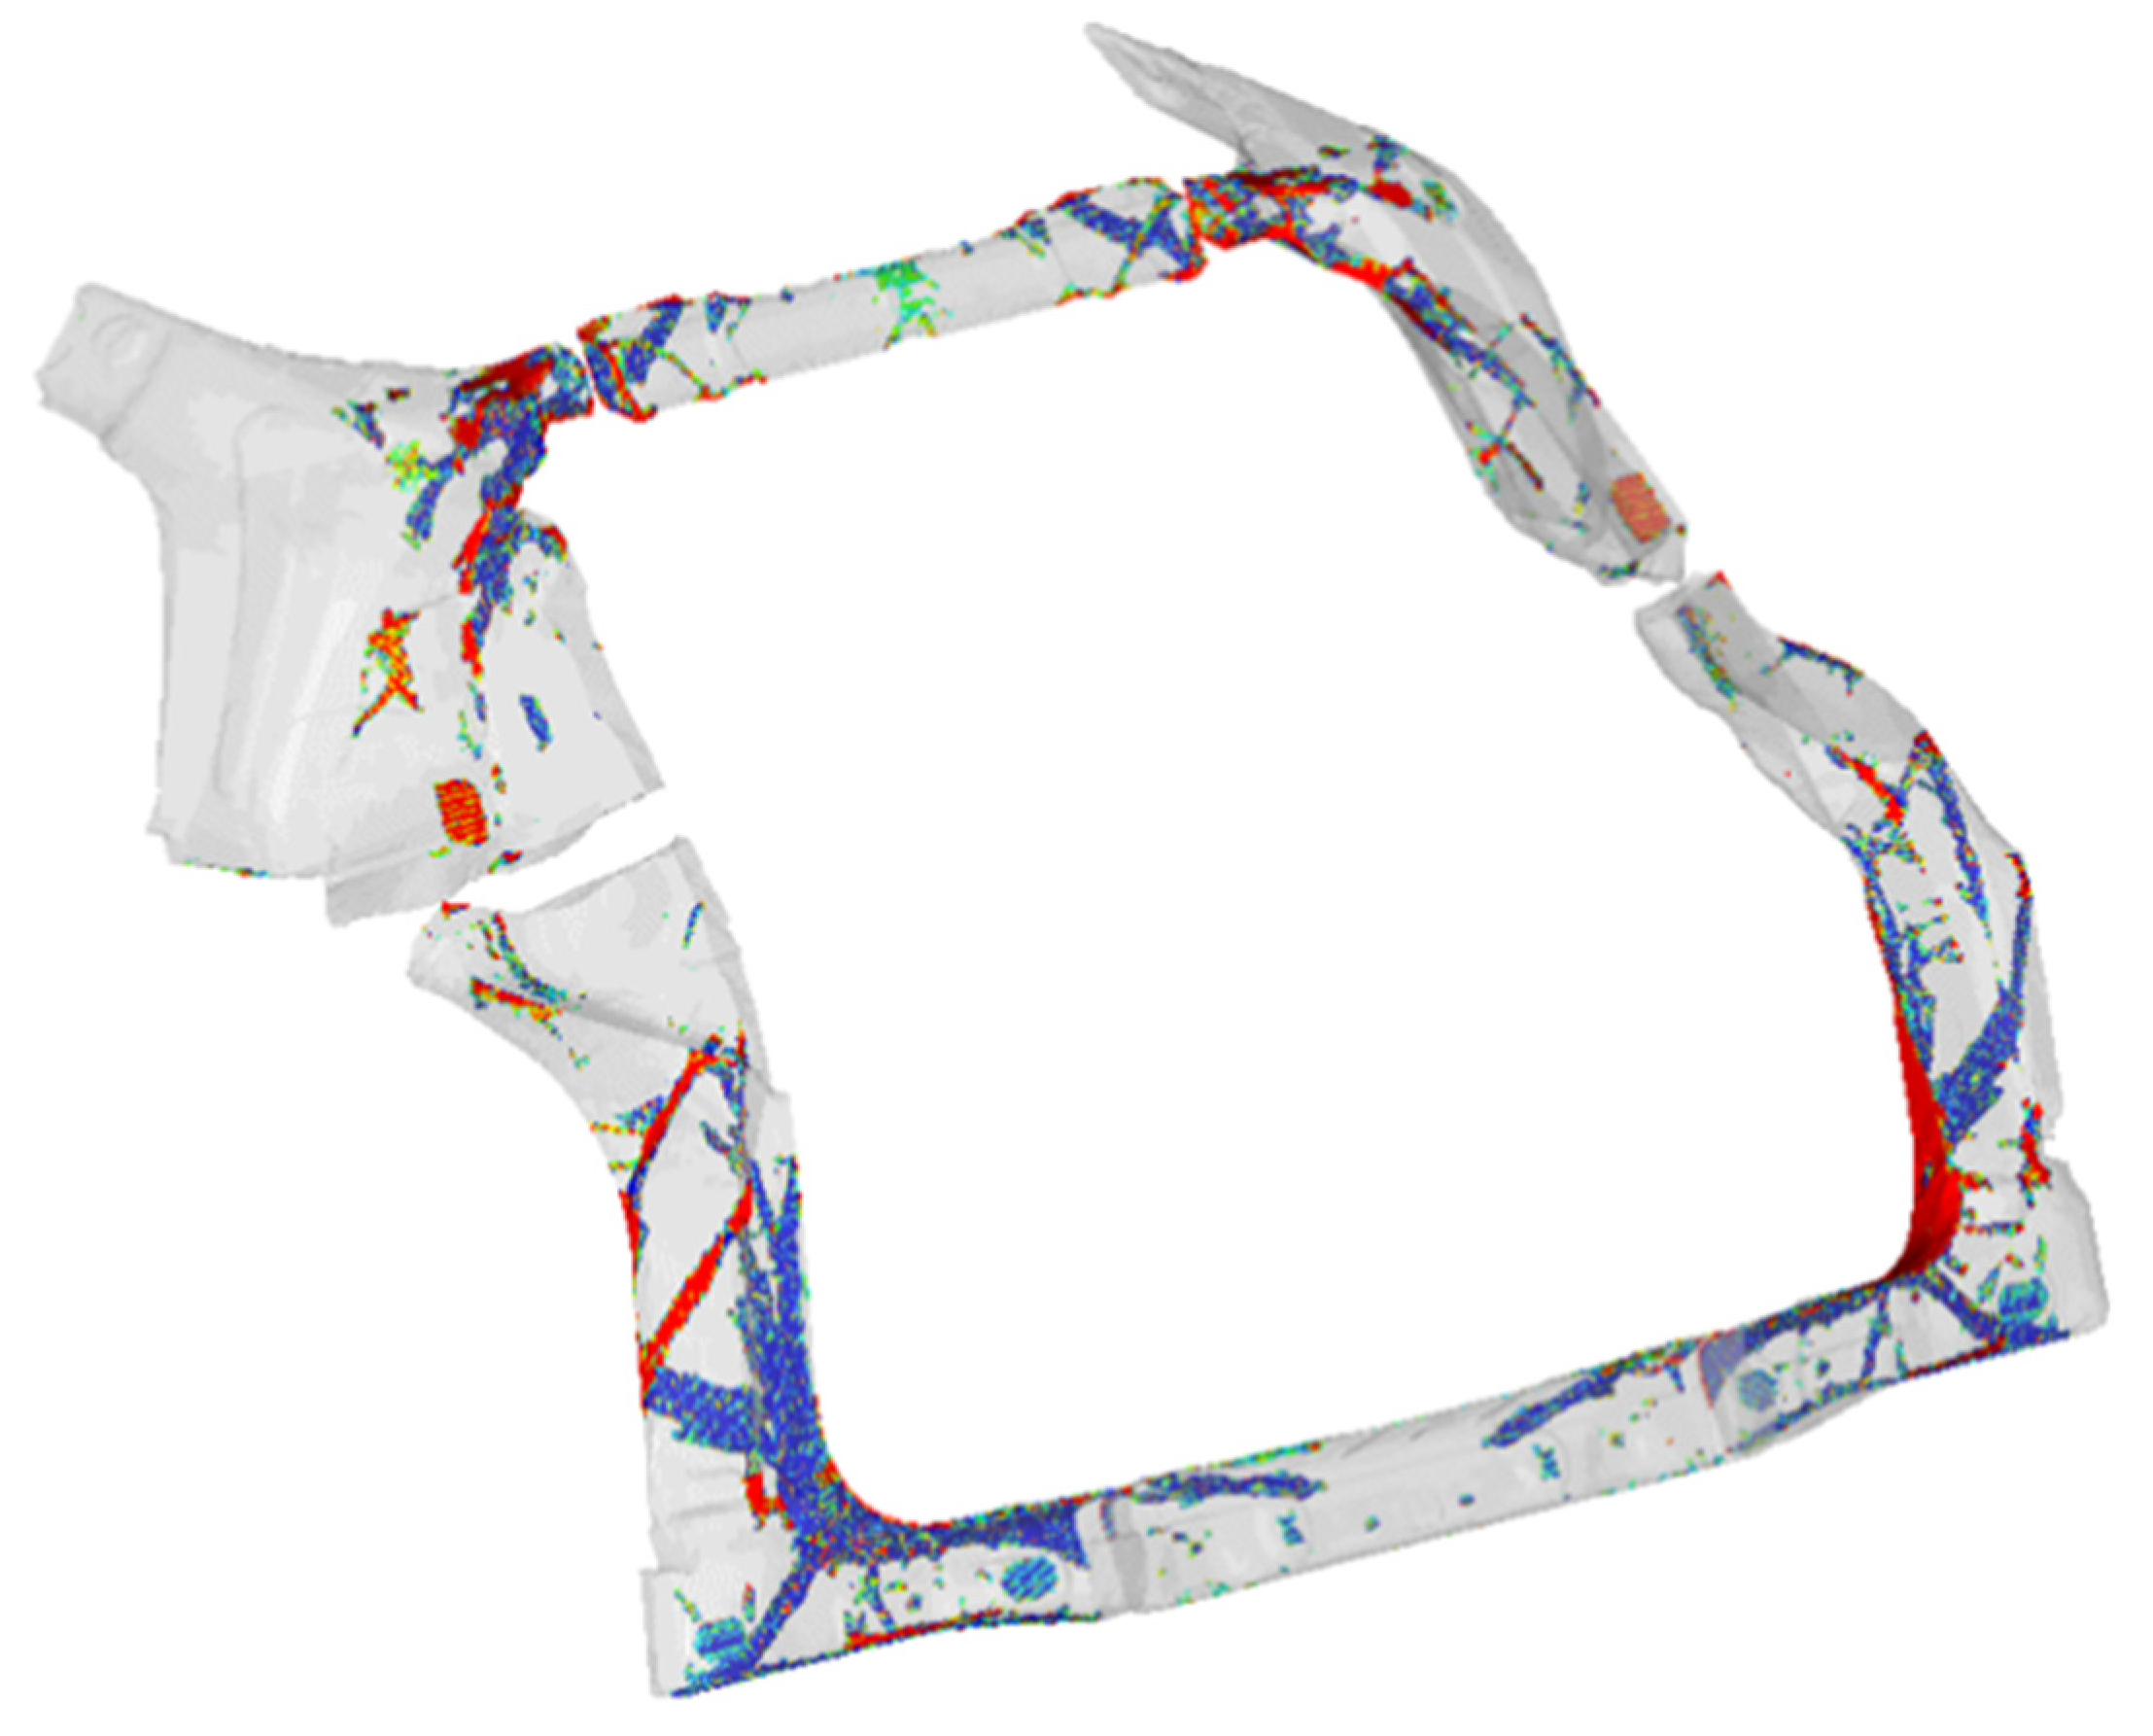
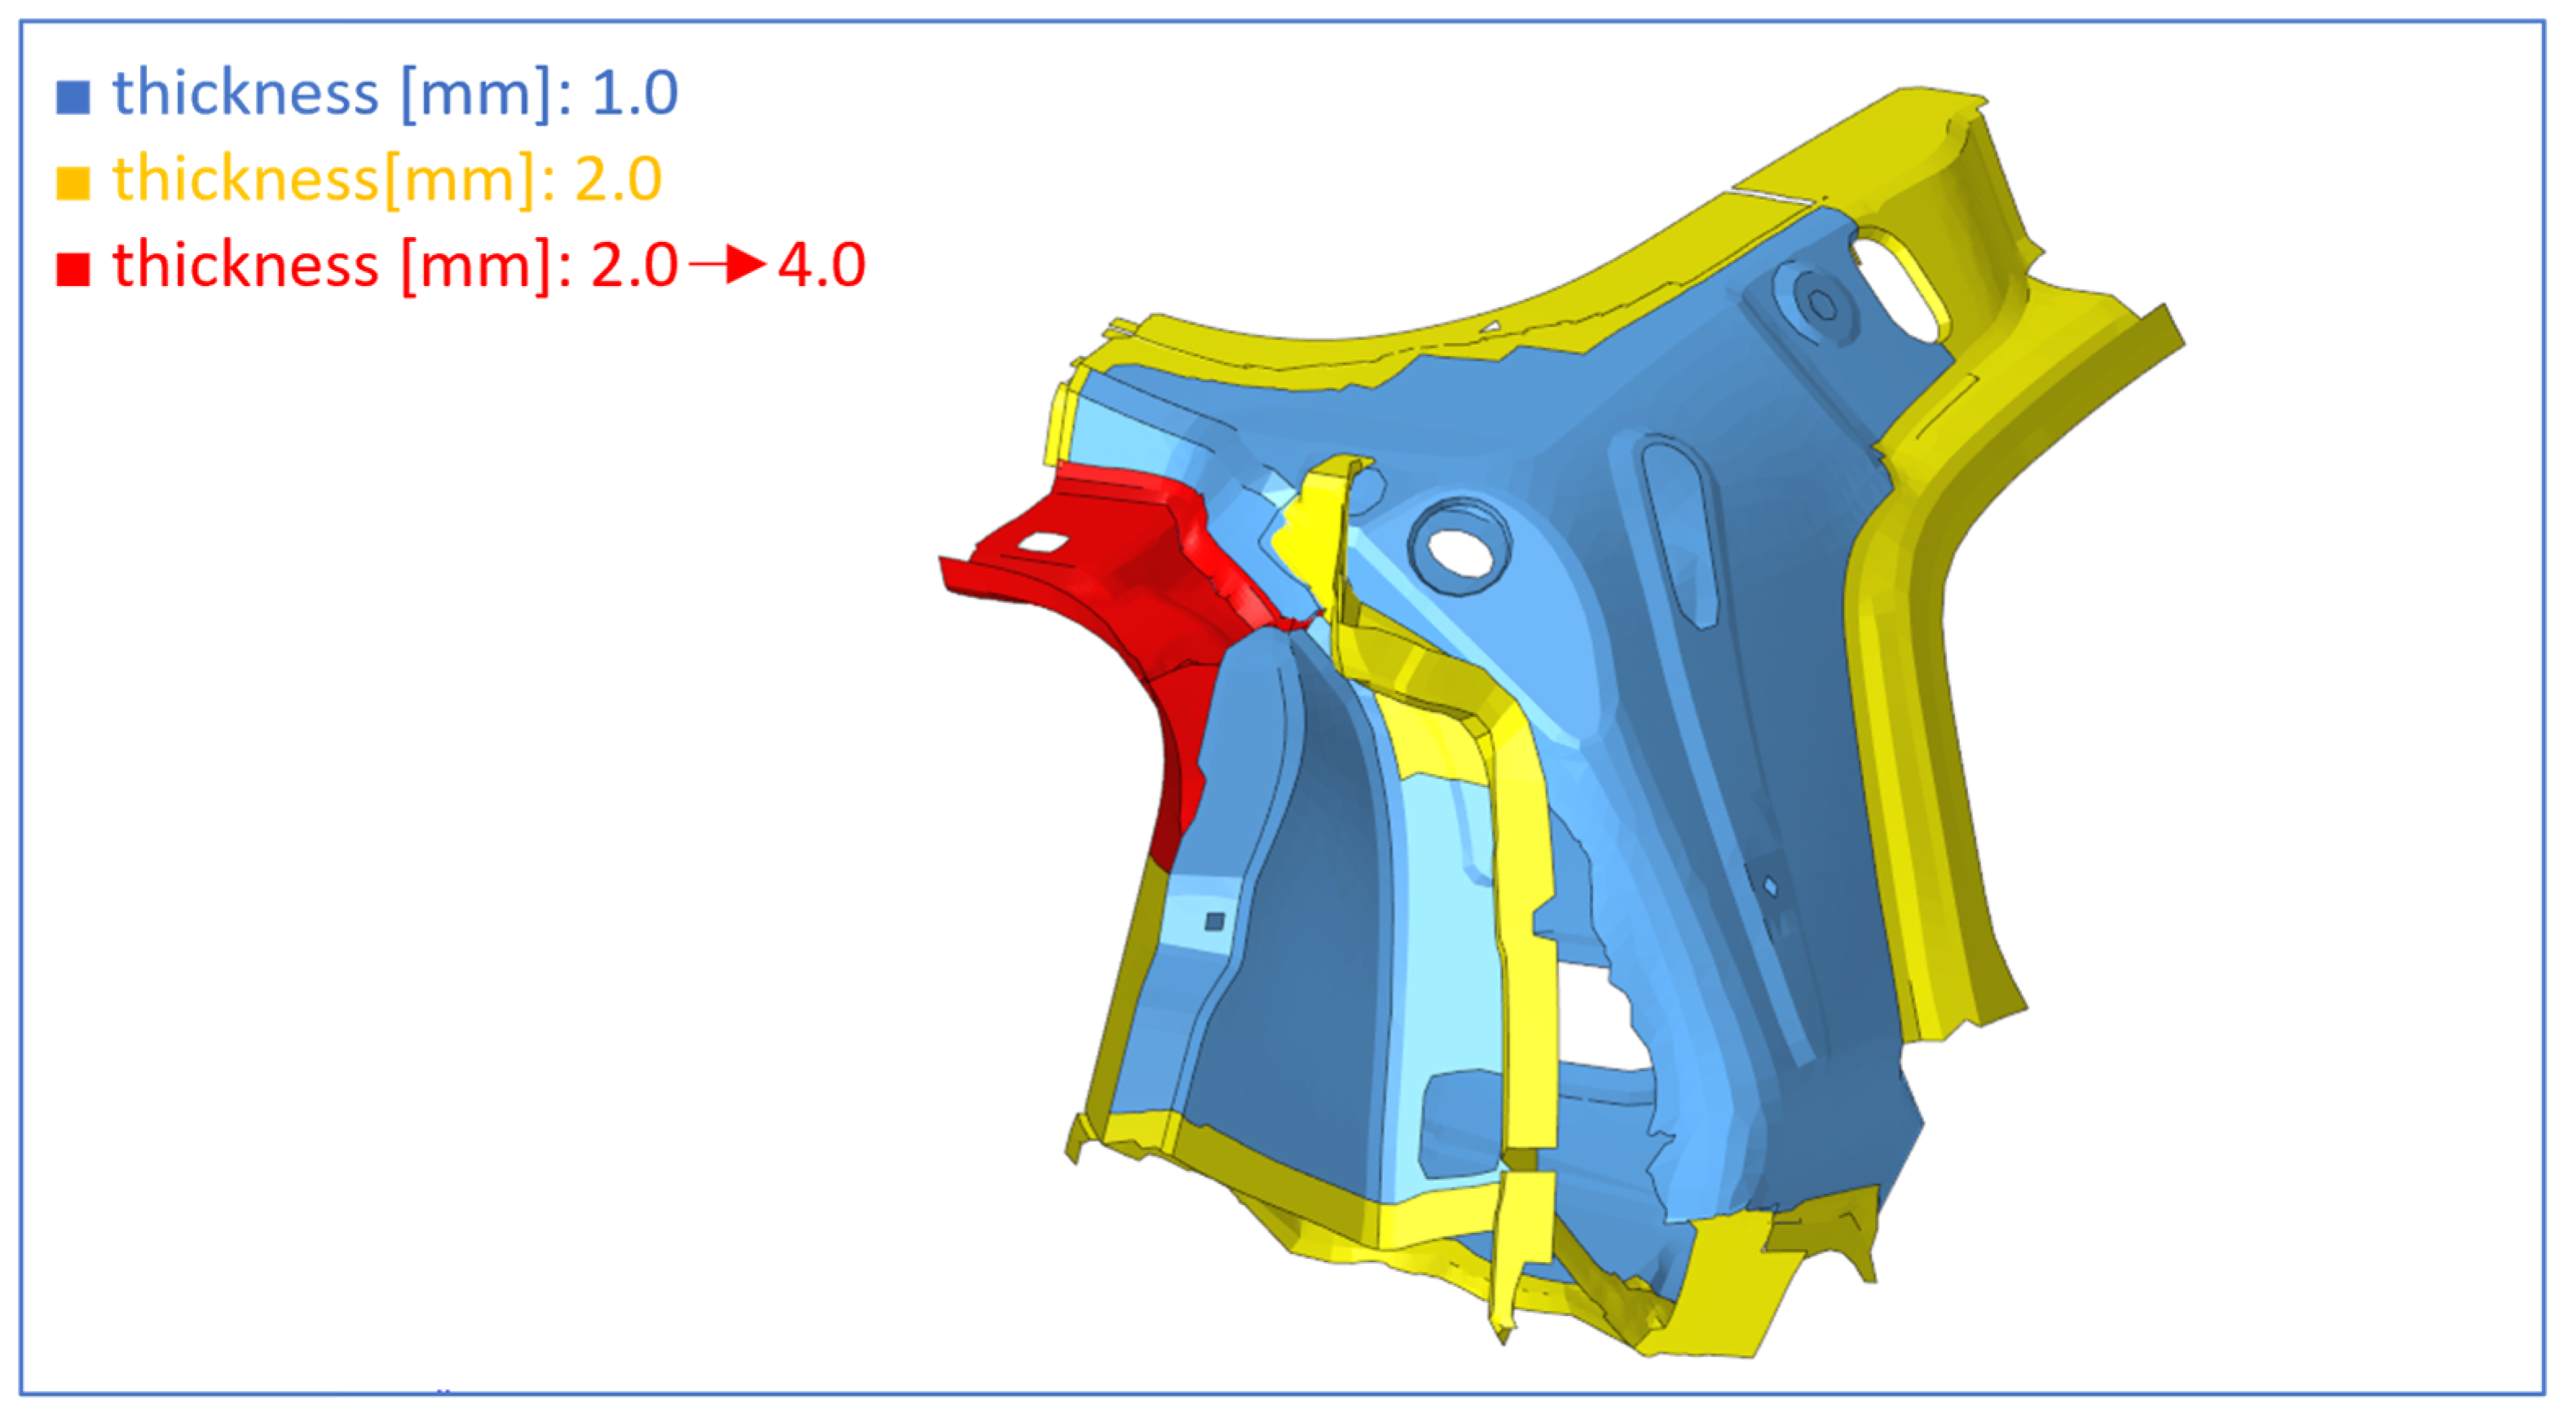
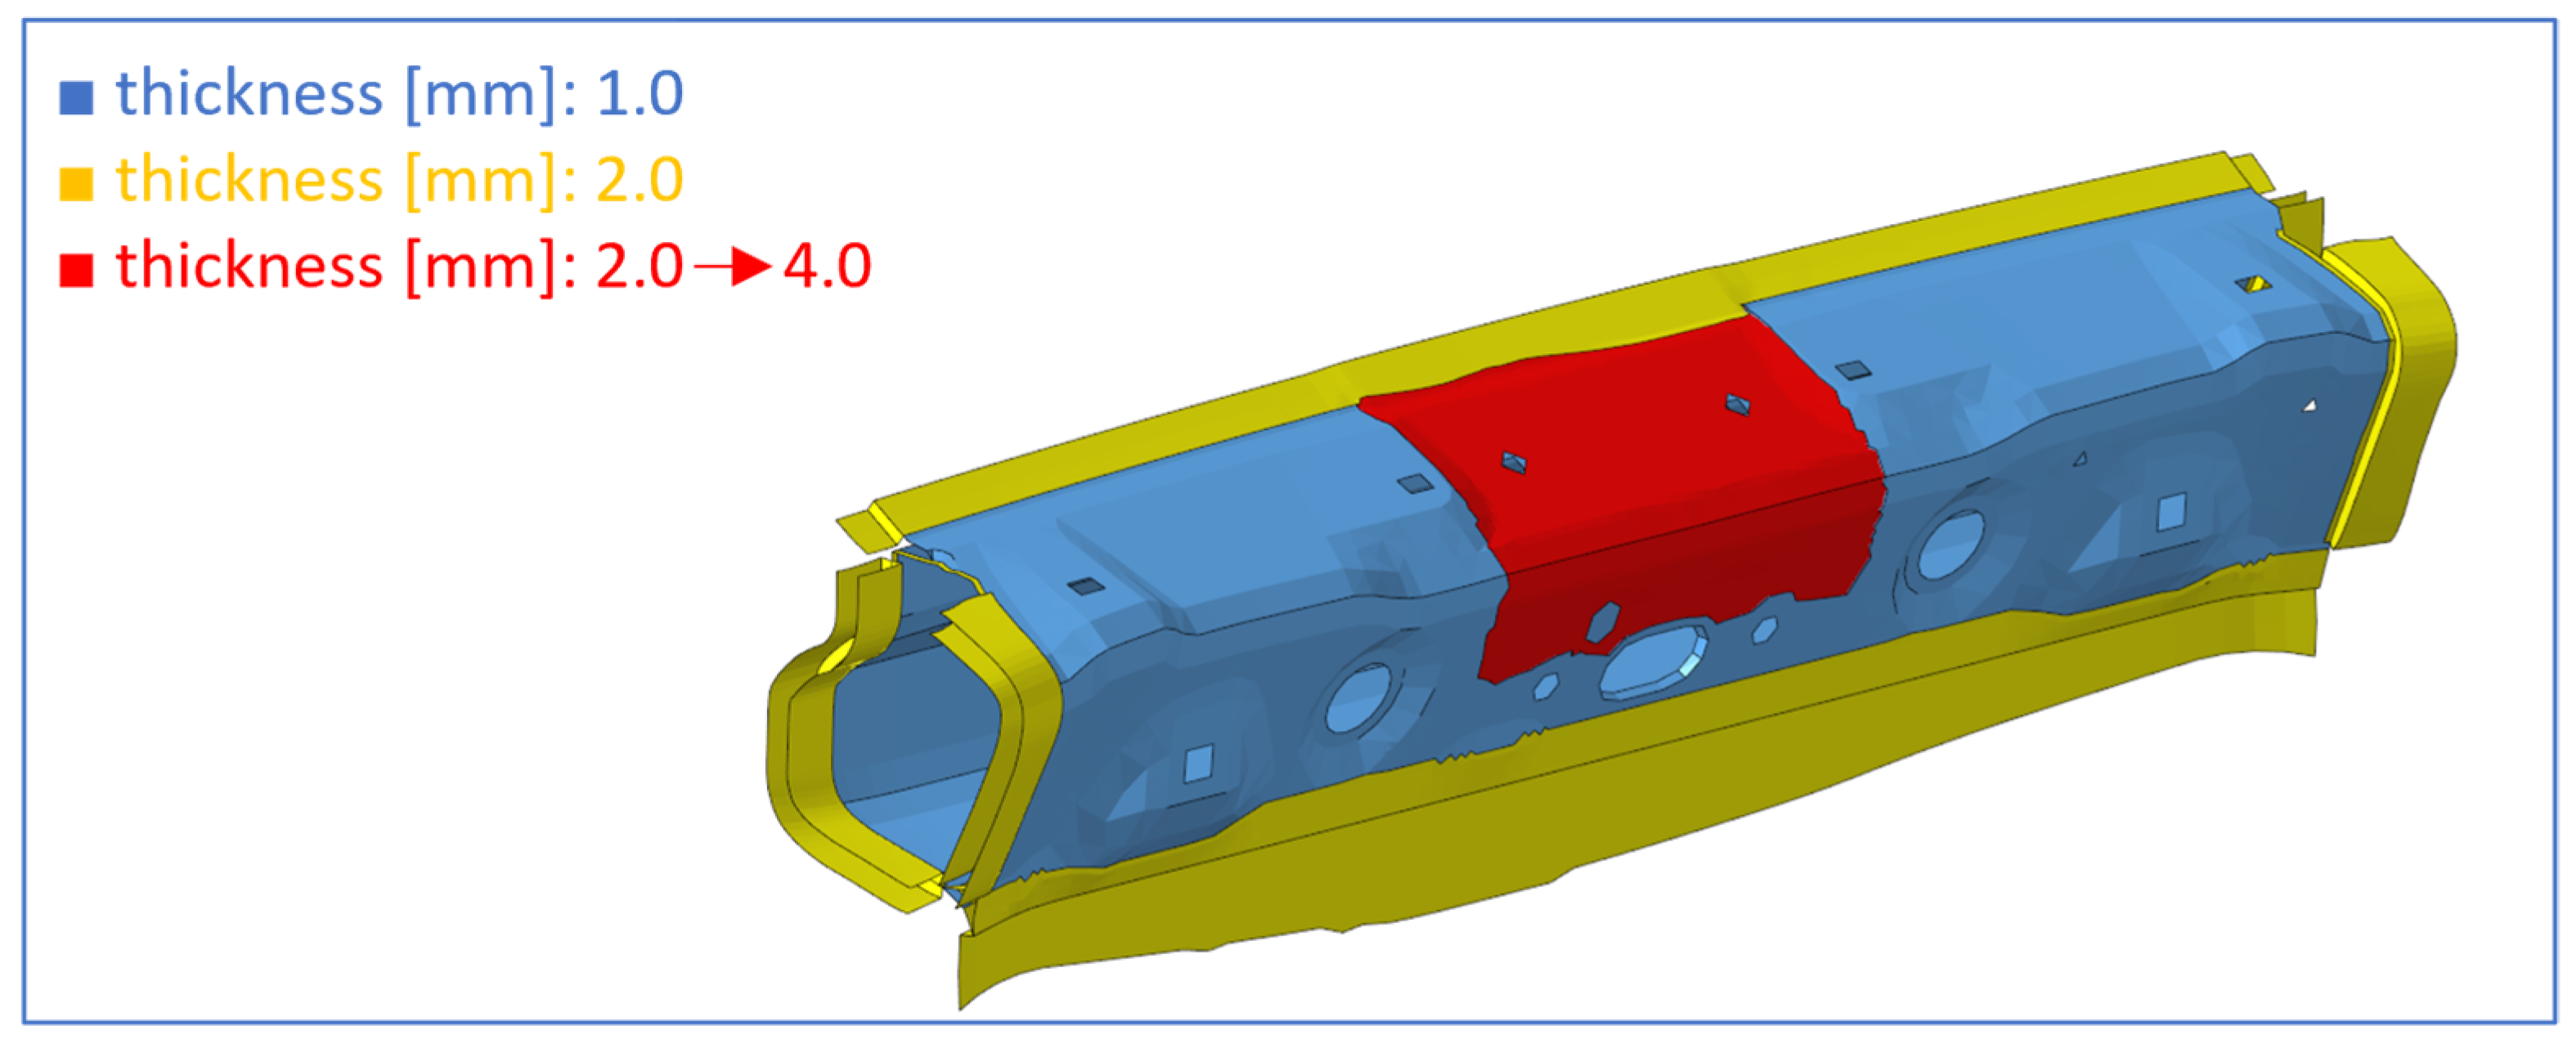
4.3. Topological Optimization
5. Static and Dynamic Results of the Optimized Model
5.1. BIW Model
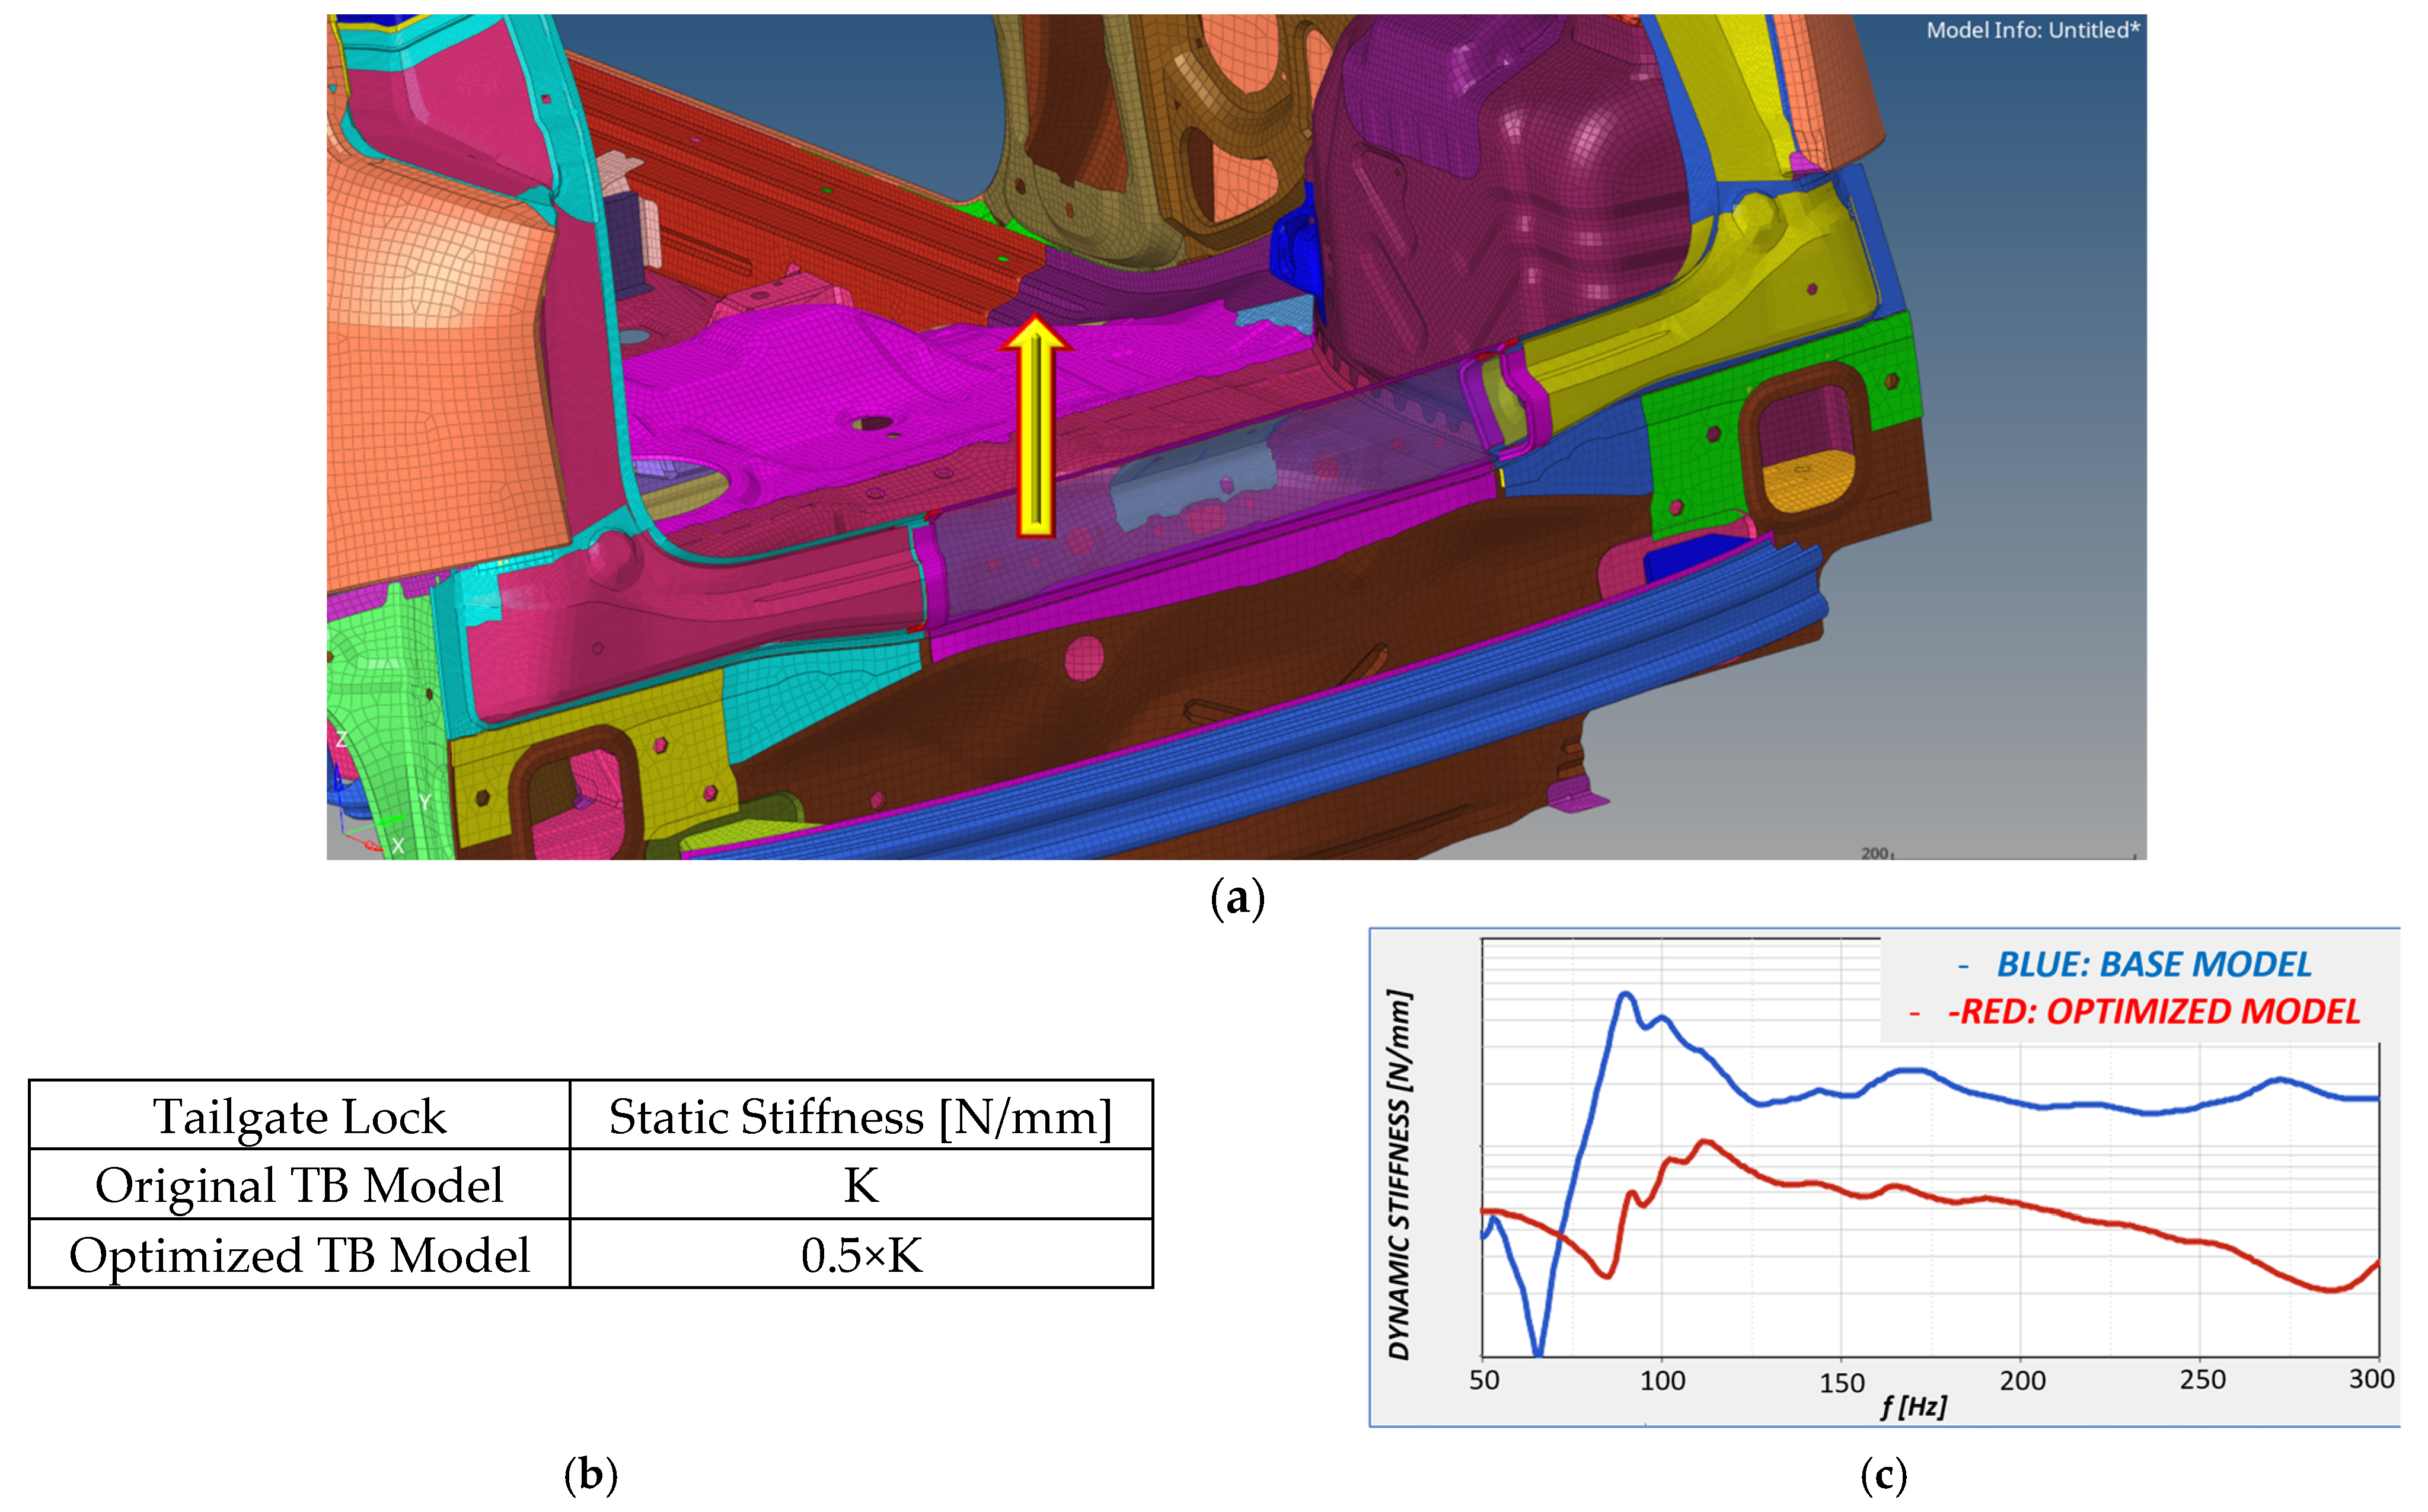
5.2. TB Model
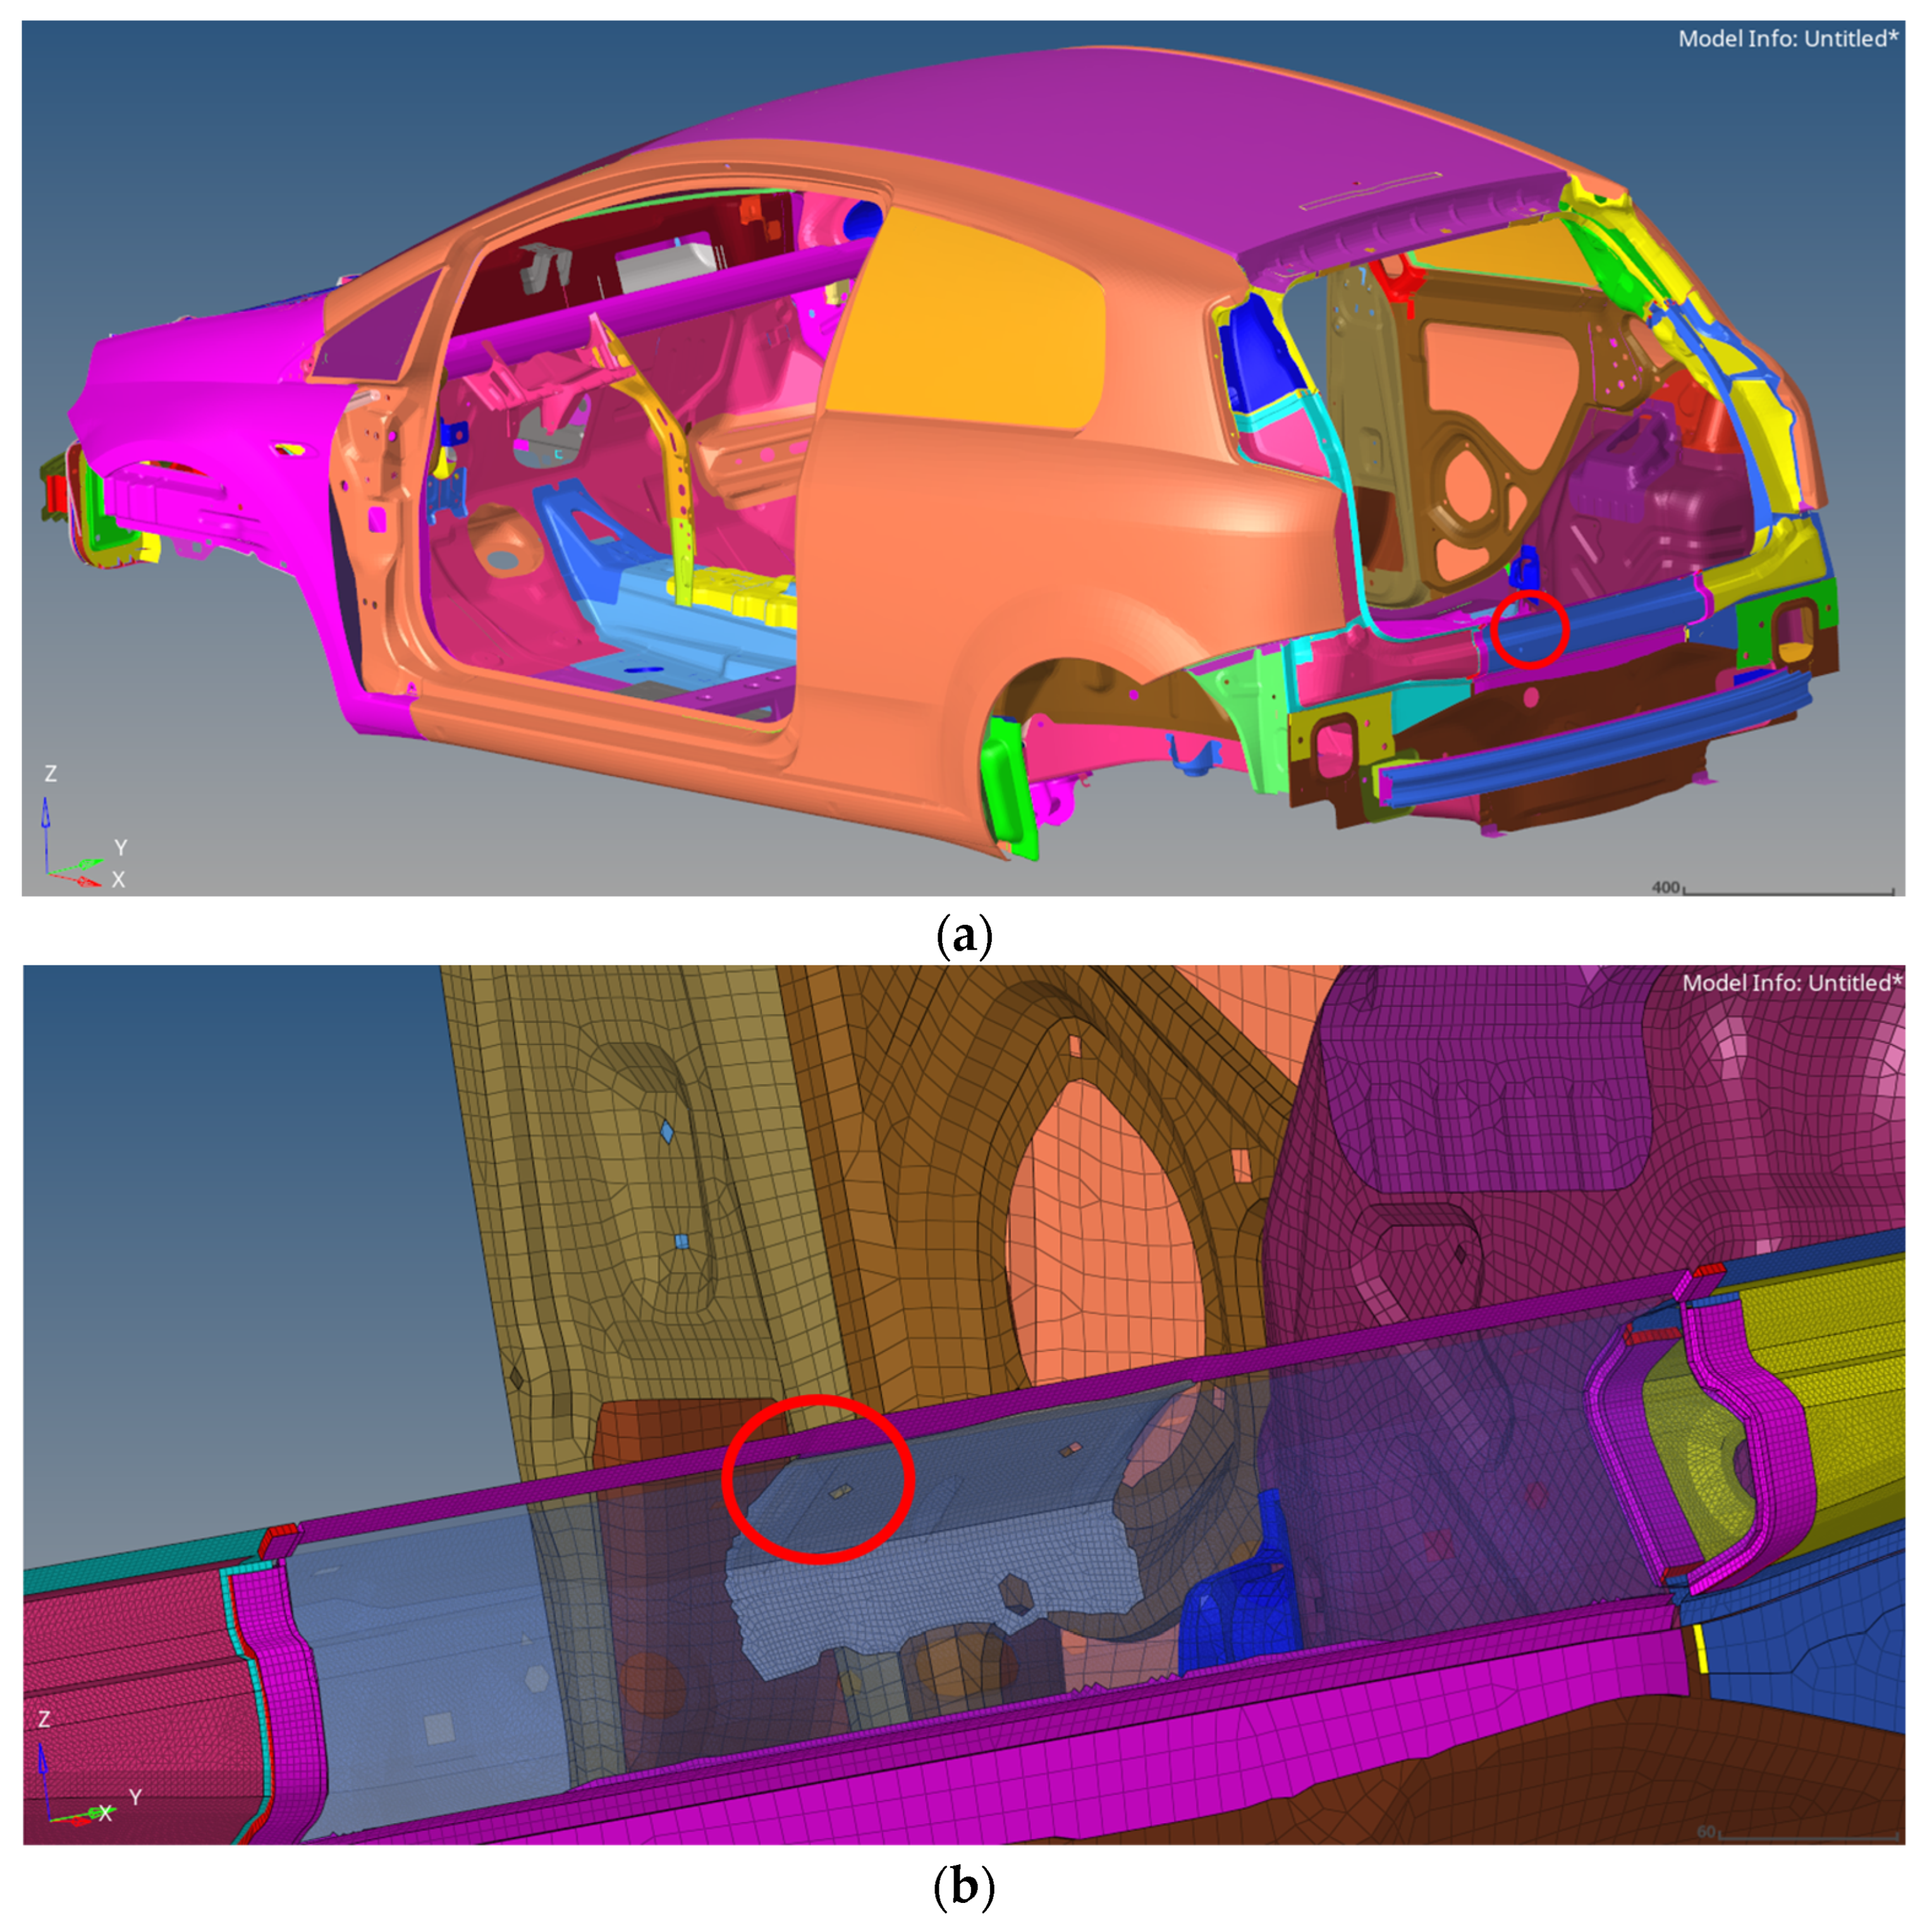
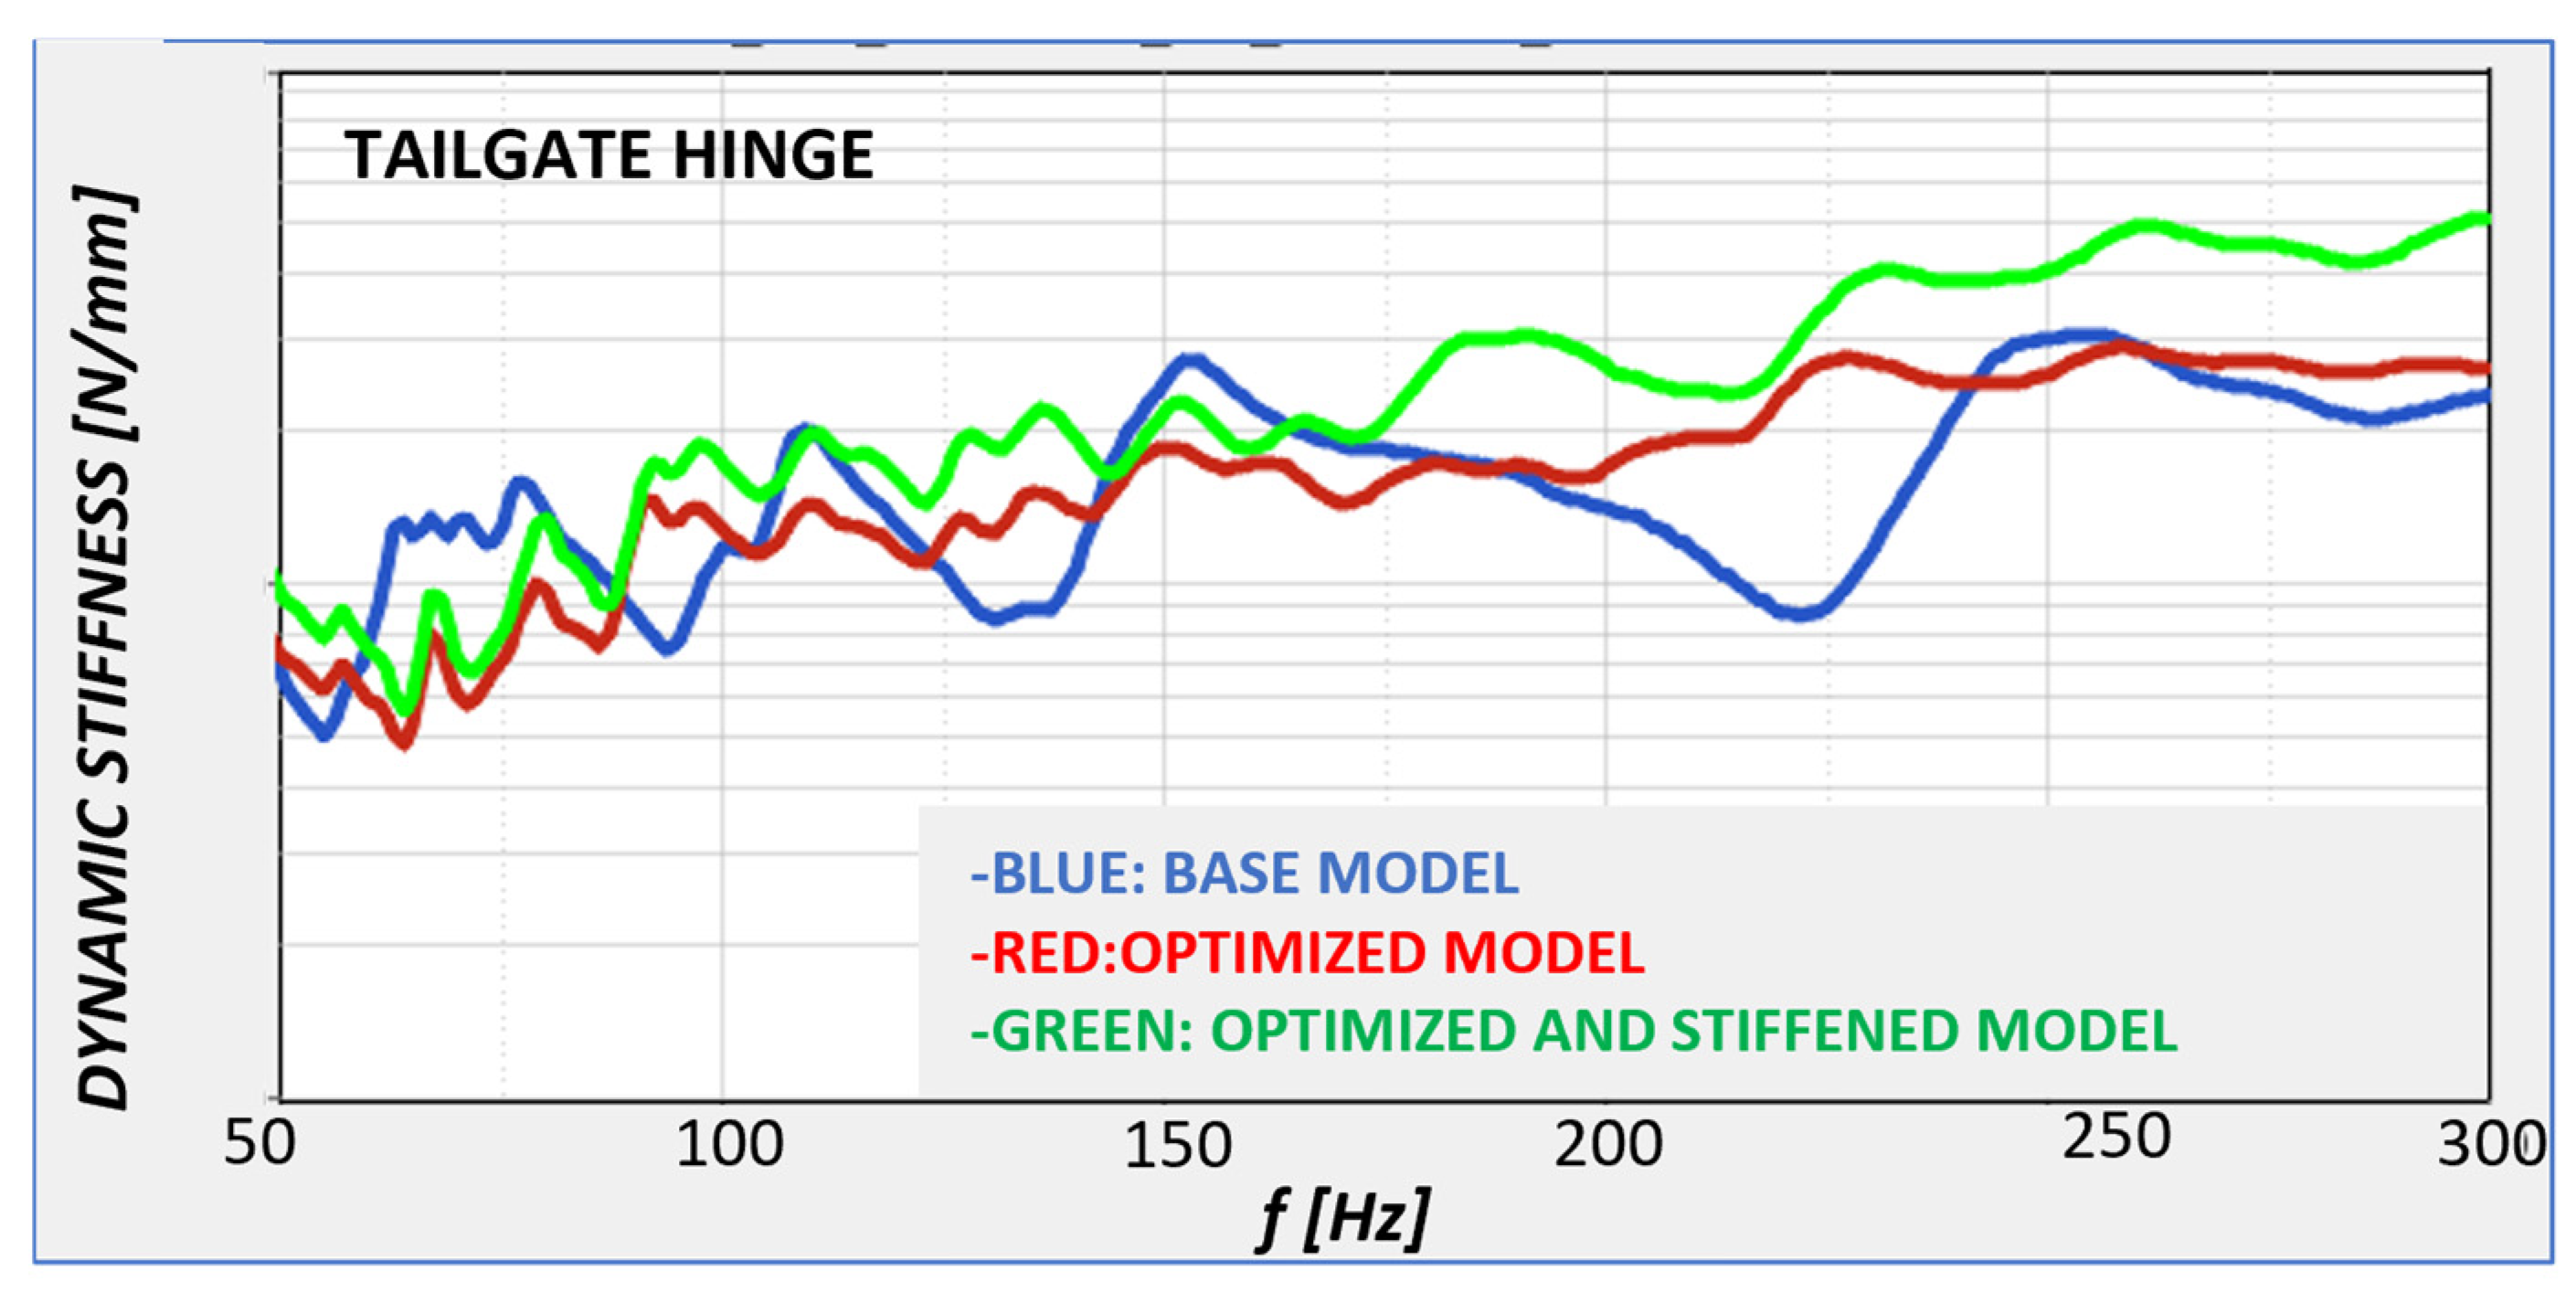
Areas of Particular Interest on TB Model
6. Acoustic Analysis: Modeling and Results
6.1. Acoustic Modal Analysis
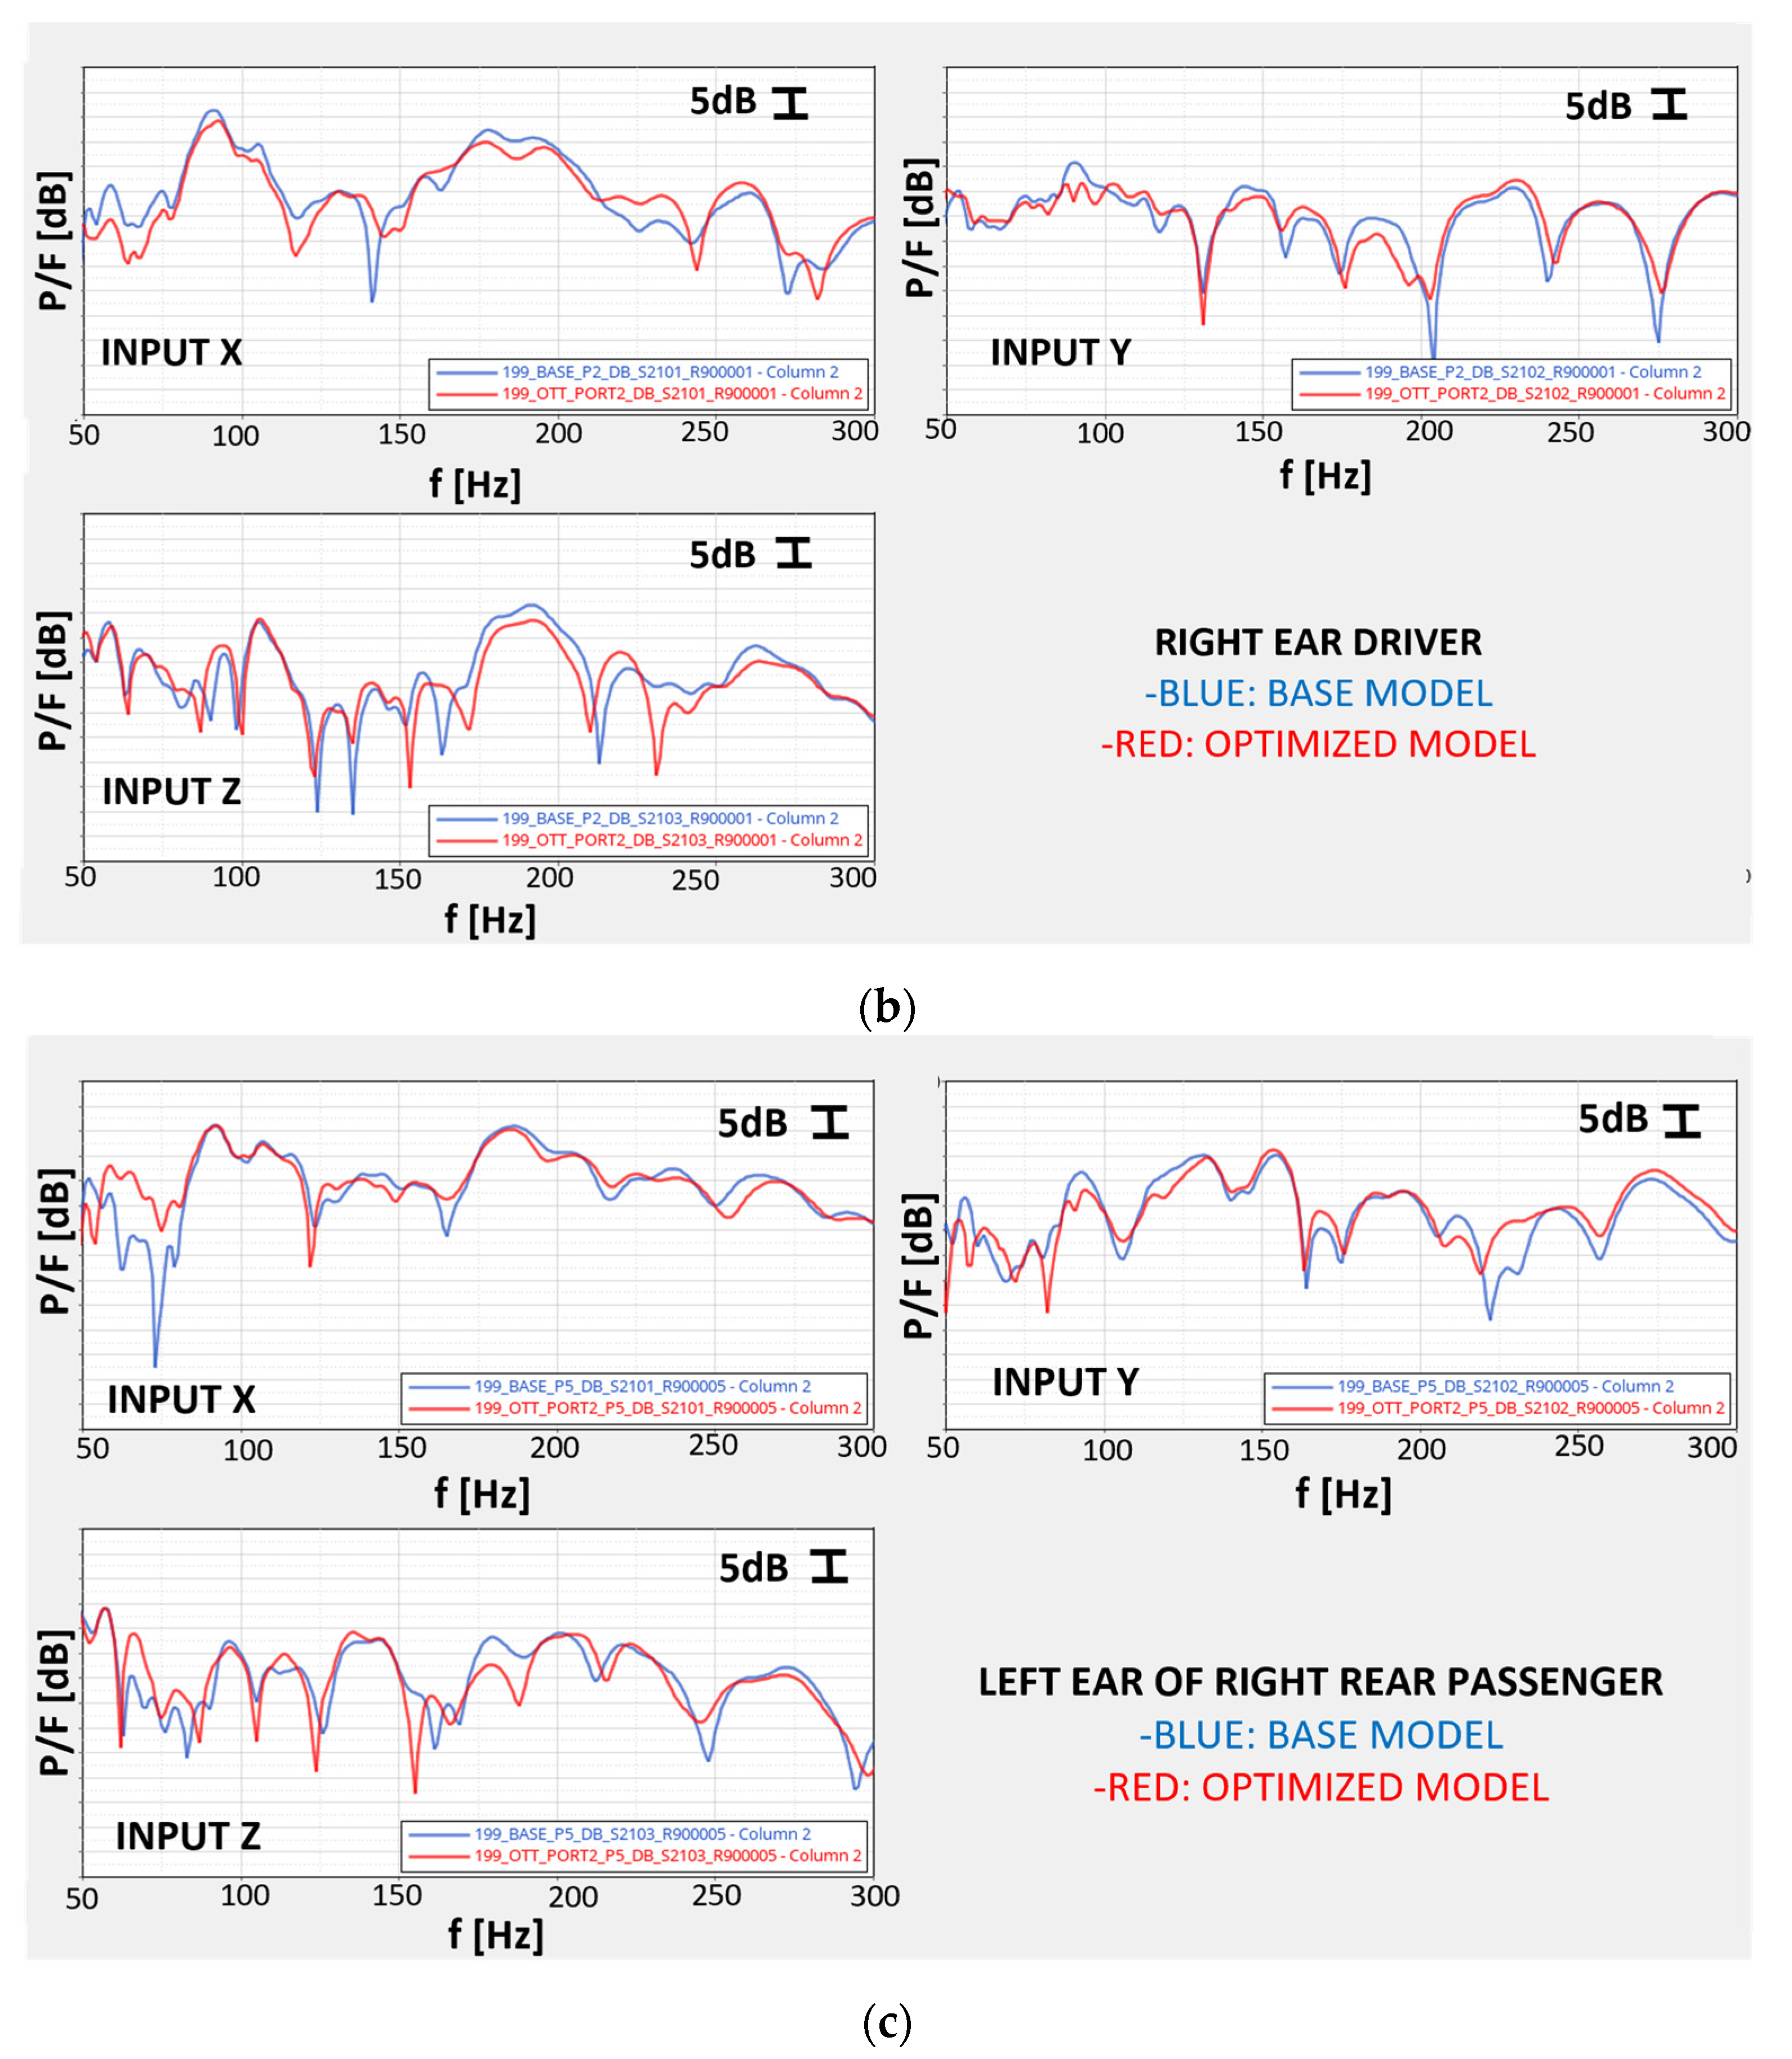
6.2. Vibro-Acoustic Transfer Functions
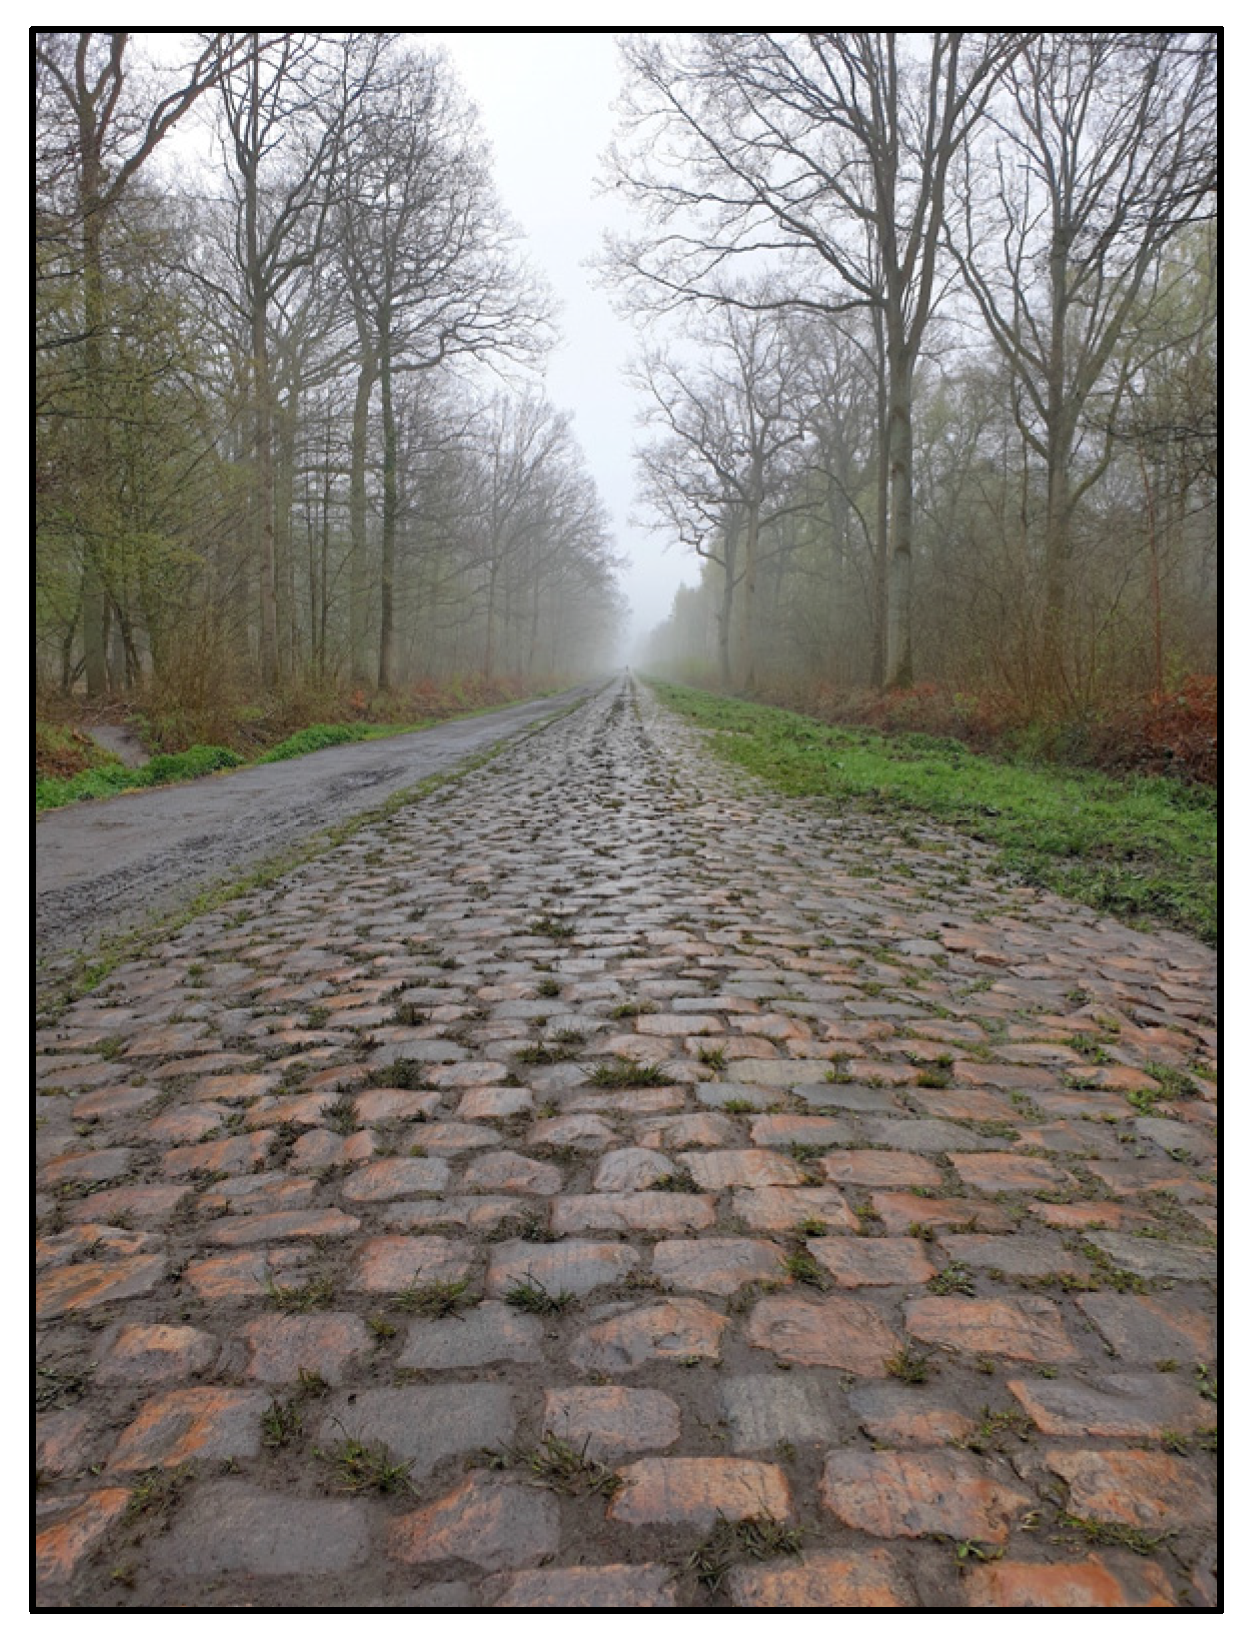
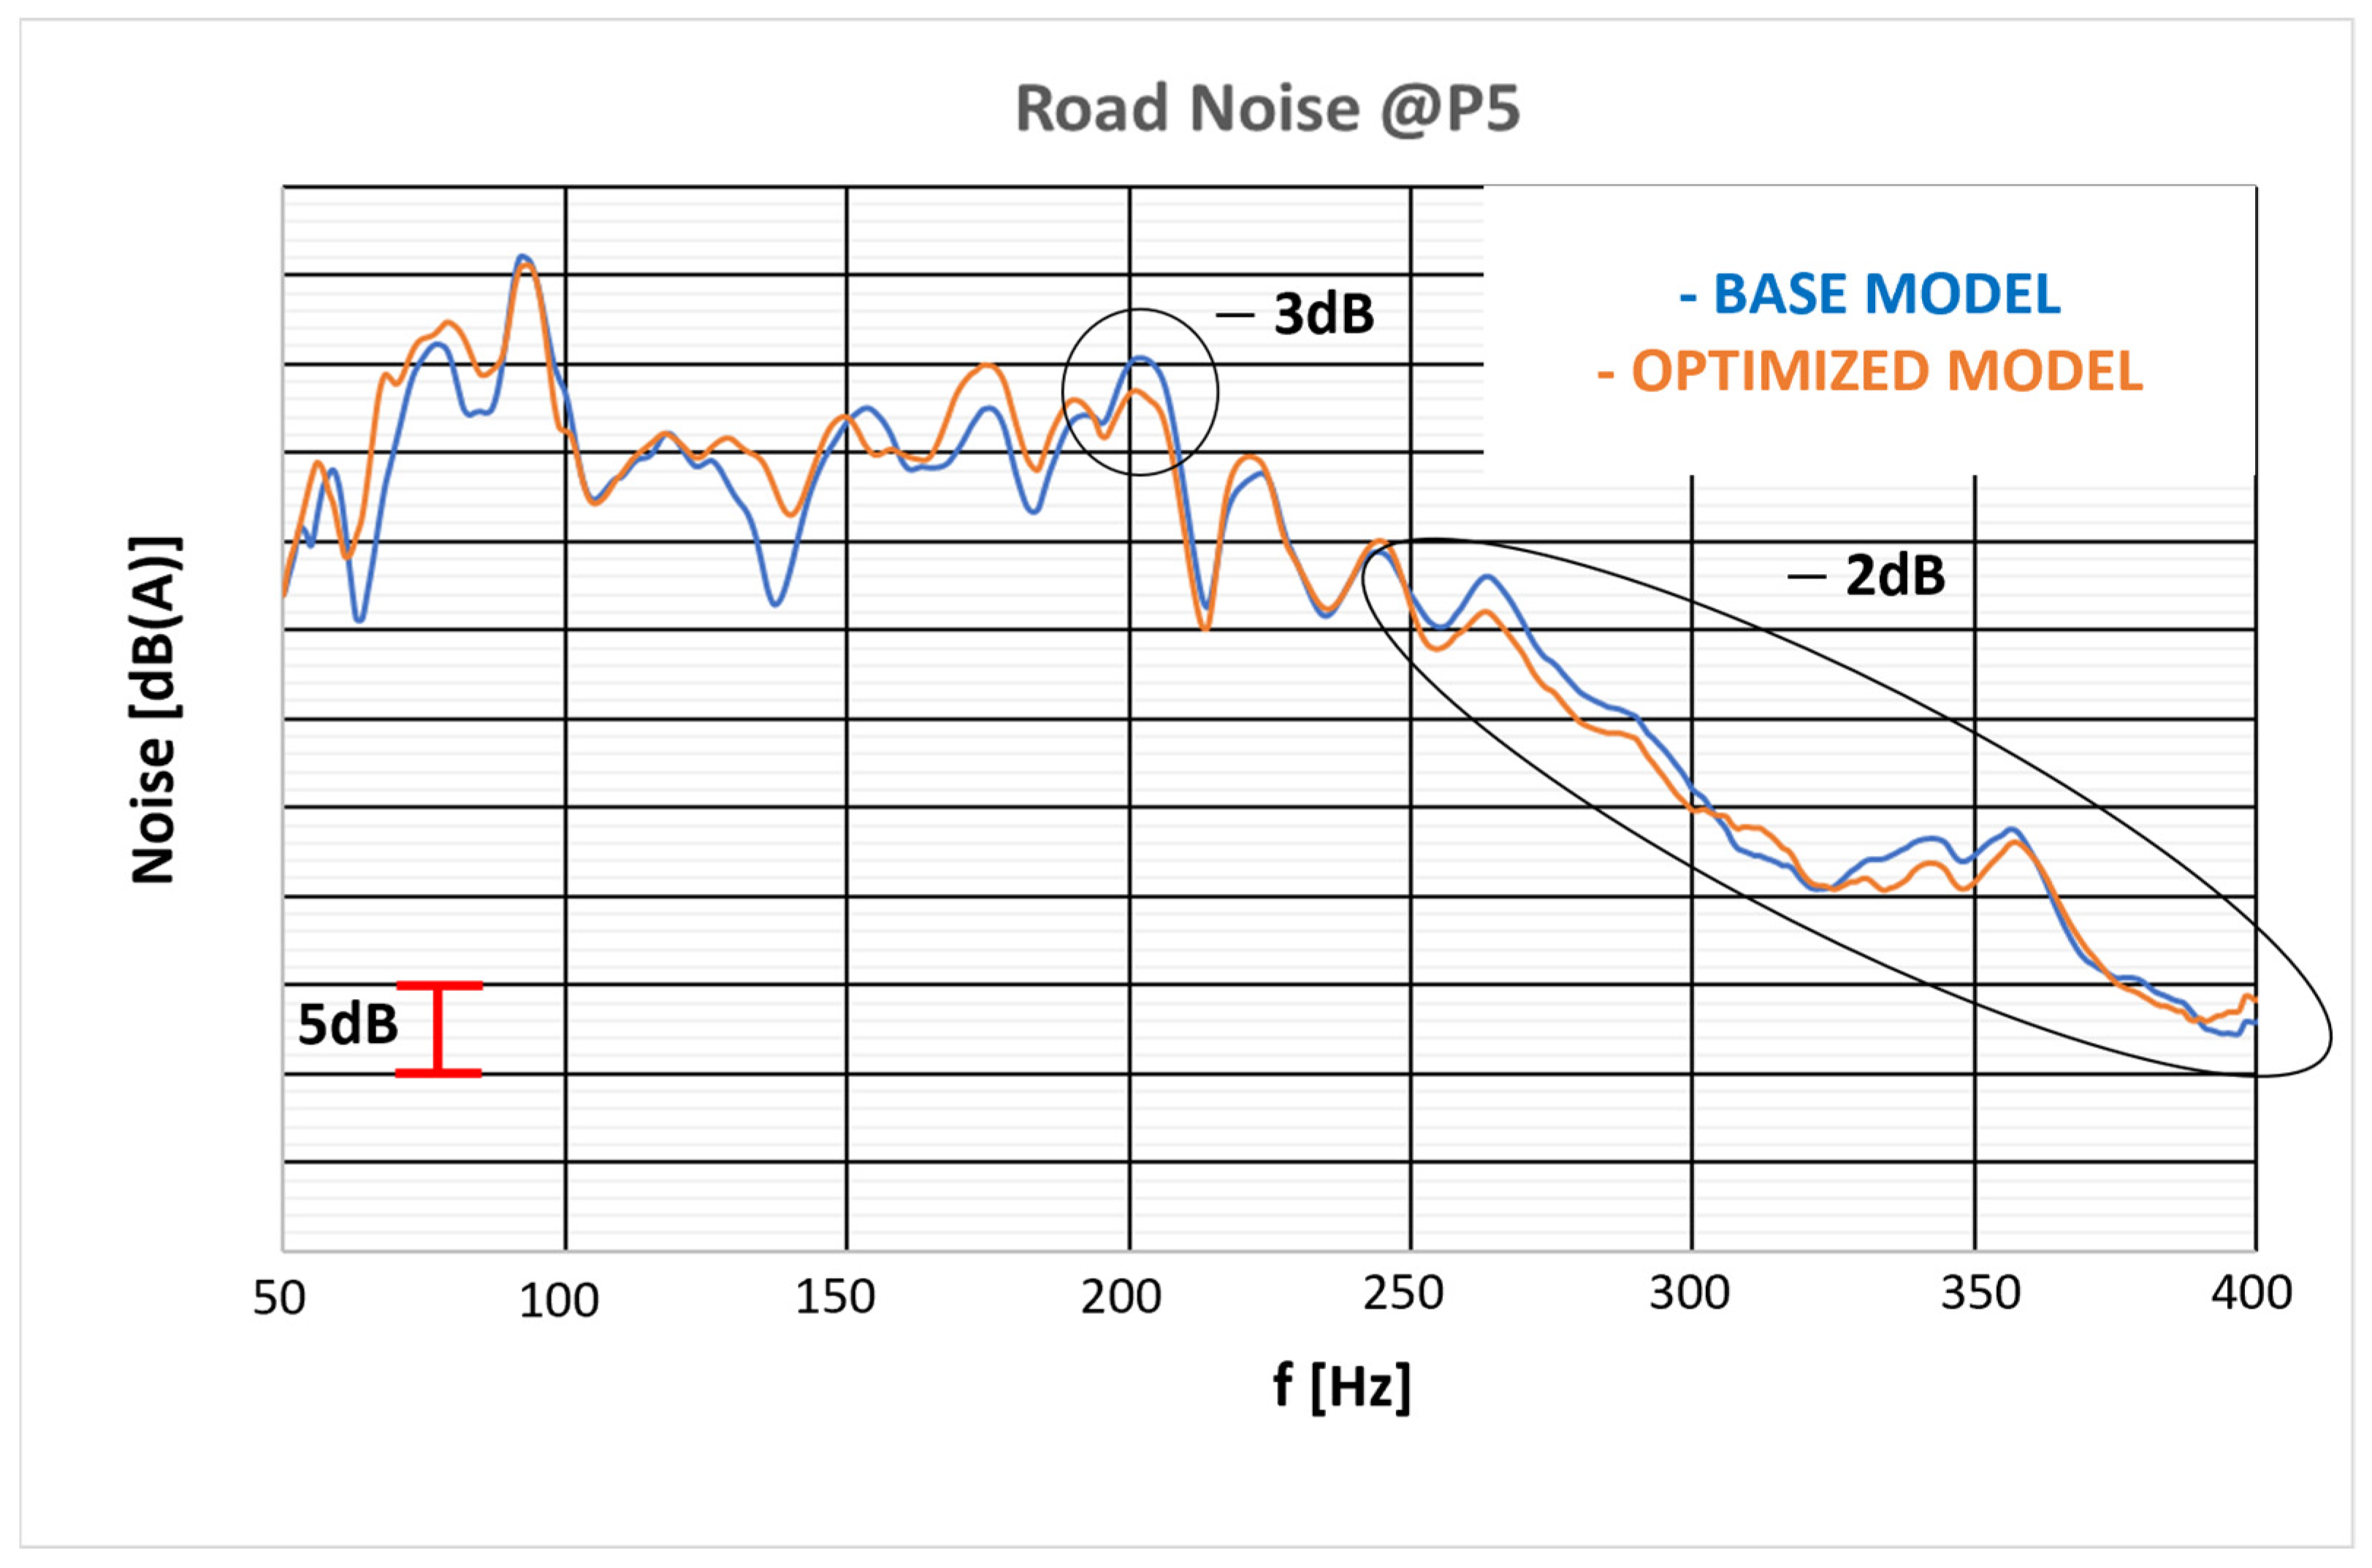
6.3. Road Noise
7. Conclusions
Author Contributions
Funding
Institutional Review Board Statement
Informed Consent Statement
Data Availability Statement
Conflicts of Interest
References
- Shahrubudin, N.; Lee, T.; Ramlan, R. An Overview in 3D Printing Technology: Technological, Materials and Applications. Procedia Manuf. 2019, 35, 1286–1296. [Google Scholar] [CrossRef]
- Sarvankar, S.G.; Yewale, S.N. Additive Manufacturing in Automobile Industry. Int. J. Res. Aeronaut. Mech. 2019, 7, 1–10. [Google Scholar]
- Sun, W.; Zhou, J.; Gong, D.; You, T. Analysis of modal frequency optimization of railway vehicle car body. Adv. Mech. Eng. 2016, 8, 1687814016643640. [Google Scholar] [CrossRef]
- Cascone, N.; Caivano, L.; D’Errico, G.; Citarella, R. Vibroacoustic Assessment of an Innovative Composite Material for the Roof of a Coupe Car. Appl. Sci. 2021, 11, 1128. [Google Scholar] [CrossRef]
- Borrelli, A.; D’Errico, G.; Borrelli, C.; Citarella, R. Assessment of Crash Performance of an Automotive Component Made through Additive Manufacturing. Appl. Sci. 2020, 10, 9106. [Google Scholar] [CrossRef]
- Armentani, E.; Caputo, F.; Esposito, L.; Giannella, V.; Citarella, R. Multibody Simulation for the Vibration Analysis of a Turbocharged Diesel Engine. Appl. Sci. 2018, 8, 1192. [Google Scholar] [CrossRef]
- Armentani, E.; Trapani, R.; Citarella, R.; Parente, A.; Pirelli, M. FEM-BEM Numerical Procedure for Insertion Loss Assessment of Engine Beauty Cover. Open Mech. Eng. J. 2013, 7, 27–34. [Google Scholar] [CrossRef]
- Barbarino, M.; Adamo, F.; Bianco, D.; Bartoccini, D. Hybrid BEM/empirical approach for scattering of correlated sources in rocket noise prediction. J. Sound Vib. 2013, 403, 90–103. [Google Scholar] [CrossRef]
- Barbarino, M.; Bianco, D. A BEM-FMM approach applied to the combined convected Helmholtz integral formulation for the solution of aeroacoustic problems. Comput. Methods Appl. Mech. Eng. 2018, 342, 585–603. [Google Scholar] [CrossRef]
- Xiong, F.; Zou, X.; Zhang, Z.; Shi, X. A systematic approach for multi-objective lightweight and stiffness optimization of a car body. Struct. Multidiscip. Optim. 2020, 62, 3229–3248. [Google Scholar] [CrossRef]
- Sobieszczanski-Sobieski, J.; Kodiyalam, S.; Yang, R.Y. Optimization of car body under constraints of noise, vibration and harshness (NVH), and crash. Ind. Appl. Des. Case Stud. 2001, 22, 295–306. [Google Scholar] [CrossRef]
- Liang, X.; Zhu, P.; Lin, Z.; Zhang, Y. Acoustic analysis of lightweight auto-body based on finite element method and boundary element method. Front. Mech. Eng. China 2007, 2, 99–103. [Google Scholar] [CrossRef]
- Leiva, J.P. Structural Optimization Methods and Techniques to Design Efficient Car Bodies, Vanderplaats Research and Development, Inc. 2011. Available online: http://www.peraglobal.com/upload/contents/2016/05/20160518095243_69263.pdf (accessed on 26 February 2023).
- Wang, L.; Basu, P.K.; Leiva, J.P. Automobile body reinforcement by finite element optimization. Finite Elem. Anal. Des. 2004, 40, 879–893. [Google Scholar] [CrossRef]
- Jang, G.; Choi, Y.; Choi, G. Discrete thickness optimization of an automobile body by using the continuous-variable-based method. J. Mech. Sci. Technol. 2008, 22, 41–49. [Google Scholar]
- Yahaya Rashid, A.S.; Ramli, R.; Mohamed Haris, S.; Alias, A. Improving the Dynamic Characteristics of Body-in-White Structure Using Structural Optimization. Sci. World J. 2014, 2014, 190214. [Google Scholar] [CrossRef] [PubMed]
- Parrish, A.; Rais-Rohani, M.; Najafi, A. Crashworthiness optimisation of vehicle structures with magnesium alloy parts. Int. J. Crashworthiness 2012, 17, 259–281. [Google Scholar] [CrossRef]
- Altair Hypermesh Version 13.0 User’s Guide. Available online: https://2019.help.altair.com/2019/hyperworks/pdfs/hm/HyperMesh_2019_UserGuide.pdf (accessed on 10 July 2022).
- MSC Nastran 2012 Getting Started User’s Guide. Available online: https://simcompanion.hexagon.com/customers/s/article/getting-started-with-msc-nastran-user-s-guide-doc9176 (accessed on 10 July 2022).


| Decrease in the Sum of Displacements of Four Loaded Points [%] | Torsional Natural Frequency Increase [%] | Weight Savings Considering Only the Rear Part [%] |
|---|---|---|
| 36.8% | 14% | 19% |
| Tailgate Hinge | Static Stiffness [N/mm] |
|---|---|
| Original TB Model | K |
| Optimized Model | 1.05×K |
| Optimized and Stiffened TB Model | 1.46×K |
| Tailgate Lock | Static Stiffness [N/mm] |
|---|---|
| Original TB Model | K |
| Optimized Model | 0.5×K |
| Optimized and Stiffened TB Model | 1.25×K |
Disclaimer/Publisher’s Note: The statements, opinions and data contained in all publications are solely those of the individual author(s) and contributor(s) and not of MDPI and/or the editor(s). MDPI and/or the editor(s) disclaim responsibility for any injury to people or property resulting from any ideas, methods, instructions or products referred to in the content. |
© 2023 by the authors. Licensee MDPI, Basel, Switzerland. This article is an open access article distributed under the terms and conditions of the Creative Commons Attribution (CC BY) license (https://creativecommons.org/licenses/by/4.0/).
Share and Cite
Citarella, R.; Landi, T.; Caivano, L.; D’Errico, G.; Raffa, F.; Romano, M.; Armentani, E. Structural and Vibro-Acoustics Optimization of a Car Body Rear Part. Appl. Sci. 2023, 13, 3552. https://doi.org/10.3390/app13063552
Citarella R, Landi T, Caivano L, D’Errico G, Raffa F, Romano M, Armentani E. Structural and Vibro-Acoustics Optimization of a Car Body Rear Part. Applied Sciences. 2023; 13(6):3552. https://doi.org/10.3390/app13063552
Chicago/Turabian StyleCitarella, Roberto, Tommaso Landi, Luca Caivano, Giuseppe D’Errico, Francesca Raffa, Mario Romano, and Enrico Armentani. 2023. "Structural and Vibro-Acoustics Optimization of a Car Body Rear Part" Applied Sciences 13, no. 6: 3552. https://doi.org/10.3390/app13063552
APA StyleCitarella, R., Landi, T., Caivano, L., D’Errico, G., Raffa, F., Romano, M., & Armentani, E. (2023). Structural and Vibro-Acoustics Optimization of a Car Body Rear Part. Applied Sciences, 13(6), 3552. https://doi.org/10.3390/app13063552