
Effect of 12 Weeks of the Plyometric Training Program Model on Speed and Explosive Strength Abilities in Adolescents


Abstract
1. Introduction
2. Materials and Methods
2.1. Research Design
2.2. Participants
2.3. Test Protocol
2.3.1. Predicted Maturity Offset Calculate
2.3.2. Speed Assessment
2.3.3. Assessment of Explosive Strength
2.3.4. Plyometric Training Programs
2.4. Statistical Analysis
3. Results
Analysis of Data Processing in Graphs
4. Discussion
4.1. Effects of the Plyometric Program on Speed Ability
4.2. Effects of the Plyometric Program on Explosive Strength Ability
5. Conclusions
Author Contributions
Funding
Institutional Review Board Statement
Informed Consent Statement
Conflicts of Interest
References
- Arazi, H.; Asadi, A. The effect of aquatic and land plyometric training on strength, sprint, and balance in young basketball players. J. Hum. Sport Exerc. 2011, 6, 101–111. [Google Scholar] [CrossRef]
- Witzke, K.A.; Snow, C.M. Effects of plyometric jump training on bone mass in adolescent girls. Med. Sci. Sports Exerc. 2000, 32, 1051–1057. [Google Scholar] [CrossRef] [PubMed]
- Kotzmandis, C. Effect of plyometric training on running performance and vertical jumping in prepubertal boys. J. Strength Cond. Res. 2006, 20, 441–445. [Google Scholar] [CrossRef]
- Lloyd, R.S.; Oliver, J.L.; Hughes, M.G.; Williams, C.A. The effects of 4-weeks of plyometric training on reactive strength index and leg stiffness in male youths. J. Strength Cond. Res. 2012, 26, 2812–2819. [Google Scholar] [CrossRef]
- Michailidis, Y.; Fatouros, I.G.; Primpa, E.; Michailidis, C.; Avloniti, A.; Chatzinikolaou, A.; Barbero-Álvarez, J.C.; Tsoukas, D.; Douroudos, I.I.; Draganidis, D.; et al. Plyometrics’ trainability in preadolescent soccer athletes. J. Strength Cond. Res. 2013, 27, 38–49. [Google Scholar] [CrossRef]
- Meylan, C.; Malatesta, D. Effects of in-season plyometric training within soccer practice on explosive actions of young players. J. Strength Cond. Res. 2009, 23, 2605–2613. [Google Scholar] [CrossRef]
- Sáez de Villarreal, E.; Suarez-Arrones, L.; Requena, B.; Haff, G.G.; Ferrete, C. Effects of Plyometric and Sprint Training on Physical and Technical Skill Performance in Adolescent Soccer Players. J. Strength Cond. Res. 2015, 29, 1894–1903. [Google Scholar] [CrossRef]
- Chaouachi, A.; Othman, A.B.; Hammami, R.; Drinkwater, E.J.; Behm, D.G. The combination of plyometric and balance training improves sprint and shuttle run performances more often than plyometric-only training with children. J. Strength Cond. Res. 2014, 28, 401–412. [Google Scholar] [CrossRef]
- Beato, M.; Bianchi, M.; Coratella, G.; Merlini, M.; Drust, B. Effects of Plyometric and Directional Training on Speed and Jump Performance in Elite Youth Soccer Players. J. Strength Cond. Res. 2018, 32, 289–296. [Google Scholar] [CrossRef]
- Markovic, G. Does plyometric training improve vertical jump height? A meta-analytical review. Br. J. Sports Med. 2007, 41, 349–355. [Google Scholar] [CrossRef]
- Ramirez-Campillo, R.; Álvarez, C.; García-Hermoso, A.; Ramírez-Vélez, R.; Gentil, P.; Asadi, A.; Chaabene, H.; Moran, J.; Meylan, C.; García-de-Alcaraz, A.; et al. Methodological Characteristics and Future Directions for Plyometric Jump Training Research: A Scoping Review. Sports Med. 2018, 48, 1059–1081. [Google Scholar] [CrossRef]
- Chu, D.A. Plyometrics: The link between strength and speed. Natl. Strength Cond. Assoc. J. 1983, 5, 20–21. [Google Scholar] [CrossRef]
- Chmielewski, T.L.; Myer, G.D.; Kauffman, D.; Tillman, S.M. Plyometric exercise in the rehabilitation of athletes: Physiological responses and clinical application. J. Orthop. Sports Phys. Ther. 2006, 36, 308–319. [Google Scholar] [CrossRef]
- Rassier, D.E.; Herzog, W. Force enhancement and relaxation rates after stretch of activated muscle fibres. Proc. R. Soc. B 2005, 272, 475–480. [Google Scholar] [CrossRef]
- Bobbert, M.F.; Gerritsen, K.G.; Litjens, M.C.; Van Soest, A.J. Why is countermovement jump height greater than squat jump height? Med. Sci. Sports Exerc. 1996, 28, 1402–1412. [Google Scholar] [CrossRef]
- Blazevich, A. The stretch–shortening cycle (SSC). In Strength and Conditioning: Biological Principles and Practical Applications; Cardinale, M., Newton, R.U., Nosaka, K., Eds.; Wiley-Blackwell: Oxford, UK, 2011; pp. 209–222. [Google Scholar]
- Svantesson, U.; Grimby, G.; Thomeém, R. Potentiation of concentric plantar flexion torque following eccentric and isometric muscle actions. Acta Physiol. Scand. 1994, 152, 287–293. [Google Scholar] [CrossRef]
- McKinlay, B.J.; Wallace, P.; Dotan, R.; Long, D.; Tokuno, C.; Gabriel, D.A.; Falk, B. Effects of Plyometric and Resistance Training on Muscle Strength, Explosiveness, and Neuromuscular Function in Young Adolescent Soccer Players. J. Strength Cond. Res. 2018, 32, 3039–3050. [Google Scholar] [CrossRef]
- Heywood, S.E.; Mentiplay, B.F.; Rahmann, A.E.; McClelland, J.A.; Geigle, P.R.; Bower, K.J.; Clark, R.A. The Effectiveness of Aquatic Plyometric Training in Improving Strength, Jumping, and Sprinting: A Systematic Review. J. Sport Rehabil. 2022, 31, 85–98. [Google Scholar] [CrossRef]
- Cavagna, G.A.; Saibene, F.P.; Margaria, R. Effect of Negative Work on the Amount of Positive Work Performed by an Isolated Muscle. J. Appl. Physiol. 1965, 20, 157–158. [Google Scholar] [CrossRef]
- Watkins, C.M.; Storey, A.G.; McGuigan, M.R.; Gill, N.D. Implementation and Efficacy of Plyometric Training: Bridging the Gap Between Practice and Research. J. Strength Cond. Res. 2021, 35, 1244–1255. [Google Scholar] [CrossRef]
- Almeida, M.B.; Leandro, C.G.; Queiroz, D.D.R.; José-da-Silva, M.; Pessôa Dos Prazeres, T.M.; Pereira, G.M.; das-Neves, G.S.; Carneiro, R.C.; Figueredo-Alves, A.D.; Nakamura, F.Y.; et al. Plyometric training increases gross motor coordination and associated components of physical fitness in children. Eur. J. Sport Sci. 2021, 21, 1263–1272. [Google Scholar] [CrossRef]
- Bosco, C.; Komi, P.V.; Ito, A. Prestretch potentiation of human skeletal muscle during ballistic movement. Acta Physiol. Scand. 1981, 111, 135–140. [Google Scholar] [CrossRef]
- Bosco, C.; Ito, A.; Komi, P.V.; Luhtanen, P.; Rahkila, P.; Rusko, H.; Viitasalo, J.T. Neuromuscular function and mechanical efficiency of human leg extensor muscles during jumping exercises. Acta Physiol. Scand. 1982, 114, 543–550. [Google Scholar] [CrossRef] [PubMed]
- Behrens, M.; Mau-Moeller, A.; Bruhn, S. Effect of plyometric training on neural and mechanical properties of the knee extensor muscles. Int. J. Sport. Med. 2014, 35, 101–109. [Google Scholar] [CrossRef] [PubMed]
- de Villarreal, E.S.; González-Badillo, J.J.; Izquierdo, M. Low and moderate plyometric training frequency produces greater jumping and sprinting gains compared with high frequency. J. Strength Cond. Res. 2008, 22, 715–725. [Google Scholar] [CrossRef] [PubMed]
- Kyröläinen, H.; Avela, J.; McBride, J.M.; Koskinen, S.; Andersen, J.L.; Sipilä, S.; Takala, T.E.; Komi, P.V. Effects of power training on muscle structure and neuromuscular performance. Scand. J. Med. Sci. Sports 2005, 15, 58–64. [Google Scholar] [CrossRef]
- Ramírez-Campillo, R.; Andrade, D.C.; Izquierdo, M. Effects of plyometric training volume and training surface on explosive strength. J. Strength Cond. Res. 2013, 27, 2714–2722. [Google Scholar] [CrossRef]
- Taube, W.; Leukel, C.; Lauber, B.; Gollhofer, A. The drop height determines neuromuscular adaptations and changes in jump performance in stretch-shortening cycle training. Scand. J. Med. Sci. Sports 2012, 22, 671–683. [Google Scholar] [CrossRef]
- Laurent, C.; Baudry, S.; Duchateau, J. Comparison of Plyometric Training with Two Different Jumping Techniques on Achilles Tendon Properties and Jump Performances. J. Strength Cond. Res. 2020, 34, 1503–1510. [Google Scholar] [CrossRef]
- Davies, G.; Riemann, B.L.; Manske, R. Current concepts of plyometric exercise. Int. J. Sports Phys. Ther. 2015, 10, 760–786. [Google Scholar]
- Aloui, G.; Hermassi, S.; Khemiri, A.; Bartels, T.; Hayes, L.D.; Bouhafs, E.G.; Souhaiel Chelly, M.; Schwesig, R. An 8-Week Program of Plyometrics and Sprints with Changes of Direction Improved Anaerobic Fitness in Young Male Soccer Players. Int. J. Environ. Res. Public Health 2021, 18, 10446. [Google Scholar] [CrossRef]
- Ramirez-Campillo, R.; García-Hermoso, A.; Moran, J.; Chaabene, H.; Negra, Y.; Scanlan, A.T. The effects of plyometric jump training on physical fitness attributes in basketball players: A meta-analysis. J. Sport Health Sci. 2022, 11, 656–670. [Google Scholar] [CrossRef]
- Ndemba, P.B.A.; Ayina, C.N.A.; Guessogo, W.R.; Ndongo, J.M.; Kamnang, R.O.G.; Lele, C.E.B.; Mandengue, S.H.; Etoundi-Ngoa, L.S.; Temfemo, A. Effect of a 12-week training program on the anthropometric and physiological profiles of some participants registered in a fitness center in Douala, Cameroon. J. Exerc. Rehabil. 2020, 16, 369–376. [Google Scholar] [CrossRef]
- Suchomel, T.J.; Nimphius, S.; Bellon, C.R.; Stone, M.H. The Importance of Muscular Strength: Training Considerations. Sports Med. 2018, 48, 765–785. [Google Scholar] [CrossRef]
- Kons, R.L.; Orssatto, L.B.R.; Ache-Dias, J.; De Pauw, K.; Meeusen, R.; Trajano, G.S.; Dal Pupo, J.; Detanico, D. Effects of Plyometric Training on Physical Performance: An Umbrella Review. Sports Med. Open 2023, 9, 4. [Google Scholar] [CrossRef]
- Behrens, M.; Mau-Moeller, A.; Mueller, K.; Heise, S.; Gube, M.; Beuster, N.; Herlyn, P.K.; Fischer, D.C.; Bruhn, S. Plyometric training improves voluntary activation and strength during isometric, concentric and eccentric contractions. J. Sci. Med. Sport 2016, 19, 170–176. [Google Scholar] [CrossRef]
- Moran, J.; Sandercock, G.R.H.; Ramírez-Campillo, R.; Todd, O.; Collison, J.; Parry, D.A. Maturation-Related Effect of Low-Dose Plyometric Training on Performance in Youth Hockey Players. Pediatr. Exerc. Sci. 2017, 29, 194–202. [Google Scholar] [CrossRef]
- Swanik, K.A.; Thomas, S.J.; Struminger, A.H.; Bliven, K.C.; Kelly, J.D.; Swanik, C.B. The Effect of Shoulder Plyometric Training on Amortization Time and Upper-Extremity Kinematics. J. Sport Rehabil. 2016, 25, 315–323. [Google Scholar] [CrossRef]
- Ramírez-delaCruz, M.; Bravo-Sánchez, A.; Esteban-García, P.; Jiménez, F.; Abián-Vicén, J. Effects of Plyometric Training on Lower Body Muscle Architecture, Tendon Structure, Stiffness and Physical Performance: A Systematic Review and Meta-analysis. Sports Med. Open 2022, 8, 40. [Google Scholar] [CrossRef]
- Qi, F.; Kong, Z.; Xiao, T.; Leong, K.; Zschorlich, V.R.; Zou, L. Effects of Combined Training on Physical Fitness and Anthropometric Measures among Boys Aged 8 to 12 Years in the Physical Education Setting. Sustainability 2019, 11, 1219. [Google Scholar] [CrossRef]
- Bedoya, A.A.; Miltenberger, M.R.; Lopez, R.M. Plyometric Training Effects on Athletic Performance in Youth Soccer Athletes: A Systematic Review. J. Strength Cond. Res. 2015, 29, 2351–2360. [Google Scholar] [CrossRef] [PubMed]
- Chen, L.; Zhang, Z.; Huang, Z.; Yang, Q.; Gao, C.; Ji, H.; Sun, J.; Li, D. Meta-Analysis of the Effects of Plyometric Training on Lower Limb Explosive Strength in Adolescent Athletes. Int. J. Environ. Res. Public Health 2023, 20, 1849. [Google Scholar] [CrossRef] [PubMed]
- Faigenbaum, A.D.; McFarland, J.E.; Keiper, F.B.; Tevlin, W.; Ratamess, N.A.; Kang, J.; Hoffman, J.R. Medicine, Effects of a short-term plyometric and resistance training program on fitness performance in boys age 12 to 15 years. J. Sports Sci. Med. 2007, 6, 519. [Google Scholar] [PubMed]
- de Villarreal, E.S.; Kellis, E.; Kraemer, W.J.; Izquierdo, M. Determining variables of plyometric training for improving vertical jump height performance: A meta-analysis. J. Strength Cond. Res. 2009, 23, 495–506. [Google Scholar] [CrossRef] [PubMed]
- Kubo, K.; Ikebukuro, T.; Yata, H. Effects of plyometric training on muscle-tendon mechanical properties and behavior of fascicles during jumping. Physiol. Rep. 2021, 9, e15073. [Google Scholar] [CrossRef]
- Kim, S.; Rhi, S.Y.; Kim, J.; Chung, J.S. Plyometric training effects on physical fitness and muscle damage in high school baseball players. Phys. Act. Nutr. 2022, 26, 1–7. [Google Scholar] [CrossRef]
- Iseni, A. Influence of Explosive Force on Performance Results in Sprinter Runs in 14-Year-Old Students. Ph.D. Thesis, Faculty of Physical Education, Sport, and Health, Skopje, North Macedonia, 2016. [Google Scholar]
- Mirwald, R.L.; Baxter-Jones, A.D.G.; Bailey, D.A.; Beunen, G.P. An assessment of maturity from anthropometric measurements. Med. Sci. Sports Exerc. 2002, 34, 689–694. [Google Scholar] [CrossRef]
- Moore, S.A.; McKay, H.A.; Macdonald, H.; Nettlefold, L.; Baxter-Jones, A.D.; Cameron, N.; Brasher, P.M. Enhancing a Somatic Maturity Prediction Model. Med. Sci. Sports Exerc. 2015, 47, 1755–1764. [Google Scholar] [CrossRef]
- Franco-Márquez, F.; Rodríguez-Rosell, D.; González-Suárez, J.M.; Pareja-Blanco, F.; Mora-Custodio, R.; Yañez-García, J.M.; González-Badillo, J.J. Effects of Combined Resistance Training and Plyometrics on Physical Performance in Young Soccer Players. Int. J. Sports Med. 2015, 36, 906–914. [Google Scholar] [CrossRef]
- Zago, M.; Moorhead, A.P.; Bertozzi, F.; Sforza, C.; Tarabini, M.; Galli, M. Maturity offset affects standing postural control in youth male soccer players. J. Biomech. 2020, 99, 109523. [Google Scholar] [CrossRef]
- Malina, R.M.; Coelho-E-Silva, M.J.; Martinho, D.V.; Sousa-E-Siva, P.; Figueiredo, A.J.; Cumming, S.P.; Králík, M.; Kozieł, S.M. Observed and predicted ages at peak height velocity in soccer players. PLoS ONE 2021, 16, e0254659. [Google Scholar] [CrossRef]
- Farmer, O.; Belton, S.; O’Brien, W. The Relationship between Actual Fundamental Motor Skill Proficiency, Perceived Motor Skill Confidence, and Competence, and Physical Activity in 8–12-Year-Old Irish Female Youth. Sports 2017, 5, 74. [Google Scholar] [CrossRef]
- EUROFIT: Handbook for the EUROFIT Tests of Physical Fitness, 2nd ed.; Sports Division Strasbourg, Council of Europe Publishing and Documentation Service: Strasbourg, France, 1993.
- Oh, J.; Graber, K.C. Physical Education Teacher Education Leaders’ Perceptions on a National Curriculum in Physical Education. Res. Q. Exerc. Sport 2019, 90, 362–376. [Google Scholar] [CrossRef]
- Mackenzie, B. Performance evaluation tests. Lond. Electr. World Plc 2005, 24, 57–158. [Google Scholar]
- Milanović, D. The latentstructure of certain tests for the evaluation of explosive strength. Kineziologija 1981, 12, 35–42. [Google Scholar]
- Asllani, I. The Impact of Explosive Power on the Resultant Efficiency in Long-Range Jumps in Youth. Ph.D. Thesis, Faculty of Sport and Tourism, Novi Sad, Serbia, 2007. [Google Scholar]
- Haile, S.R.; Fühner, T.; Granacher, U.; Stocker, J.; Radtke, T.; Kriemler, S. Reference values and validation of the 1-minute sit-to-stand test in healthy 5-16-year-old youth: A cross-sectional study. BMJ Open 2021, 11, e049143. [Google Scholar] [CrossRef]
- Castro-Piñero, J.; Ortega, F.B.; Artero, E.G.; Girela-Rejón, M.J.; Mora, J.; Sjöström, M.; Ruiz, J.R. Assessing muscular strength in youth: Usefulness of standing long jump as a general index of muscular fitness. J. Strength Cond. Res. 2010, 24, 1810–1817. [Google Scholar] [CrossRef]
- Fernandez-Santos, J.R.; Ruiz, J.R.; Cohen, D.D.; Gonzalez-Montesinos, J.L.; Castro-Piñero, J. Reliability and Validity of Tests to Assess Lower-Body Muscular Power in Children. J. Strength Cond. Res. 2015, 29, 2277–2285. [Google Scholar] [CrossRef]
- Benito-Martínez, E.; Martínez-Amat, A.; Lara-Sánchez, A.J.; Berdejo-Del-Fresno, D.; Martínez-López, E.J. Effect of combined electrostimulation and plyometric training on 30 meters dash and triple jump. J. Sport. Med. Phys. Fit. 2013, 53, 387–395. [Google Scholar]
- Elbadry, N.; Hamza, A.; Pietraszewski, P.; Alexe, D.I.; Lupu, G. Effect of the French Contrast Method on Explosive Strength and Kinematic Parameters of the Triple Jump Among Female College Athletes. J. Hum. Kinet. 2019, 69, 225–230. [Google Scholar] [CrossRef]
- Markovic, G.; Dizdar, D.; Jukic, I.; Cardinale, M. Reliability and factorial validity of squat and countermovement jump tests. J. Strength Cond. Res. 2004, 18, 551–555. [Google Scholar] [CrossRef] [PubMed]
- Nonnato, A.; Hulton, A.T.; Brownlee, T.E.; Beato, M. The Effect of a Single Session of Plyometric Training Per Week on Fitness Parameters in Professional Female Soccer Players: A Randomized Controlled Trial. J. Strength Cond. Res. 2022, 36, 1046–1052. [Google Scholar] [CrossRef] [PubMed]
- Selmi, M.A.; Sassi, R.H.; Yahmed, M.H.; Giannini, S.; Perroni, F.; Elloumi, M. Normative Data and Physical Determinants of Multiple Sprint Sets in Young Soccer Players Aged 11-18 Years: Effect of Maturity Status. J. Strength Cond. Res. 2020, 34, 506–515. [Google Scholar] [CrossRef] [PubMed]
- Asadi, A.; Ramirez-Campillo, R.; Arazi, H.; Sáez de Villarreal, E. The effects of maturation on jumping ability and sprint adaptations to plyometric training in youth soccer players. J. Sports Sci. 2018, 36, 2405–2411. [Google Scholar] [CrossRef]
- Buckthorpe, M.; Morris, J.; Folland, J.P. Validity of vertical jump measurement devices. J. Sports Sci. 2012, 30, 63–69. [Google Scholar] [CrossRef]
- Scurt, M.D.; Scurt, C.; Balint, L.; Mijaica, R. Relationship between Body Mass Index and Muscle Strength, Potential Health Risk Factor at Puberty. Rev. Rom. Pentru Educ. Multidimens. 2022, 14, 93–111. [Google Scholar] [CrossRef]
- Drugau, S.; Balint, L.; Mijaica, R. Self-Perception of Skills Specific to Professional Development in Physical Education and Sports. Bull. Transilv. Univ. Braşov Ser. IX Sci. Hum. Kinet. 2022, 15, 71–78. [Google Scholar] [CrossRef]
- de Salles, P.G.; Vasconcellos, F.V.; de Salles, G.F.; Fonseca, R.T.; Dantas, E.H. Validity and reproducibility of the sargent jump test in the assessment of explosive strength in soccer players. J. Hum. Kinet. 2012, 33, 115–121. [Google Scholar] [CrossRef]
- Cohen, J. Statistical Power Analysis for the Behavioral Sciences; Routledge: Hillsdale, NJ, USA, 1988. [Google Scholar]
- Hopkins, W.G.; Marshall, S.W.; Batterham, A.M.; Hanin, J. Progressive statistics for studies in sports medicine and exercise science. Med. Sci. Sports Exerc. 2009, 41, 3–13. [Google Scholar] [CrossRef]
- Ferley, D.D.; Scholten, S.; Vukovich, M.D. Combined Sprint Interval, Plyometric, and Strength Training in Adolescent Soccer Players: Effects on Measures of Speed, Strength, Power, Change of Direction, and Anaerobic Capacity. J. Strength Cond. Res. 2020, 34, 957–968. [Google Scholar] [CrossRef]
- Behm, D.G.; Young, J.D.; Whitten, J.H.D.; Reid, J.C.; Quigley, P.J.; Low, J.; Li, Y.; Lima, C.D.; Hodgson, D.D.; Chaouachi, A.; et al. Effectiveness of Traditional Strength vs. Power Training on Muscle Strength, Power and Speed with Youth: A Systematic Review and Meta-Analysis. Front. Physiol. 2017, 8, 423. [Google Scholar] [CrossRef]
- Johnson, B.A.; Salzberg, C.L.; Stevenson, D.A. A systematic review: Plyometric training programs for young children. J. Strength Cond. Res. 2011, 25, 2623–2633. [Google Scholar] [CrossRef]
- Morina, B.; Miftari, F.; Badau, D. Fitness Level Differences between Students in Kosovo and Montenegro. Educ. Sci. 2021, 11, 140. [Google Scholar] [CrossRef]
- Bogdanis, G.C.; Donti, O.; Papia, A.; Donti, A.; Apostolidis, N.; Sands, W.A. Effect of Plyometric Training on Jumping, Sprinting and Change of Direction Speed in Child Female Athletes. Sports 2019, 7, 116. [Google Scholar] [CrossRef]
- Badau, A.; Rachita, A.; Sasu, C.R.; Clipa, A. Motivations and the Level of Practicing Physical Activities by Physio-Kinetotherapy Students. Educ. Sci. 2018, 8, 97. [Google Scholar] [CrossRef]
- Uthoff, A.; Sommerfield, L.M.; Pichardo, A.W. Effects ofresistance training methods on golf clubhead speed andhitting distance: A systematic review. J. Strength Cond. Res. 2021, 35, 2651–2660. [Google Scholar] [CrossRef]
- Lockie, R.G.; Murphy, A.J.; Callaghan, S.J.; Jeffriess, M.D. Effects of sprint and plyometrics training on field sport acceleration technique. J. Strength Cond. Res. 2014, 28, 1790–1801. [Google Scholar] [CrossRef]
- Marta, C.; Alves, A.R.; Casanova, N.; Neiva, H.P.; Marinho, D.A.; Izquierdo, M.; Nunes, C.; Marques, M.C. Suspension vs. Plyometric Training in Children’s Explosive Strength. J. Strength Cond. Res. 2022, 36, 433–440. [Google Scholar] [CrossRef]
- Wilder, J.N.; Riggins, E.R.; Noble, R.A.; Lelito, C.M.; Widenhoefer, T.L.; Almonroeder, T.G. The effects of drop vertical jump technique on landing and jumping kinetics and jump performance. J. Electromyogr. Kinesiol. 2021, 56, 102504. [Google Scholar] [CrossRef]
- Tottori, N.; Fujita, S. Effects of Plyometric Training on Sprint Running Performance in Boys Aged 9-12 Years. Sports 2019, 7, 219. [Google Scholar] [CrossRef]
- Hammami, M.; Negra, Y.; Aouadi, R.; Shephard, R.J.; Chelly, M.S. Effects of an In-season Plyometric Training Program on Repeated Change of Direction and Sprint Performance in the Junior Soccer Player. J. Strength Cond. Res. 2016, 30, 3312–3320. [Google Scholar] [CrossRef] [PubMed]
- Gjinovci, B.; Idrizovic, K.; Uljevic, O.; Sekulic, D. Plyometric Training Improves Sprinting, Jumping and Throwing Capacities of High Level Female Volleyball Players Better Than Skill-Based Conditioning. J. Sports Sci. Med. 2017, 16, 527–535. [Google Scholar] [PubMed]
- Paillard, T.; Lafont, C.; Soulat, J.M.; Montoya, R.; Costes-Salon, M.C.; Dupui, P. Short-term effects of electrical stimulation superimposed on muscular voluntary contraction in postural control in elderly women. J. Strength Cond. Res. 2005, 19, 640–646. [Google Scholar] [CrossRef] [PubMed]
- Bax, L.; Staes, F.; Verhagen, A. Does neuromuscular electrical stimulation strengthen the quadriceps femoris? A systematic review of randomised controlled trials. Sports Med. 2005, 35, 191–212. [Google Scholar] [CrossRef]
- Lum, D.; Tan, F.; Pang, J.; Barbosa, T.M. Effects of intermittent sprint and plyometric training on endurance running performance. J. Sport Health Sci. 2019, 8, 471–477. [Google Scholar] [CrossRef]
- Negra, Y.; Chaabene, H.; Stöggl, T.; Hammami, M.; Chelly, M.S.; Hachana, Y. Effectiveness and time-course adaptation of resistance training vs. plyometric training in prepubertal soccer players. J. Sport Health Sci. 2020, 9, 620–627. [Google Scholar] [CrossRef]
- Markovic, G.; Mikulic, P. Neuro-musculoskeletal and performance adaptations to lower-extremity plyometric training. Sports Med. 2010, 40, 859–895. [Google Scholar] [CrossRef]
- Stojanović, E.; Ristić, V.; McMaster, D.T.; Milanović, Z. Effect of Plyometric Training on Vertical Jump Performance in Female Athletes: A Systematic Review and Meta-Analysis. Sports Med. 2017, 47, 975–986. [Google Scholar] [CrossRef]
- Chelly, M.S.; Hermassi, S.; Shephard, R.J. Effects of In-Season Short-term Plyometric Training Program on Sprint and Jump Performance of Young Male Track Athletes. J. Strength Cond. Res. 2015, 29, 2128–2136. [Google Scholar] [CrossRef]
- Hammami, M.; Gaamouri, N.; Ramirez-Campillo, R.; Shephard, R.J.; Bragazzi, N.L.; Chelly, M.S.; Knechtle, B.; Gaied, S. Effects of high-intensity interval training and plyometric exercise on the physical fitness of junior male handball players. Eur. Rev. Med. Pharmacol. Sci. 2021, 25, 7380–7389. [Google Scholar] [CrossRef]


| Groups | Control Group-CG | Plyometric Group-PG | ||
| Tests | Pre-Test | Post-Test | Pre-Test | Post-Test |
| Number of Subjects | 105 | 90 | ||
| Parameters | Mean ± St. Dev. | Mean ± St. Dev. | Mean ± St. Dev. | Mean ± St. Dev. |
| Age (years) | 15.6 ± 2.3 | 15.9 ± 2.1 | 15.9 ± 2.6 | 15.12 ± 2.1 |
| Height (cm) | 168.8 ± 7.4 | 168.8 ± 7.4 | 169.3 ± 6.8 | 169.3 ± 6.8 |
| Body mass (kg) | 56.8 ± 10.3 | 56.8 ± 10.3 | 60.4 ± 8.5 | 59.9 ± 7.9 |
| BMI (kg/m2) | 20.8 ± 3.2 | 20.8 ± 3.2 | 21.1 ± 3.6 | 20.9 ± 3.2 |
| Age and PHV | 13.9 ± 0.40 | 13.9 ± 0.41 | 14.2 ± 0.52 | 14.4 ± 0.54 |
| Maturity Offset (Years) | 1.0 ± 0.43 | 1.0 ± 0.44 | 1.3 ± 0.54 | 1.4 ± 0.54 |
| Training experience (y) | Physical education programs | 12-week programs | ||
| Exercises | Week 0 | Week 1–3 | Week 4–6 | Week 7–9 | Week 10–12 | Week 10–12 | Week 13 |
|---|---|---|---|---|---|---|---|
| Sprint 10 m- two-legged jumps 10 m | Pre-test | ×3 | Post-test | ||||
| Sprint 10 m- jumps with one leg 10 m | ×3 | ||||||
| Progressive sprint 30 m | ×3 | ||||||
| Progressive sprint 40 m | ×3 | ||||||
| Deep jumps with two feet 30 m | ×3 | ||||||
| Jumps with one and the other leg zig-zag 30 m | ×3 | ||||||
| Two-legged plyometric box jumps 20 (50 cm) | 3 × 10 | ||||||
| Two-legged plyometric box jumps 25 (63 cm) | 3 × 10 | ||||||
| Double leg jumps on plyometric box 30 (76 cm) | 3 × 10 | ||||||
| One-legged plyometric box jumps 20 (50 cm) | 4 × 10 | ||||||
| Deep jumps on the Swedish box 60 cm | 4 × 10 | ||||||
| Deep jumps on the Swedish box 80 cm | 4 × 10 | ||||||
| Deep jumps on the Swedish box 100 cm | 4 × 10 | ||||||
| Jumps with the right leg 10 m–jump with the left leg 10 m—sprint 10 m | ×4 | ×4 | |||||
| Jumps on two feet left-right zig-zag 30 m | ×4 | ×4 | |||||
| Jumps with two legs between hurdles 30 m | ×4 | ×4 |
| Test | Group | Test | Mean ± St. Dev | Cohen’s d (Pre vs. Post-Training) | Effect-Size | p Value (Pre vs. Post-Training) |
|---|---|---|---|---|---|---|
| S30 m speed | CG | Pre | 4.94 ± 0.446 | −1.166 | −0.53 | 0.014 |
| Post | 5.66 ± 0.750 | |||||
| PG | Pre | 4.77 ± 0.528 | 0.367 | 0.180 | 0.000 | |
| Post | 4.59 ± 0.449 | |||||
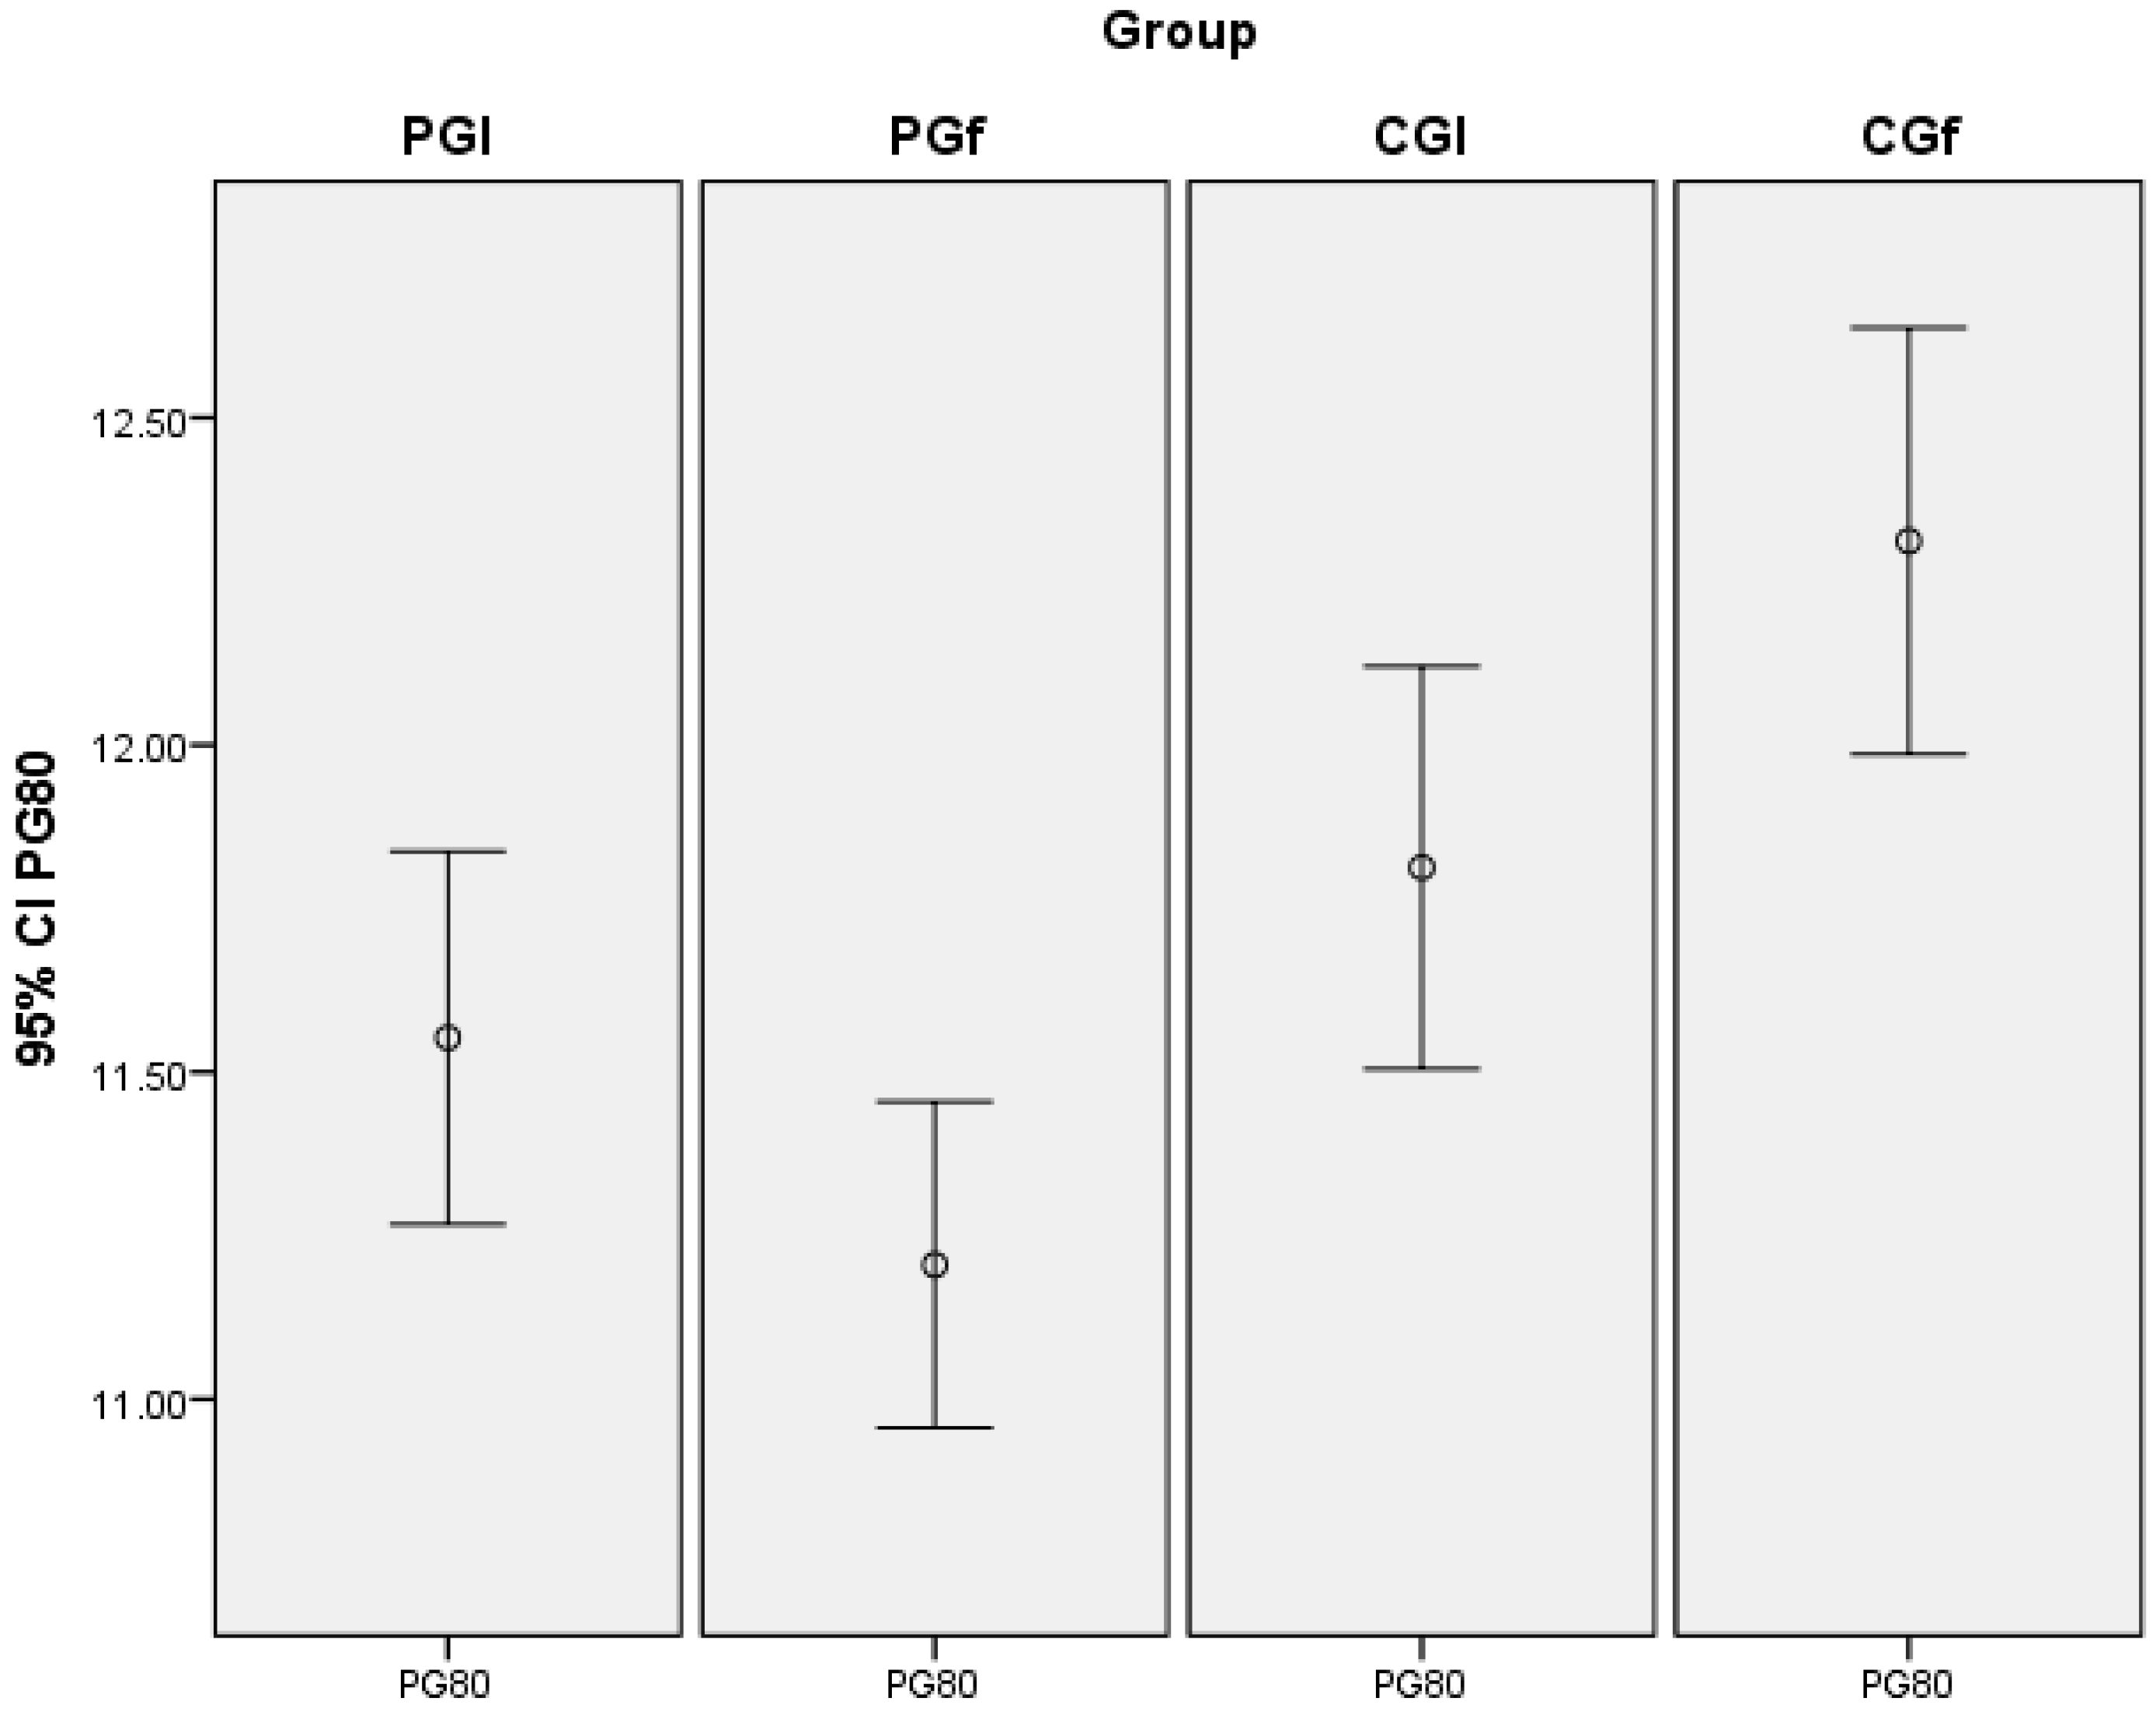
| S80 m speed | CG | Pre | 11.81 ± 1.38 | −0351 | −0.173 | 0.070 |
| Post | 12.31 ± 1.46 | |||||
| PG | Pre | 11.55 ± 1.36 | 0.273 | 0.135 | 0.028 | |
| Post | 11.20 ± 1.19 | |||||
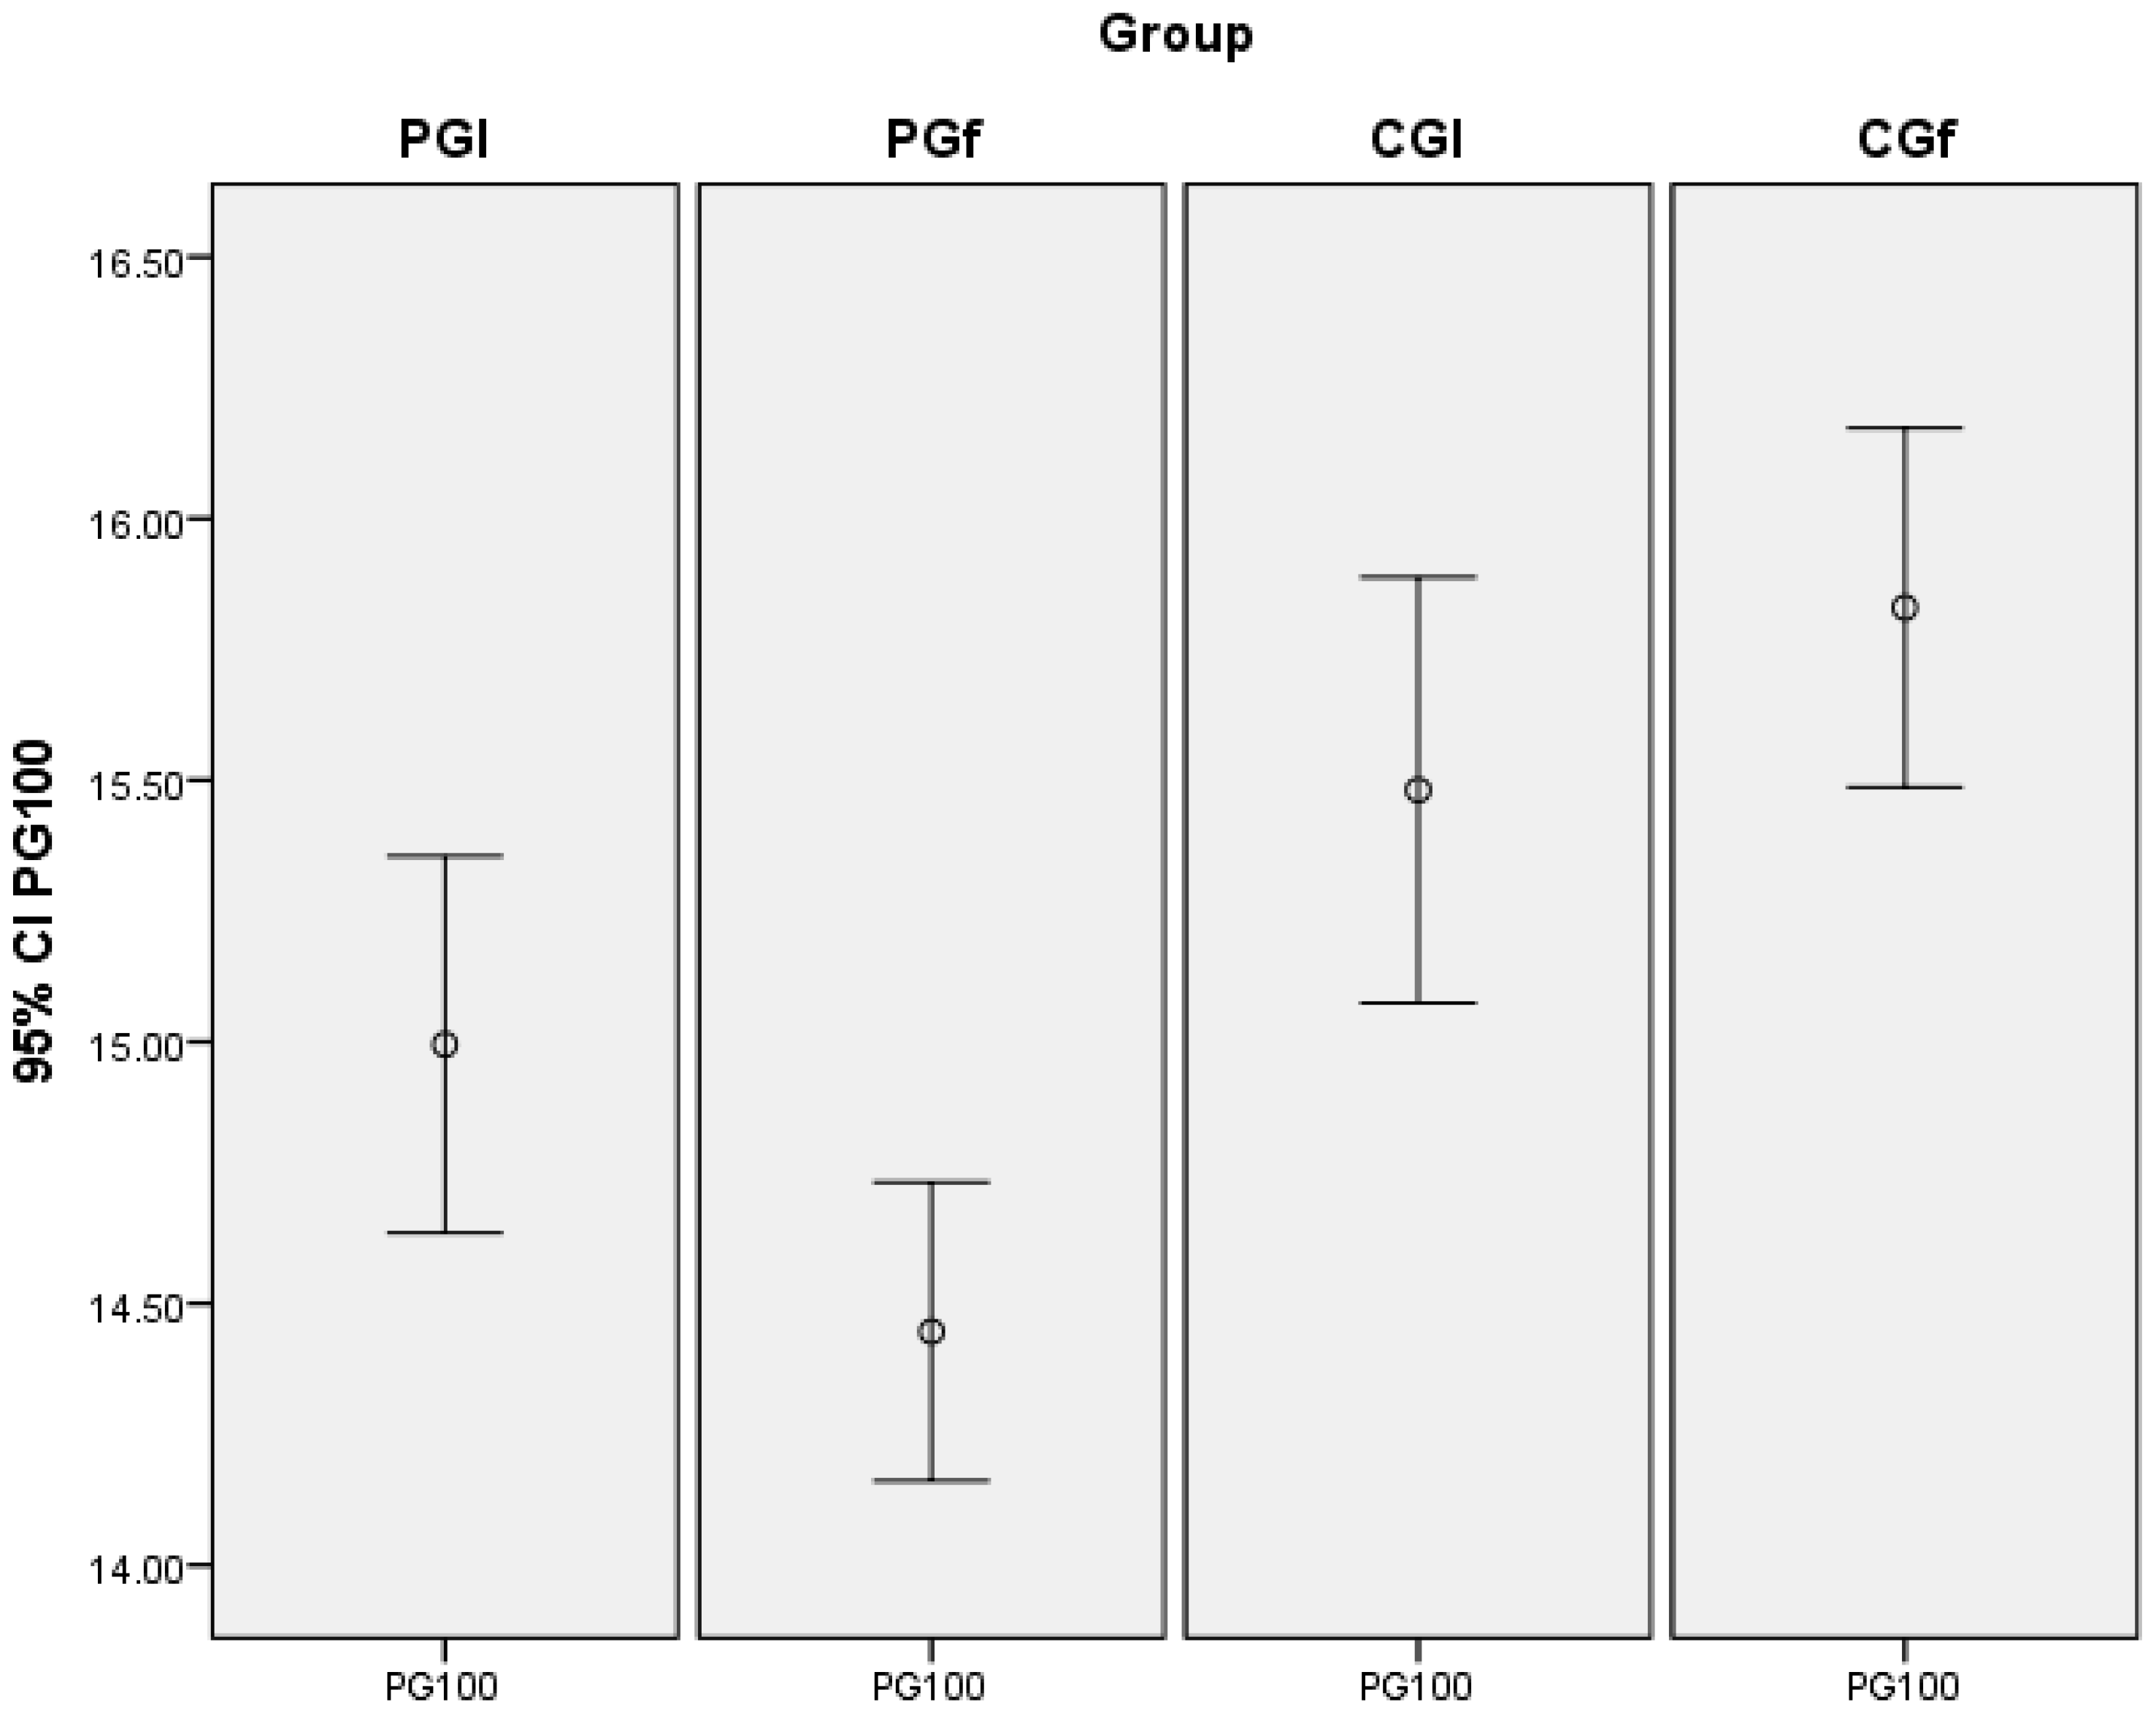
| S100 m speed | CG | Pre | 15.48 ± 1.82 | −0.201 | −0.100 | 0.019 |
| Post | 15.82 ± 1.54 | |||||
| PG | Pre | 14.99 ± 1.71 | 0.356 | 0.175 | 0.194 | |
| Post | 14.44 ± 1.36 | |||||
| SBJ | CG | Pre | 194.81 ± 28.14 | −1.112 | −0.486 | 0.000 |
| Post | 225.33 ± 27.41 | |||||
| PG | Pre | 196.44 ± 27.47 | 0.892 | 0.407 | 0.020 | |
| Post | 266.53 ± 26.74 | |||||
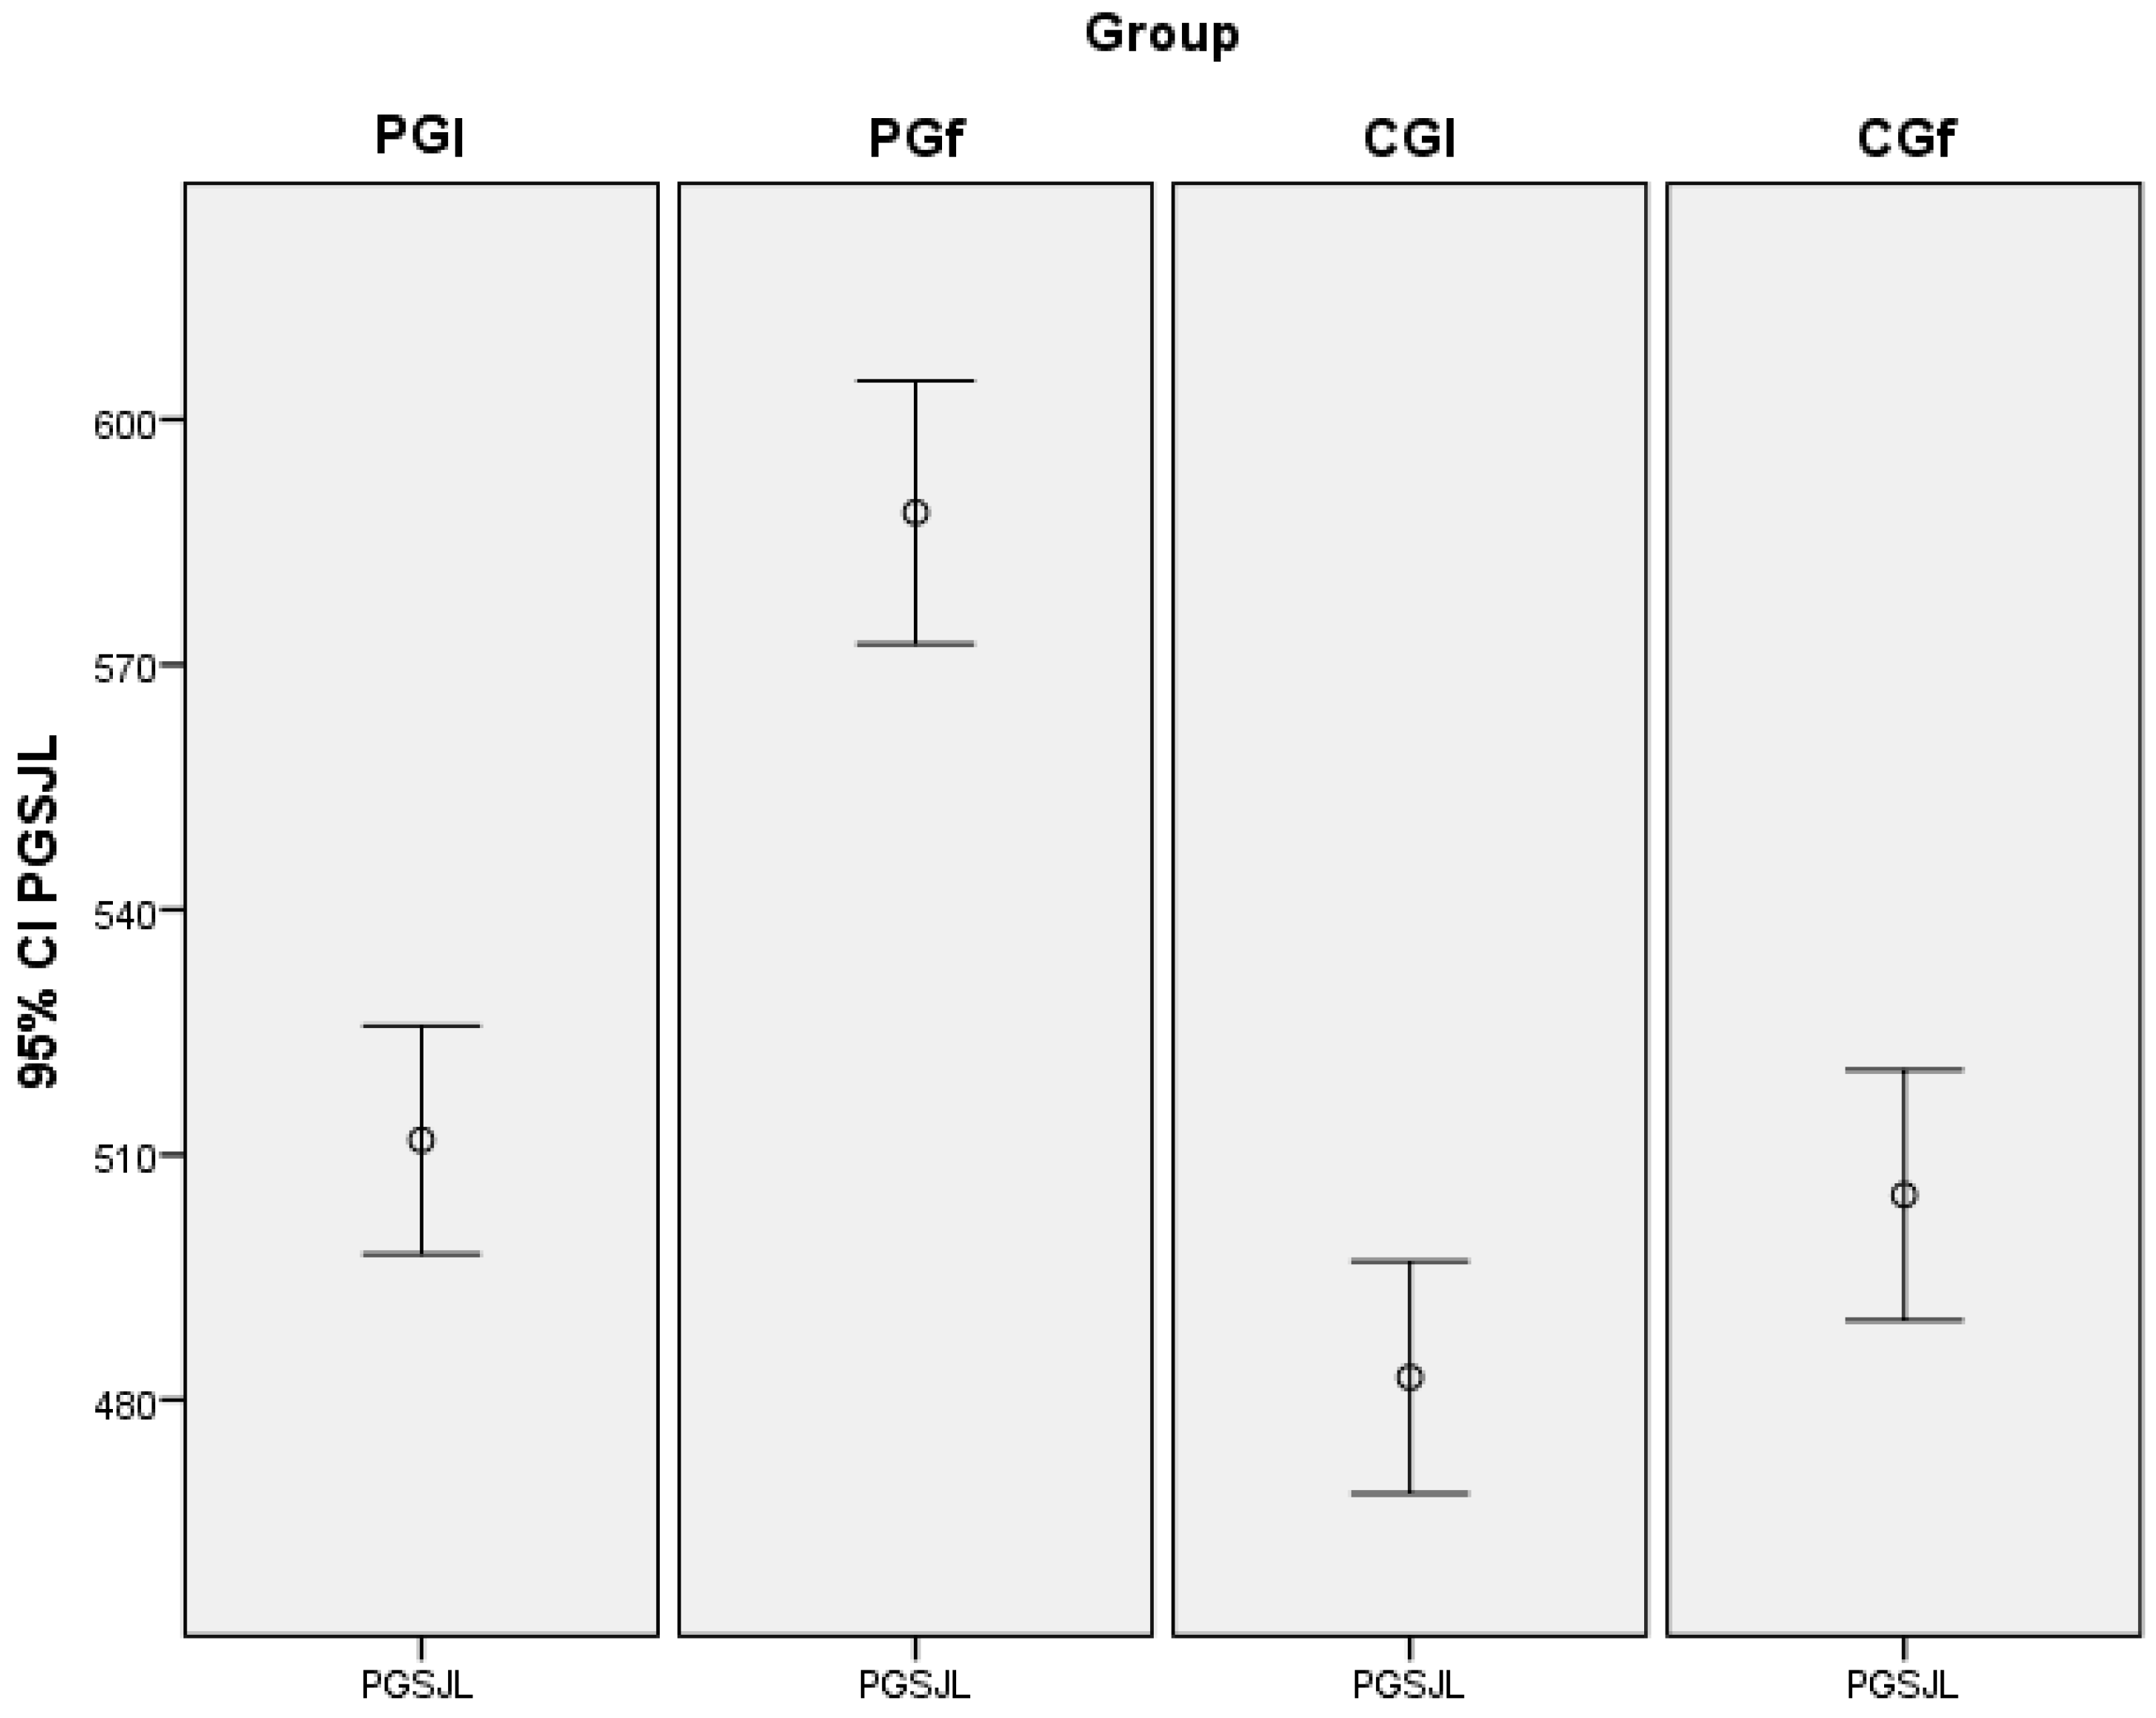
| SLJ | CG | Pre | 498.74 ± 56.45 | −0.919 | −0.417 | 0.000 |
| Post | 548.65 ± 51.98 | |||||
| PG | Pre | 502.64 ± 56.38 | −2.200 | −0.739 | 0.035 | |
| Post | 621.54 ± 51.59 | |||||
| VJT | CG | Pre | 32.01 ± 5.76 | −0.935 | −0.423 | 0.000 |
| Post | 37.03 ± 4.94 | |||||
| PG | Pre | 32.05 ± 5.59 | −3.421 | −0.863 | 0.000 | |
| Post | 49.94 ± 4.84 |
| Tests | VJT | SBJ | SJL | S30 | S80 | S100 | |
|---|---|---|---|---|---|---|---|
| VJT | Pearson Correlation | 1.000 | 0.733 | 0.712 | −0.483 | −0.545 | −0.563 |
| Sig. (2-tailed) | . | 0.000 | 0.000 | 0.000 | 0.000 | 0.000 | |
| SBJ | Pearson Correlation | 0.733 | 1.000 | 0.811 | −0.604 | −0.682 | −0.697 |
| Sig. (2-tailed) | 0.000 | . | 0.000 | 0.000 | 0.000 | 0.000 | |
| SJL | Pearson Correlation | 0.712 | 0.811 | 1.000 | −0.541 | −0.609 | −0.630 |
| Sig. (2-tailed) | 0.000 | 0.000 | . | 0.000 | 0.000 | 0.000 | |
| S30 m speed | Pearson Correlation | −0.483 | −0.604 | −0.541 | 1.000 | 0.797 | 0.770 |
| Sig. (2-tailed) | 0.000 | 0.000 | 0.000 | . | 0.000 | 0.000 | |
| S80 m speed | Pearson Correlation | −0.545 | −0.682 | −0.609 | 0.797 | 1.000 | 0.917 |
| Sig. (2-tailed) | 0.000 | 0.000 | 0.000 | 0.000 | . | 0.000 | |
| S100 m speed | Pearson Correlation | −0.563 | −0.697 | −0.630 | 0.770 | 0.917 | 1.000 |
| Sig. (2-tailed) | 0.000 | 0.000 | 0.000 | 0.000 | 0.000 | . | |
Disclaimer/Publisher’s Note: The statements, opinions and data contained in all publications are solely those of the individual author(s) and contributor(s) and not of MDPI and/or the editor(s). MDPI and/or the editor(s) disclaim responsibility for any injury to people or property resulting from any ideas, methods, instructions or products referred to in the content. |
© 2023 by the authors. Licensee MDPI, Basel, Switzerland. This article is an open access article distributed under the terms and conditions of the Creative Commons Attribution (CC BY) license (https://creativecommons.org/licenses/by/4.0/).
Share and Cite
Kryeziu, A.R.; Iseni, A.; Teodor, D.F.; Croitoru, H.; Badau, D. Effect of 12 Weeks of the Plyometric Training Program Model on Speed and Explosive Strength Abilities in Adolescents. Appl. Sci. 2023, 13, 2776. https://doi.org/10.3390/app13052776
Kryeziu AR, Iseni A, Teodor DF, Croitoru H, Badau D. Effect of 12 Weeks of the Plyometric Training Program Model on Speed and Explosive Strength Abilities in Adolescents. Applied Sciences. 2023; 13(5):2776. https://doi.org/10.3390/app13052776
Chicago/Turabian StyleKryeziu, Artan R., Astrit Iseni, Dragos Florin Teodor, Horia Croitoru, and Dana Badau. 2023. "Effect of 12 Weeks of the Plyometric Training Program Model on Speed and Explosive Strength Abilities in Adolescents" Applied Sciences 13, no. 5: 2776. https://doi.org/10.3390/app13052776
APA StyleKryeziu, A. R., Iseni, A., Teodor, D. F., Croitoru, H., & Badau, D. (2023). Effect of 12 Weeks of the Plyometric Training Program Model on Speed and Explosive Strength Abilities in Adolescents. Applied Sciences, 13(5), 2776. https://doi.org/10.3390/app13052776