Article

Copper Bioavailability and Leaching in Conventional and Organic Viticulture under Environmental Stress

1
Wine Research Centre, University of Nova Gorica, Vipavska cesta 13, 5000 Nova Gorica, Slovenia
2
Department of Agricultural, Food, Environmental and Animal Sciences, University of Udine, Via delle Scienze 206, 33100 Udine, Italy
*
Author to whom correspondence should be addressed.
Appl. Sci. 2023, 13(4), 2595; https://doi.org/10.3390/app13042595
Submission received: 20 January 2023 / Revised: 8 February 2023 / Accepted: 12 February 2023 / Published: 17 February 2023
(This article belongs to the Special Issue Sustainable Agriculture and Soil Conservation II)

Abstract

:
The continuous use of Cu-based fungicides in viticulture has caused Cu accumulation in soils, which represents a major environmental and toxicological concern. The purpose of this study was to verify whether the organic management would be more resilient to temperature and moisture stresses in comparison to conventional practices. Two organic and two conventional vineyard soils, contrasting in pH, were exposed for six months to temperature stress (29 °C), moisture stress (10% water holding capacity—WHC), and combined stresses (29 °C—10% WHC). Main soil properties, Cu speciation, bioavailability, and leaching were monitored before and after 6 months’ incubation. Results confirm that the increase of temperature caused a decrease in both total organic carbon (TOC) and dissolved organic carbon (DOC) (up to 19% and 49%, respectively), a decrease in available ammonium, and an increase in nitrate. Moisture stress tends to mitigate some of these changes. Despite that, changes of Cu bioavailability and leaching were limited and rarely significant. Moreover, no regular trends between conventional and organic management could be observed. Changes in soil pH and total N (TN) appeared as the most influencing properties to regulate Cu behavior in vineyard soils. Calcareous soils were more resistant to environmental stresses compared to acid soils, regardless of the type of management (conventional or organic).

1. Introduction

Among the processed crops, which include all agricultural and food products obtained from their respective primary raw materials, wine is the second most important in Europe after beer (FAOSTAT [1]). The European wine-growing areas are generally located in climatic zones which, however, favor the occurrence of fungal diseases, including downy mildew (Plasmopara viticola). The regular and intensive use of Cu-based fungicides (e.g., Bordeaux mixture, Cu oxychloride, or Cu hydroxide) to protect grape vine plants from these pests has led, in the long-term, to an accumulation of Cu in vineyard soils (especially in the upper horizons), hence reaching concentrations far above the trace levels required for healthy plant growth [2] and possibly even exceeding the limits prescribed for safe agricultural soils (50–150 mg kg−1, with lower levels for acid soils) in the European Union (EU). In 2018, the results of the study, which used 21,682 soil samples to study copper distribution in 25 EU Member States [3], showed that vineyards have the highest average soil Cu concentration of all land use categories.
As organic agricultural methods are becoming more common, especially in Europe, where over the decade 2010–2019 the total area of vineyards under organic management tripled to 380,000 ha [4], the total use of Cu-based fungicides remains an important issue, since these pesticides have not yet an effective substitute in organic viticulture. It must be stressed that Cu is also an essential element for plants and is, by definition, necessary for the proper functioning of all organisms, since it plays a key role in various biochemical and physiological processes associated with the growth and development of plants [5]. Nevertheless, depending on the concentration and its bioavailable fraction, Cu can also have toxic effects on plants, especially at very high bioavailable Cu concentrations; grape vine plant growth and productivity could be severely impaired [6,7,8,9].
Winegrowing is considered a low contributor to greenhouse gases (GHG) emissions compared to other human activities, but more attention should be paid to the consequences that climate change will have on vineyards in the future [10]. Taking into consideration different prediction models, we can see that for Mediterranean regions in the twenty-first century, the mean temperature will warm 20% more than the global average [11]. Warming will be particularly large in summer and for the northern Mediterranean land areas, where Slovenia is also located, and the increase is predicted to be up to 100% larger than the global average temperature rise [11]. Reduction of precipitation (predicted decrease average rate around −20 mm/°C) will affect all seasons; moreover, for the northern Mediterranean region, the reduction will be largest in summer [11], when the vine plants need the majority of water as the grapes develop and ripen during this time. Based on these predictions, severe or extreme droughts are expected to become substantially more frequent than the recent past [12]. If extreme droughts in the recent past were occurring once in 10 years, in southern Europe by the late 21st century with increase of temperature for 8.5 °C, such events would be experienced about every second year [13], regardless of the degree of mitigation of CO2 emissions that will be followed [14]. This alternative stability of climatic pressure lies outside the limits of ecosystem resilience and may indicate that in some cases vegetation will either adapt to the new conditions or be succeeded by more water-stress-tolerant species [15]. Climate changes raise concerns about the fate of the Mediterranean wine production and the effectiveness of mitigation measures.
The availability and leaching of Cu is strongly correlated with soil pH and soil organic matter content [16], type and content of clay [17], and carbonate and phosphate content [18]. Fernández-Calviño and colleagues [19] examined soils from 170 vineyards in Spain that had been treated for a long time with Cu-based fungicides and have a pH between 4.9 and 6.6. They found that Cu is mainly found in less mobile fractions, with about 48% being bound to soil organic matter. Similar results were also reported from other researchers [20,21,22]. Villanueva-Rey and colleges [23] found that the organic carbon content in soils is one of the main factors influencing the Cu toxicity potential: a higher content is associated with a lower ecotoxicity potential. Due to the high affinity of Cu to soil colloids and especially to soil organic matter, Cu is classified as a less mobile element in near-neutral soils [16]. For this reason, wine producers have been able to apply large quantities of Cu salts to soils over time without causing evident toxicity to crops [24]. Nevertheless, it is quite common for soil organic matter to be scarce in vineyards, especially in Mediterranean areas, due to several factors. First of all, the vineyards are generally located in hilly areas and on less fertile soils that are prone to erosion. Moreover, preparing the soil to adapt to the vineyard’s mechanization is a common practice that sometimes creates degraded areas due to the reduction of soil depth and water storage capacity, excessive accumulation of calcium carbonate in the topsoil, and loss of soil structure [25].
About two decades ago, aspects of temperature sensitivity and degradation rates of soil organic matter, which according to Arrhenius kinetics [26] can increase with increasing temperature, as well as the realization that more complex molecular properties in soil organic matter are characterized by low degradation rates, high activation energies, and inherently high temperature sensitivity [27], triggered a new generation of research on this topic. The temperature sensitivity of soil organic matter has been intensively studied, and numerous reviews, summaries, and meta-analyses using laboratory incubation studies [28,29] have been conducted to answer questions about the relative decomposability of soil organic matter. These studies used different incubation temperatures from −15 °C up to +55 °C and also different incubation times from a few hours up to 720 days. As there are already a lot of different data on the incubation of different soil types, Schädel and colleges [30] made the Soil Incubation Database (SIDb, version 1.0, https://soilbgc-datashare.github.io/sidb/, accessed on 11 February 2023) available online. Soil incubation studies in the laboratory are often used to estimate the decomposability of soil organic matter by measuring the release of greenhouse gases (i.e., CO2 or CH4) when C is mineralized from the soil under different redox conditions. The results of incubation studies can inform global models of the size of the C pool and the rate of soil organic matter processing and the sensitivity of process rates to changes in abiotic factors such as soil temperature, moisture, pH, etc. However, there have not been many applicative studies on the effects of organic matter loss in agricultural land and even fewer on vineyard soils. These studies tend to focus more on how different management systems in vineyards affect soil organic matter [31,32,33]. As mentioned above, Cu has a high affinity to soil colloids and especially to soil organic matter, which makes Cu a low-mobility element, particularly in soils with pH close to neutrality. Due to the potential decomposition of organic matter caused by global warming in the topsoil of arable land, water contamination from vineyards can also be expected in the long term. From this point of view, it is very important to identify possible changes in soil organic matter in vineyards contaminated with Cu and their consequences.
The aim of this work is to compare the resilience of organic vineyards to conventional managed ones in relation to the risk of an increase of plant availability and leaching of Cu from contaminated soils as consequence of climate stresses: temperature increase, moisture decrease, and combined climatic stresses. Our hypothesis is that the increased mineralization of SOM caused by temperature rise would release complexed Cu into solution, increasing its bioavailability and hence its leaching risk, and that organic-managed soils containing more recent SOM would be more vulnerable than conventional-managed ones.

2. Materials and Methods

2.1. Soil Sampling and Physicochemical Properties

Two organic and two correspondent conventionally managed vineyard soils of contrasting pH, polluted with high levels of Cu, were selected from a preliminary large soil survey. Soils were sampled in two Slovenian wine regions (Štajerska and Vipava Valley). Three soils (acid conventional, acid organic, and calcareous organic) were taken from the wine region of Štajerska, and one soil (calcareous conventional) from the Vipava Valley. Total Cu in all selected soils was above 100 mg kg−1, but not achieving the extreme values measured in some Slovenian vineyards [34]. The vineyards were more than 20 years old and soil surfaces were permanently covered with grass. Sampling was carried out with an auger at 10–15 different points randomly distributed throughout the vineyard to a depth of 20 cm. Soils were collected in August 2020. Approximate mass of sample taken on field was about 10 kg.
Soil samples were sieved through a 2 mm sieve and divided into two parts: 1 kg of sample was air-dried for chemical analyses, and the rest was kept moist and used for climate change simulations (see Section 2.2). Part of soil samples were additionally grounded and sieved through 250 µm sieve for total Cu measurement. Pseudo-total Cu in soil was measured using the USEPA 3052 [35] mineralization method and inductively coupled plasma atomic emission spectroscopy, ICP-AES, (Agilent 5800). In brief, 0.5 g of soil (sieve through 250 µm) was digested in a microwave oven using 10 mL of concentrated (65%) HNO3. The digest solution was filtrated using a 0.2 µm PTFE filter and measured after dilution and addition of yttrium (Y) as internal standard.
The soils were also fully characterized for texture, pH, total carbonates, total organic carbon and total nitrogen (TOC and TN), dissolved organic carbon (DOC), available phosphorus (Olsen P), and inorganic nitrogen (NO3/NH4+). Soil texture was measured in a Bouyoucos’ cylinder with an ASTM 152H hydrometer. Soil pH was measured in water (1:5, weight-to-volume ratio). Total organic carbon and total nitrogen (TOC and TN) were determined by automated thermal analyses where carbon is converted to CO2 by flash combustion at 1080 °C (Costech Elemental Combustion System 102 elemental analyzer, Costech Instruments, Valencia, CA, USA). Carbonates were previously removed from 10 mg of soils by treatment with HCl in silver capsules. C/N ratios were then calculated. Dissolved organic carbon (DOC) was measured on dry, sieved soils (12.5 g) using 30 mL 0.5 M K2SO4 in a 50 mL Falcon tube. The extraction time was 1 h at 200 RPM shaking. After extraction, samples were filtrated (0.2 µm CA filter) and frozen before analyses. DOC was measured using carbon analyzer (TOC-VCPN, Shimadzu). Inorganic C analysis (carbonates) was determined using a modified pressure-calcimeter method. Olsen P was measured using 2 g of soil sample extracted into 40 mL of 0.5 M NaHCO3 [36]. After extraction (30 min, 250 RPM) the solution was filtrated (0.2 µm CA filter) and P measured with ICP-AES. Calibration was performed using standard solutions (0.5, 1, 5, 10, 20 ppm) prepared from a P 1000 mg L−1 ICP-standard solution in 5% HNO3, with Y as internal standard.
Inorganic nitrogen (NO3 and NH4+) was measured after 60 min extraction of 5 g soil into 25 mL of 0.5 M KCl at 200 RPM. Extraction solution was filtrated through a 150 mm glass filter paper and determined using a segmented flow injection analyzer (Skalar San++, Breda, The Netherlands).

2.2. Soil Incubations

The temperature sensitivity of soil organic matter is a key factor determining the response of the terrestrial carbon balance to climate warming. In this research, a modified laboratory design by Hartley and Ineson [37] was used for determining soil C losses in response to warming, drought, and combined climatic stress (i.e., warming plus drought). The selected soils were sieved through a 2 mm mesh and preincubated aerobically for 14 days at 20 °C and 40% water holding capacity (WHC) (named as “before incubation”). After preincubation, soil samples were divided into 16 pots with 1.5 kg of soil. Each soil sample was exposed, for 6 months, to four different conditions that differ in temperature and moisture: 19 °C and 40% WHC (control without stress), 19 °C and 10% WHC (moisture stress), 29 °C and 40% WHC (temperature stress), and 29 °C and 10% WHC (combined stress) (see Supplementary Material Figure S1). To keep the soil moisture constant, incubations were carried out in sealed containers of about 1 L capacity, positioned in two temperature-controlled chambers. Moisture was controlled every month and water was added if required. Sampling of the incubated soils was carried out at the end of 6 months’ incubation. Samples were air-dried and stored at room temperature before chemical analyses.

2.3. Cu Fractionation

Selective dissolution methods provide useful information on metal binding and mobility; nevertheless, it should be remarked that there is no selective dissolution scheme free of shortcomings [38,39]. In the present study, the distribution of Cu in the soil solid phase was determined, in triplicate, using the four-step sequential extraction scheme proposed by the Community Bureau of Reference (BCR-method) [40]. This method is one of the most widely used and has been frequently applied to reveal the speciation and mobility of potentially toxic elements in soils and sediments.
In brief, Step 1: 1 g of soil was extracted (16 h) in 40 mL of 0.11 M acetic acid. In supernatant after centrifugation (3000 RPM for 20 min), Cu was measured and the residue was used in the next step. Step 2: extraction of soil residue with 40 mL of 0.5 M hydroxylamine hydrochloride was performed for 16 h. In supernatant after centrifugation (3000 RPM for 20 min), Cu was measured and the residue was used in the next step. Step 3: digestion of soil residue was performed using 20 mL of 30% H2O2 (pH = 2–3) at 85 °C in a water bath for 1 h. Later, the cover of the vessel was removed and when solution was evaporated, 50 mL of 1 M ammonium acetate was added into the soil residue. After 16 h of extraction, Cu was measured in supernatant after centrifugation (3000 RPM for 20 min), residue was used in the fourth step, also named the residual step. Step 4: the soil sample was digested in a microwave oven using 10 mL of concentrated (65%) HNO3. The extracted solutions were filtrated using a 0.2 µm PTFE filter. Cu concentration in diluted soil extracts was analyzed by ICP-AES (Agilent 5800). Calibration was performed using standard solutions (0.5, 1, 5, 10, 30, 50 mg L−1) prepared from an ICP-standard 23-element solution in 5% HNO3 (Merck solution IV), with yttrium (Y) as internal standard. Strict quality assurance and quality control (QA/QC) were taken, including blanks, analysis of reference material (CRM 601), and analysis of laboratory control samples. The recoveries of Cu, i.e., the ratio between sum of the four steps to the total soil Cu content, ranged from 89 to 114% with an average of 98.5%.

2.4. Cu Leaching and Bioavailability

The potential leaching of Cu from soils into the groundwater system was assessed after 6 months’ incubation according to the toxicity characteristic leaching procedure (TCLP), measured by the USEPA method 1311 [41]. The procedure involves shaking 3 g of soil in 30 mL of 0.0992 M acetate buffer at pH 2.9 ± 0.05 for 18 h on a rotary shaker at about 300 rpm. Extracts were filtered (0.2 μm), acidified with HNO3, and stored at +4 °C until ICP-AES determination.
To predict potential bioavailability of Cu from soils, an extraction with 0.01 M CaCl2 solution (pH 5.5) was carried out for 24 h at 20 RPM [42]. Extracts were filtered (0.2 μm), acidified with HNO3, and stored at +4 °C until ICP-AES determination.
Concentration of Cu in TCLP and CaCl2 extracts was carried out by ICP-AES, as described in Section 2.3.

2.5. Statistical Analysis

Measurements and analyses on soils were based on oven-dried soil samples. Each treatment (control, temperature, moisture, or combined stresses) was replicated three times and data reported as mean ± standard deviation (SD). In order to assess the effect of the imposed stress, each soil property was analyzed using one-way analysis of variance (ANOVA) within each soil type and management (calcareous conventional, calcareous organic, acid conventional, and acid organic), followed by Tukey HSD post hoc test. In order to assess the effect of soil type and soil management, a two-way ANOVA was conducted. Differences between treatments were considered significant at p < 0.05 and identified in the figures and tables with different letters. Pearson coefficient was calculated to measure the correlations between factors.
In order to compare single or combined stress effects of temperature and soil moisture in all soils, the index Hedges’ g was applied as a measure of the standardized effect size [43]. Hedges’ g is an unbiased estimate of Cohen’s d not affected by sample size, scale of measure, or magnitude. Null values indicate no difference between the original (19 °C 40% WHC) and the final condition derived from temperature stress (29 °C 40% WHC), moisture stress (19 °C 10% WHC), or the combination of the two stresses (29 °C 10% WHC), whereas positive or negative values imply an average increase or decrease, respectively, following the stress treatment. Effect sizes lower than 0.2 were considered negligible.
Principal component analysis (PCA) was performed in R software version 4.0.3 using the package “FactoMineR” [44]. Biplot of PC1 and PC2 was obtained using the “factoextra” package.

3. Results and Discussion

3.1. Soil Chemical Properties

The selected soils for comparing organic and conventional management systems of this study differ mainly by their pH and carbonates content. pH of acid soils ranges between 5.1 and 5.7, whereas pH of calcareous soils is very similar and slightly above neutrality (from 7.4 to 7.5) (Table 1). Carbonates are absent in the acid soils and variable between 36 to 118 g kg−1 in the calcareous soils.
Soil total organic C (TOC) does not differ so much in the four soils (from 17.1 to 24.6 g kg−1 in acid soils and from 20.3 to 22.8 in calcareous soils), being generally lower than average values of Slovenian vineyard soils (i.e., 45 g kg−1) [45].
Long-term studies in Europe and China show that organic farming leads to a general increase in soil organic matter [46], but in our case there was no significant difference in TOC content between organic and conventional calcareous soils. The main reason lies, probably, in the fact that all the vineyards in the study were inter-row cropped with grass for a long time. In vineyards with cover crops, the soil organic matter content is generally higher than vineyards with tilled conventional management systems. In Slovenia, for several reasons (e.g., soil organic matter depletion, soil erosion by wind or water, etc.), about 85% of vineyards were planted with cover crops in 2020 [47].
Dissolved organic carbon (DOC) was significantly lower in the acid organic vineyard soil in comparison to other soils (Table 1) but on the same order of magnitude.
Total Cu was similar in all four soils, ranging between 105 and 143 mg kg−1, above the threshold at which soil is considered to be at risk for human health (100 mg kg−1) [48]. These values are also above the mean and median of European [3] and Italian [49] vineyard soils and well above the critical value of 60 mg kg− 1, respectively, stipulated by Slovenian legislation [50].
Olsen P was very high in our soils with the exception of the calcareous conventional soil. Ammonium-N (NH4+-N) was significantly higher in the calcareous organic soil, whereas nitrate-N (NO3-N) was significantly lower in the calcareous conventional soil than in other soils. Regarding textural composition, acid soils were richer in sand, whereas calcareous soils were richer in silt and clay.
These four soils were selected to be as similar as possible in most chemical properties, TOC and total Cu in particular, with the exception of pH, in order to simplify comparisons of organic carbon dynamics and Cu behavior under climatic stresses (i.e., moisture, temperature, and combined stress).

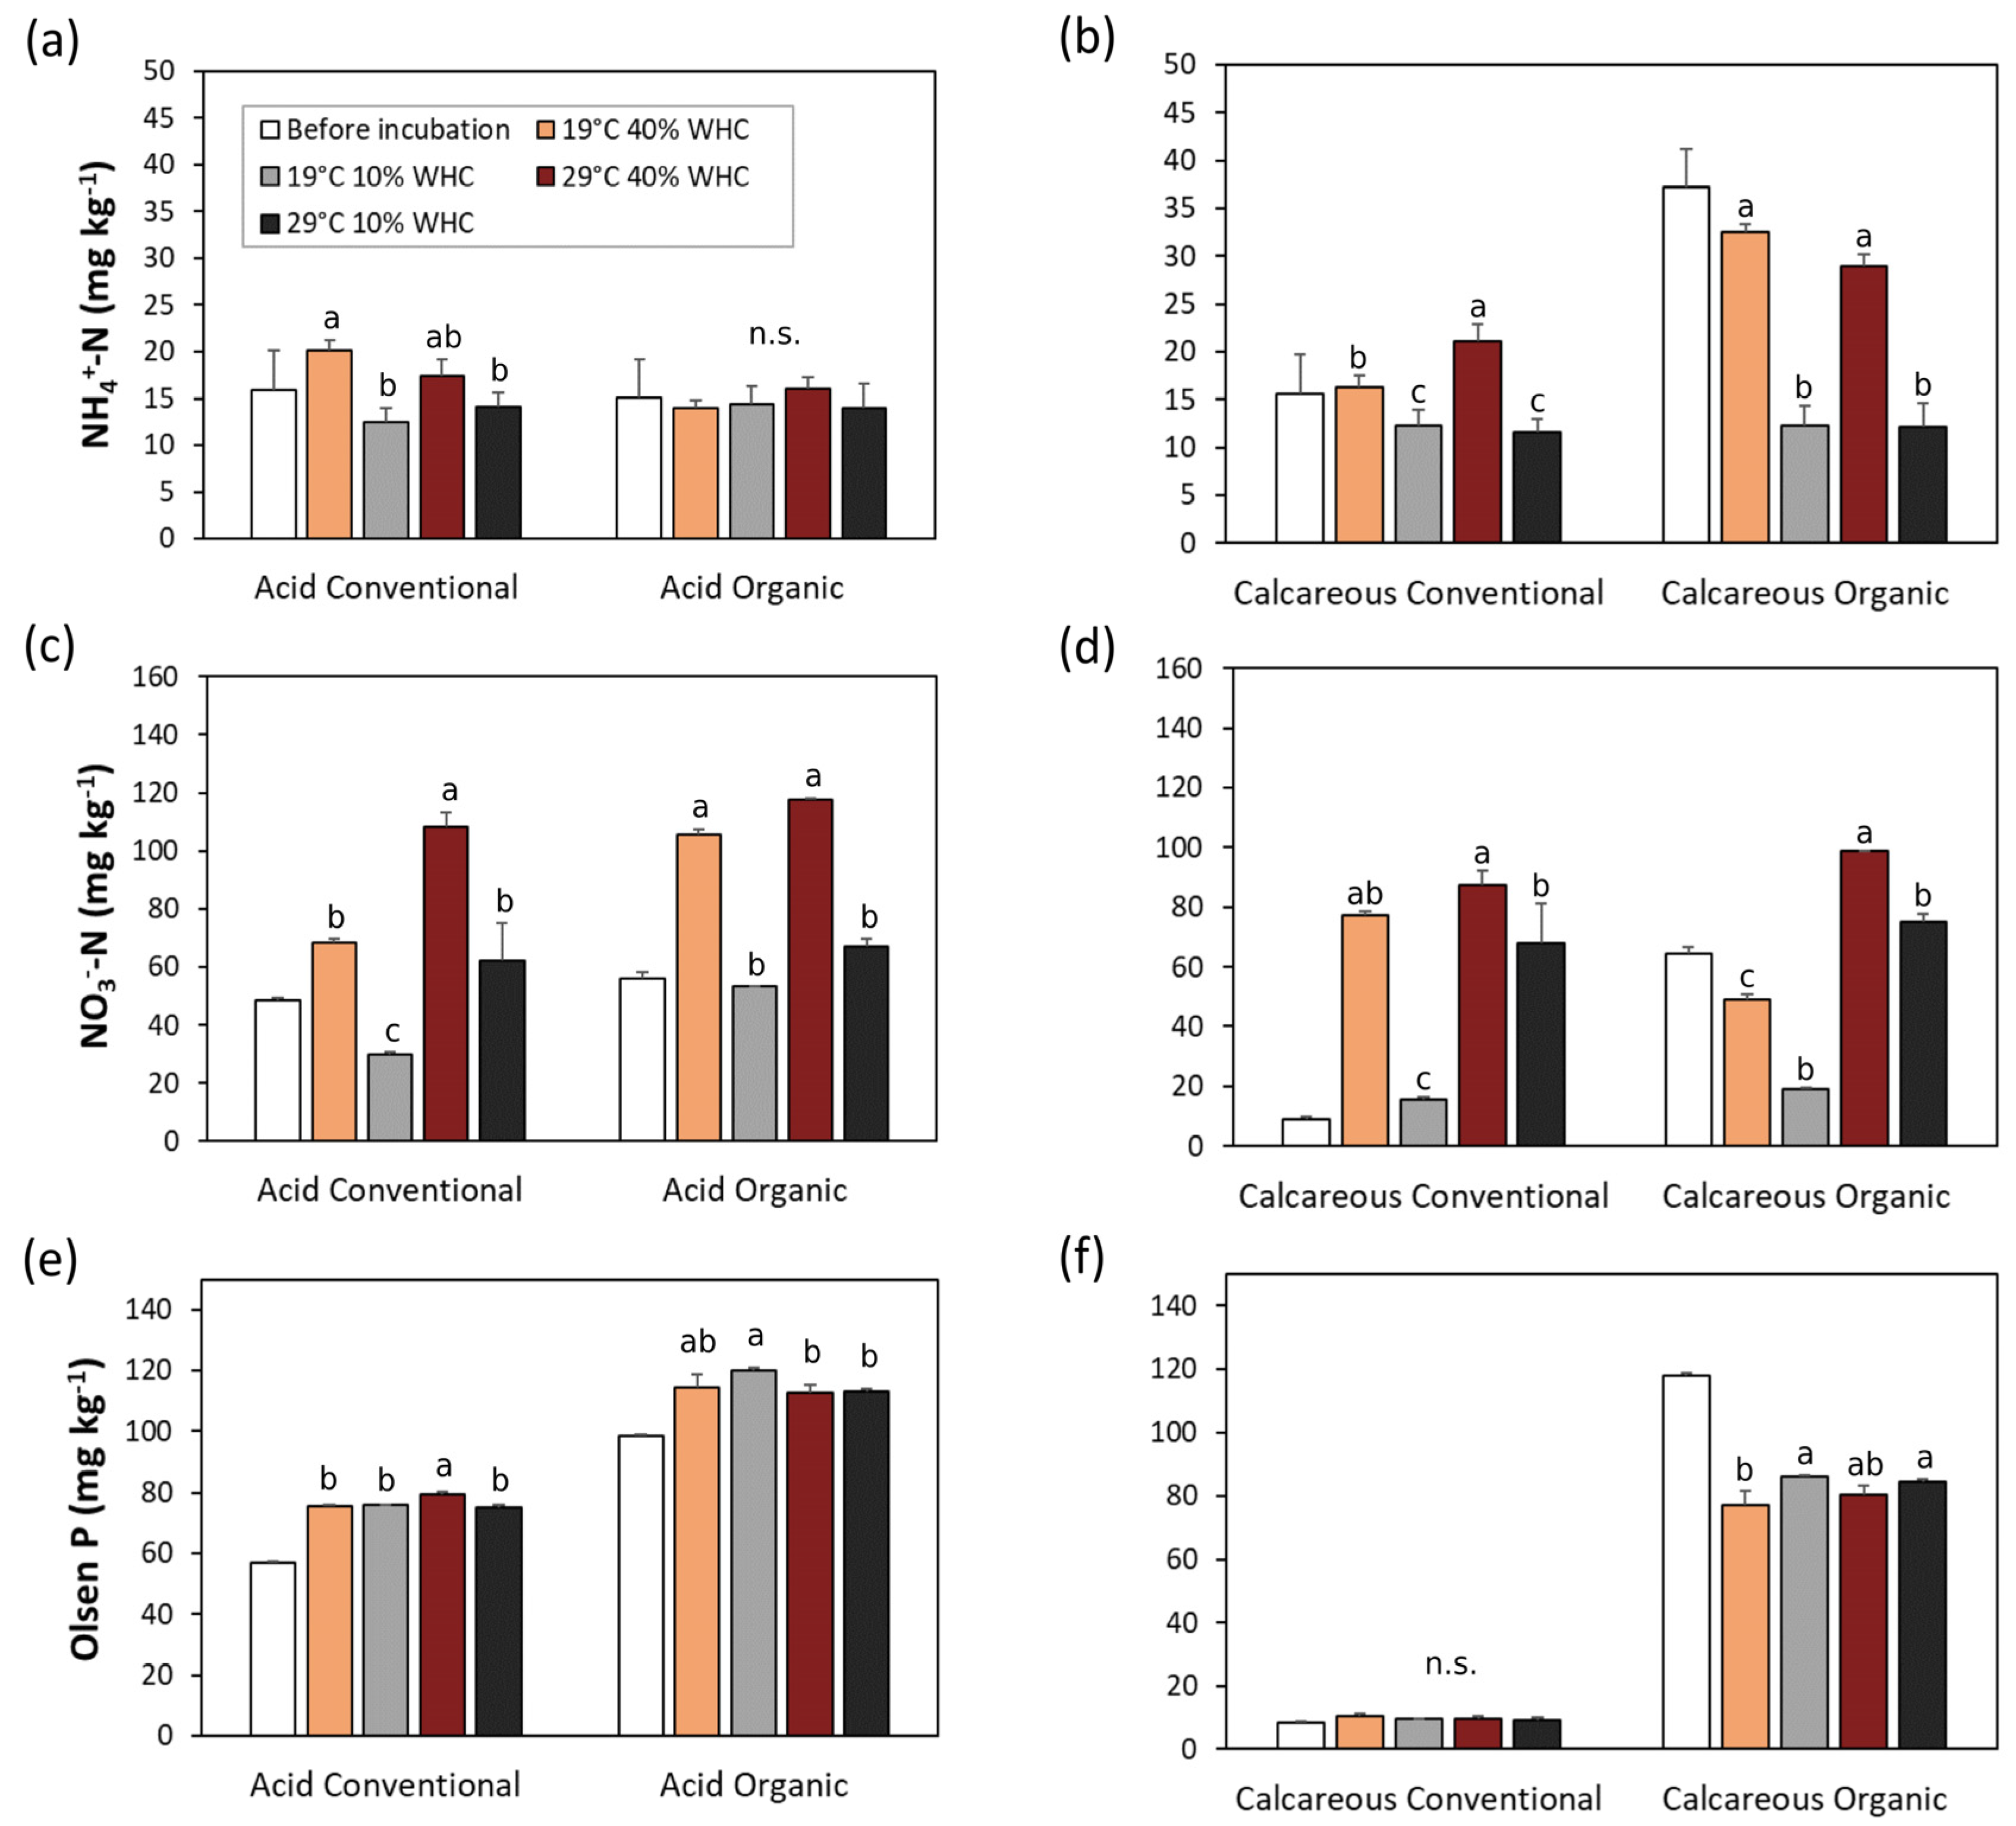
3.2. Changes in Soil Chemical Properties

Several soil chemical properties were analyzed to support a mechanistic explanation of changes in Cu bioavailability and potential leaching after 6 months of soil incubation under climatic stress.
In figures and tables, the values of soils before incubation are also reported but they were not included in the comparison between treatments with ANOVA (with the exception of Table 2). The two-way ANOVA resulted in a significant interaction between soil type and soil management for all variables, except for soil DOC where only the soil type (calcareous vs. acid) and not the soil management (conventional vs. organic) showed a statistical difference (Table S1). For this reason, further analyses (one-way ANOVA, also see Table S2) were conducted on each soil type and management, focusing on the effect of the imposed stress (temperature, moisture, or their combination).
Soil pH showed a different behavior between acid and calcareous soils (Figure 1a,b): acid conventional soil showed a significant decrease caused by temperature stress, slightly mitigated by moisture stress at elevated temperatures, while it did not change under moisture stress at 19 °C. On the contrary, the acid organic soil showed a tiny but significant increase either under temperature or moisture stress. Calcareous soils behaved similarly: temperature stress caused a slight increase of pH in conventional soil only, but moisture stress caused a significant decrease of pH in both soils.
Similar to most chemical or biochemical reactions, the decomposition of organic matter in soil is inherently temperature-sensitive, and rates of decomposition can increase with increasing temperature according to Arrhenius kinetics [26]. Therefore, our initial hypothesis was that soil exposed to higher temperature would decrease the amount of soil organic matter, measured either as total organic carbon (TOC) or as dissolved organic carbon (DOC).
After a 6-month incubation, a decrease in TOC was observed in almost all soil samples (Figure 1c,d), except for the acid conventional soil, where the TOC content did not change with all stress treatments. Soil organic matter can sometimes be unavailable for microbial decomposition when it is physically protected by the formation of aggregates where oxygen and enzyme diffusion is restricted, and when it is chemically protected by adsorption to mineral surfaces [51]. This fact was also demonstrated in a field study where the temperature sensitivity of soil organic matter decomposition decreased with increasing stability [52]. Regardless of acid conventional soil, the decrease in TOC was detected and was greatest in almost all soil samples when incubated at higher temperatures (29 °C) but at optimal moisture (40% WHC). The largest decrease was observed in calcareous conventional soil (almost 20%). Moisture stress, in contrast, reduced TOC decomposition in calcareous soils and was ineffective in acid soils (Figure 1c,d). The temperature sensitivity of soil respiration determined in laboratory soil incubations showed a significant decrease with increasing average incubation temperature observed in soils of all ecosystems with a sufficiently wide range of incubation temperatures [29]. These results are consistent with incubation experiments [53], where soil organic matter decomposition rates were greatly reduced at low and high soil moisture levels, while decomposition rates were increased at intermediate temperatures and moisture levels.
From our results, we can conclude that both temperature and moisture are important factors influencing TOC content in vineyard soil, regardless of the management system (organic/conventional), and that this effect is more pronounced in calcareous soils.
Total nitrogen (TN) behaved similar to TOC (Figure 1e,f), but exacerbating, in general, the changes observed for TOC; therefore, the C/N ratio showed inconsistent changes and were generally not significant (Figure 1g,h).
Dissolved organic carbon (DOC) is considered the more mobile and more available humus fraction, and has strong affinity for Cu complexation and affects Cu mobility [54]. Changes in environmental conditions affecting the soils can be reflected more quickly in DOC than TOC [55]. Our results confirm that the degradation of DOC was much higher, in percentage, than losses of TOC during 6 months of incubation (Figure 1i,l). The decrease of DOC was highest for incubation at 29 °C and 40% WHC, up to 49% for calcareous conventional soil. Similar results were previously reported by Marschner and Bredow [56], where the incubation period was much shorter (only 12 days), but the relative DOC reductions from the original soil levels were 73% and 89% when the soil incubation temperatures were 20 and 35 °C, respectively. The authors reported that the reduction in extractable DOC was entirely due to mineralization and that at higher temperatures the microorganisms additionally utilized substrates that were insoluble before incubation, which can be also the case in our study. When we analyzed the moisture stress, we could see that DOC was maintained or even increased, in comparison to the incubated control soil, and this effect was more evident in the calcareous organic soil. This fact, which was already proven by González-Domínguez et al. [57], was clearly shown in our organic calcareous soil sample: moist soils with 40% of WHC have statistically significant lower content of DOC (about 60 mg kg−1) compared to dry soil with 10% of WHC (95–106 mg kg−1) (Figure 1i,l). The latest reviews are reporting that more sustainable management of the soil, within an organic vineyard context [58], can positively influence the soil resilience to the climate change. In our study, we saw that total organic carbon in vineyards with cover crops (grass) was more resilient to different climatic change, i.e., stress situations, but on the other hand, in these vineyards, the content of DOC decreases more.
Next, we measured the potential changes in soil mineral nitrogen (NH4+ and NO3) after 6 months of soil incubation under climate change simulation. Concentration of NH4+ represents the net result from the process of ammonification, which tends to increase the concentration of NH4+, and the process of nitrification, which tends to decrease it. As can be seen in Figure 2a,b, NH4+ levels were most affected in the calcareous organic soil, in particular after incubation at 10% WHC. Here, NH4+ levels were highest (37.1 ± 4.1 mg kg−1), compared to other soil samples, with the greatest decrease after incubation. Temperature seemed not to affect the concentration of NH4+, as did soil moisture. In contrast, the levels of NO3 increased in almost all treatments, as expected from the nitrification process (Figure 2c,d). The highest relative increase was measured in calcareous conventional soil under combined stress situation (drought and temperature rise), but the highest value was obtained in the calcareous organic soil incubated at the same combined stress situation. In general, nitrification was sensitive to soil moisture: dryness caused a lower production of NO3 than soils at optimal moisture (i.e., 40% WHC).
Finally, we also measured the content of available phosphorus (Olsen P) because it is also connected to TOC and DOC. The selected vineyard soils showed a wide range of available P concentrations: from the usual P-depleted Slovenian soils [59], such as in conventional calcareous soils (8.36 ± 0.40 mg kg−1), to much higher values in young acid organic vineyard soils (118.01 ± 0.58 mg kg−1). Although a comprehensive global study of 760 soil samples demonstrated a negative impact of an increase in mean annual temperature on available soil P both directly and indirectly, through a decrease in organic C, organic P, and primary mineral P, and an increase in soil sand content [60], Shaw and Cleveland [61] demonstrated with laboratory experiments on soils from a range of ecosystem types from the tropics to the Arctic that soil P availability increases with temperature. In our case (Figure 2e,f), the 6-month incubation of soils simulating climate change resulted in a slight increase in available P content in all selected samples.

3.3. Changes in Soil Cu

3.3.1. Changes of Cu Speciation

The results of Cu speciation in soils with different soil management and of different soil properties are important to understand the mechanisms that can explain the changes in its bioavailability and mobility.
The first acid-soluble step (Step 1) represents the most bioavailable and mobile fraction of Cu in the soils [62]. In our case (Table 2 and Figure S2), the highest values of Cu were released as expected from acidic soils (up to 10%). The average release of Cu was higher in acidic conventional soils, 16.4 mg kg−1 (11.4%), compared to organic soils, 8.6 mg kg−1 (6.6%). This difference can be explained because of the lower pH and, secondarily, because of the higher DOC of the acid conventional soil (Table 1).
Significant Cu release was also detected in the calcareous organic soil (4.9 mg kg−1, 3.8%) sampled in the Štajerska region. However, a very low release was detected in calcareous conventional soil sampled from Vipava Valley (1.1 mg kg−1, 1.1%). Incubation for 6 months caused a significant decrease of this Cu fraction, but without differences whatever the temperature or moisture treatment.
Table 2. Cu speciation in acid and calcareous soils (Cu mg kg−1) with BCR four steps sequential extraction procedure before and after 6 months’ incubation under no stress (19 °C and 40% WHC), moisture (19 °C and 10% WHC), temperature (29 °C and 40% WHC), and combined stresses (29 °C and 10% WHC).
Soil Type/ManagementStep 1Step 2Step 3Step 4
Acid soilsConventionalCu (mg kg−1)
Before incubation14.3 ± 0.5 b36.7 ± 1.9 b36.3 ± 1.2 a60.3 ± 0.8 b
19 °C 40% WHC16.7 ± 0.4 a43.2 ± 0.7 a38.1 ± 0.9 a61.4 ± 1.5 ab
19 °C 10% WHC16.8 ± 0.6 a42.1 ± 2.0 a38.1 ± 0.6 a61.8 ± 0.7 ab
29 °C 40% WHC17.1 ± 0.3 a44.6 ± 1.1 a39.3 ± 1.2 a64.0 ± 1.2 a
29 °C 10% WHC16.7 ± 0.7 a43.7 ± 1.7 a39.2 ± 1.5 a60.5 ± 1.4 b
Organic
Before incubation10.6 ± 0.2 a32.3 ± 1.5 a30.2 ± 1.5 a50.0 ± 13.3 a
19 °C 40% WHC8.6 ± 0.1 b33.9 ± 1.6 a33.2 ± 1.8 a57.6 ± 1.9 a
19 °C 10% WHC7.8 ± 0.1 b31.2 ± 3.9 a28.7 ± 3.4 a53.6 ± 3.4 a
29 °C 40% WHC8.0 ± 0.3 b32.8 ± 1.2 a32.2 ± 2.5 a57.7 ± 4.6 a
29 °C 10% WHC8.0 ± 0.6 b32.7 ± 0.7 a34.6 ± 4.7 a55.4 ± 2.3 a
Calcareous soilsConventional
Before incubation1.5 ± 0.1 a16.4 ± 0.1 a13.4 ± 0.7 a73.2 ± 8.2 a
19 °C 40% WHC1.1 ± 0.1 b16.8 ± 0.3 a13.1 ± 0.3 a68.4 ± 1.6 a
19 °C 10% WHC1.1 ± 0.1 b17.3 ± 0.4 a11.1 ± 0.4 b68.8 ± 1.1 a
29 °C 40% WHC1.0 ± 0.1 b16.1 ± 0.1 a13.6 ± 0.9 a67.4 ± 1.1 a
29 °C 10% WHC1.0 ± 0.1 b16.4 ± 1.3 a11.3 ± 0.3 b69.5 ± 0.2 a
Organic
Before incubation5.3 ± 0.2 a45.3 ± 0.9 a32.3 ± 0.7 a44.5 ± 0.7 a
19 °C 40% WHC4.9 ± 0.1 ab43.5 ± 0.2 a20.6 ± 0.1 b48.5 ± 0.3 ab
19 °C 10% WHC4.9 ± 0.2 ab45.1 ± 0.9 a22.8 ± 0.4 b46.6 ± 3.8 ab
29 °C 40% WHC4.8 ± 0.2 b42.9 ± 1.2 a20.0 ± 1.9 b49.6 ± 1.2 b
29 °C 10% WHC4.8 ± 0.1 b45.0 ± 0.7 a22.9 ± 0.5 b47.0 ± 1.0 ab
Note: Different letters denote significant differences between treatments within each soil type and management, according to Tukey’s multiple comparison test (p < 0.05).
Iron and manganese oxides are also excellent scavengers of metals. In the reducible step (Step 2), levels of Cu released for both organic and conventional acidic soils were detectable (Table 2 and Figure S2). The average Cu levels released in Step 2 was 42.09 (29.4%) and 32.60 mg kg−1 (24.8%) for conventional and organic acidic soils, respectively. A similar range of Cu release was also measured in calcareous organic soil (44.37 mg kg−1, 33.5%), but a much lover concentration was measured in the calcareous conventional soil (16.59 mg kg−1, 15.7%), which was sampled in the Vipava Valley wine region.
Trace metal elements may be incorporated in many forms of organic matter, including living organisms, organic coatings on inorganic particles, and biotic detritus [62]; this organic material tends to be degraded, leading to the release of sorbed metals. The amount of Cu released in our study from the oxidizable step (Step 3) was generally in the same range of previously published results, where extraction percentages ranged from 29.2 to 51.3% for most samples [19,63,64]. In our case, the largest Cu release from Step 3 was measured in acidic conventional soils (39.30 mg kg−1, 27.4%) and the lowest was measured in calcareous conventional soils (13.37 mg kg−1, 11.5%). Similar results were already reported by Alva and colleges [65], where the major total Cu release was for the low-pH soils.
Regarding the residual fraction (Step 4), a larger proportion was found in the calcareous conventional soil (66.0% as mean value) than acidic organic, calcareous organic, and acidic conventional, with 43.1, 42.5, and 35.7%, respectively.
The reason why most of the metals in our study were bound to the residual fraction (Step 4) (crystalline lattice of primary and secondary minerals) is due to the specific distribution of fungicide-derived Cu in soil aggregates after application (ageing processes). In the first 8 weeks after the application of Cu oxychloride [66], the metal ions in the soil transferred from the soil outer sphere (from available Step 1 fraction) to the soil inner sphere (to the Fe–Mg oxides, Step 2 fraction). Later, the metal ions from Cu oxychloride could form highly stable complexes with organic matter [67], and, finally, after 15 months of soil incubation of Cu oxychloride in soil aggregates, Cu ions were mainly bound to the Fe–Mn oxyhydroxide surface and the crystalline structure of the primary and secondary minerals [21]. This means that most of the total Cu measured in our soils was of older origin and therefore bound to the less available soil fraction. In fact, according to the latest report (from 2017), Cu oxychloride and Cu hydroxide are the most commonly used chemical forms of Cu-based plant protection products in Slovenian viticulture (9.3 t y−1) [68].
The results of the sequential extraction procedure (SEP) reveal that there is also an obvious difference in Cu fractionation between the sampling sites of Štajerska and Vipava Valley. Although we decided to take samples based on similar chemical properties of the soils (level of Cu, TOC, and pH) when selecting the sampling sites at the beginning of the study, the results of the Cu fractionation show a clear influence of the sampling site.
However, the incubations generally resulted in a statistically significant reduction in Cu released in the first step (Step 1) of the sequential extraction compared to soil samples before treatment (p < 0.05), but there were no statistical differences between the different climate change simulations (moisture, temperature, or combined treatments) (Table 2 and Figure S2).
The binding of Cu to the different soil fractions did not change as consequence of both temperature or drought stresses in both conventional and organic vineyard soils, or that changes were too small for the variability of the analytical method to become statistically significant. The only exception was for Step 3 (oxidizable) in the calcareous organic soil, where all treatments, in particular the drought stress, caused a significant reduction of extractable Cu.

3.3.2. Changes of Cu Bioavailability

Cu bioavailability, estimated by CaCl2 extraction [69], was highest in the acid conventional soil (0.55 mg kg−1), followed by the acid organic soil (0.41 mg kg−1) and calcareous organic soil (0.32 mg kg−1), and was lowest in the calcareous conventional soil (0.12 mg kg−1) (Figure 3, Table S3). These values are certainly a consequence of soil pH, but the quantity of DOC seems to also play a crucial role. In fact, in soils before incubation, whatever the soil management, concentrations of bioavailable Cu are correlated to the concentration of DOC (Table 1). This behavior is not confirmed after 6 months’ incubation, because no clear trend was found between bioavailable Cu and DOC after induced climate stresses; in fact, correlation was not significant (Figure S3). Bioavailable Cu is influenced by several factors; two of them are DOC and pH, which behaved in opposite ways after climate stress.
Cu bioavailability was in our samples below 0.66% of the total Cu in the soil. Similar to Cu leaching, Cu bioavailability also decreased after incubation (climate change simulations), with the exception of the acidic conventional soil. Here, the bioavailable Cu concentration almost doubled (from 0.55 mg kg−1 to 0.95 mg kg−1) after 6 months of simulating high temperature. We found that the Cu bioavailability from soils in a CaCl2 extraction solution was affected by pH, as the Pearson coefficient was 0.86 for all soil samples (Figure S3). Another soil parameter negatively correlated to Cu bioavailability is TN, whereas the correlation of TOC was not significant. Bioavailable Cu was strongly correlated to Cu extracted in Step 1 and in Step 3.

3.3.3. Changes of Cu Potential Leaching

There have been evidences of Cu migrating through soil profiles in vineyards, which pose an important risk for groundwater quality. This risk is especially high for acid soils and soils affected by intensive erosion [70]. The main hypothesis of our study was that climate change, due to increase of degradation of organic matter in the topsoil at higher temperatures, increases Cu leachability from vineyard soils into lower soil profiles or groundwater.
During the 6-month soil incubation, organic matter degradation occurred and the greatest decrease was seen in the samples exposed to high temperature. However, since the results of Cu fractionation led to the fact that in our selected samples most Cu was bound to a fraction that is difficult to extract (residual fraction, or Step 4) and not to organic matter (Step 3), the results of the potential leaching of Cu from the soil are even more important and relevant.
From the results of TCLP extraction (Figure 3c,d and Table S3), we can see that the highest leaching can be expected from the acidic soils, both conventional (3.29 mg kg−1) and organic (2.87 mg kg−1). On the other hand, leaching from calcareous soils was quite low, 0.37 and 1.15 mg kg−1 for conventional and organic management, respectively. The pH was measured in soils and in the TCLP extraction solutions, because of its role in the Cu solubilization. We could see that pH increased in treatments with temperature stress at optimal moisture, and the largest increase was observed in calcareous soils (Figure 1). A similar increase in pH was also observed in the extraction solutions with both 0.01 M CaCl2 and TCLP (Table S3).
Cu leaching decreased after 6 months of incubation in almost all soil samples as a result of the increase in pH. The only exception was acid conventional soil, where the average pH in the TCLP solution remained similar in all treatments, and Cu leaching increased in all treatments, with the largest increase in treatment simulating temperature stress (29 °C and 40% of WHC) from 3.29 mg kg−1 before treatment to 5.04 mg kg−1 after 6 months. To find out if there are some specific factors affecting Cu leaching from the soil based on soil chemical properties, we calculated the Pearson coefficient (Figure S3).
Unless TCLP-Cu was strongly correlated with CaCl2-Cu, Cu Step 1, and Step 2, it is possible to note a significant negative correlation with either soil pH and TN, that is, a decrement of pH and TN is responsible for an increase of potentially leaching Cu. Surprisingly, neither TOC nor DOC showed a significant strong correlation.

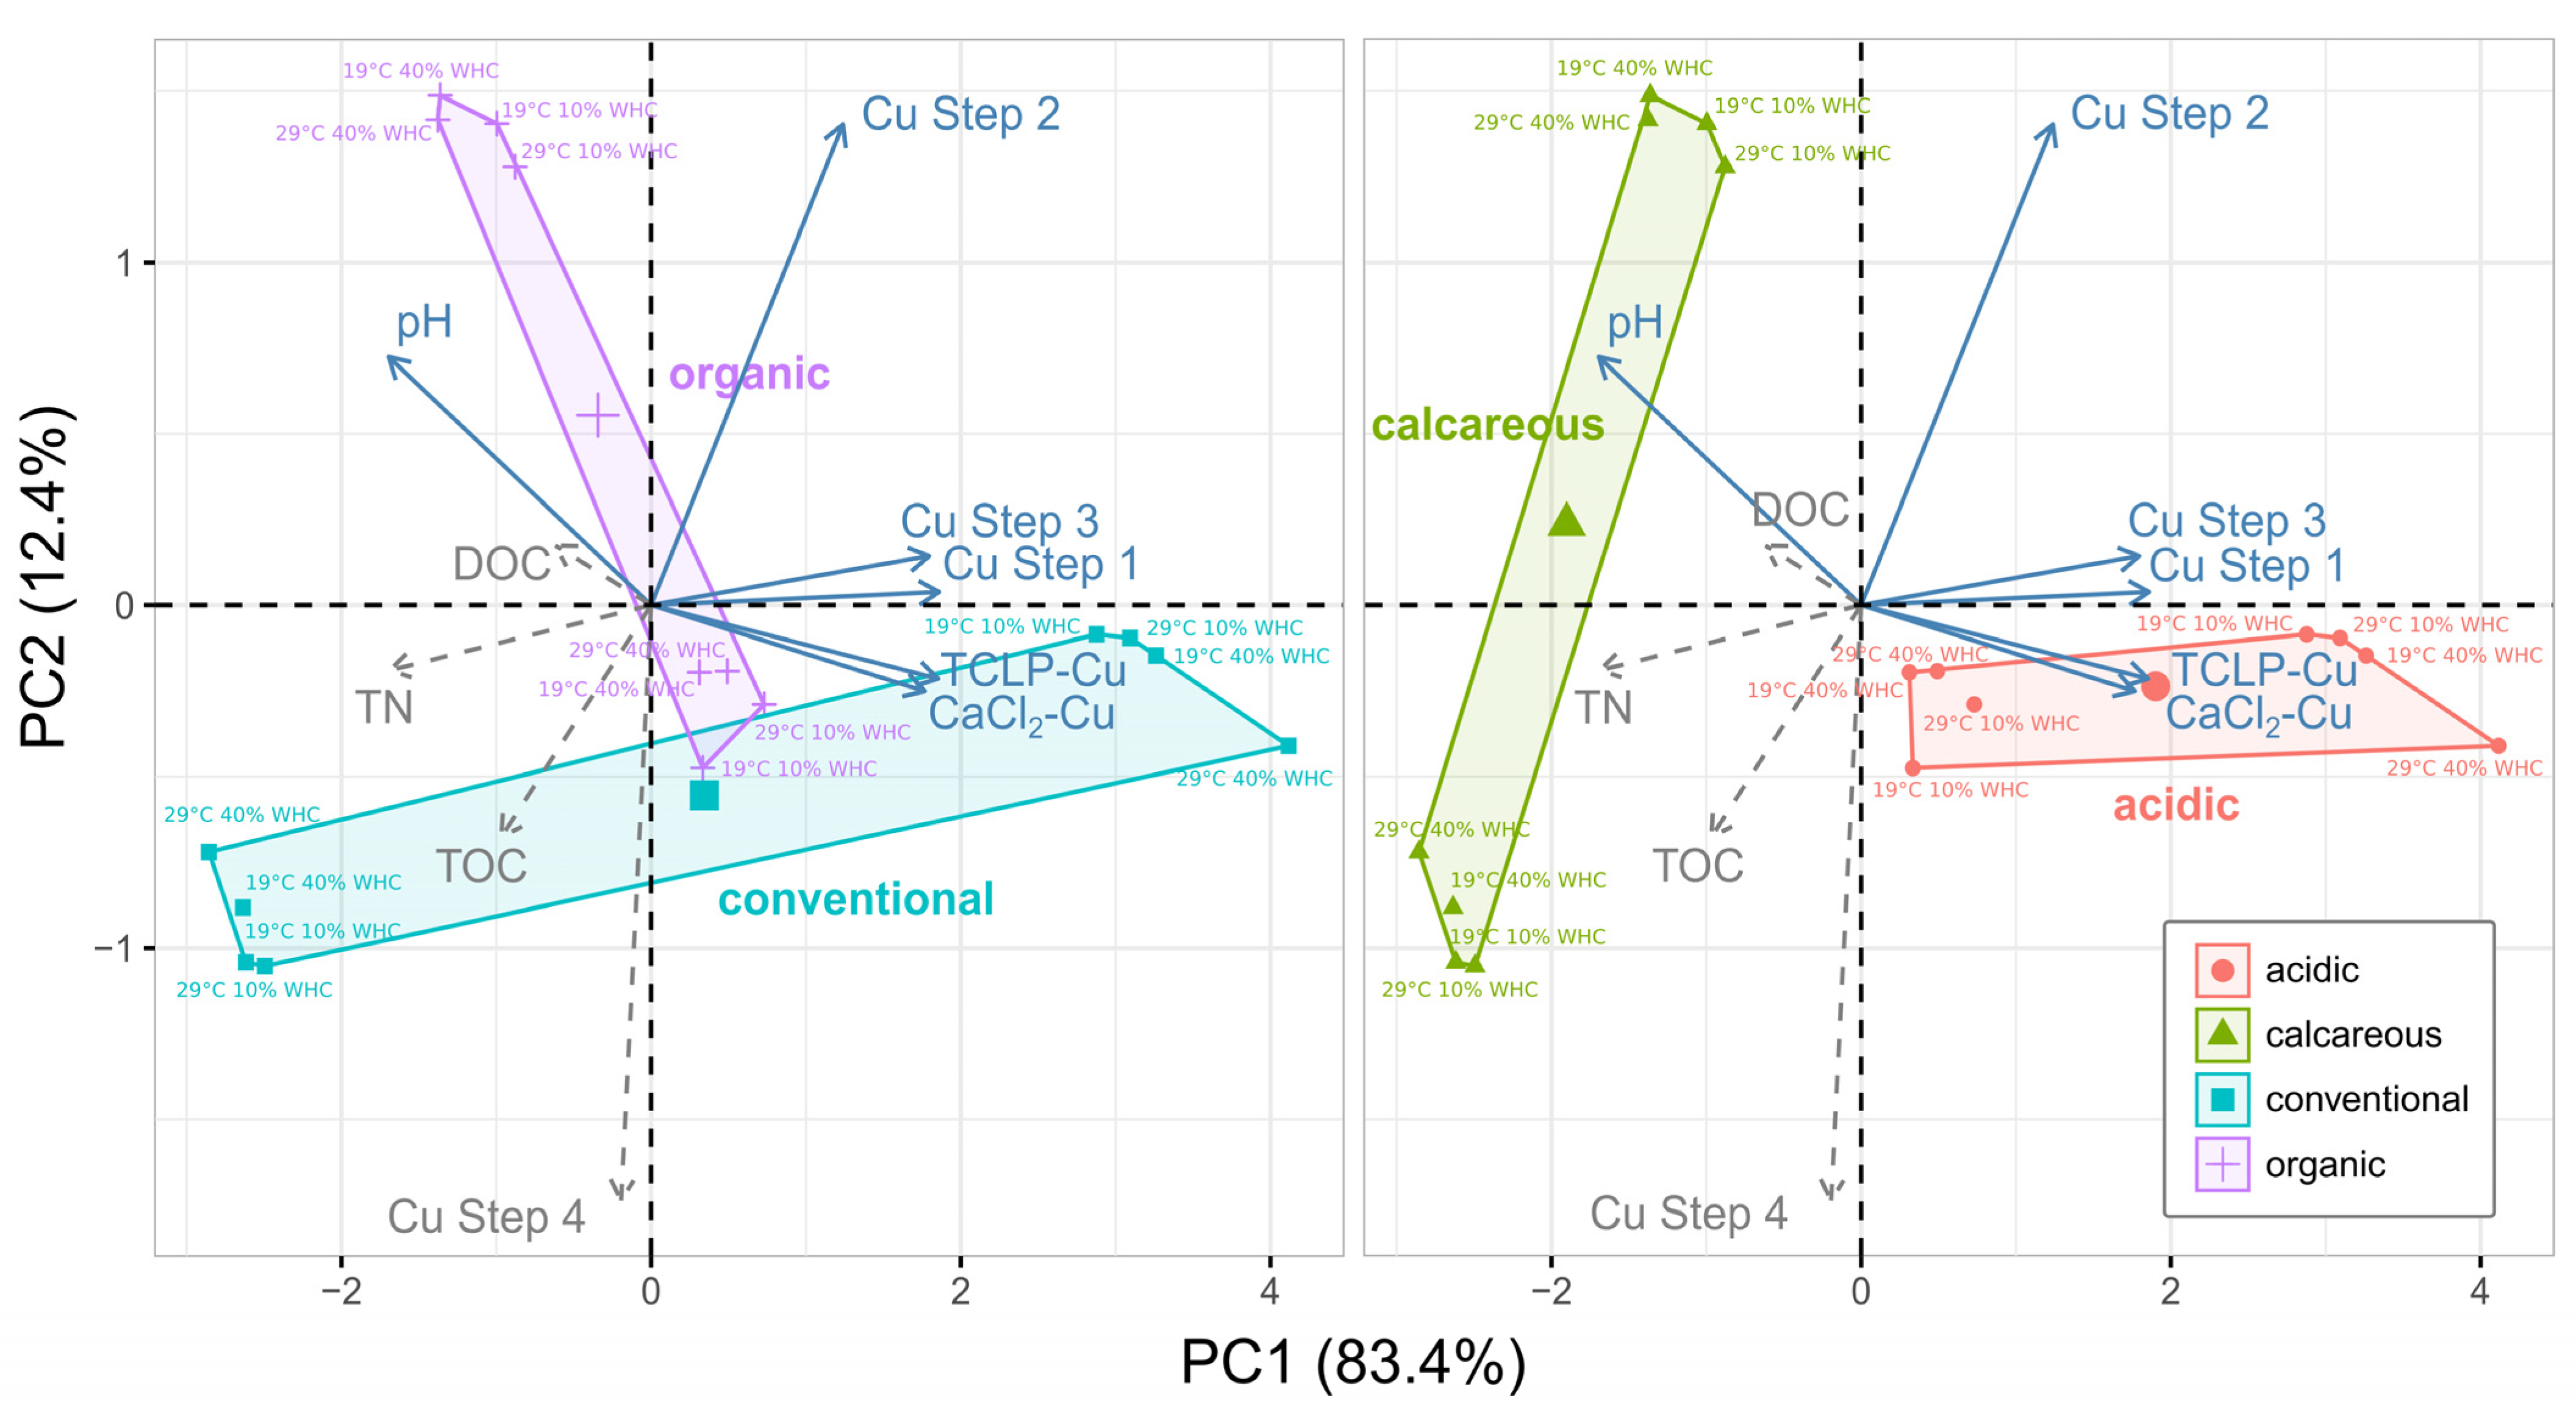
3.4. Effect of Single or Combined Climatic Stress on Soils

According to Hedges’ g values (Figure 4), the soil properties most affected by the imposed treatments are TOC, TN, DOC, and mineral N forms (NH4+ and NO3). Temperature stress negatively affected soil organic matter indices (TOC and TN), which showed a Hedges’ g value < −0.5. On the contrary, the moisture stress (water deficit) tended to compensate the increase of temperature by reducing the respiration of microbial biomass and, therefore, the degradation of soil organic matter [71]. Similarly, dissolved organic C (DOC) showed a Hedges’ g under temperature stress < −1, whereas it increased by moisture stress, and also resulted positive under the combined climatic stresses.
Ammonium N (N-NH4+) tended to be affected by moisture and by the combination of moisture and temperature stresses, whereas the increase of soil temperature did not affect its concentration. In fact, optimal ammonification ranged from 5 up to 30 °C. Nitrate N (N-NO3) was affected by both temperature and moisture, but in the opposite direction. The interaction of the two stresses tended to be compensated (Figure 4c).
Rather surprisingly, the tested stresses did not have significant effects on Cu bioavailability, mobility, and speciation when all four soils were considered collectively.
However, drawing a PCA of main soil properties on the first two principal components (95.8% of variance explained), it is possible to notice that the first PC axis (83.4% of variance explained) is mainly described by Cu-related variables (Figure 5), with the exception of Cu Step 2, which mainly describes the second PC axis (12.4%). Therefore, despite the selected four soils representing very different vineyard situations, the behavior of Cu under climatic stress was rather homogeneous, probably as a result of common origin of Cu pollution.
In addition, there is a clear separation of the four soils, either for their management (conventional vs. organic) or for their pH (acid vs. calcareous). Soil pH, in particular, well defines the calcareous and acidic groups. pH is, in fact, one of the main driving factors affecting most soil properties [49], and it consistently affects the ordination. It also explains why points related to the different imposed stress treatments but belonging to the same soil are closely located in the PCA.

4. Conclusions

The increase of soil temperature influenced the degradation of soil organic matter, either total (TOC) or soluble (DOC), but the reduction of moisture generally contrasted their degradation. Temperature stress caused also an increase in soil pH of acid organic soils, and calcareous conventional and organic soils, but a decrease of it in the acid conventional soil.
Cu risk was assessed as potential bioavailability and leaching by chemical extractions. No general trend was observed either between conventional and organic management or between acid and calcareous soil against the climatic stresses tested. In the acid soils, the organic-managed soil appeared to be more resilient to the temperature stress, whereas the conventional-managed soil was more resilient to the moisture stress. In the calcareous soils, conversely, the conventional-managed soil was more resilient to moisture stress, and both soils behaved similarly towards the temperature stress. The combined stress (temperature + moisture) negatively affected only the leaching in the organic calcareous soil, but in general, calcareous soils were more resistant than acid soils.
In conclusion, there is no evidence supporting the hypothesis that the type of management (conventional vs. organic) may play an important role in influencing the response of vineyard soils to temperature or moisture stresses toward Cu risk.

Supplementary Materials

The following supporting information can be downloaded at: https://www.mdpi.com/article/10.3390/app13042595/s1, Figure S1: Experimental layout; Figure S2: Cu speciation in acid and calcareous soils expressed as percentage with BCR four steps sequential extraction procedure before and after 6 months’ incubation under moisture, temperature, and combined stresses; Figure S3: Correlation table of soil properties; Tables S1 and S2: ANOVA results; Table S3: Cu bioavailability and Cu leaching form polluted vineyard soils before and after 6 months’ incubation under moisture, temperature, and combined stresses.

Author Contributions

Conceptualization, E.J. and M.C.; methodology, E.J. and M.C.; formal analysis, E.P. and E.J.; investigation, E.J.; resources, E.J. and M.C.; data curation, M.C. and E.P.; writing—original draft preparation, E.J.; writing—review and editing, M.C. and E.P.; funding acquisition, E.J. All authors have read and agreed to the published version of the manuscript.

Funding

This research was funded by the International Organization of Vine and Wine (OIV), Research grant program (2021).

Institutional Review Board Statement

Not applicable.

Informed Consent Statement

Not applicable.

Data Availability Statement

Data are contained within the article and Supplementary Materials. Additional data are available on request from the corresponding author.

Acknowledgments

Authors acknowledge Ali Khakbaz, Aldo Bertoni, and Andrea Cudini for technical support.

Conflicts of Interest

The authors declare no conflict of interest.

References

  1. FAO. FAOSTAT Nations; Food and Agriculture Organization of the United: Rome, Italy, 2019. [Google Scholar]
  2. Pietrzak, U.; McPhail, D.C. Copper Accumulation, Distribution and Fractionation in Vineyard Soils of Victoria, Australia. Geoderma 2004, 122, 151–166. [Google Scholar] [CrossRef]
  3. Ballabio, C.; Panagos, P.; Lugato, E.; Huang, J.-H.; Orgiazzi, A.; Jones, A.; Fernández-Ugalde, O.; Borrelli, P.; Montanarella, L. Copper Distribution in European Topsoils: An Assessment Based on LUCAS Soil Survey. Sci. Total Environ. 2018, 636, 282–298. [Google Scholar] [CrossRef] [PubMed]
  4. Eurostat. 2022. EC Data Browser. Organic Crop Area by Agricultural Production Methods and Crops. Available online: https://ec.europa.eu/eurostat/databrowser/view/org_cropar/default/table?lang=en (accessed on 3 February 2022).
  5. Yruela, I. Copper in Plants. Braz. J. Plant Physiol. 2005, 17, 145–156. [Google Scholar] [CrossRef] [Green Version]
  6. Cesco, S.; Pii, Y.; Borruso, L.; Orzes, G.; Lugli, P.; Mazzetto, F.; Genova, G.; Signorini, M.; Brunetto, G.; Terzano, R.; et al. A Smart and Sustainable Future for Viticulture Is Rooted in Soil: How to Face Cu Toxicity. Appl. Sci. 2021, 11, 907. [Google Scholar] [CrossRef]
  7. Ambrosini, V.G.; Rosa, D.J.; Bastos de Melo, G.W.; Zalamena, J.; Cella, C.; Simão, D.G.; Souza da Silva, L.; Pessoa dos Santos, H.; Toselli, M.; Tiecher, T.L.; et al. High Copper Content in Vineyard Soils Promotes Modifications in Photosynthetic Parameters and Morphological Changes in the Root System of ‘Red Niagara’ Plantlets. Plant Physiol. Biochem. 2018, 128, 89–98. [Google Scholar] [CrossRef] [Green Version]
  8. Rosa, D.J.; Ambrosini, V.G.; Kokkoris, V.; Brunetto, G.; Hart, M.; Ricachenevsky, F.; Pescador, R. Lime Protection for Young Vines Exposed to Copper Toxicity. Water Air Soil Pollut. 2020, 231, 296. [Google Scholar] [CrossRef]
  9. Trentin, E.; Facco, D.B.; Hammerschmitt, R.K.; Avelar Ferreira, P.A.; Morsch, L.; Belles, S.W.; Ricachenevsky, F.K.; Nicoloso, F.T.; Ceretta, C.A.; Tiecher, T.L.; et al. Potential of Vermicompost and Limestone in Reducing Copper Toxicity in Young Grapevines Grown in Cu-Contaminated Vineyard Soil. Chemosphere 2019, 226, 421–430. [Google Scholar] [CrossRef]
  10. Longbottom, M.L.; Petrie, P.R. Role of Vineyard Practices in Generating and Mitigating Greenhouse Gas Emissions. Aust. J. Grape Wine Res. 2015, 21, 522–536. [Google Scholar] [CrossRef]
  11. Lionello, P.; Scarascia, L. The Relation between Climate Change in the Mediterranean Region and Global Warming. Reg Env. Chang. 2018, 18, 1481–1493. [Google Scholar] [CrossRef]
  12. Grillakis, M.G. Increase in Severe and Extreme Soil Moisture Droughts for Europe under Climate Change. Sci. Total Environ. 2019, 660, 1245–1255. [Google Scholar] [CrossRef]
  13. Ruosteenoja, K.; Markkanen, T.; Venäläinen, A.; Räisänen, P.; Peltola, H. Seasonal Soil Moisture and Drought Occurrence in Europe in CMIP5 Projections for the 21st Century. Clim. Dyn. 2018, 50, 1177–1192. [Google Scholar] [CrossRef] [Green Version]
  14. Samaniego, L.; Thober, S.; Kumar, R.; Wanders, N.; Rakovec, O.; Pan, M.; Zink, M.; Sheffield, J.; Wood, E.F.; Marx, A. Anthropogenic Warming Exacerbates European Soil Moisture Droughts. Nat. Clim Chang. 2018, 8, 421–426. [Google Scholar] [CrossRef] [Green Version]
  15. Daliakopoulos, I.N.; Panagea, I.S.; Tsanis, I.K.; Grillakis, M.G.; Koutroulis, A.G.; Hessel, R.; Mayor, A.G.; Ritsema, C.J. Yield Response of Mediterranean Rangelands under a Changing Climate. Land Degrad. Dev. 2017, 28, 1962–1972. [Google Scholar] [CrossRef]
  16. Droz, B.; Payraudeau, S.; Rodríguez Martín, J.A.; Tóth, G.; Panagos, P.; Montanarella, L.; Borrelli, P.; Imfeld, G. Copper Content and Export in European Vineyard Soils Influenced by Climate and Soil Properties. Environ. Sci. Technol. 2021, 55, 7327–7334. [Google Scholar] [CrossRef]
  17. Wäldchen, J.; Schöning, I.; Mund, M.; Schrumpf, M.; Bock, S.; Herold, N.; Totsche, K.U.; Schulze, E.D. Estimation of Clay Content from Easily Measurable Water Content of Air-Dried Soil. J. Plant Nutr. Soil Sci. 2012, 175, 367–376. [Google Scholar] [CrossRef]
  18. Pérez-Novo, C.; Bermúdez-Couso, A.; López-Periago, E.; Fernández-Calviño, D.; Arias-Estévez, M. The Effect of Phosphate on the Sorption of Copper by Acid Soils. Geoderma 2009, 150, 166–170. [Google Scholar] [CrossRef]
  19. Fernández-Calviño, D.; Nóvoa-Muñoz, J.C.; Díaz-Raviña, M.; Arias-Estévez, M. Copper Accumulation and Fractionation in Vineyard Soils from Temperate Humid Zone (NW Iberian Peninsula). Geoderma 2009, 153, 119–129. [Google Scholar] [CrossRef]
  20. Komárek, M.; Száková, J.; Rohošková, M.; Javorská, H.; Chrastný, V.; Balík, J. Copper Contamination of Vineyard Soils from Small Wine Producers: A Case Study from the Czech Republic. Geoderma 2008, 147, 16–22. [Google Scholar] [CrossRef]
  21. Wang, Q.-Y.; Sun, J.-Y.; Xu, X.-J.; Yu, H.-W. Distribution and Availability of Fungicide-Derived Copper in Soil Aggregates. J. Soils Sediments 2020, 20, 816–823. [Google Scholar] [CrossRef]
  22. Łukowski, A.; Dec, D. Influence of Zn, Cd, and Cu Fractions on Enzymatic Activity of Arable Soils. Environ. Monit. Assess. 2018, 190, 278. [Google Scholar] [CrossRef] [Green Version]
  23. Villanueva-Rey, P.; Vázquez-Rowe, I.; Quinteiro, P.; Rafael, S.; Gonçalves, C.; Moreira, M.T.; Feijoo, G.; Arroja, L.; Dias, A.C. Regionalizing Eco-Toxicity Characterization Factors for Copper Soil Emissions Considering Edaphic Information for Northern Spain and Portuguese Vineyards. Sci. Total Environ. 2019, 686, 986–994. [Google Scholar] [CrossRef] [PubMed]
  24. McBride, M. Environmental Chemistry of Soils 1994; Oxford University Press: Oxford, UK, 1994. [Google Scholar]
  25. Costantini, E.A.C.; Agnelli, A.E.; Fabiani, A.; Gagnarli, E.; Mocali, S.; Priori, S.; Simoni, S.; Valboa, G. Short-Term Recovery of Soil Physical, Chemical, Micro- and Mesobiological Functions in a New Vineyard under Organic Farming. Soil 2015, 1, 443–457. [Google Scholar] [CrossRef] [Green Version]
  26. Arrhenius, S. Über Die Reaktionsgeschwindigkeit Bei Der Inversion von Rohrzucker Durch Säuren. Z. Für Phys. Chem. 1889, 4, 226–248. [Google Scholar] [CrossRef] [Green Version]
  27. Davidson, E.A.; Janssens, I.A. Temperature Sensitivity of Soil Carbon Decomposition and Feedbacks to Climate Change. Nature 2006, 440, 165–173. [Google Scholar] [CrossRef] [Green Version]
  28. Conant, R.T.; Ryan, M.G.; Ågren, G.I.; Birge, H.E.; Davidson, E.A.; Eliasson, P.E.; Evans, S.E.; Frey, S.D.; Giardina, C.P.; Hopkins, F.M. Temperature and Soil Organic Matter Decomposition Rates–Synthesis of Current Knowledge and a Way Forward. Glob. Chang. Biol. 2011, 17, 3392–3404. [Google Scholar] [CrossRef]
  29. Hamdi, S.; Moyano, F.; Sall, S.; Bernoux, M.; Chevallier, T. Synthesis Analysis of the Temperature Sensitivity of Soil Respiration from Laboratory Studies in Relation to Incubation Methods and Soil Conditions. Soil Biol. Biochem. 2013, 58, 115–126. [Google Scholar] [CrossRef]
  30. Schädel, C.; Beem-Miller, J.; Aziz Rad, M.; Crow, S.E.; Hicks Pries, C.E.; Ernakovich, J.; Hoyt, A.M.; Plante, A.; Stoner, S.; Treat, C.C. Decomposability of Soil Organic Matter over Time: The Soil Incubation Database (SIDb, Version 1.0) and Guidance for Incubation Procedures. Earth Syst. Sci. Data 2020, 12, 1511–1524. [Google Scholar] [CrossRef]
  31. Belmonte, S.A.; Luisella, C.; Stahel, R.J.; Bonifacio, E.; Novello, V.; Zanini, E.; Steenwerth, K.L. Effect of Long-Term Soil Management on the Mutual Interaction among Soil Organic Matter, Microbial Activity and Aggregate Stability in a Vineyard. Pedosphere 2018, 28, 288–298. [Google Scholar] [CrossRef]
  32. Šimanský, V.; Horváthová, J.; Jonczak, J.; Polláková, N. Suitability of Carbon and Nitrogen Management Indices for the Evaluation of Soil Organic Matter under Different Soil Management Practices in a Productive Vineyard. J. Ecol. Eng. 2021, 22, 150–162. [Google Scholar] [CrossRef]
  33. Morelli, R.; Bertoldi, D.; Baldantoni, D.; Zanzotti, R. Labile, Recalcitrant and Stable Soil Organic Carbon: Comparison of Agronomic Management in a Vineyard of Trentino (Italy). BIO Web Conf. 2022, 44, 02007. [Google Scholar] [CrossRef]
  34. Simončič, A.; Sušin, J.; Šinkovec, M.; Leskovšek, R.; Čuš, F.; Žnidaršič Pongrac, V.; Baša Česnik, H. Twelve-Year Investigation of Copper Soil Concentrations Shows That Vineyards Are at Risk. Acta Agric. Scand. Sect. B—Soil Plant Sci. 2017, 67, 381–394. [Google Scholar] [CrossRef]
  35. Method 3052; Microwave Assisted Acid Digestion of Sediments, Sludges, and Oils. U.S. EPA: Washington, DC, USA, 1995.
  36. Olsen, S.R. Estimation of Available Phosphorus in Soils by Extraction with Sodium Bicarbonate; US Department of Agriculture: Washington, DC, USA, 1954.
  37. Hartley, I.P.; Ineson, P. Substrate Quality and the Temperature Sensitivity of Soil Organic Matter Decomposition. Soil Biol. Biochem. 2008, 40, 1567–1574. [Google Scholar] [CrossRef] [Green Version]
  38. Zimmerman, A.J.; Weindorf, D.C. Heavy Metal and Trace Metal Analysis in Soil by Sequential Extraction: A Review of Procedures. Int. J. Anal. Chem. 2010, 2010, 387803. [Google Scholar] [CrossRef] [PubMed] [Green Version]
  39. Gleyzes, C.; Tellier, S.; Astruc, M. Fractionation Studies of Trace Elements in Contaminated Soils and Sediments: A Review of Sequential Extraction Procedures. TrAC Trends Anal. Chem. 2002, 21, 451–467. [Google Scholar] [CrossRef]
  40. Rauret, G.; López-Sánchez, J.; Sahuquillo, A.; Rubio, R.; Davidson, C.; Ure, A.; Quevauviller, P. Improvement of the BCR Three Step Sequential Extraction Procedure Prior to the Certification of New Sediment and Soil Reference Materials. J. Environ. Monit. 1999, 1, 57–61. [Google Scholar] [CrossRef]
  41. U.S. EPA. Test Methods for Evaluating Solid Wastes SW-846. In Volume IA-Laboratory Manual: Physical and Chemical Methods; United States Environmental Protection Agency: Washington, DC, USA, 1994. [Google Scholar]
  42. Novozamsky, I.; Lexmond, T.M.; Houba, V. A Single Extraction Procedure of Soil for Evaluation of Uptake of Some Heavy Metals by Plants. Int. J. Environ. Anal. Chem. 1993, 51, 47–58. [Google Scholar] [CrossRef]
  43. Vargha, A.; Delaney, H.D. A critique and improvement of the CL common language effect size statistics of McGraw and Wong. J. Educ. Behav. Stat. 2000, 25, 101–132. [Google Scholar]
  44. Irnawati, I.; Riswanto, F.D.O.; Riyanto, S.; Martono, S.; Rohman, A. The Use of Software Packages of R Factoextra and FactoMineR and Their Application in Principal Component Analysis for Authentication of Oils. Indones. J. Chemom. Pharm. Anal. 2020, 1, 1–10. [Google Scholar] [CrossRef]
  45. Rusjan, D.; Strlič, M.; Pucko, D.; Korošec-Koruza, Z. Copper Accumulation Regarding the Soil Characteristics in Sub-Mediterranean Vineyards of Slovenia. Geoderma 2007, 141, 111–118. [Google Scholar] [CrossRef]
  46. Bai, Z.; Caspari, T.; Gonzalez, M.R.; Batjes, N.H.; Mäder, P.; Bünemann, E.K.; de Goede, R.; Brussaard, L.; Xu, M.; Ferreira, C.S.S. Effects of Agricultural Management Practices on Soil Quality: A Review of Long-Term Experiments for Europe and China. Agric. Ecosyst. Environ. 2018, 265, 1–7. [Google Scholar] [CrossRef]
  47. SiStat. Surface Area, Number of Vineyards and Number of Seedlings in Relation to Grass Cover, Wine-Growing Regions and Regions; SiStat: Ljubljana, Slovenia, 2021. [Google Scholar]
  48. Gawlik, B.; Bidoglio, G. Background Values in European Soils and Sewage Sludges; European Communities: Brussels, Belgium, 2006. [Google Scholar]
  49. Pellegrini, E.; Rovere, N.; Zaninotti, S.; Franco, I.; De Nobili, M.; Contin, M. Artificial Neural Network (ANN) Modelling for the Estimation of Soil Microbial Biomass in Vineyard Soils. Biol. Fertil. Soils 2021, 57, 145–151. [Google Scholar] [CrossRef]
  50. Mejnih, U. Opozorilnih in Kritičnih Imisijskih Vrednostih Nevarnih Snovi v Tleh; Uradni List RS, Št. 68/96, 41/04—ZVO-1 in 44/22—ZVO-2; PIS: Ljubljana, Slovenia, 1996. [Google Scholar]
  51. Moinet, G.Y.; Hunt, J.E.; Kirschbaum, M.U.; Morcom, C.P.; Midwood, A.J.; Millard, P. The Temperature Sensitivity of Soil Organic Matter Decomposition Is Constrained by Microbial Access to Substrates. Soil Biol. Biochem. 2018, 116, 333–339. [Google Scholar] [CrossRef]
  52. Moinet, G.Y.; Moinet, M.; Hunt, J.E.; Rumpel, C.; Chabbi, A.; Millard, P. Temperature Sensitivity of Decomposition Decreases with Increasing Soil Organic Matter Stability. Sci. Total Environ. 2020, 704, 135460. [Google Scholar] [CrossRef] [PubMed]
  53. Sierra, C.A.; Trumbore, S.E.; Davidson, E.A.; Vicca, S.; Janssens, I. Sensitivity of Decomposition Rates of Soil Organic Matter with Respect to Simultaneous Changes in Temperature and Moisture. J. Adv. Model. Earth Syst. 2015, 7, 335–356. [Google Scholar] [CrossRef]
  54. Brunetto, G.; de Melo, G.W.B.; Terzano, R.; Del Buono, D.; Astolfi, S.; Tomasi, N.; Pii, Y.; Mimmo, T.; Cesco, S. Copper Accumulation in Vineyard Soils: Rhizosphere Processes and Agronomic Practices to Limit Its Toxicity. Chemosphere 2016, 162, 293–307. [Google Scholar] [CrossRef] [Green Version]
  55. Liu, F.; Wang, D.; Zhang, B.; Huang, J. Concentration and Biodegradability of Dissolved Organic Carbon Derived from Soils: A Global Perspective. Sci. Total Environ. 2021, 754, 142378. [Google Scholar] [CrossRef]
  56. Marschner, B.; Bredow, A. Temperature Effects on Release and Ecologically Relevant Properties of Dissolved Organic Carbon in Sterilised and Biologically Active Soil Samples. Soil Biol. Biochem. 2002, 34, 459–466. [Google Scholar] [CrossRef]
  57. González-Domínguez, B.; Niklaus, P.A.; Studer, M.S.; Hagedorn, F.; Wacker, L.; Haghipour, N.; Zimmermann, S.; Walthert, L.; McIntyre, C.; Abiven, S. Temperature and Moisture Are Minor Drivers of Regional-Scale Soil Organic Carbon Dynamics. Sci. Rep. 2019, 9, 6422. [Google Scholar] [CrossRef] [Green Version]
  58. Romero, P.; Navarro, J.M.; Ordaz, P.B. Towards a Sustainable Viticulture: The Combination of Deficit Irrigation Strategies and Agroecological Practices in Mediterranean Vineyards. A Review and Update. Agric. Water Manag. 2022, 259, 107216. [Google Scholar] [CrossRef]
  59. Tóth, G.; Guicharnaud, R.-A.; Tóth, B.; Hermann, T. Phosphorus Levels in Croplands of the European Union with Implications for P Fertilizer Use. Eur. J. Agron. 2014, 55, 42–52. [Google Scholar] [CrossRef]
  60. Hou, E.; Chen, C.; Luo, Y.; Zhou, G.; Kuang, Y.; Zhang, Y.; Heenan, M.; Lu, X.; Wen, D. Effects of Climate on Soil Phosphorus Cycle and Availability in Natural Terrestrial Ecosystems. Glob. Chang. Biol. 2018, 24, 3344–3356. [Google Scholar] [CrossRef] [PubMed] [Green Version]
  61. Shaw, A.N.; Cleveland, C.C. The Effects of Temperature on Soil Phosphorus Availability and Phosphatase Enzyme Activities: A Cross-Ecosystem Study from the Tropics to the Arctic. Biogeochemistry 2020, 151, 113–125. [Google Scholar] [CrossRef]
  62. Gleyzes, C.; Tellier, S.; Astruc, M. Sequential Extraction Procedures for the Characterisation of the Fractionation of Elements in Industriallycontaminated Soils. In Methodologies for Soil and Sediment Fractionation Studies; Royal Society of Chemistry: London, UK, 2007; ISBN 978-1-84755-141-2. [Google Scholar]
  63. Reid, M.K.; Spencer, K.L.; Shotbolt, L. An Appraisal of Microwave-Assisted Tessier and BCR Sequential Extraction Methods for the Analysis of Metals in Sediments and Soils. J. Soils Sediments 2011, 11, 518–528. [Google Scholar] [CrossRef]
  64. Vázquez, F.A.V.; Cid, B.P.; Segade, S.R. Assessment of Metal Bioavailability in the Vineyard Soil-Grapevine System Using Different Extraction Methods. Food Chem. 2016, 208, 199–208. [Google Scholar] [CrossRef] [PubMed]
  65. Alva, A.K.; Huang, B.; Paramasivam, S. Soil PH Affects Copper Fractionation and Phytotoxicity. Soil Sci. Soc. Am. J. 2000, 64, 955–962. [Google Scholar] [CrossRef]
  66. Wang, Q.-Y.; Sun, J.-Y.; Xu, X.-J.; Yu, H.-W. Integration of Chemical and Toxicological Tools to Assess the Bioavailability of Copper Derived from Different Copper-Based Fungicides in Soil. Ecotoxicol. Environ. Saf. 2018, 161, 662–668. [Google Scholar] [CrossRef]
  67. Arias-Estévez, M.; Nóvoa-Muñoz, J.C.; Pateiro, M.; López-Periago, E. Influence of aging on copper fractionation in an acid soil. Soil Sci. 2007, 172, 225. [Google Scholar] [CrossRef]
  68. SiStat. Consumption of Phytopharmaceuticals for Vineyards and Orchards (Kg) and Treated Area (Ha) by Active Substances; SiStat: Ljubljana, Slovenia, 2017. [Google Scholar]
  69. Milićević, T.; Relić, D.; Škrivanj, S.; Tešić, Ž.; Popović, A. Assessment of Major and Trace Element Bioavailability in Vineyard Soil Applying Different Single Extraction Procedures and Pseudo-Total Digestion. Chemosphere 2017, 171, 284–293. [Google Scholar] [CrossRef] [PubMed]
  70. Komárek, M.; Čadková, E.; Chrastný, V.; Bordas, F.; Bollinger, J.-C. Contamination of Vineyard Soils with Fungicides: A Review of Environmental and Toxicological Aspects. Environ. Int. 2010, 36, 138–151. [Google Scholar] [CrossRef]
  71. Tóth, Z.; Táncsics, A.; Kriszt, B.; Kröel-Dulay, G.; Ónodi, G.; Hornung, E. Extreme Effects of Drought on Composition of the Soil Bacterial Community and Decomposition of Plant Tissue. Eur. J. Soil Sci. 2017, 68, 504–513. [Google Scholar] [CrossRef]
Figure 1. Soil pH, total organic carbon (TOC), total nitrogen (TN), C/N ratio, and dissolved organic carbon (DOC) in soils before and after 6 months’ incubation under no stress (19 °C and 40% WHC), moisture (19 °C and 10% WHC), temperature (29 °C and 40% WHC), and combined stresses (29 °C and 10% WHC). Different letters denote significant differences between treatments within each soil type and management, according to Tukey’s multiple comparison test (p < 0.05).
Applsci 13 02595 g001
Figure 2. Ammoniacal and nitric nitrogen and Olsen P in soils before and after 6 months’ incubation under no stress (19 °C and 40% WHC), moisture (19 °C and 10% WHC), temperature (29 °C and 40% WHC), and combined stresses (29 °C and 10% WHC). Different letters denote significant differences between treatments within each soil type and management, according to Tukey’s multiple comparison test (p < 0.05).
Applsci 13 02595 g002
Figure 3. Bioavailability (a,b) and leaching (c,d) of Cu in soils before and after 6 months’ incubation under no stress (19 °C and 40% WHC), moisture (19 °C and 10% WHC), temperature (29 °C and 40% WHC), and combined stresses (29 °C and 10% WHC). Different letters denote significant differences between treatments within each soil type and management, according to Tukey’s multiple comparison test (p < 0.05).
Applsci 13 02595 g003
Figure 4. Changes of soil properties due to temperature stress (a), moisture stress (b), or their combination (c). Effect sizes (g) lower than 0.2 are considered not meaningful. Positive or negative mean effect sizes indicate an increase or a decrease of the soil property after the stress, respectively. Changes are shown using forest plots of mean effect sizes, based on Hedges’ g index.
Applsci 13 02595 g004
Figure 5. Principal component analysis of soil properties grouped by soil management type (organic vs. conventional) or soil pH (calcareous vs. acidic). The first two axes of the PCA explain 95.8% of the variance. Blue solid arrows are used for the ordination. Gray dashed arrows refer to descriptors (not influencing the ordination).
Applsci 13 02595 g005
Table 1. Main physicochemical properties of soils.
Soil TypeAcid Soils Calcareous Soils
Soil ManagementConventionalOrganicConventionalOrganic
pH5.1 ± 0.15.7 ± 0.17.5 ± 0.17.4 ± 0.1
Carbonates (mg kg−1)<d.l. 1<d.l.36118
Cu total (mg kg−1)143.3 ± 1.6131.5 ± 4.9105.3 ± 0.4132.4 ± 2.3
TOC (g kg−1)17.7 ± 0.324.6 ± 0.622.8 ± 1.620.3 ± 0.7
TN (g kg−1) 1.9 ± 0.12.9 ± 0.12.6 ± 0.21.8 ± 0.1
C:N9.1 ± 0.28.5 ± 0.18.6 ± 0.311.4 ± 0.8
DOC (mg kg−1)161.1 ± 12.7110.4 ± 3.4164.1 ± 5.8187.2 ± 10.9
Olsen P (mg kg−1)75.4 ± 31.0118.0 ± 0.58.3 ± 0.498.4 ± 8.8
N-NH4+ (mg kg−1)15.9 ± 1.515.1 ± 3.215.5 ± 4.137.1 ± 4.0
N-NO3 (mg kg−1)48.5 ± 10.564.4 ± 2.18.7 ± 0.955.9 ± 10.8
Texture categoryLoamSandy LoamSilty Clay LoamSilty Clay Loam
Sand (%)51741917
Silt (%)35185358
Clay (%)1482825
1 <d.l.: below detection limit.
Disclaimer/Publisher’s Note: The statements, opinions and data contained in all publications are solely those of the individual author(s) and contributor(s) and not of MDPI and/or the editor(s). MDPI and/or the editor(s) disclaim responsibility for any injury to people or property resulting from any ideas, methods, instructions or products referred to in the content.

