
Experimental and Numerical Investigations on Curing a Polyester-Based Powder Coating by Catalytic Infrared Radiation

 , ,
, ,
Abstract
:1. Introduction
- Catalytic infrared heating equipment predominantly produces mid-wave and long-wave infrared radiation. This matches the spectral absorption characteristics of powder coatings, accelerating the curing process;
- Catalytic infrared technology directly converts gas into infrared radiation under the action of a catalyst, resulting in higher energy conversion efficiency. The conversion rate for methane, the main component of natural gas, can reach more than 98%;
- Catalytic combustion releases infrared radiation energy, enabling the efficient and complete combustion of gas at low temperatures. Low-temperature (<600 °C) combustion reduces the generation of polluting gases, such as CO and NOx. Lower pollutant emissions can be obtained (~5 ppm compared to 150–200 ppm with conventional combustion) [21]. It is assumed that only CO2 and H2O are produced [23].
2. Experimental Investigations
2.1. Equipment and Materials
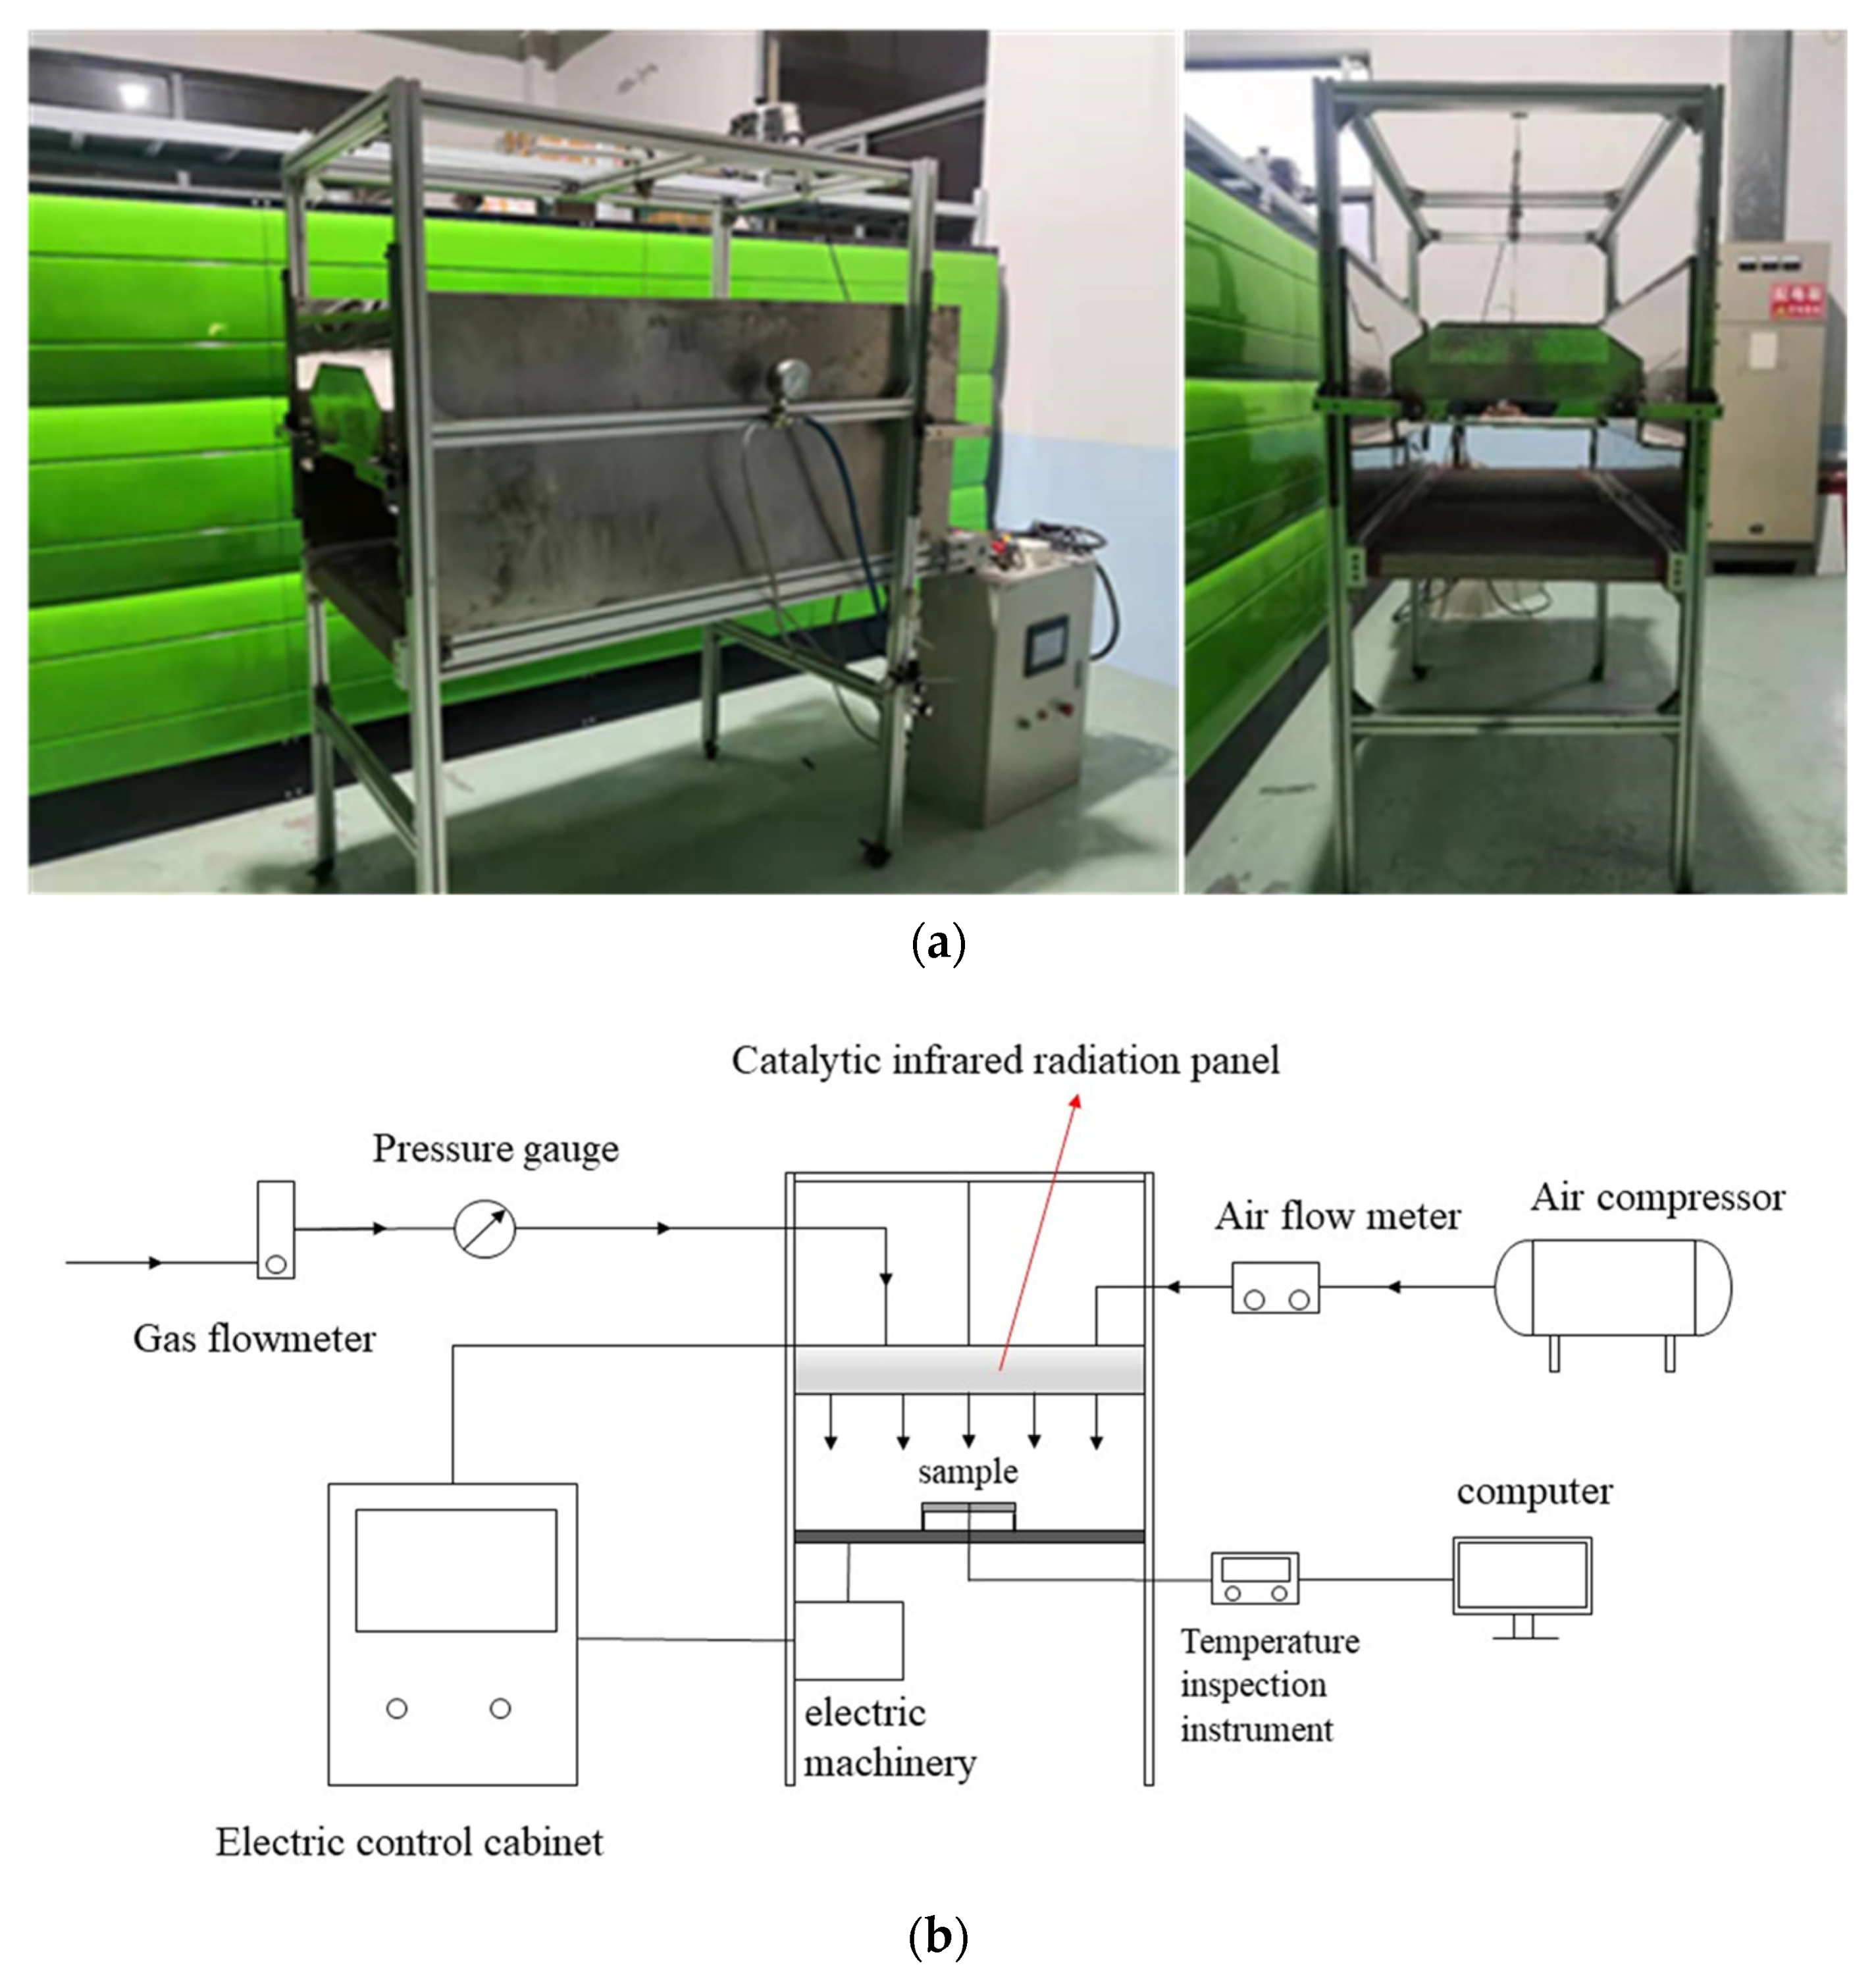
2.2. Experimental Setup
2.2.1. Catalytic Infrared Radiation Panel Characteristics Test
2.2.2. Fourier-Transform Infrared Spectroscopy of the Powder Coatings
2.2.3. Curing Methods and Test Conditions
- Adhesion: This test was conducted according to ASTM Test Method D3359, Method B using a multi-toothed blade (QFH-A, Dongguan Huanguo Precision Instrument Co., Ltd., Dongguan, China) suitable for standard adhesion tests. Specific method: Firstly, the cured coating template was fixed, and the multi-toothed cutter blade was set perpendicular to the template and drew a scratch. Then, the template was evenly covered with transparent tape before it was removed to observe the scratching off, using the observer’s judgment to determine the size of the adhesion area;
- Gloss: This test was performed with a gloss meter measuring instrument (HG-60, Shenzhen Threenh Technology Co., Ltd., Shenzhen, China). Specific method: A calibrated gloss meter was placed on the coating so that no light entered, and the beam of the internal light source of the instrument was at an angle of 60° from the normal line of the tested coating surface. Then, the instrument was initiated and it read the gloss value of the coating. This test was conducted according to ASTM Test Method D523;
- Hardness: The pencil thickness meter (Shanghai Gaozhi Precision Instrument Co., Ltd., Shanghai, China) was used to test the hardness of the cured films. This test was conducted according to ASTM Test Method D3363. Specific method: After curing, a pencil with the same hardness was used for three scratch tests to observe the damage to the template. The hardness of the hardest pencil that did not leave scratches larger than 3 mm on the coating was used as an indication of the hardness of the coating;
- Impact resistance: In this test, a paint film impactor (QCJ-50/100, Tianjin Expo Weiye Hua Glass Instrument Co., Ltd., Tianjin, China) was used to test the hardness of the cured films. This test was conducted according to ISO 6272-2:2002. Specific method: The prepared coating was placed on the anvil at the lower part of the instrument. The hammer was lifted to 50 cm and allowed to fall freely, impacting the template. The damage to the coating surface was recorded;
- Color: The colors of the coating surfaces were measured using a universal colorimeter (NR10QC, Shenzhen Threenh Technology Co., Ltd., Shenzhen, China). Specific method: A calibrated universal colorimeter was placed on the surface of the coating and activated to take readings.
2.3. Experimental Results and Discussion
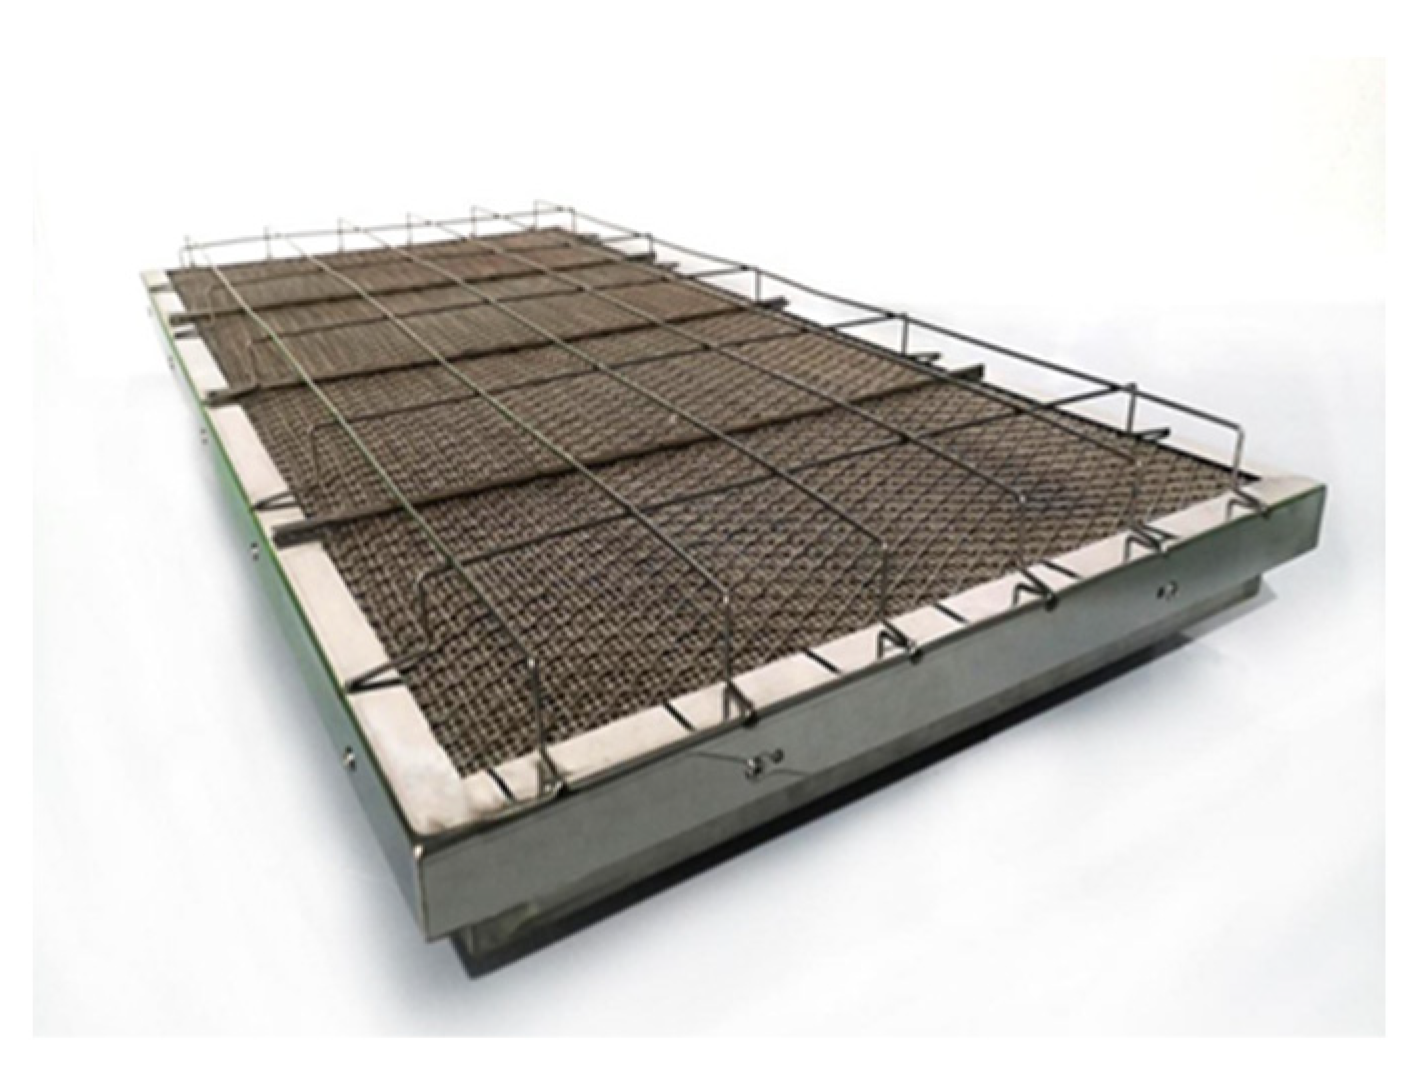
2.3.1. Characteristics of the Catalytic Infrared Radiation Panel
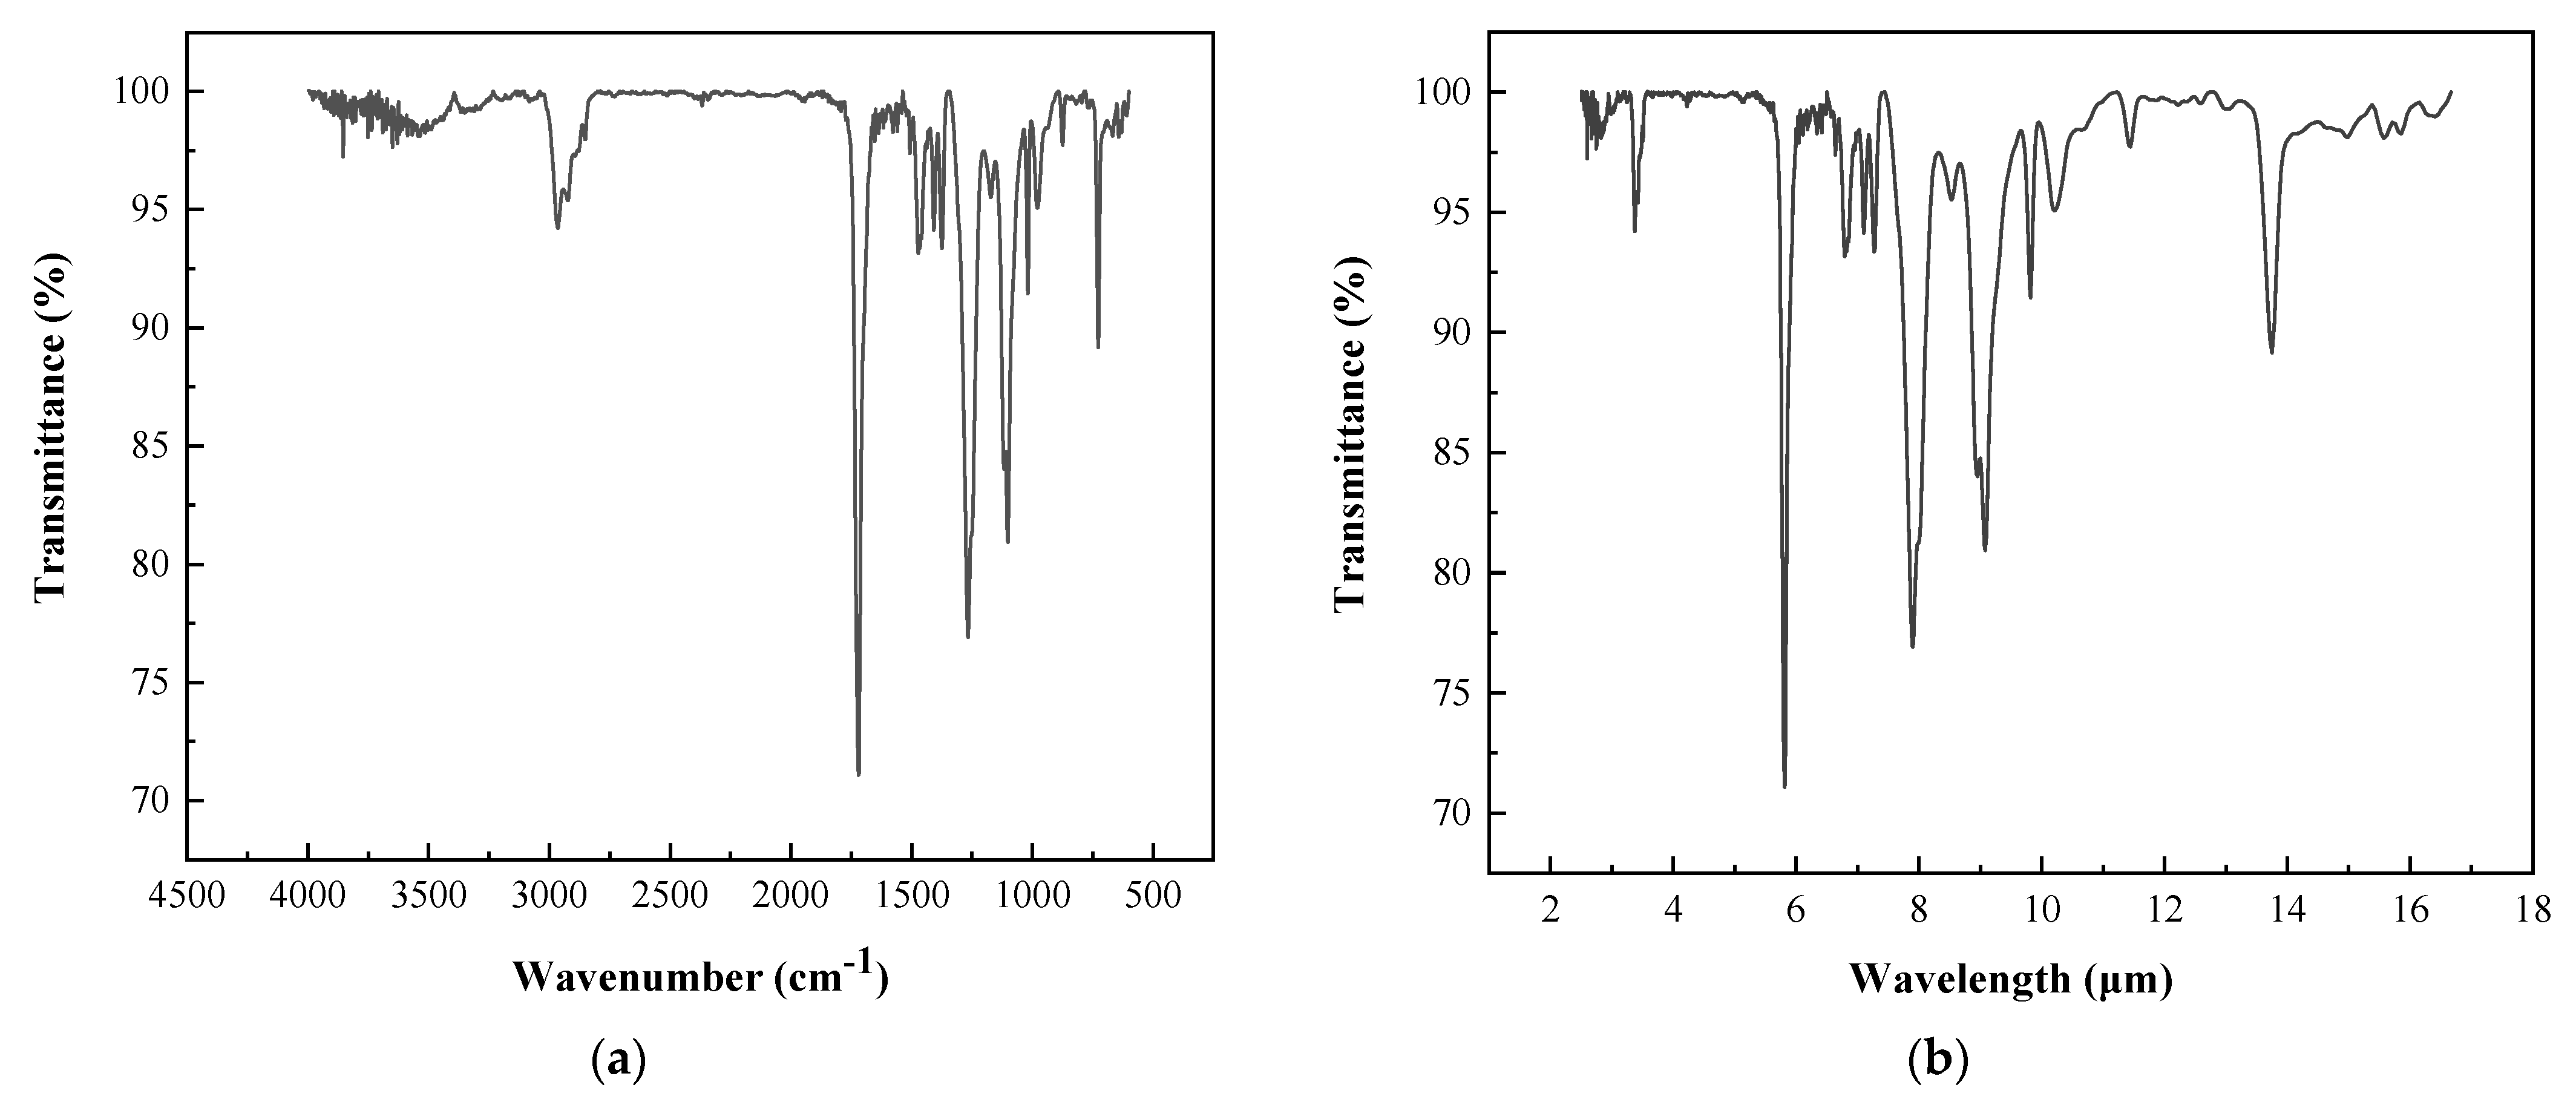
2.3.2. FT-IR Analysis
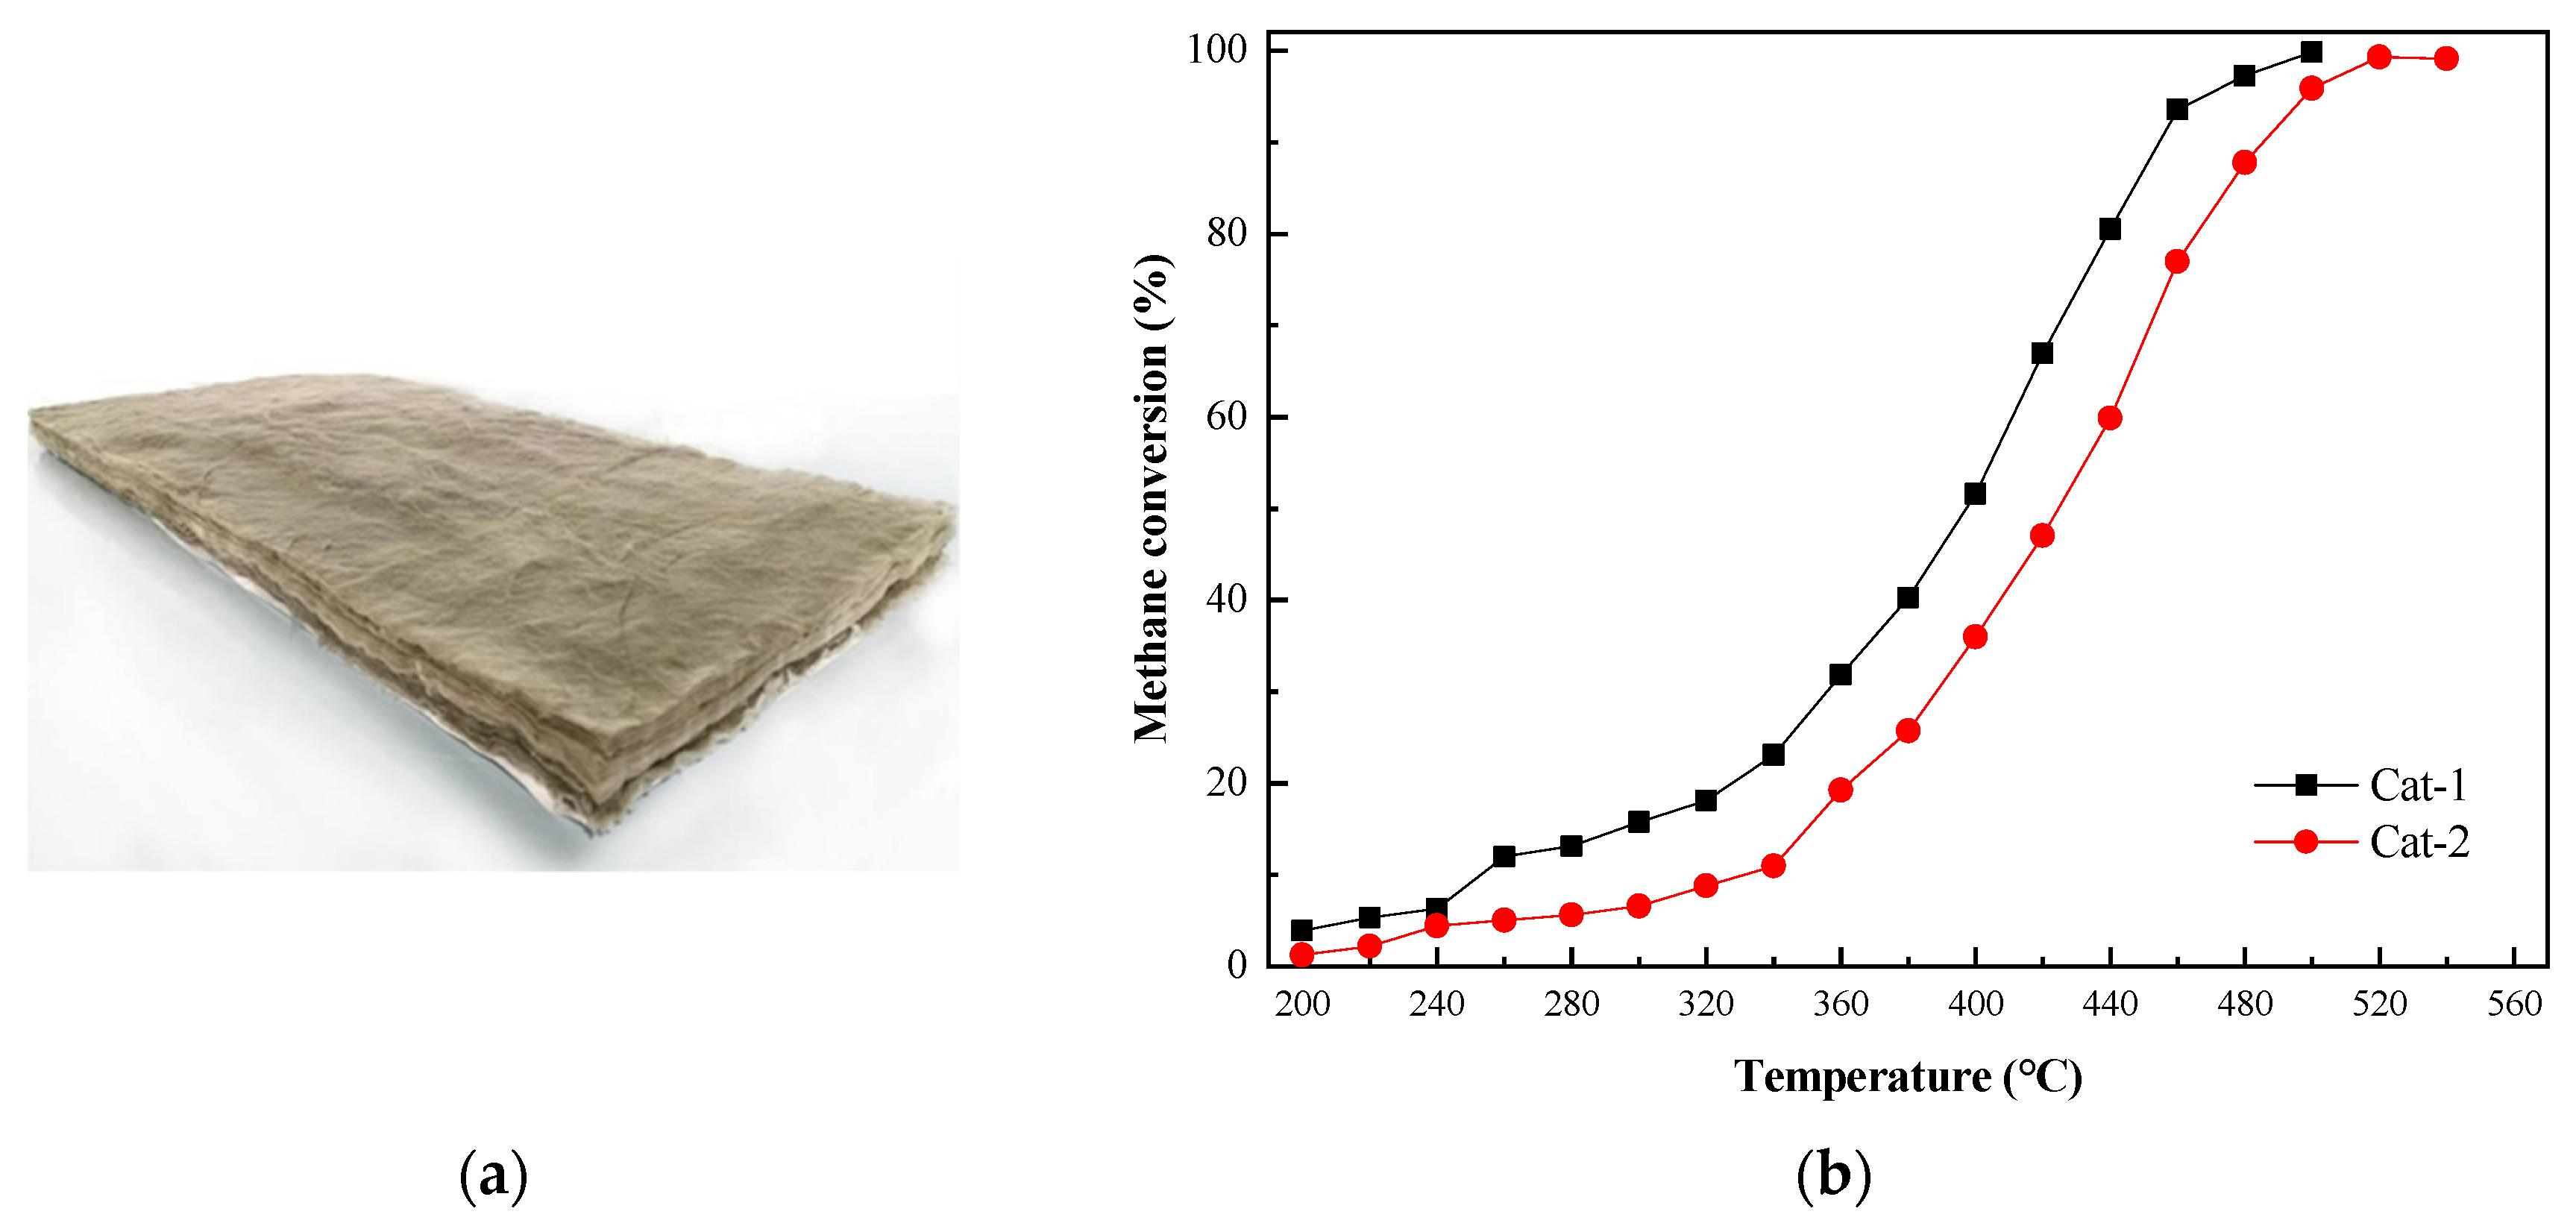
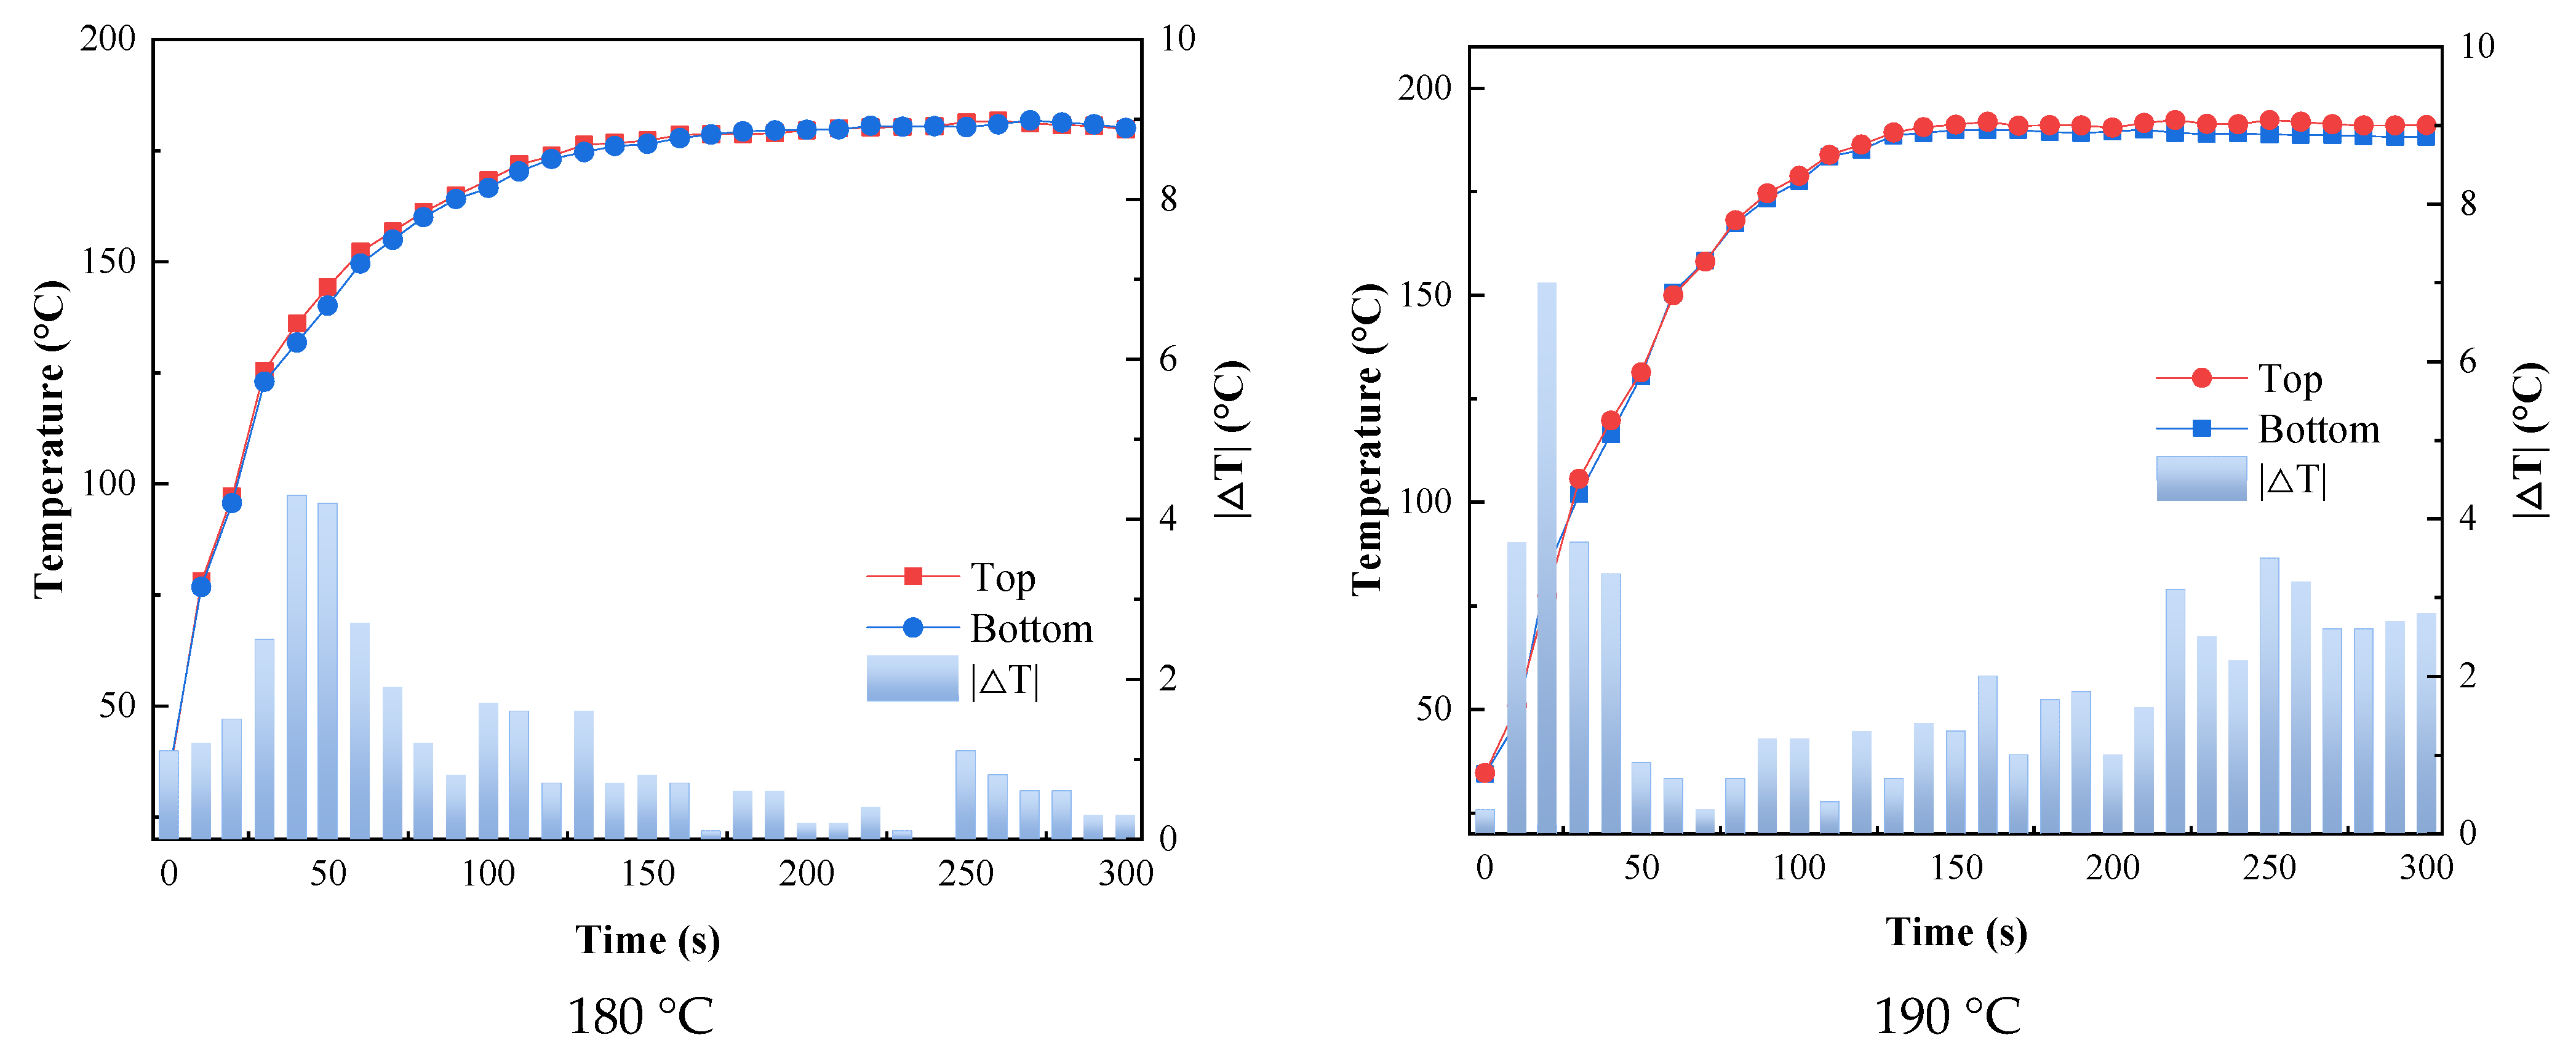
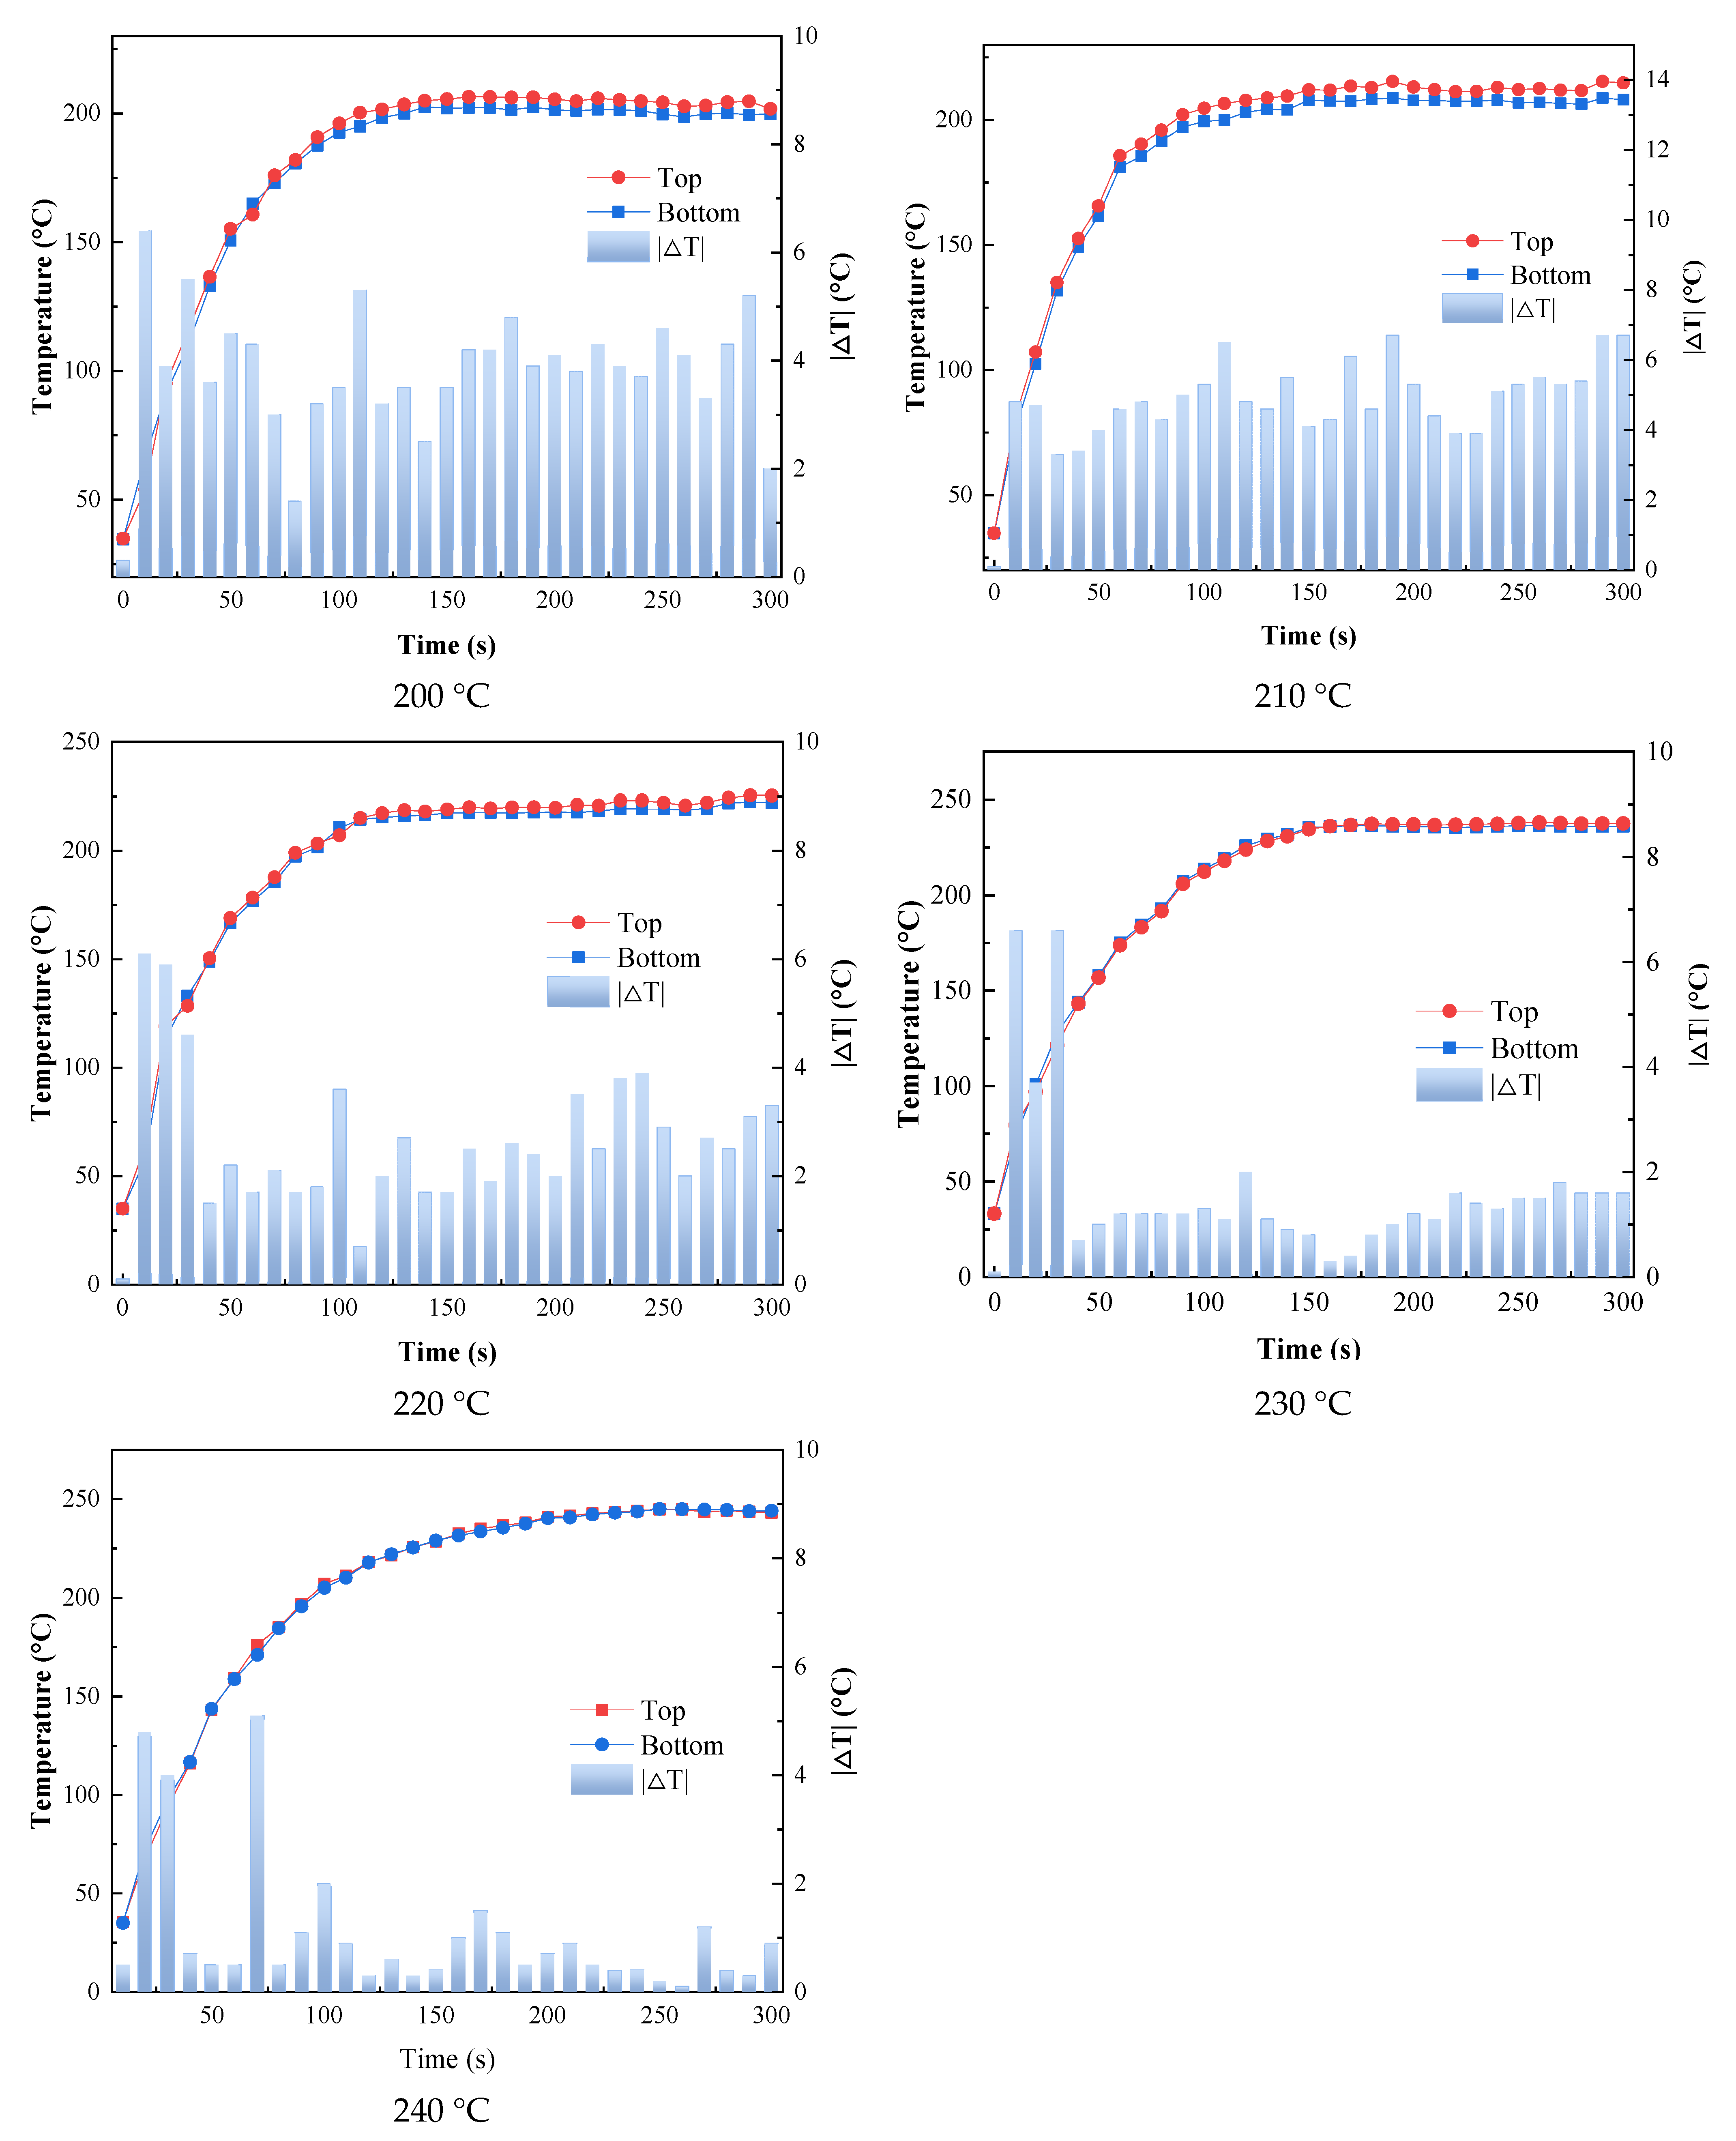
2.3.3. Catalytic Infrared Heating Performance
2.3.4. Curing Tests
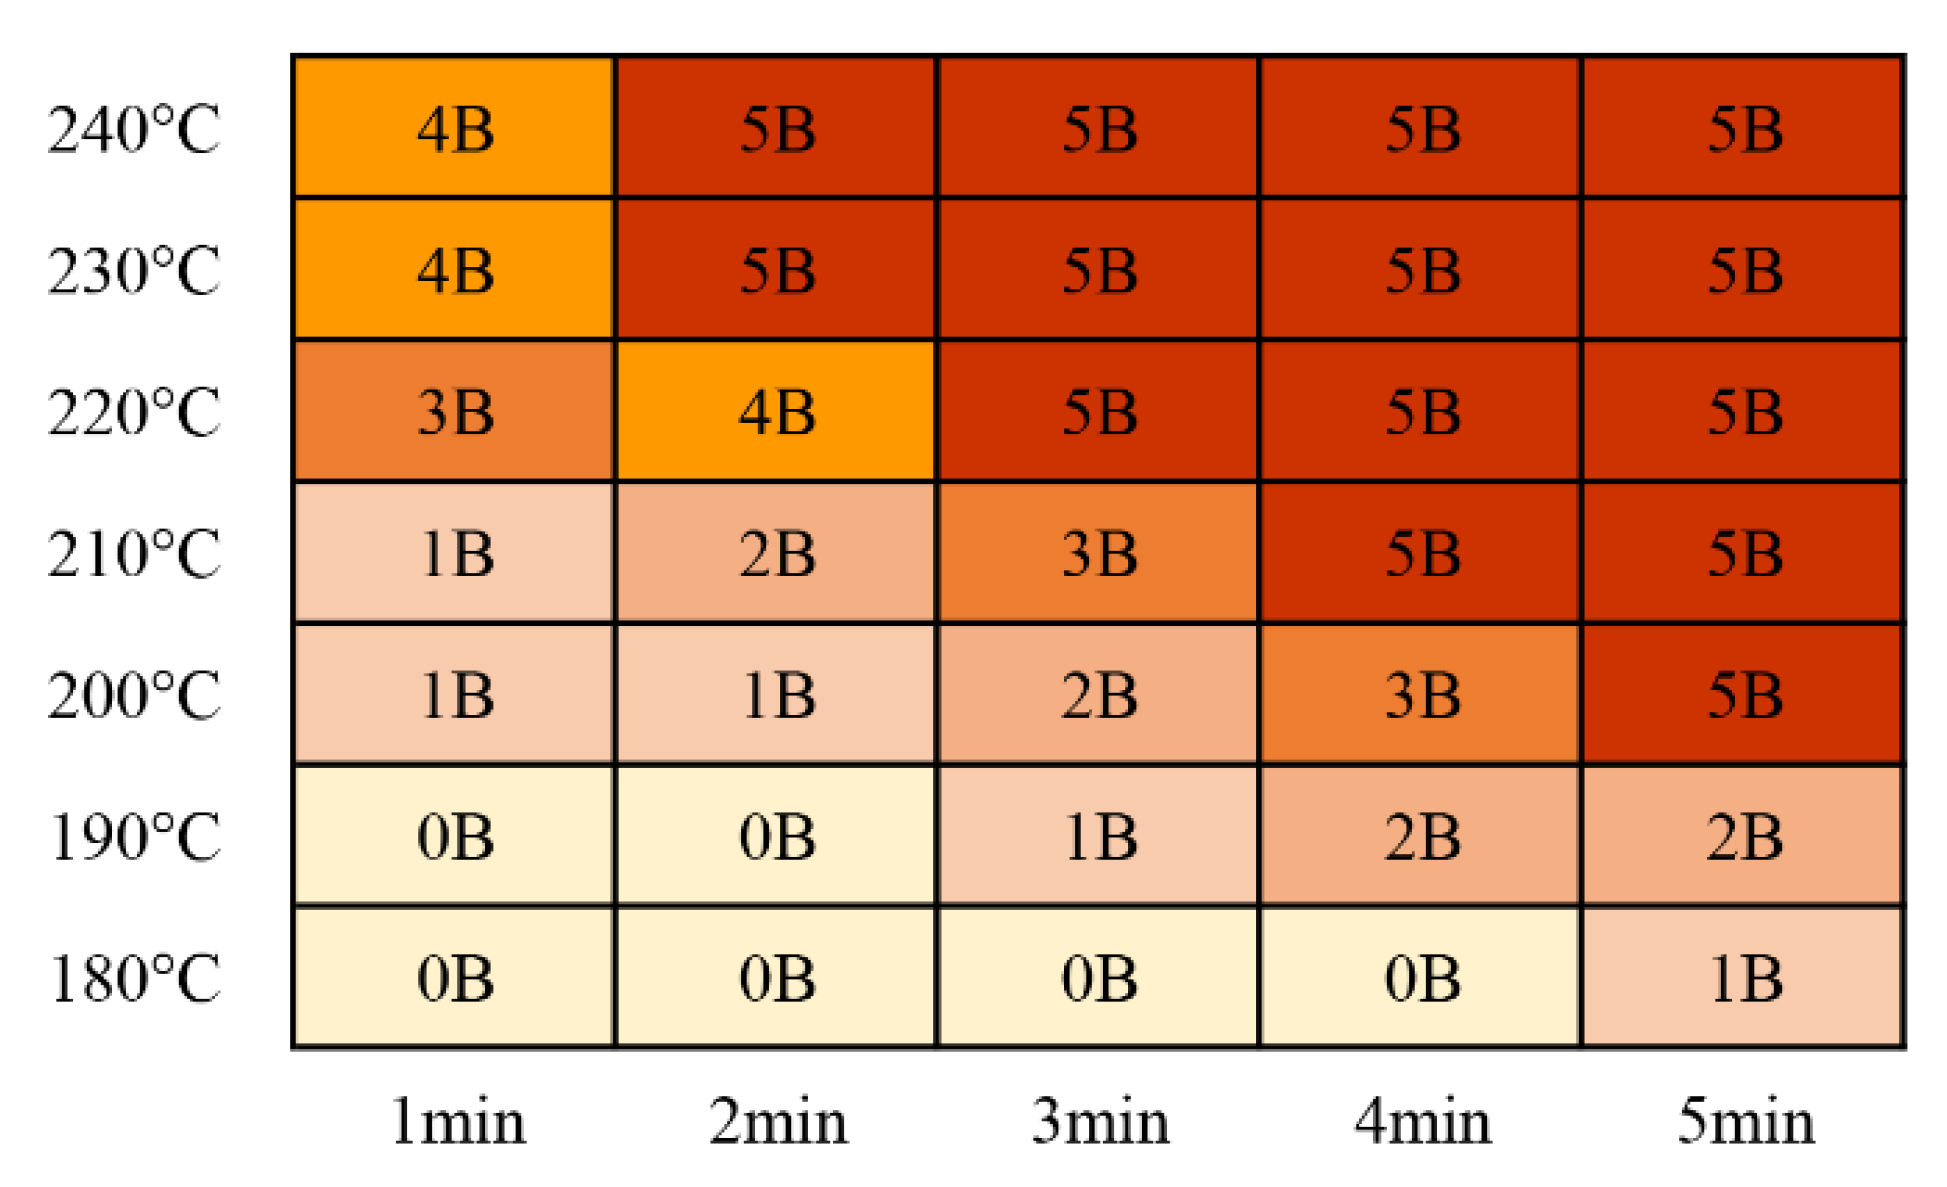
Adhesion
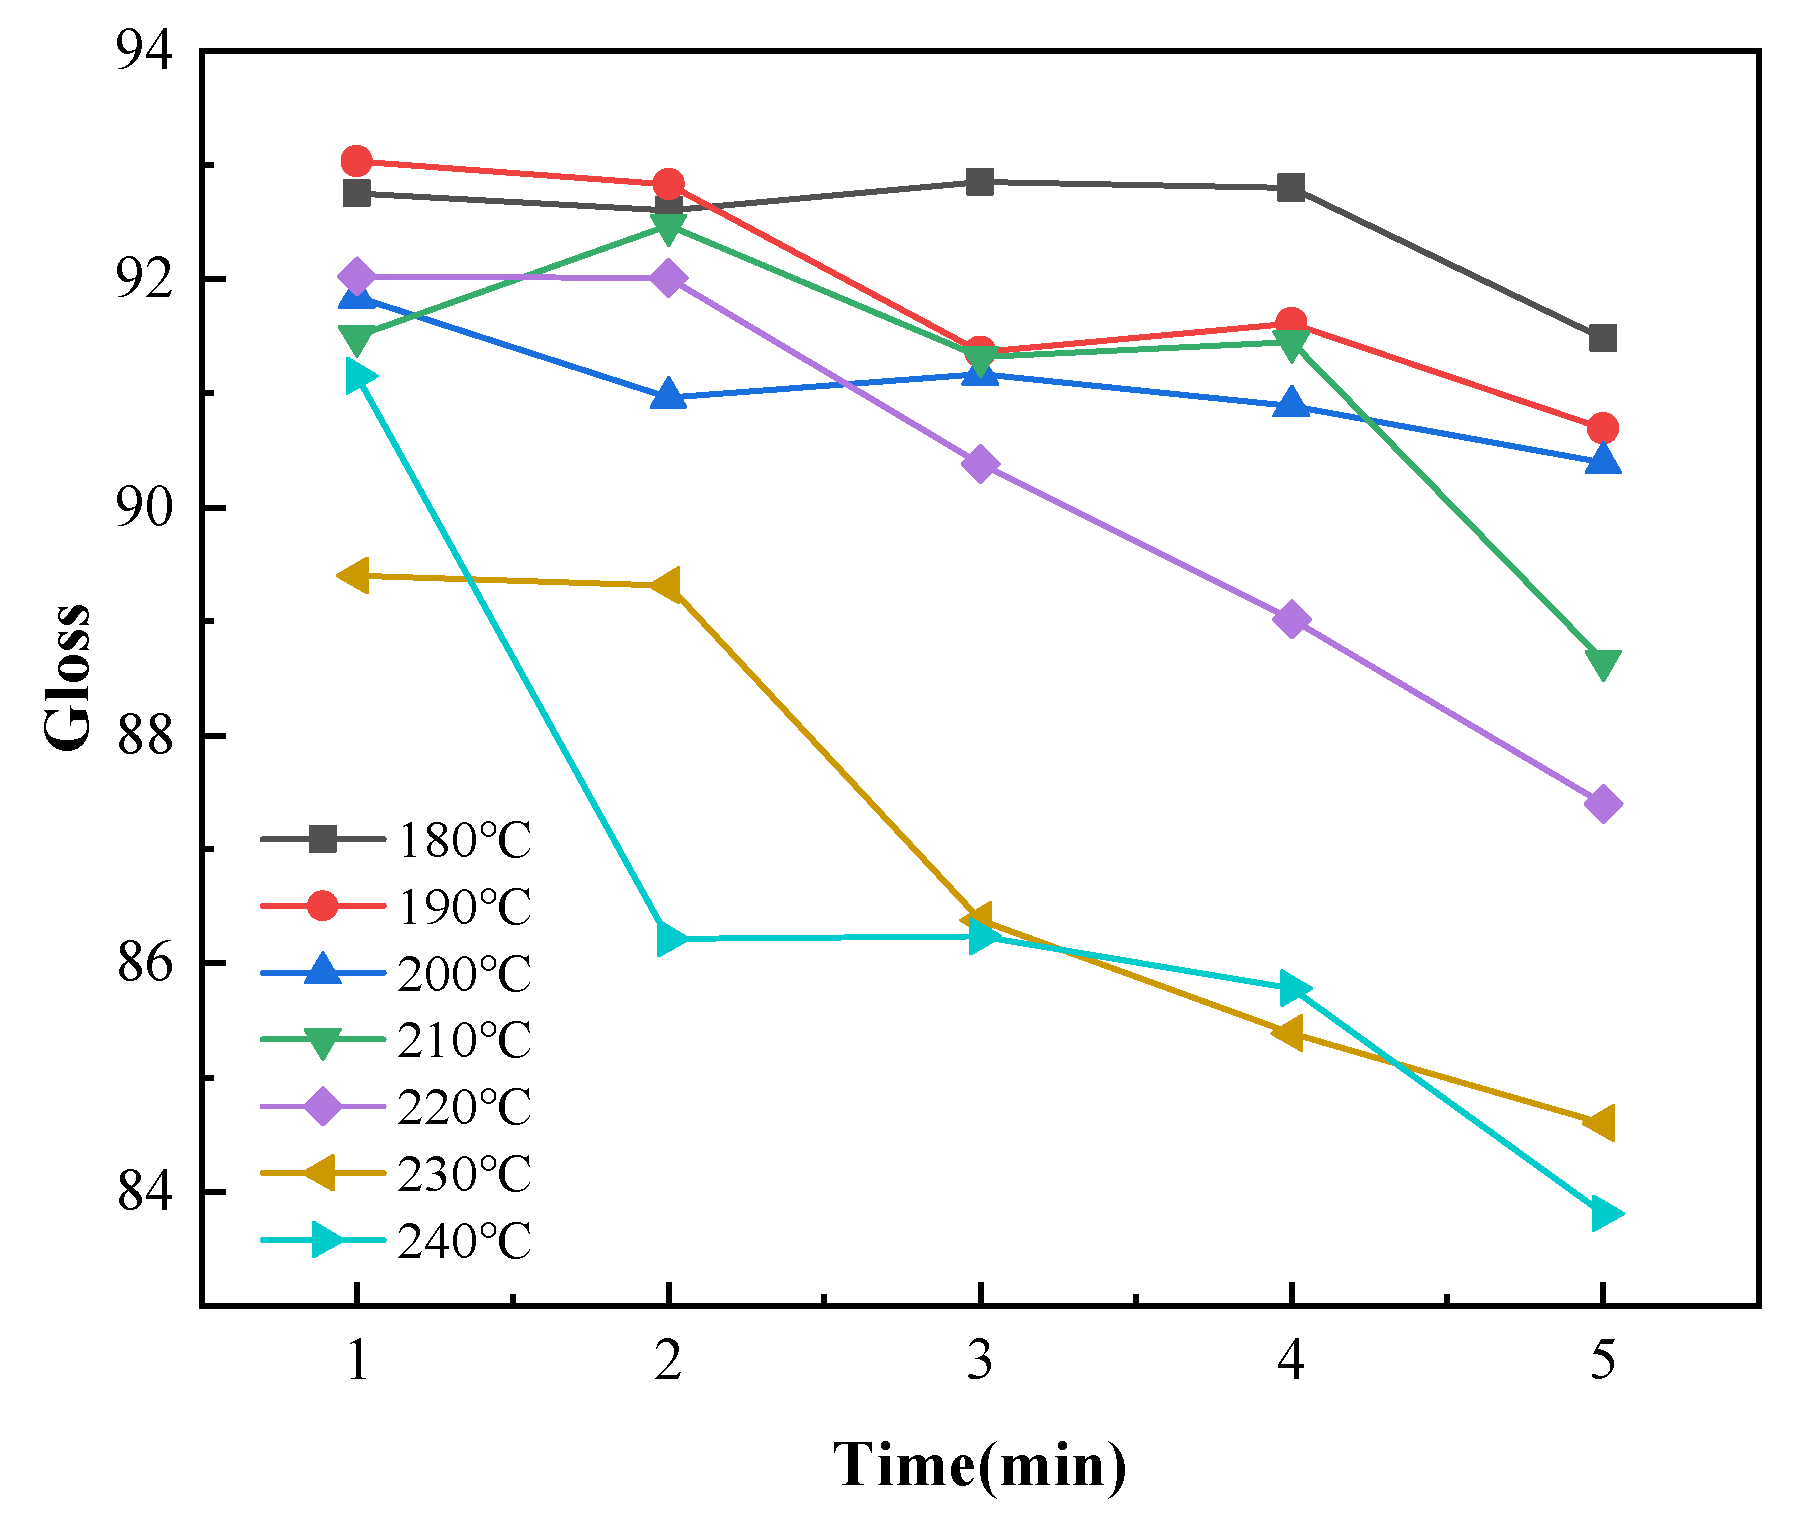
Gloss
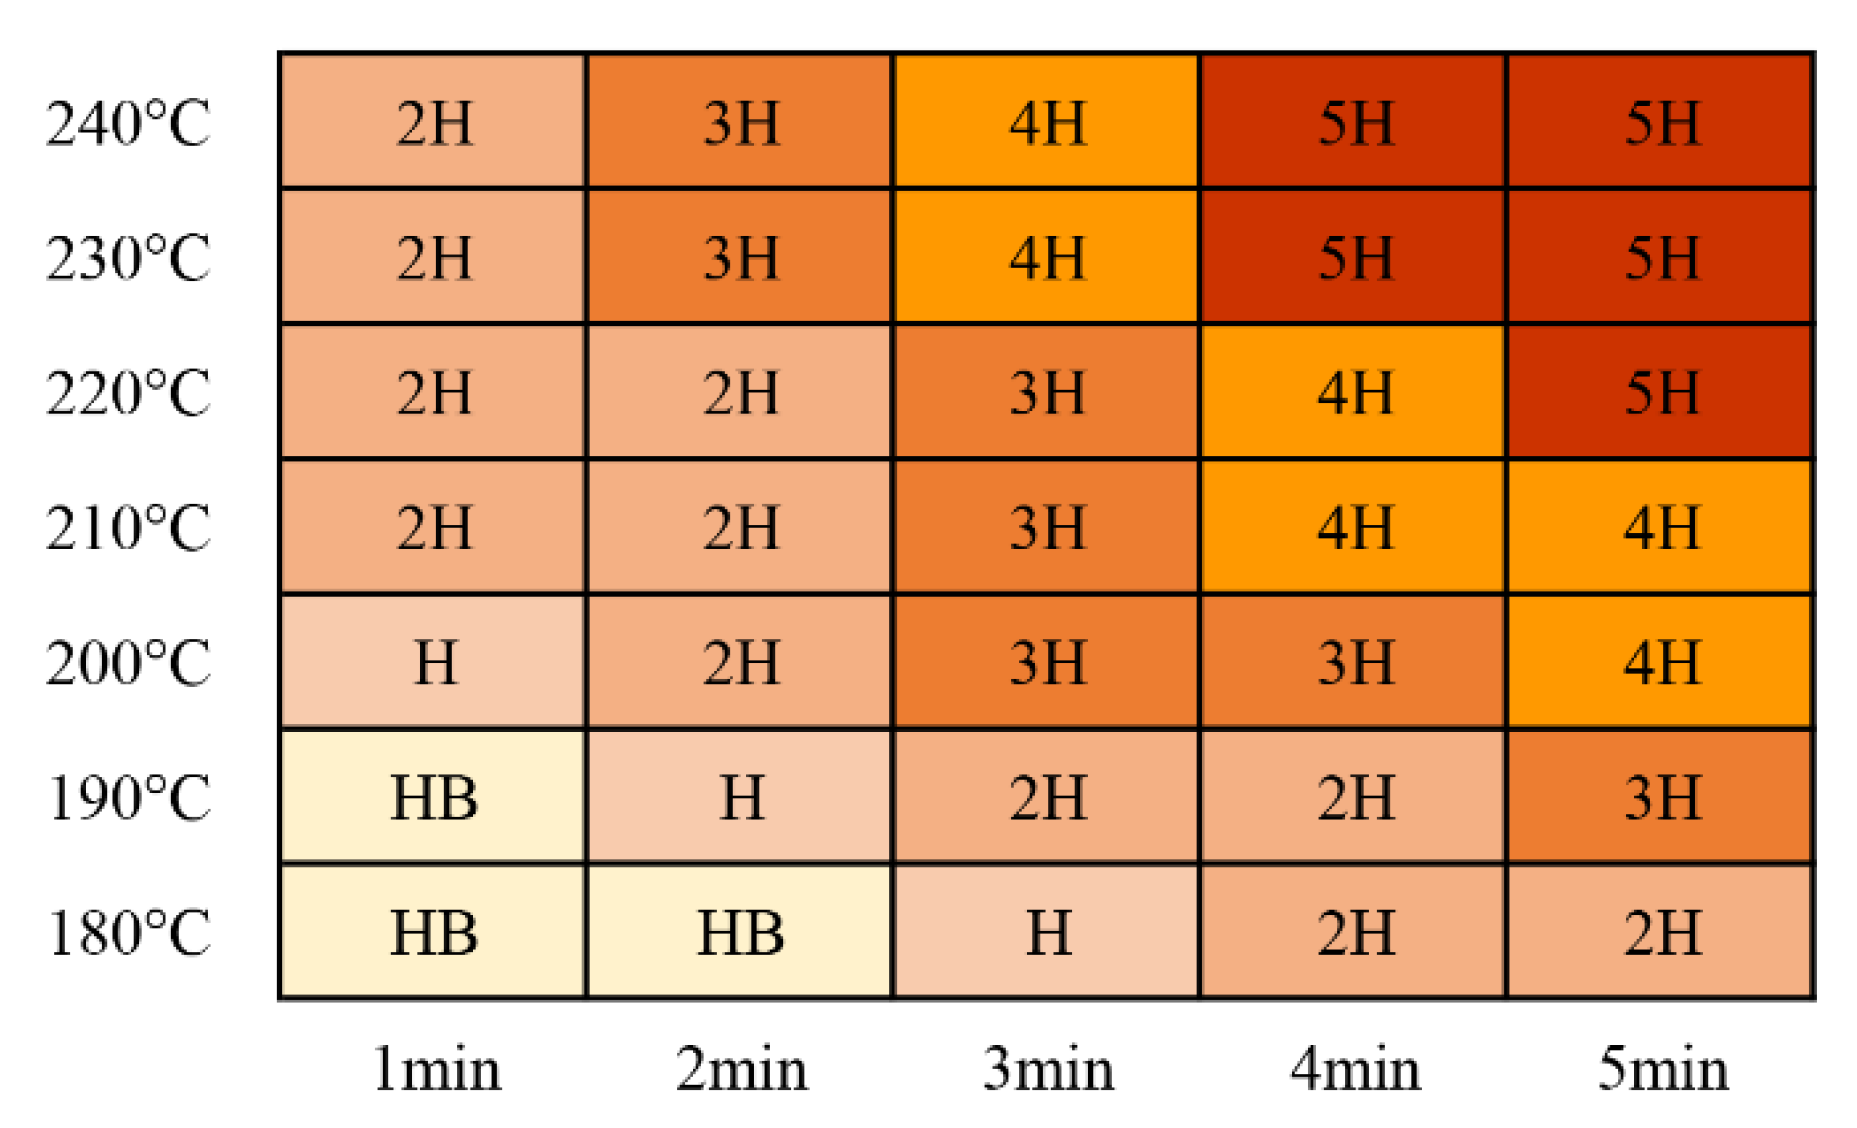
Hardness
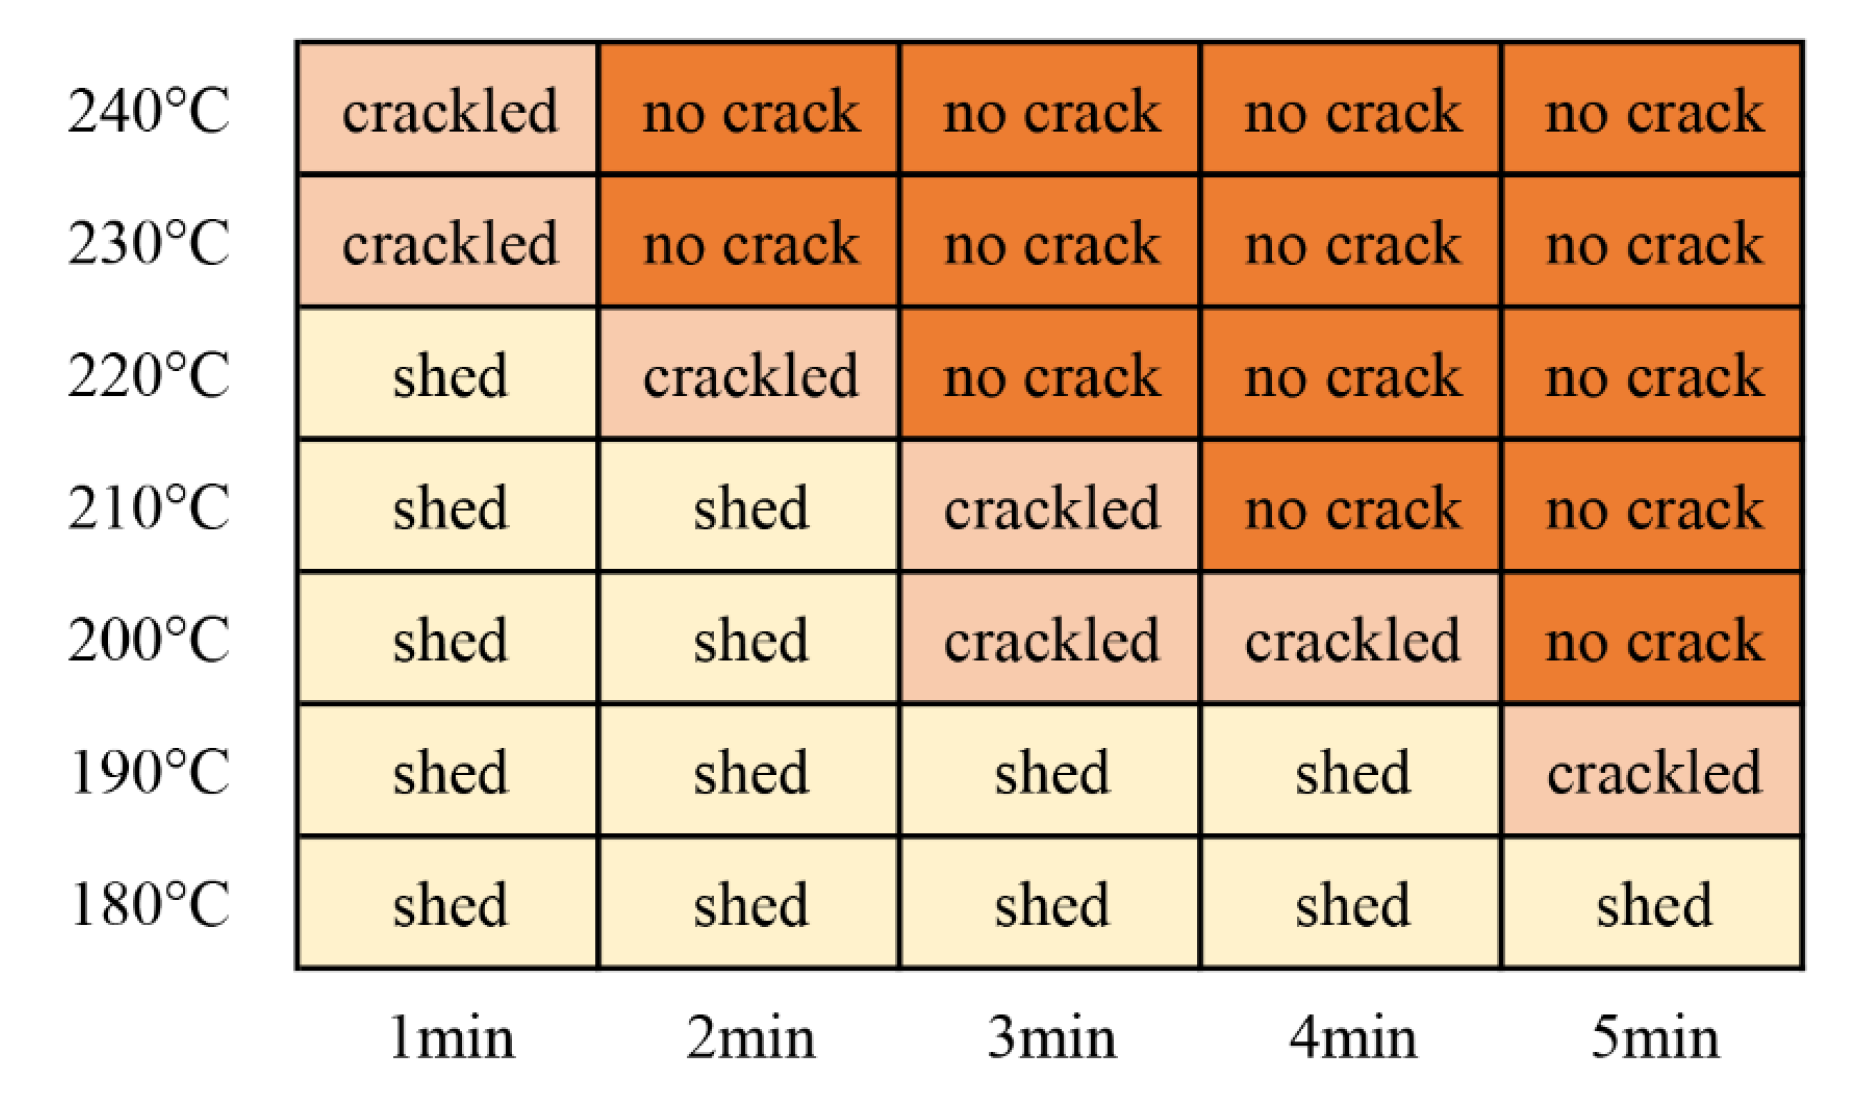
Impact Resistance
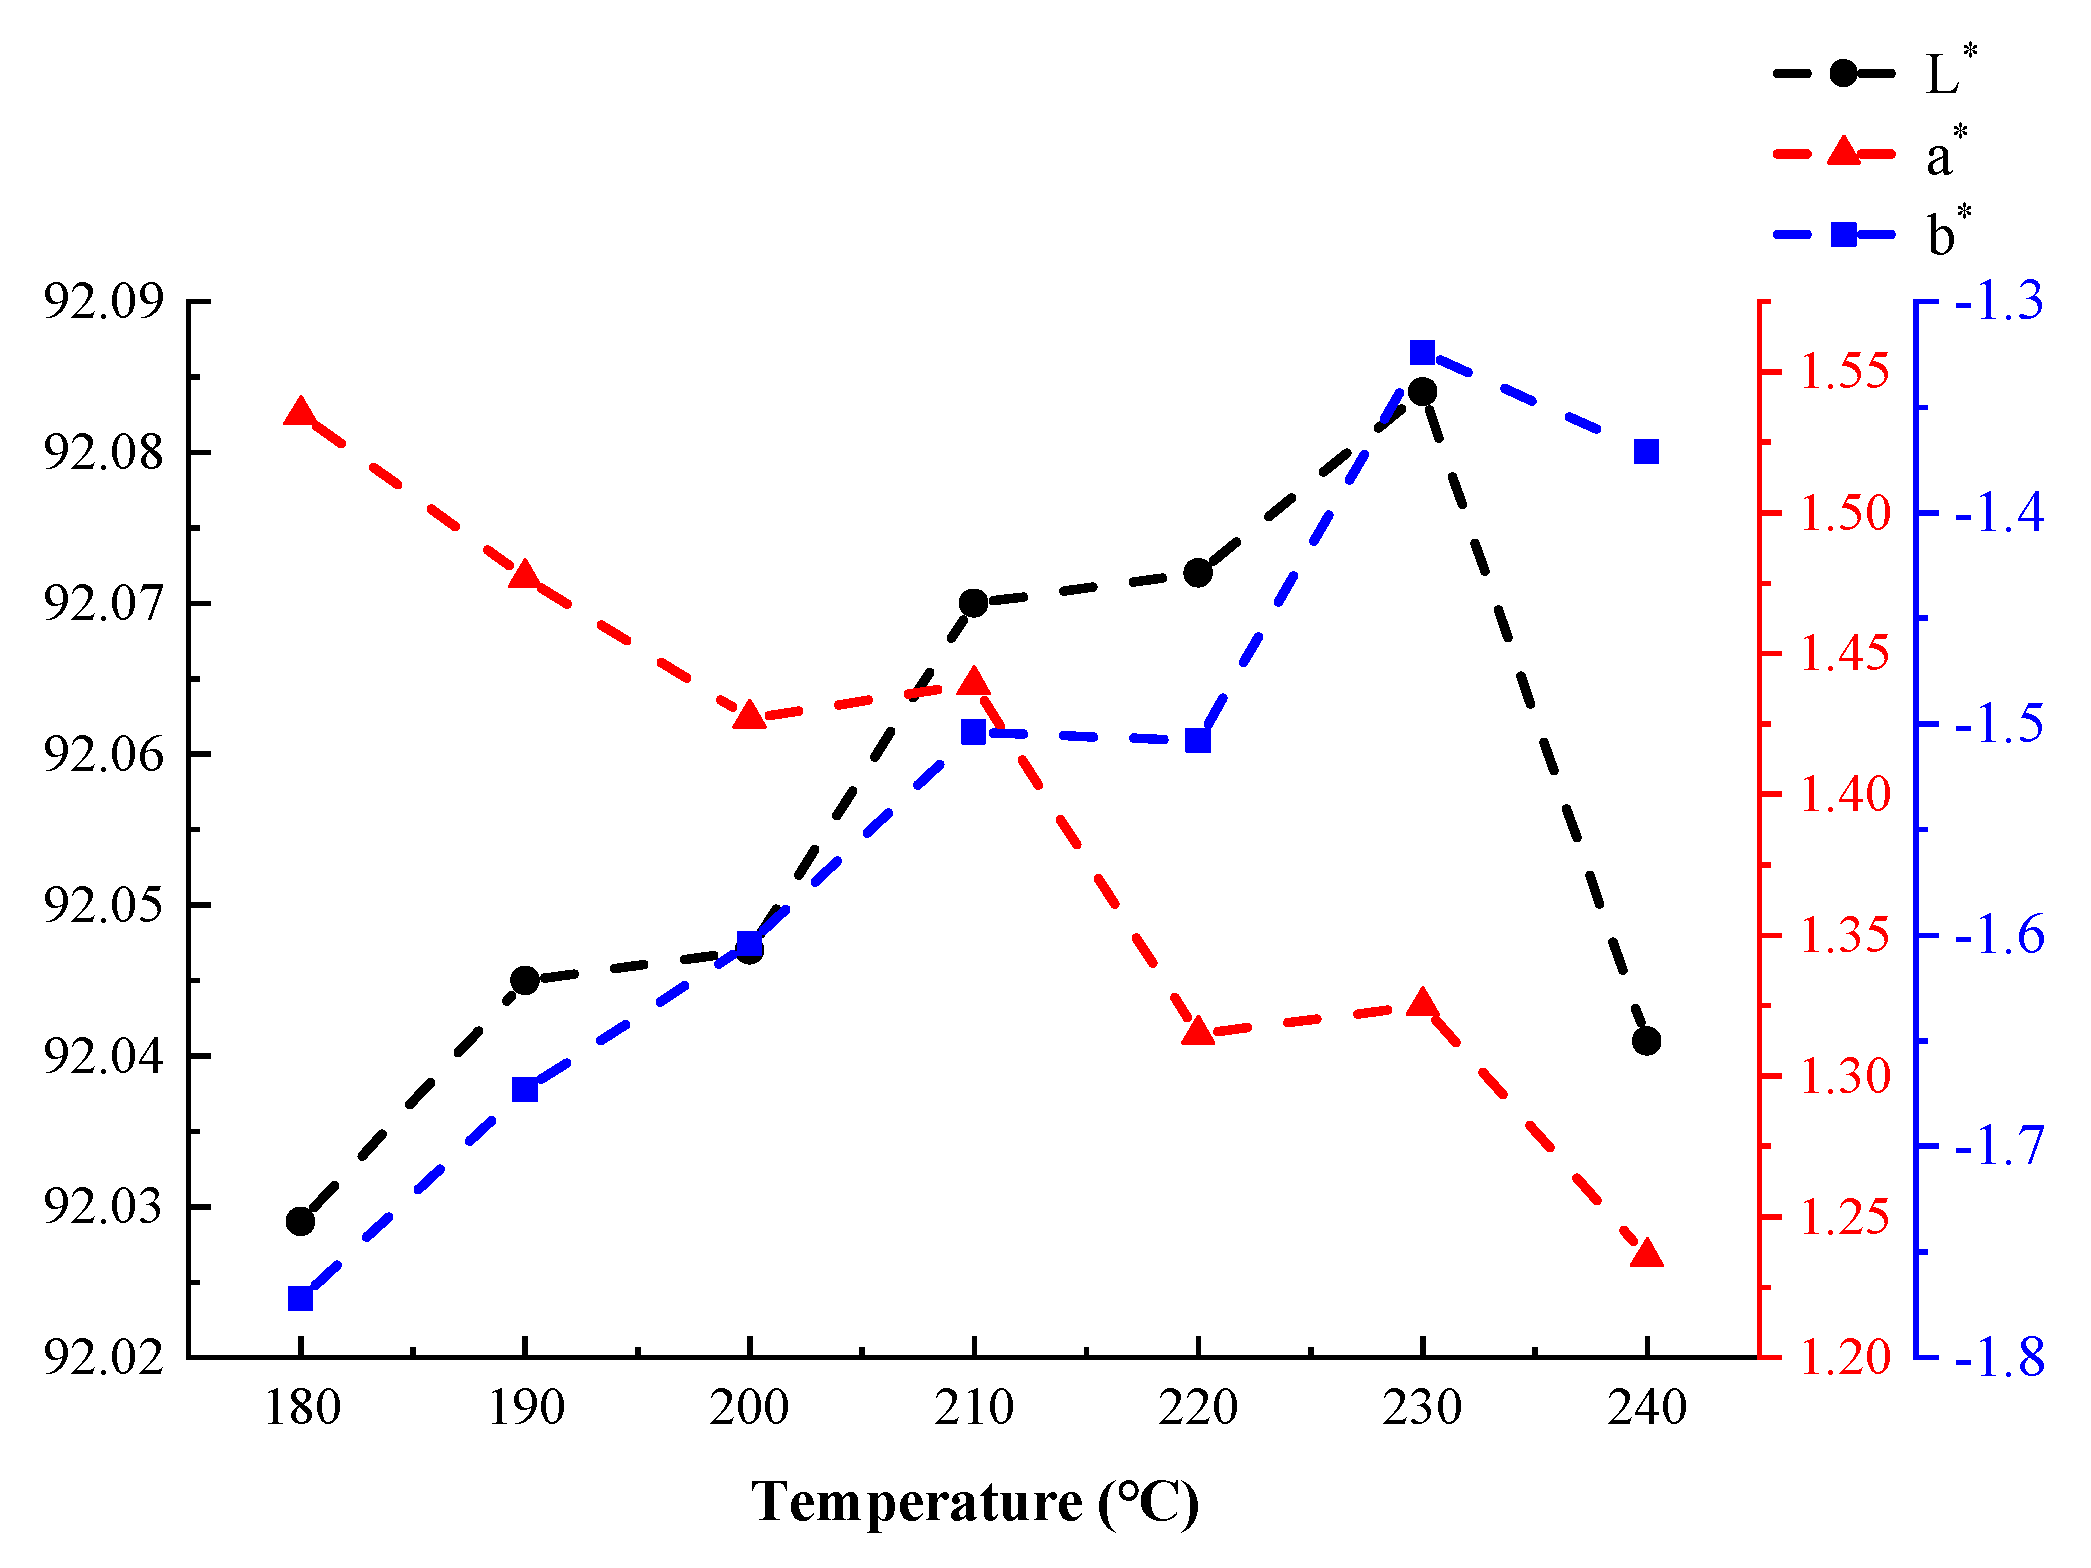
Color
Summary
3. Numerical Simulations
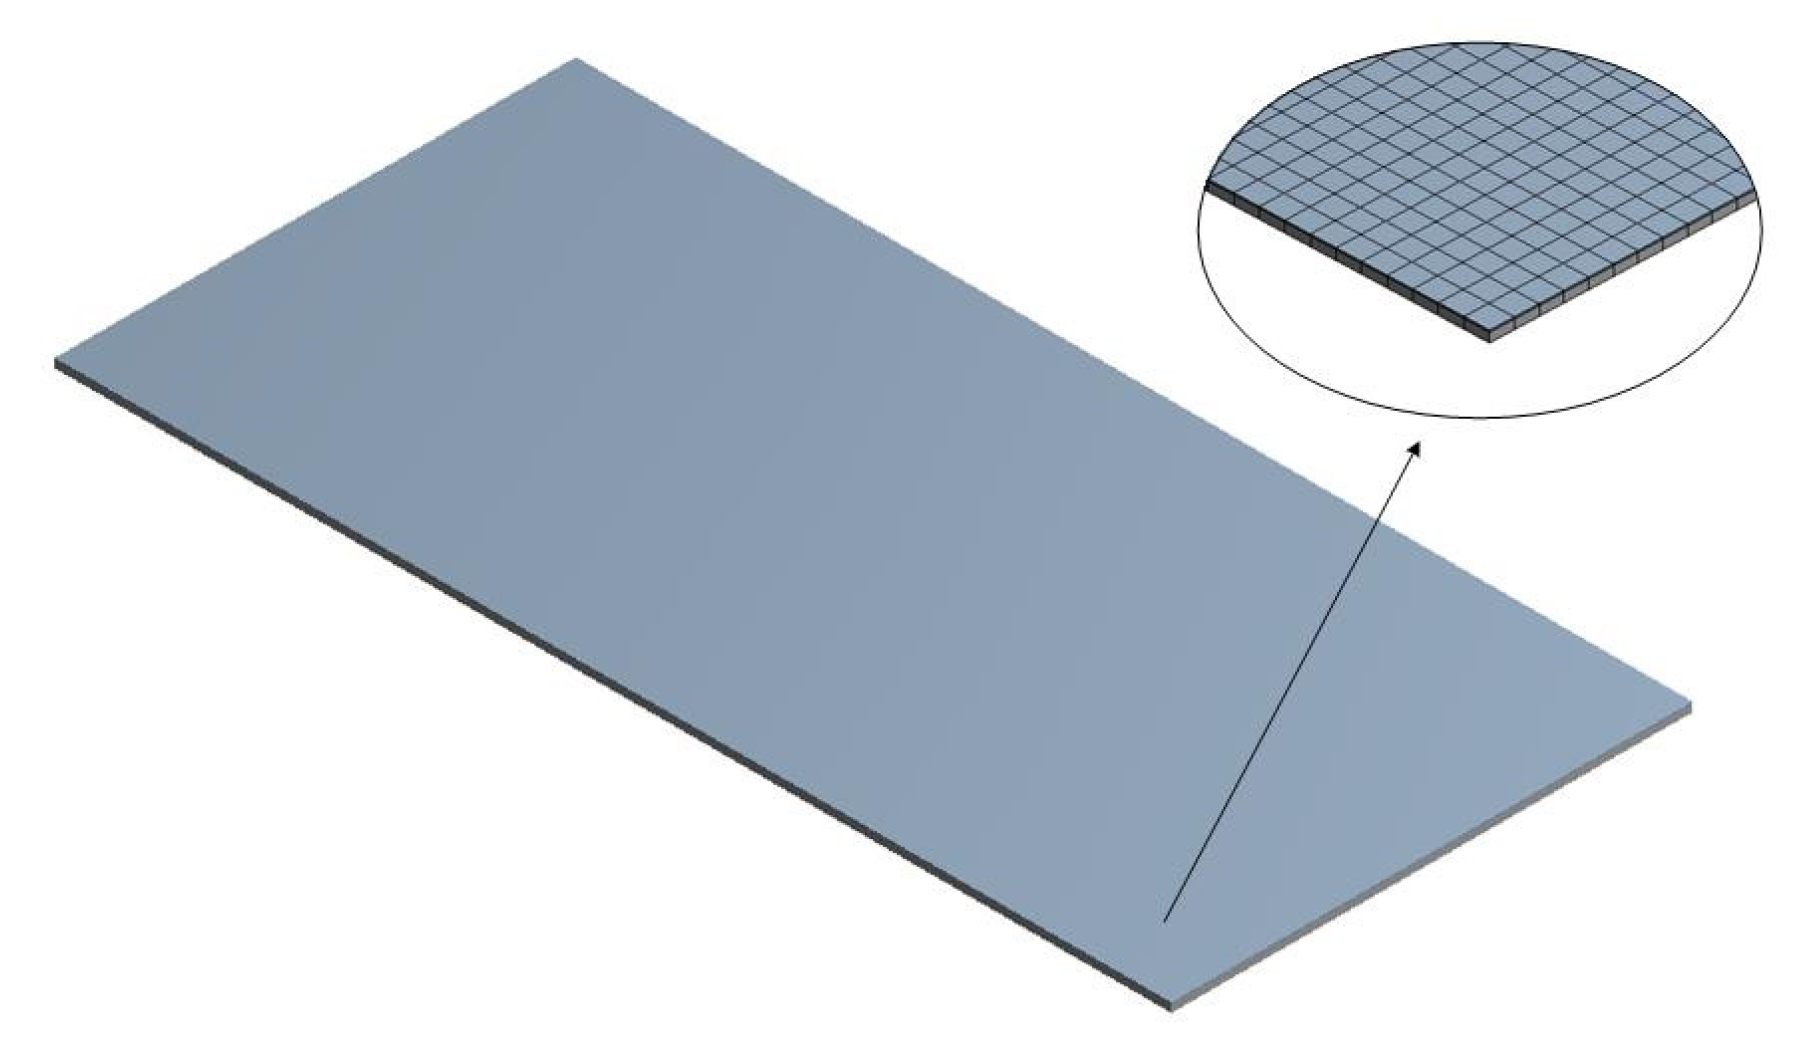
3.1. Geometric Model
3.2. Heat Transfer Model
- The film was isotropic and homogeneous, the coating temperature was uniform and consistent before curing, and the film thickness did not change during curing;
- The density, thermal conductivity, specific heat capacity, and other physical properties of the coating and substrate were constant and did not change with temperature;
- The thickness of the coating was set to , and heat transfer only occurred in the direction;
- Assuming that the heat transfer process was uniform, the heat transfer model in the substrate was simplified as one-dimensional heat transfer along the direction;
- The radiative effect of air was not considered.
- Infrared rays have a specific penetration capability, and objects can be simultaneously heated within this penetration distance. Thus, the infrared heating rate of the coating was higher than that of hot-air heating. The thickness of the coating (100 μm) was within this infrared penetration zone. Therefore, it was assumed that the temperature at every point in the coating simultaneously increased. Based on this analysis, the heat transfer process was simplified by equating the infrared radiation heating of the coating with the heating of the coating via an internal heat source;
- The coating was very thin, so it was assumed that no attenuation of infrared radiation occurred along the thickness direction. Therefore, the intensity of the equivalent internal heat source within the coating was equal across all points in the coating.
3.3. Boundary Conditions
3.4. Numerical Method and Model Validation
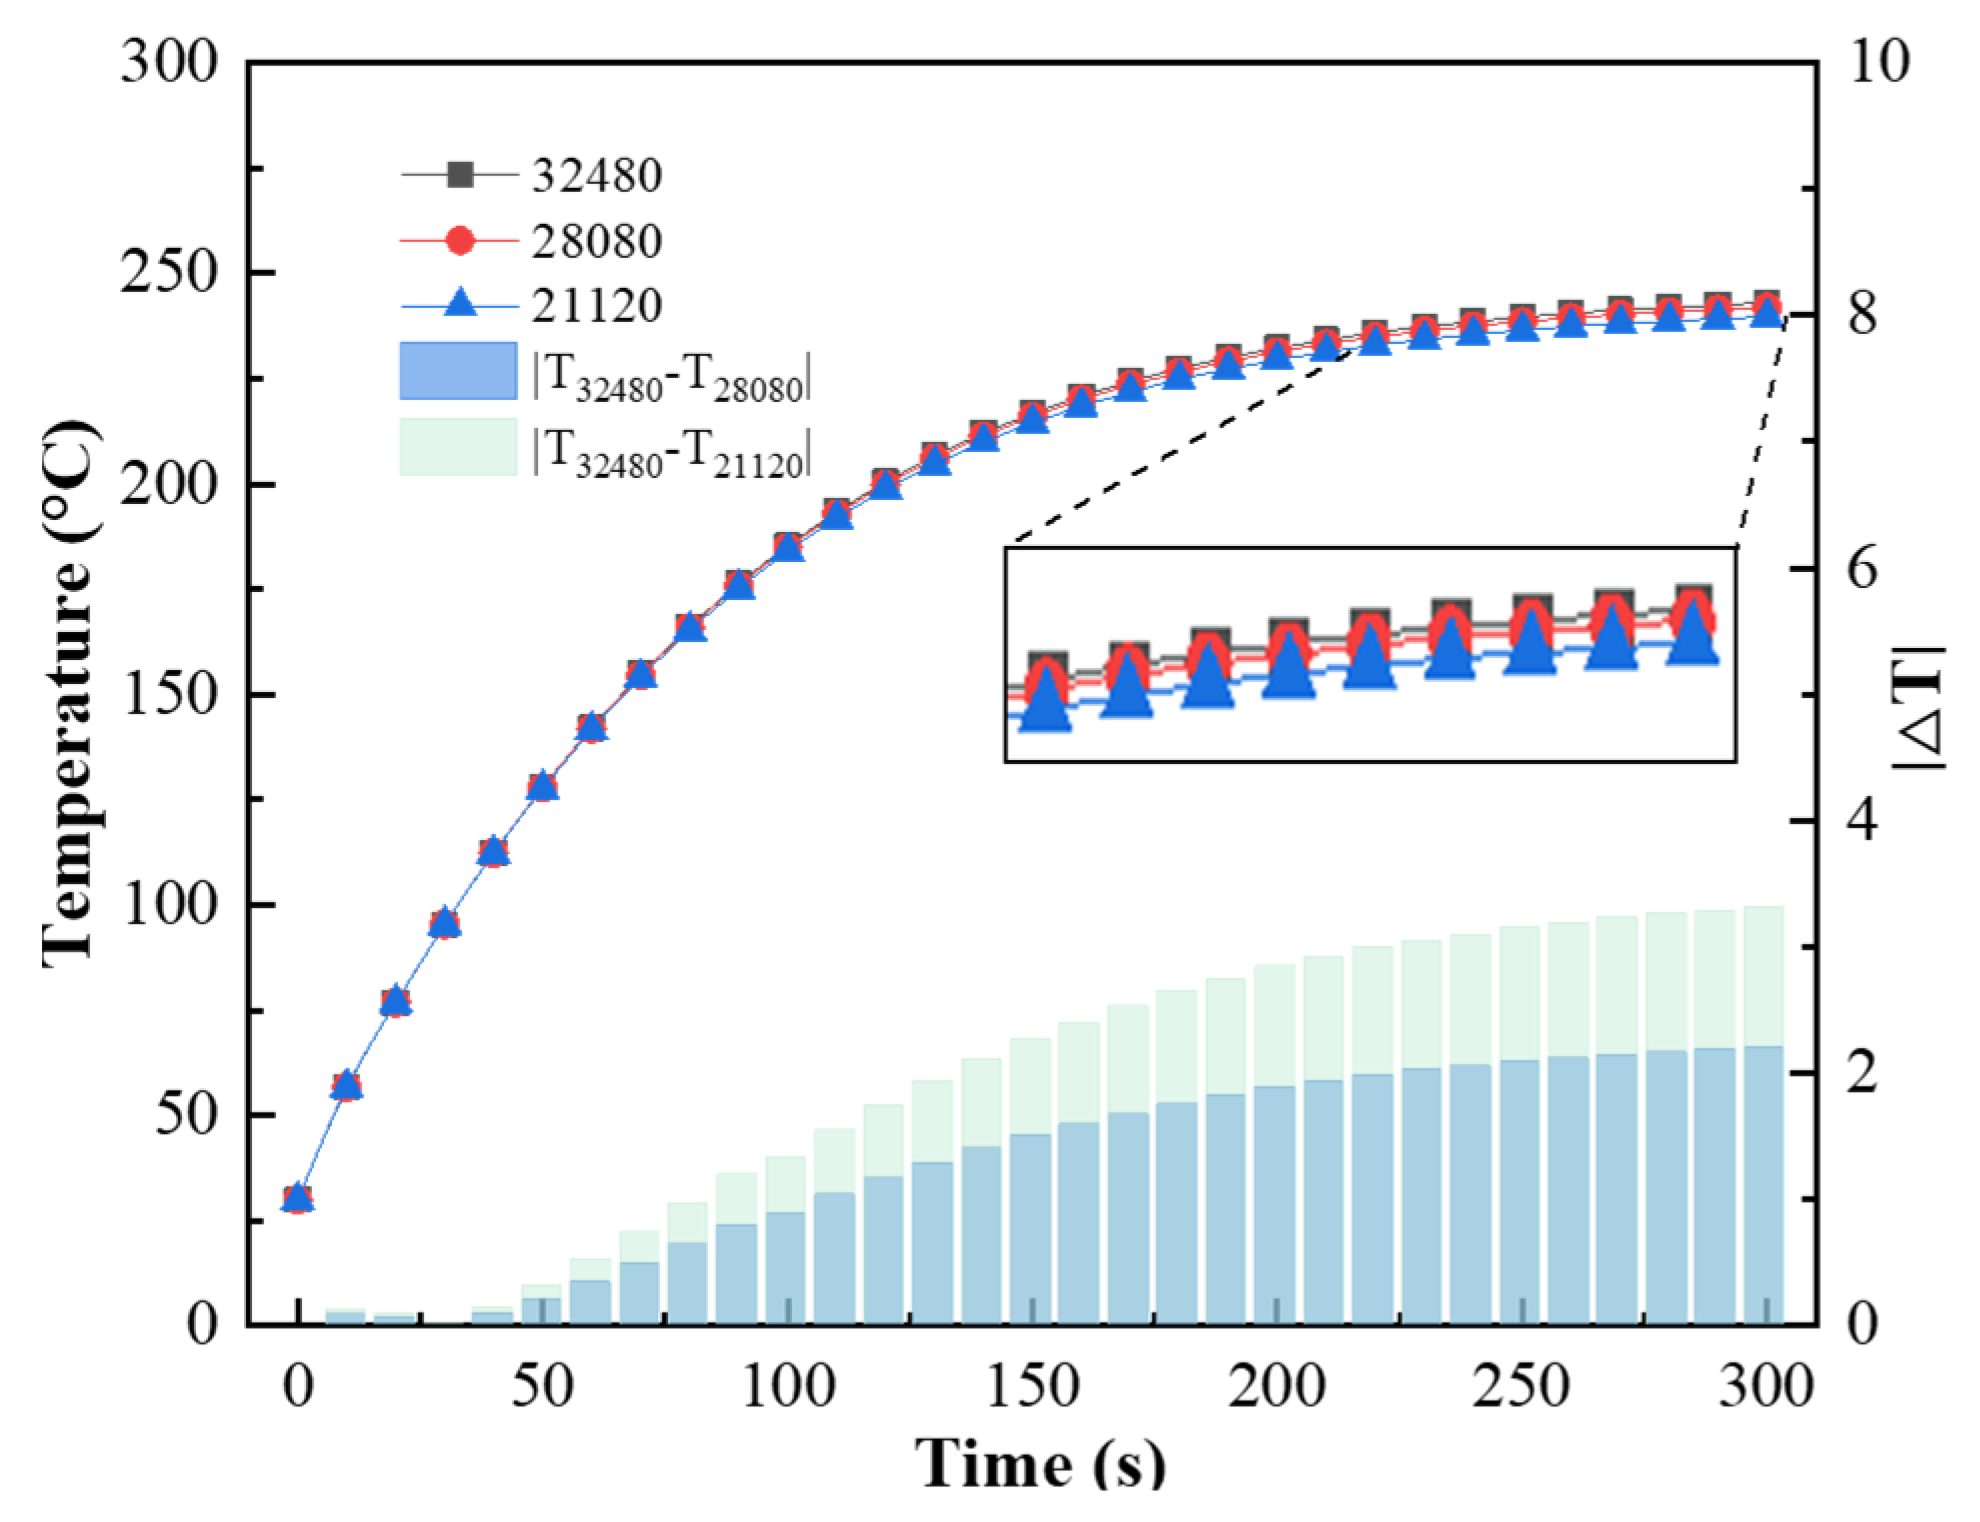
3.4.1. Numerical Method
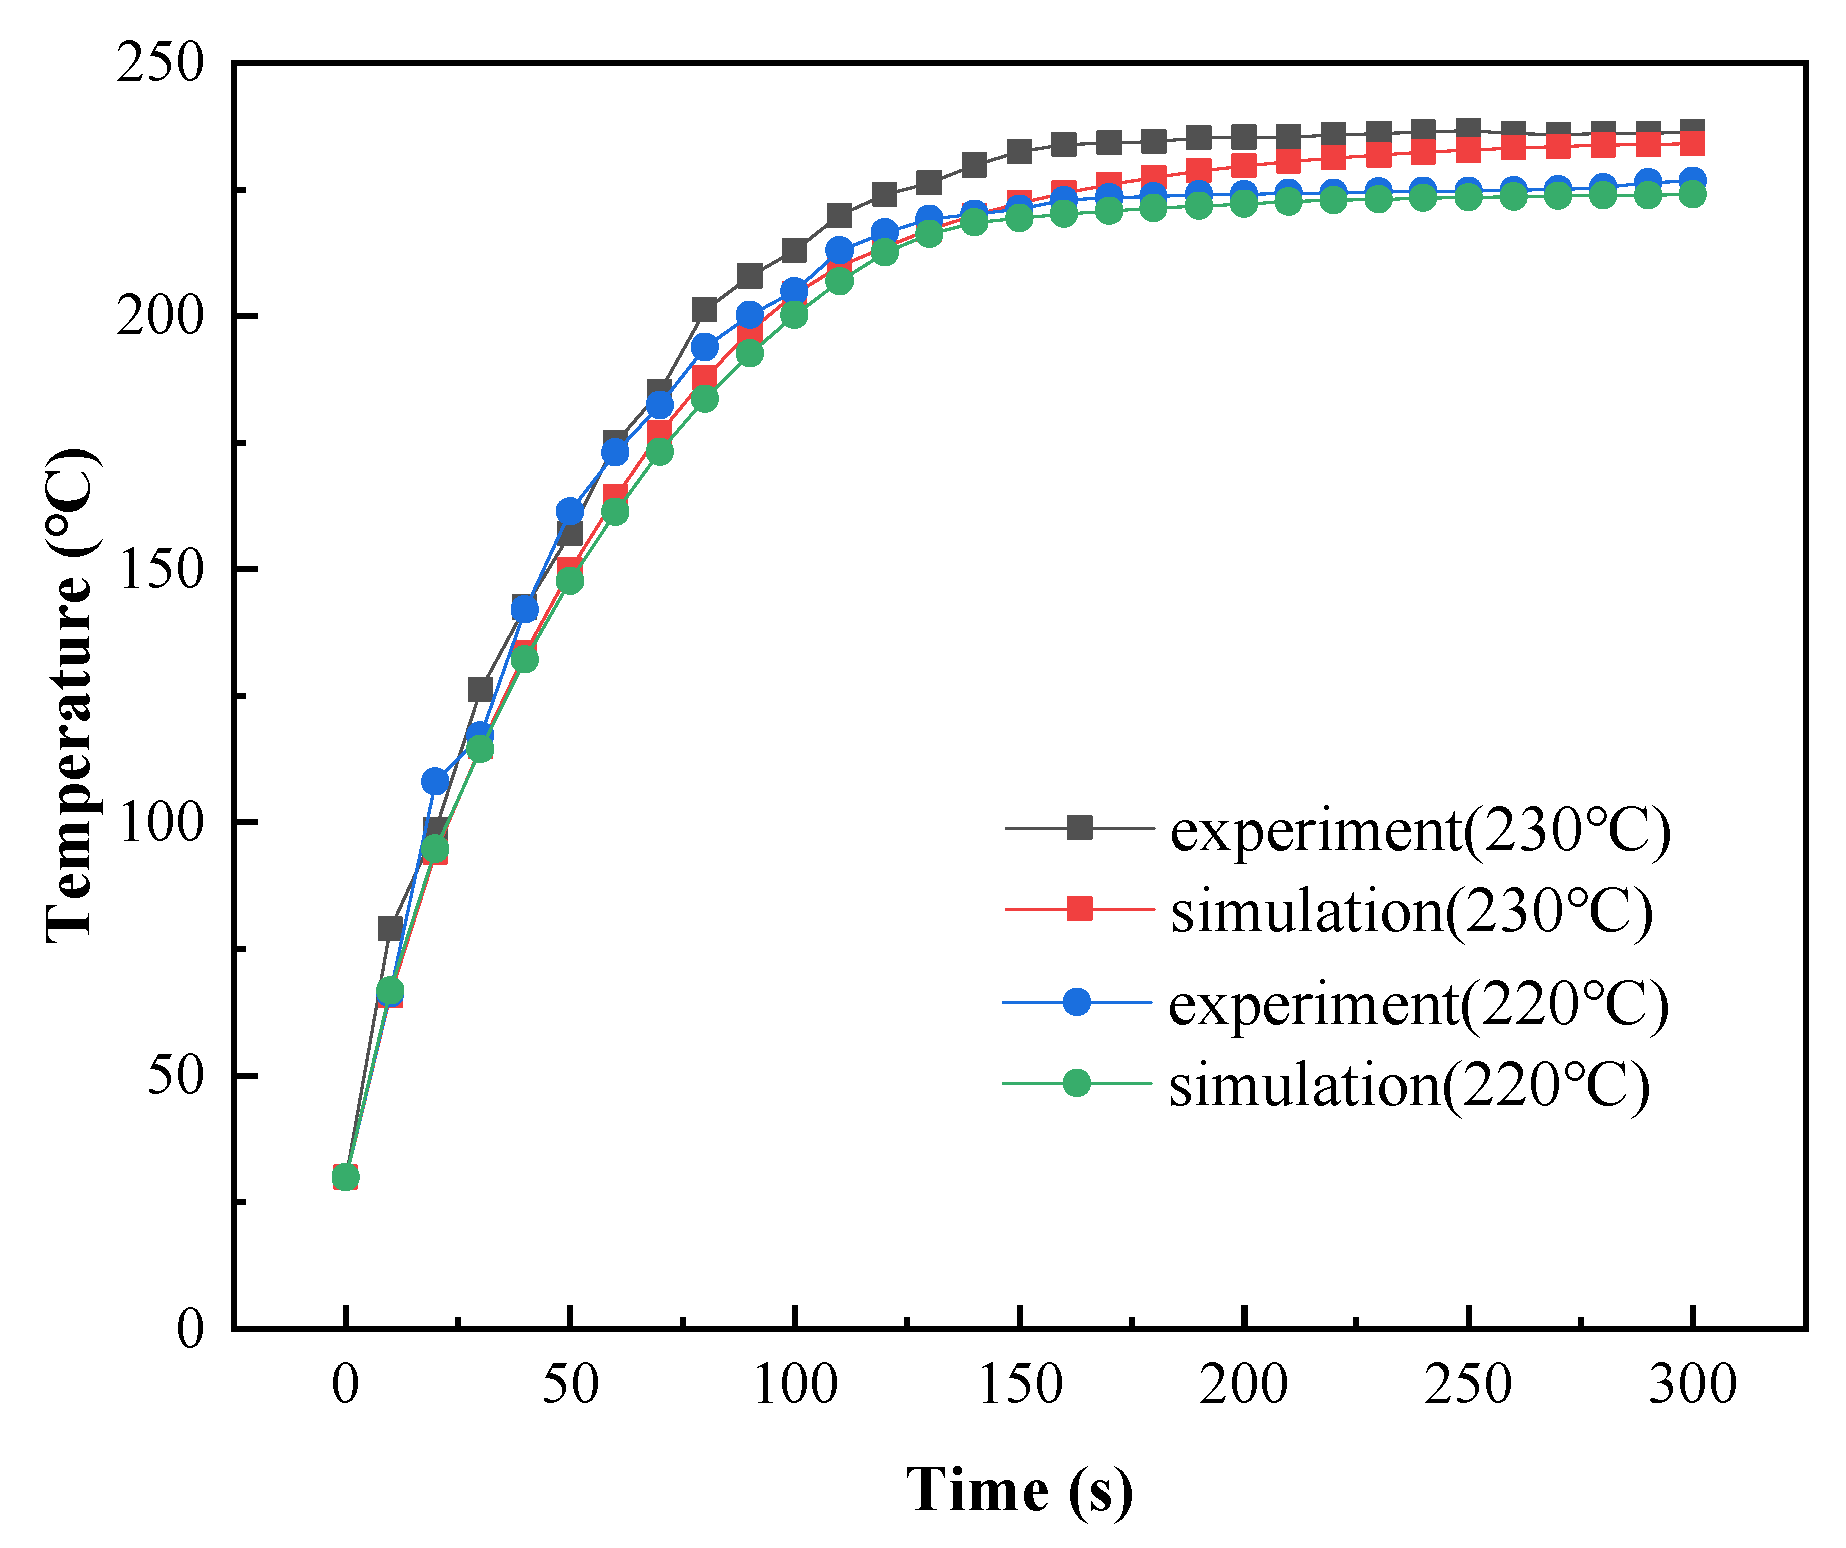
3.4.2. Model Validation
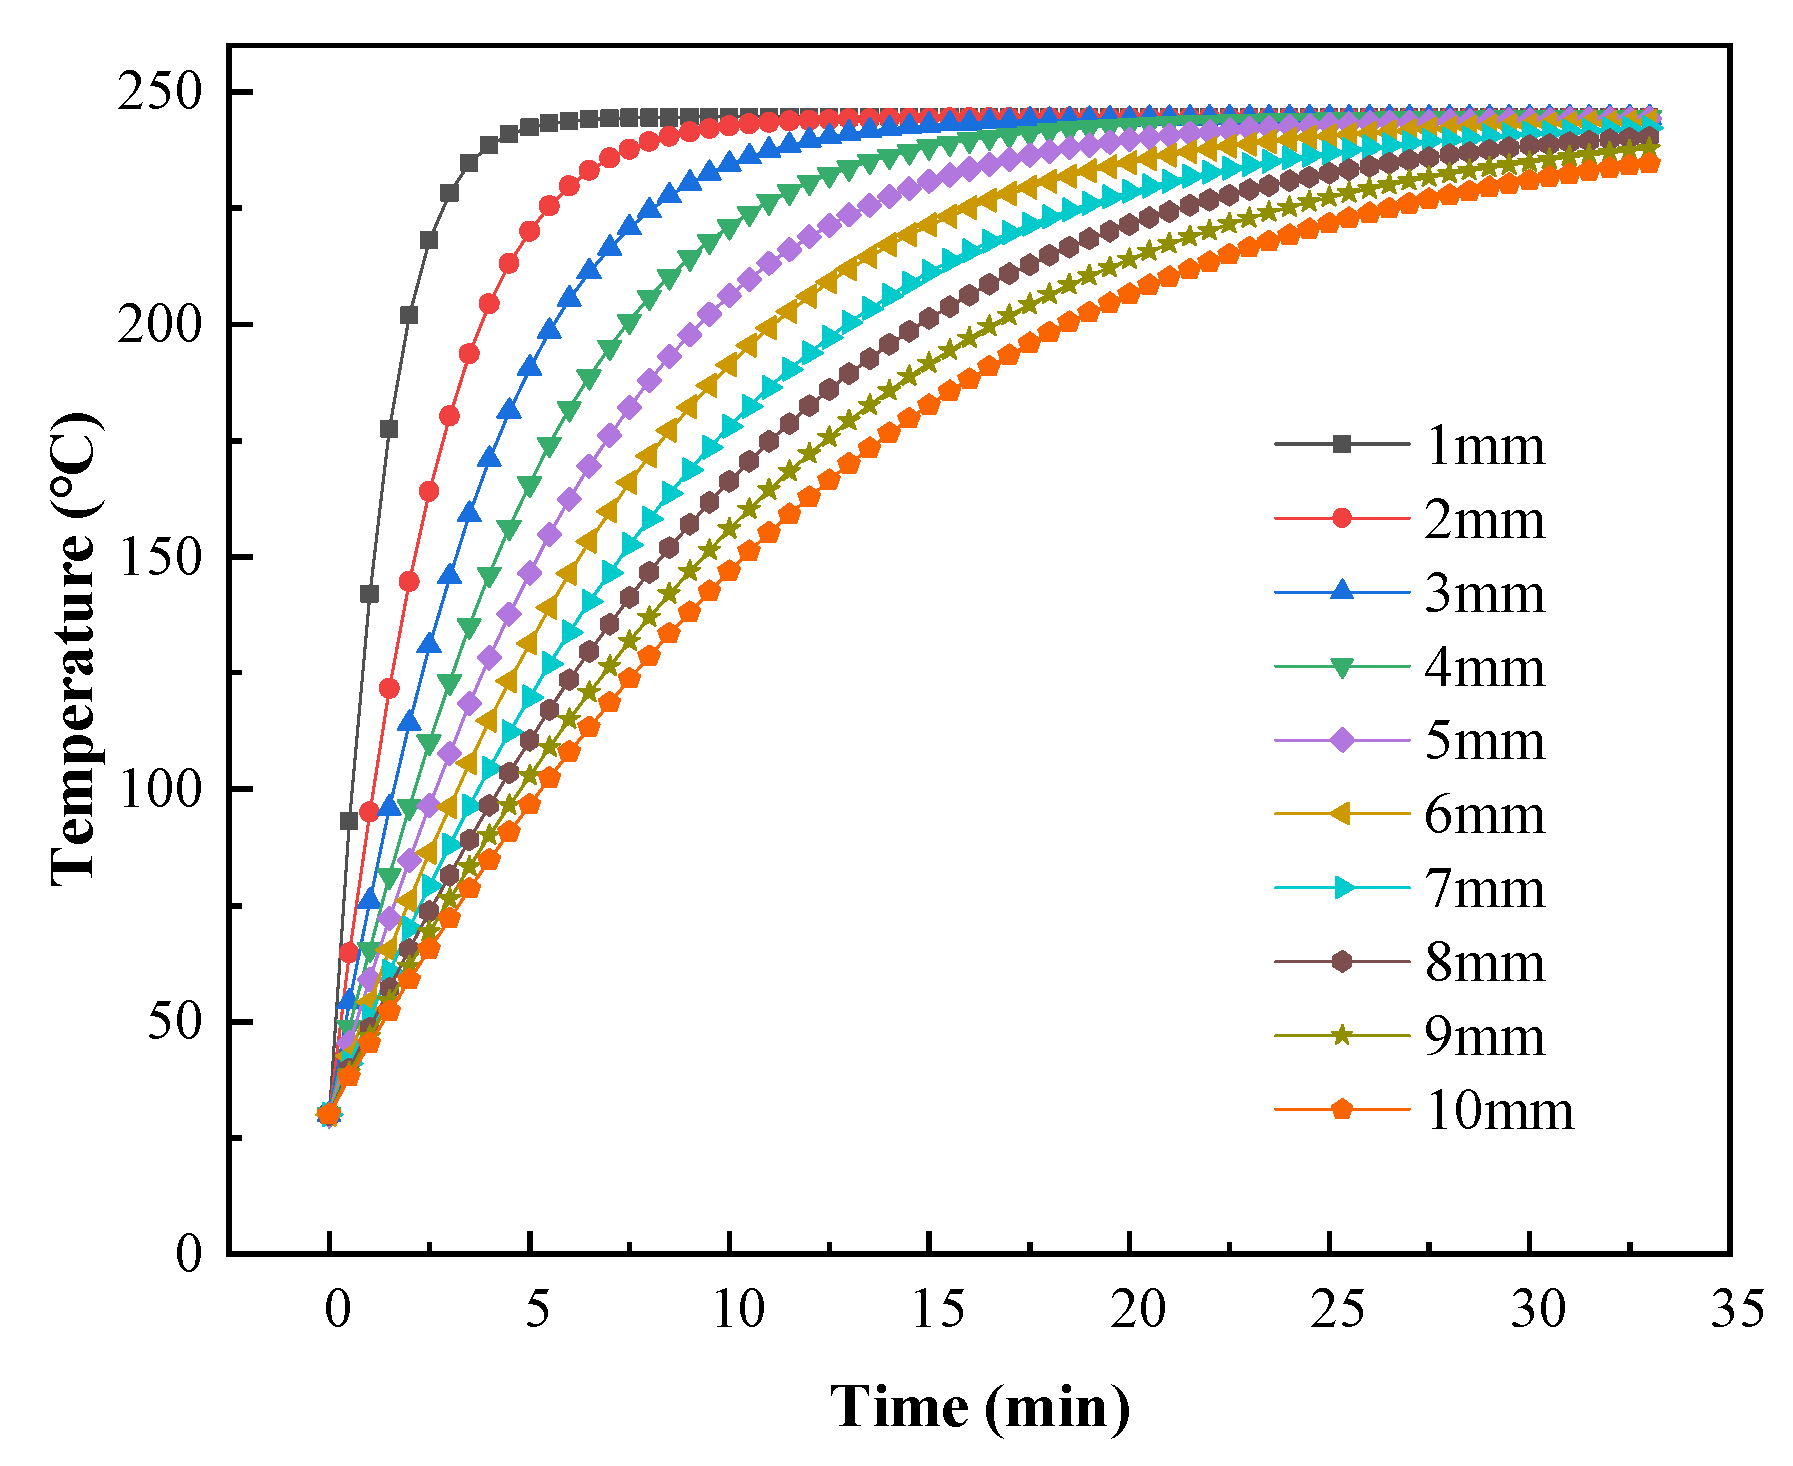
3.5. Simulation Results and Discussion
4. Conclusions
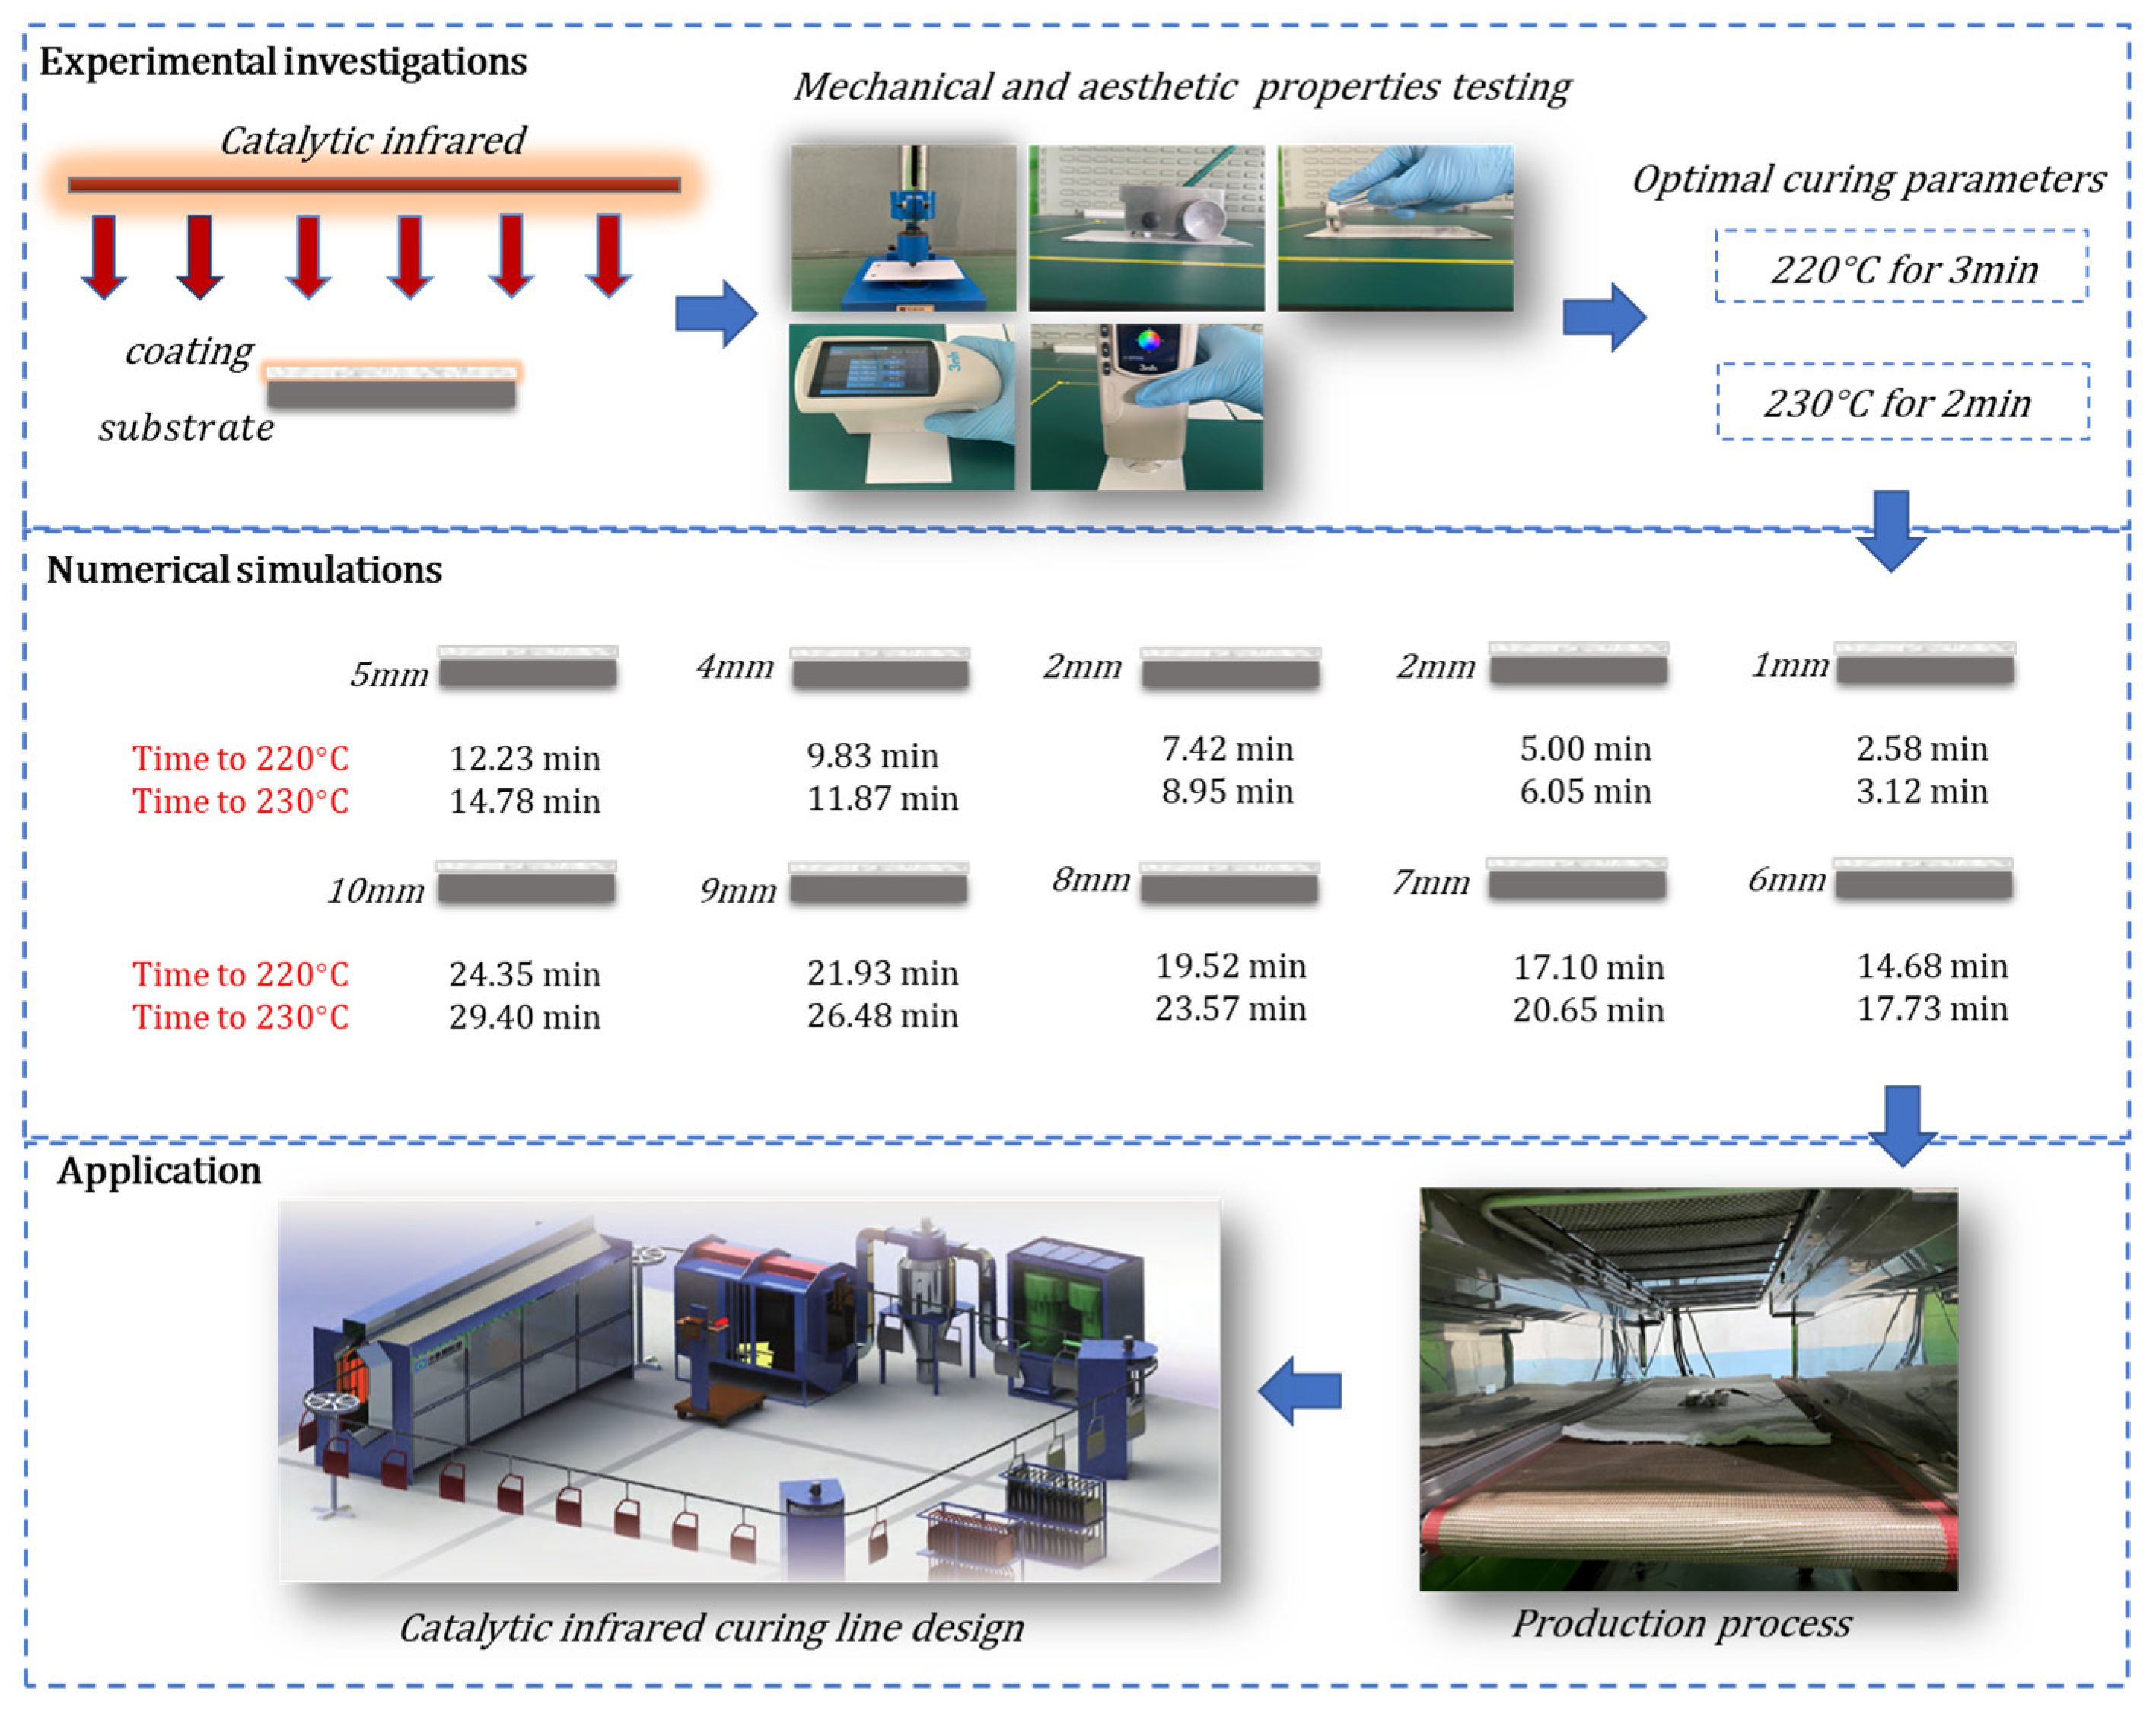
- The maximum surface temperature of the radiation panel was 475 °C, and its infrared wavelength range was 2–25 μm. The infrared absorption wavelengths of most of the functional groups of the polyester/TGIC powder coatings were in this region. Thus, the coatings were quickly cured with catalytic infrared radiation;
- The optimal curing parameters for this catalytic infrared curing process were 230 °C for 2 min and 220 °C for 3 min. The mechanical properties of the coatings became stronger as the temperature and time increased. However, the gloss of the coatings appeared to decrease. When the temperature was too high, the color of the coatings became dark;
- An internal heat source was introduced in the simulation model. This model could accurately predict the temperature change in the coating. The total efficiency was determined to be 0.4;
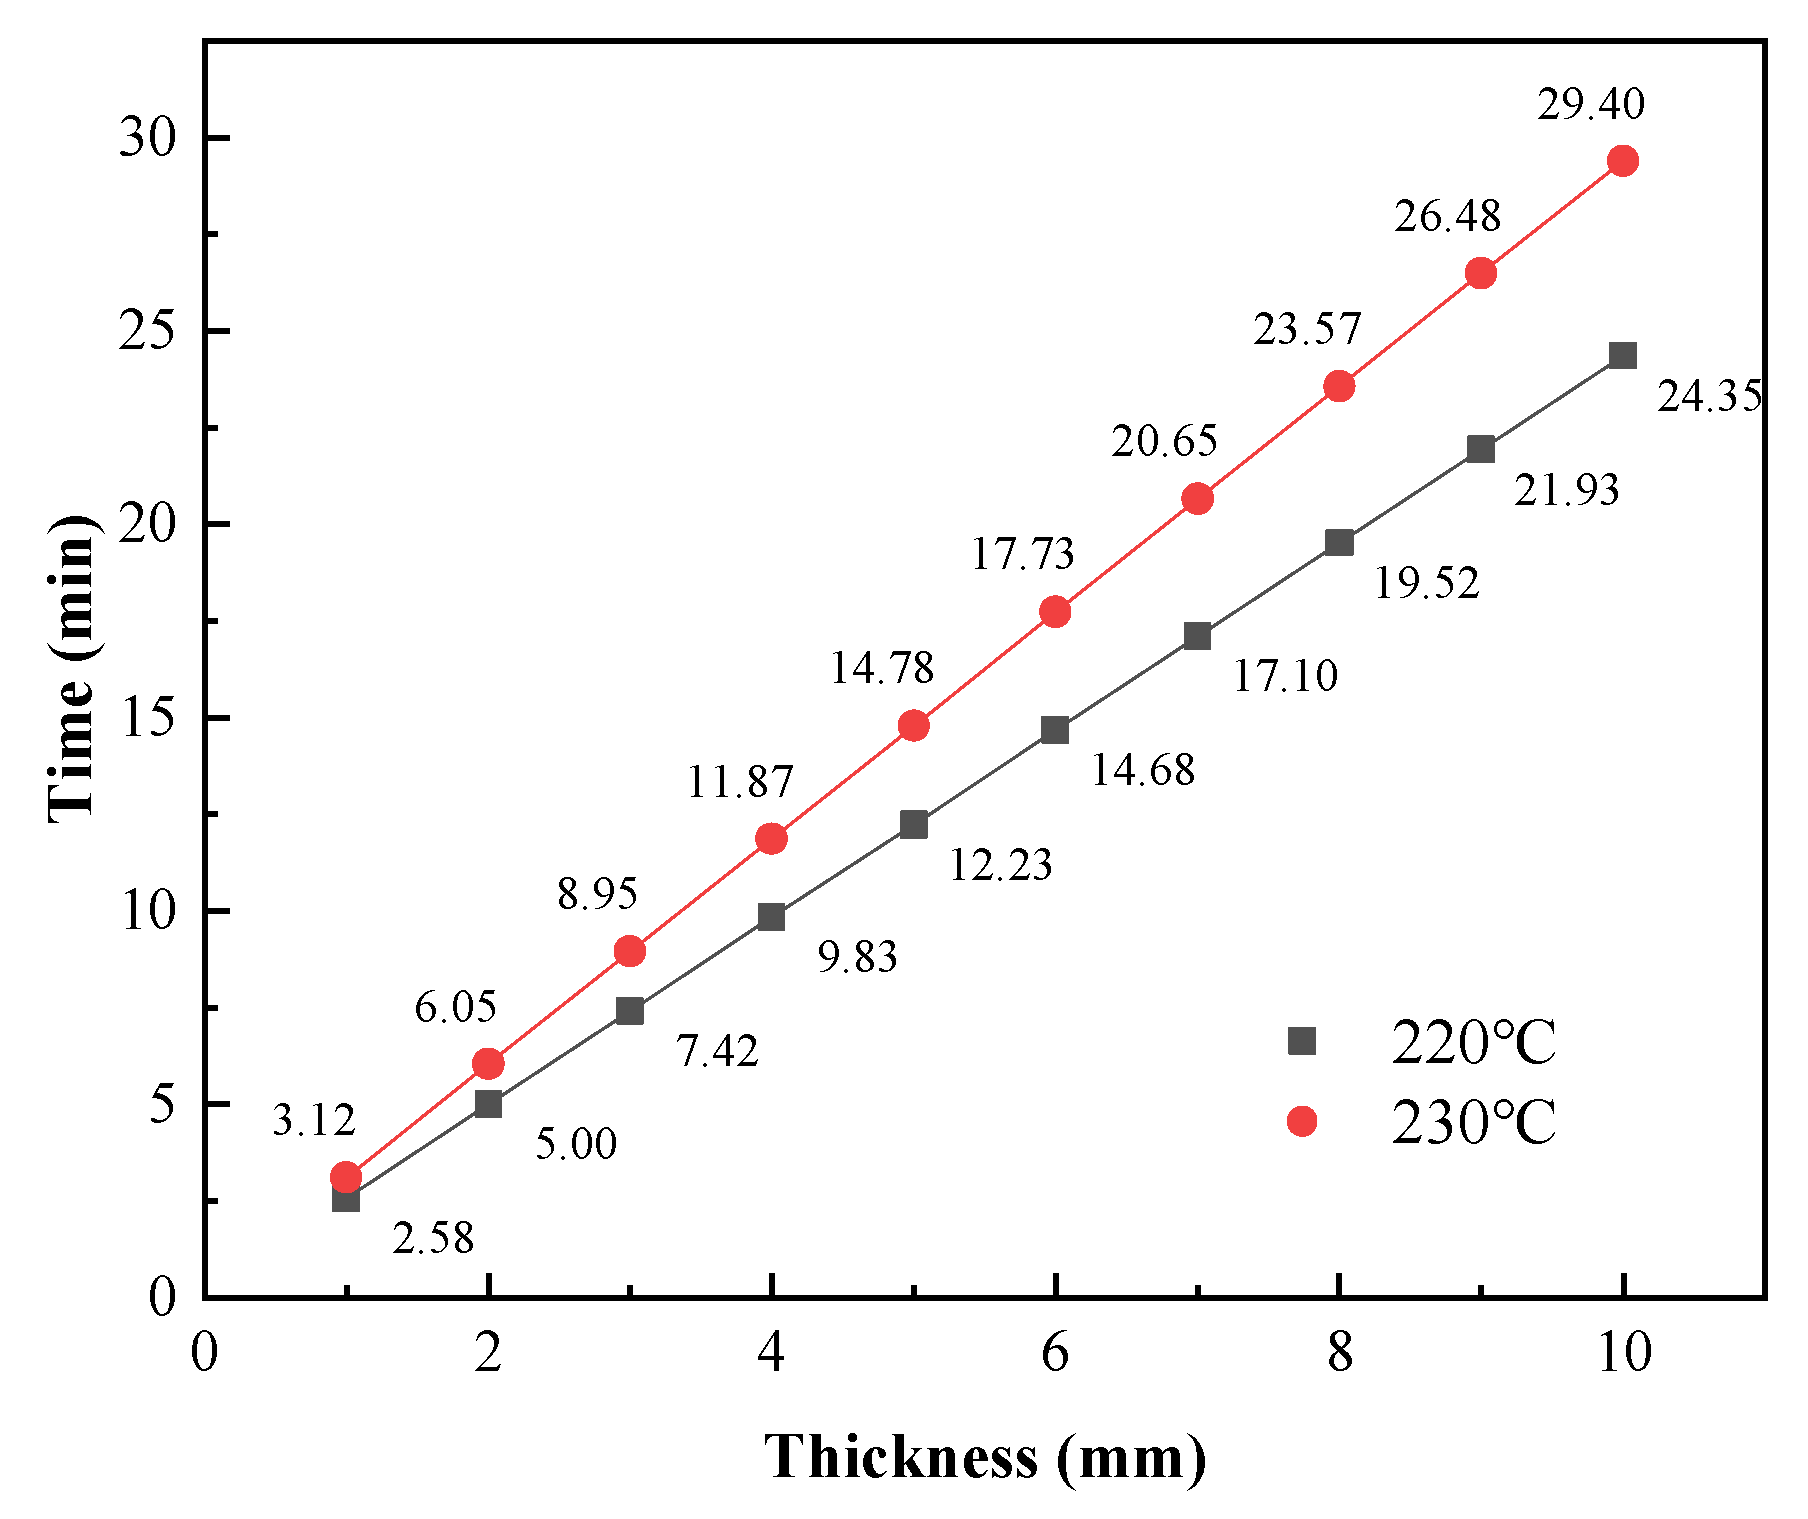
- According to the numerical simulations, when the substrate thickness was 1 mm, the optimal coating curing temperature was 230 °C. For substrate thicknesses ≥ 2 mm, a coating curing temperature of 220 °C was more efficient.
Author Contributions
Funding
Data Availability Statement
Acknowledgments
Conflicts of Interest
Abbreviations
| Powder coating area, m2 | |
| Radiation panel area, m2 | |
| Conversion factor | |
| Specific heat capacity of the paint, J/kg·°C | |
| Specific heat capacity of the substrate, J/kg·°C | |
| The thickness of the paint, mm | |
| The thickness of the substrate, mm | |
| Radiation force of the radiation panel, W/m2 | |
| Convective heat transfer coefficient for the coating, W/m·°C | |
| Convective heat transfer coefficient for the substrate, W/m·°C | |
| Distance between the radiant panel and the coating, m | |
| Infrared radiation absorbed by the powder coating, W/m2 | |
| Convection heat flux between the system and air, W/m2 | |
| Radiation heat flux between the system and environment, W/m2 | |
| Heat released by the exothermic chemical reaction, W/m2 | |
| Heat absorbed by the powder coating, W | |
| The chemical energy of gas, W | |
| Internal heat source, W/m3 | |
| Radiation panel radiation energy, W | |
| Air temperature, °C | |
| , | The temperatures of the upper and lower surfaces, °C |
| Greek symbols | |
| Solid angle, sr | |
| Emissivity | |
| Efficiency | |
| Volume mass, kg·m−3 | |
| Boltzmann constant, W·m−2·K−4 | |
| Subscripts | |
| Chem | Chemical |
| ht | Radiant heat transfer |
| p | Powder coating |
| R | Radiation |
| s | Metallic substrate |
| tot | Total |
References
- Biller, K.; The Powder Coating Research Group. New Advances in Powder Coating Technology. Focus Powder Coat. 2021, 2021, 4–5. [Google Scholar] [CrossRef]
- Ayrilmis, N. A review on electrostatic powder coatings for the furniture industry. Int. J. Adhes. Adhes. 2022, 113, 103062. [Google Scholar] [CrossRef]
- Czachor-Jadacka, D.; Pilch-Pitera, B. Progress in development of UV curable powder coatings. Prog. Org. Coat. 2021, 158, 106355. [Google Scholar] [CrossRef]
- Misev, T.A.; van der Linde, R. Powder coatings technology: New developments at the turn of the century. Prog. Org. Coat. 1998, 34, 160–168. [Google Scholar] [CrossRef]
- Ma, H.; Liu, Y.; Guo, J.; Chai, T.; Suming, J.; Zhou, Y.; Zhong, L.; Deng, J. Synthesis of a novel silica modified environmentally friendly waterborne polyurethane matting coating. Prog. Org. Coat. 2020, 139, 105441. [Google Scholar] [CrossRef]
- Wang, C.; Han, Y.; Wang, W.; Liu, J.; Wang, N.; Hou, B. Polyvinyl chloride/epoxy double layer powder coating enhances coating adhesion and anticorrosion protection of substrate. Prog. Org. Coat. 2021, 158, 106335. [Google Scholar] [CrossRef]
- Puig, M.; Cabedo, L.; Gracenea, J.J.; Jiménez-Morales, A.; Gámez-Pérez, J.; Suay, J.J. Adhesion enhancement of powder coatings on galvanised steel by addition of organo-modified silica particles. Prog. Org. Coat. 2014, 77, 1309–1315. [Google Scholar] [CrossRef]
- Zhang, J.; Kong, G.; Li, S.; Le, Y.; Che, C.; Zhang, S.; Lai, D.; Liao, X. Graphene-reinforced epoxy powder coating to achieve high performance wear and corrosion resistance. J. Mater. Res. Technol. 2022, 20, 4148–4160. [Google Scholar] [CrossRef]
- Jiang, R.; Zou, L.; Bi, H.; Zhang, Q. Research on the preparation of low temperature curing powder coatings. J. Huangshan Univ. 2021, 23, 50–53. (In Chinese) [Google Scholar]
- Devisetti, S.K.; Burcham, L.J.; Macqueen, R.C. Dominant Factors of Gloss Control in Radiation Curable Coatings. 2008. Available online: https://www.radtech.org/proceedings/2008/papers/109.pdf (accessed on 18 October 2021).
- Knischka, R.; Lehmann, U.; Stadler, U.; Mamak, M.; Benkhoff, J. Novel approaches in NIR curing technology. Prog. Org. Coat. 2009, 64, 171–174. [Google Scholar] [CrossRef]
- Kyung, J.P.; Dae, I.W. Development of Infrared Ray Curing Technology at Continuous Coil Coating Line. In Proceedings of the Materials Science Forum 2010; Trans Tech Publications Ltd.: Bäch, Switzerland, 2010; pp. 1819–1822. [Google Scholar]
- Véchot, L.; Bombard, I.; Laurent, P.; Lieto, J. Experimental and modelling study of the radiative curing of a polyester-based coating. Int. J. Therm. Sci. 2006, 45, 86–93. [Google Scholar] [CrossRef]
- Choi, J.W.; Chun, W.P.; Oh, S.H.; Lee, K.J.; Kim, S.I. Experimental studies on a combined near infrared (NIR) curing system with a convective oven. Prog. Org. Coat. 2016, 91, 39–49. [Google Scholar] [CrossRef]
- Mabbett, I.; Elvins, J.; Gowenlock, C.; Glover, C.; Jones, P.; Williams, G.; Worsley, D. Addition of carbon black NIR absorber to galvanised steel primer systems: Influence on NIR cure of polyester melamine topcoats and corrosion protection characteristics. Prog. Org. Coat. 2014, 77, 494–501. [Google Scholar] [CrossRef]
- Ding, C.; Khir, R.; Pan, Z.; Wood, D.F.; Venkitasamy, C.; Tu, K.; El-Mashad, H.; Berrios, J. Influence of infrared drying on storage characteristics of brown rice. Food Chem. 2018, 264, 149–156. [Google Scholar] [CrossRef]
- Ding, C.; Khir, R.; Pan, Z.; Zhao, L.; Tu, K.; El-Mashad, H.; Mchugh, T.H. Improvement in Shelf Life of Rough and Brown Rice Using Infrared Radiation Heating. Food Bioprocess Technol. 2015, 8, 1149–1159. [Google Scholar] [CrossRef]
- Feng, Y.; Wu, B.; Yu, X.; Yagoub, A.E.A.; Sarpong, F.; Zhou, C. Effect of catalytic infrared dry-blanching on the processing and quality characteristics of garlic slices. Food Chem. 2018, 266, 309–316. [Google Scholar] [CrossRef]
- Bröckerhoff, P.; Emonts, B. Use of natural gas in a catalytic radiant burner for low-emission heat production. In Studies in Surface Science and Catalysis; de Pontes, M., Espinoza, R.L., Nicolaides, C.P., Scholtz, J.H., Scurrell, M.S., Eds.; Elsevier: Amsterdam, The Netherlands, 1997; Volume 107, pp. 133–138. [Google Scholar]
- Chen, J.; Arandiyan, H.; Gao, X.; Li, J. Recent Advances in Catalysts for Methane Combustion. Catal. Surv. Asia 2015, 19, 140–171. [Google Scholar] [CrossRef]
- He, L.; Fan, Y.; Bellettre, J.; Yue, J.; Luo, L. A review on catalytic methane combustion at low temperatures: Catalysts, mechanisms, reaction conditions and reactor designs. Renew. Sustain. Energy Rev. 2020, 119, 109589. [Google Scholar] [CrossRef]
- Pfefferle, L.D.; Pfefferle, W.C. Catalysis in Combustion. Catal. Rev. Sci. Eng. 1987, 29, 219–267. [Google Scholar] [CrossRef]
- Pfefferle, W.C. Catalytically-Supported Thermal Combustion. U.S. Patent US 3928961, 30 December 1975. [Google Scholar]
- Defraeye, T. Advanced computational modelling for drying processes—A review. Appl. Energy 2014, 131, 323–344. [Google Scholar] [CrossRef]
- Niamsuwan, S.; Kittisupakorn, P.; Suwatthikul, A. Enhancement of energy efficiency in a paint curing oven via CFD approach: Case study in an air-conditioning plant. Appl. Energy 2015, 156, 465–477. [Google Scholar] [CrossRef]
- Ture, S.A.; Chandramohan, V.P. Effect of radiation heat transfer in convective drying of cranberry: Numerical solutions of one and two dimensional heat and mass transfer and comparison of results. Therm. Sci. Eng. Prog. 2021, 22, 100837. [Google Scholar] [CrossRef]
- Torres, S.S.; Bautista, E.H.; Patiño, M.A.G.; Ramírez, J.R.; Lagunas, L.L.M.; Barriada-Bernal, L.G.; Lamine, H. Numerical simulation of contact vacuum drying of potato slices. Therm. Sci. Eng. Prog. 2022, 33, 101382. [Google Scholar] [CrossRef]
- Güneş, D.; Kükrer, E.; Yıldırım, C. Experimental and computational design improvement assessment of a household toast grill. Therm. Sci. Eng. Prog. 2020, 19, 100609. [Google Scholar] [CrossRef]
- Bombard, I.; Laurent, P.; Lieto, J.; Jeandel, G. A model of the infrared cure of powder coatings based on surface absorptivities in-situ measurements. JCT Res. 2008, 5, 353–363. [Google Scholar] [CrossRef]
- Marold, B.; Funke, W. Determination of the glass transition temperature at polymer surfaces from the temperature dependence of wetting. Prog. Org. Coat. 1994, 23, 287–297. [Google Scholar] [CrossRef]
- Jain, D.; Pathare, P.B. Selection and Evaluation of Thin Layer Drying Models for Infrared Radiative and Convective Drying of Onion Slices. Biosyst. Eng. 2004, 89, 289–296. [Google Scholar] [CrossRef]
- Joshi, R.; Baek, I.; Joshi, R.; Kim, M.S.; Cho, B.-K. Detection of fabricated eggs using Fourier transform infrared (FT-IR) spectroscopy coupled with multivariate classification techniques. Infrared Phys. Technol. 2022, 123, 104163. [Google Scholar] [CrossRef]
- Calvez, I.; Davoudi, S.; Szczepanski, C.R.; Landry, V. Low-gloss UV-curable coatings: Light mechanisms, formulations and processes—A review. Prog. Org. Coat. 2022, 171, 107039. [Google Scholar] [CrossRef]
- Stewart, A.L.; Carr, W.W.; Williamson, V.A. Characterization of infrared absorption by powder coatings on steel panels. J. Coat. Technol. 1999, 71, 71–84. [Google Scholar] [CrossRef]
- Yan, X.; Wang, L. Preparation and Performance of a Waterborne UV/Al Low Infrared Emissivity Coating. Appl. Sci. 2020, 10, 6423. [Google Scholar] [CrossRef]
- Lan, F.; Ding, R.; Tian, Z.; Zhang, H.; Huang, Y.; Xu, G.; Bao, J. Preparation and performance of polyester/epoxy/acrylic resin for low gloss powder coatings. China Plast. Ind. 2020, 48, 24–28. (In Chinese) [Google Scholar] [CrossRef]
- Kögl, D. The curing of powder coatings using gaseous infrared heaters: An analytical model to assess the process thermal efficiency. Int. J. Therm. Sci. 2000, 39, 762–769. [Google Scholar]


| Name | Picture | Model | Range | Precision | Error |
|---|---|---|---|---|---|
| K-Type thermocouple |  | WRNT-01 | −200~500 °C | 0.1 | 0.5% |
| Temperature logger |  | KCM-LCD16 | −30~1300 °C | 0.1 | - |
| Infrared thermometer |  | MS Plus | −32~530 °C | 0.1 | 1% |
| Gloss meter |  | HG60 | 0~300 GU | 0.1 | 0.2% |
| Universal colorimeter |  | NR10QC | L* 0–100 a*, b* −100–100 | 0.01 | 0.03% |
| Index | Value | Unit |
|---|---|---|
| Dimensions | 745 × 395 × 5 | mm |
| Catalyst loading per area | 350 | g/m2 |
| Average diameter | 5 | μm |
| Average particle size | 18 | nm |
| Specific surface area | 150 | m2/g |
| Pore volume | 0.14 | cm3/g |
| Average pore size | 5.25 | nm |
| Elemental content | Pt ≤ 1 wt.%, Al2O3 ≥ 95 wt.%, SiO2 ≤ 4 wt.% | / |
| Ignition temperature | 120 (LPG), 180 (natural gas) | °C |
| Service life | 30,000 | h |
| Index | Parameter |
|---|---|
| Composition | Polyester-based powder coating + triglycidylisocyanurate crosslinker, acrylic acid, barium sulfate, titanium dioxide, pigments, and various additives |
| Average particle size | 34–38 μm |
| Color | White |
| Thermal conductivity (average) | 0.1 W/m·°C |
| Glass transition temperature | 53 °C |
| Curing conditions (hot-air oven) | 200 °C for 10 min and 180 °C for 20 min |
| Storage stability | Below 25 °C; the storage time was 12 months |
| Grade | Area Removed | Cross-Cut Area of Six Parallel Lines |
|---|---|---|
| 5B | None |  |
| 4B | Less than 5% |  |
| 3B | 5–15% |  |
| 2B | 15–35% |  |
| 1B | 35–65% |  |
| 0B | Greater than 65% |  |
| Sr. | Coating Type | Curing Method | Curing Parameter | Ref. |
|---|---|---|---|---|
| 1 | Epoxy resin-modified PVC powder coating | Hot-air oven | 180 °C for 10 min | [6] |
| 2 | Polyester-based powder coating | Hot-air oven | 180 °C for 15 min | [7] |
| 3 | Epoxy powder coating | Hot-air oven | 210 °C for 10 min | [8] |
| 4 | Polyester-based powder coating | Hot-air oven | 150 °C for 15 min | [9] |
| 5 | Polyester/epoxy/acrylic resin powder coating | Hot-air oven | 160 °C for 10 min | [36] |
| 6 | Solvent-blended acrylic resin with an amine crosslinker coating | NIR system | 200 °C/5–15 min | [14] |
| 7 | Polyester-based powder coating | Catalytic infrared | 220 °C for 3 min 230 °C for 2 min | This study |
| Material | Length (mm) | Width (mm) | Thickness (mm) |
|---|---|---|---|
| Coating | 150 | 70 | 0.1 |
| Substrate | 150 | 70 | 1 |
| Material | Thermal Conductivity W/m·°C | Specific Heat Capacity J/kg·°C | Density kg/m3 | |
|---|---|---|---|---|
| Coating | 0.1 | 1500 | 1590 | 0.91 |
| Substrate | 44.5 | 460 | 8237 | 0.92 |
| Time (s) | 40 | 50 | 60 | 70 | 80 | 90 |
| Experimental data (°C) | 143.2 | 159.3 | 176.2 | 185.1 | 196.9 | 207.1 |
| Simulated data (°C) | 132.85 | 148.73 | 162.73 | 175 | 185.68 | 194.93 |
| Relative error (%) | 7.23% | 6.64% | 7.64% | 5.46% | 5.70% | 5.88% |
| Time (s) | 100 | 110 | 120 | 130 | 140 | 150 |
| Experimental data (°C) | 211 | 218.1 | 221.4 | 225.7 | 228.5 | 232.5 |
| Simulated data (°C) | 202.91 | 209.75 | 215.61 | 220.61 | 224.85 | 228.46 |
| Relative error (%) | 3.83% | 3.83% | 2.62% | 2.26% | 1.60% | 1.74% |
Disclaimer/Publisher’s Note: The statements, opinions and data contained in all publications are solely those of the individual author(s) and contributor(s) and not of MDPI and/or the editor(s). MDPI and/or the editor(s) disclaim responsibility for any injury to people or property resulting from any ideas, methods, instructions or products referred to in the content. |
© 2023 by the authors. Licensee MDPI, Basel, Switzerland. This article is an open access article distributed under the terms and conditions of the Creative Commons Attribution (CC BY) license (https://creativecommons.org/licenses/by/4.0/).
Share and Cite
Yuan, Y.; Pan, S.; Wang, T.; Xia, L.; Liu, Y.; Wang, X.; Li, L.; Wang, T. Experimental and Numerical Investigations on Curing a Polyester-Based Powder Coating by Catalytic Infrared Radiation. Appl. Sci. 2023, 13, 2187. https://doi.org/10.3390/app13042187
Yuan Y, Pan S, Wang T, Xia L, Liu Y, Wang X, Li L, Wang T. Experimental and Numerical Investigations on Curing a Polyester-Based Powder Coating by Catalytic Infrared Radiation. Applied Sciences. 2023; 13(4):2187. https://doi.org/10.3390/app13042187
Chicago/Turabian StyleYuan, Yindong, Song Pan, Tongzhao Wang, Liang Xia, Yiqiao Liu, Xinru Wang, Lei Li, and Tian Wang. 2023. "Experimental and Numerical Investigations on Curing a Polyester-Based Powder Coating by Catalytic Infrared Radiation" Applied Sciences 13, no. 4: 2187. https://doi.org/10.3390/app13042187
APA StyleYuan, Y., Pan, S., Wang, T., Xia, L., Liu, Y., Wang, X., Li, L., & Wang, T. (2023). Experimental and Numerical Investigations on Curing a Polyester-Based Powder Coating by Catalytic Infrared Radiation. Applied Sciences, 13(4), 2187. https://doi.org/10.3390/app13042187