Abstract
Feature extraction is a collection of the necessary detailed information from the given source, which holds the information for further analysis. The quality of the fused image depends on many parameters, particularly its directional selectivity and shift-invariance. On the other hand, the traditional wavelet-based transforms produce ringing distortions and artifacts due to poor directionality and shift invariance. The Dual-Tree Complex Wavelet Transforms (DTCWT) combined with Stationary Wavelet Transform (SWT) as a hybrid wavelet fusion algorithm overcomes the deficiencies of the traditional wavelet-based fusion algorithm and preserves the directional and shift invariance properties. The purpose of SWT is to decompose the given source image into approximate and detailed sub-bands. Further, approximate sub-bands of the given source are decomposed with DTCWT. In this extraction, low-frequency components are considered to implement Texture Energy Measures (TEM), and high-frequency components are considered to implement the absolute-maximum fusion rule. For the detailed sub-bands, the absolute-maximum fusion rule is implemented. The texture energy rules have significantly classified the image and improved the output image’s accuracy after fusion. Finally, inverse SWT is applied to generate an extended fused image. Experimental results are evaluated to show that the proposed approach outperforms approaches reported earlier. This paper proposes a fusion method based on SWT, DTCWT, and TEM to address the inherent defects of both the Parameter Adaptive-Dual Channel Pulse coupled neural network (PA-DCPCNN) and Multiscale Transform-Convolutional Sparse Representation (MST-CSR).
Keywords:
multi-focus image fusion (MIF); SWT; DTCWT; TEM; quality evaluation metrics; image quality 1. Introduction
In this digital era, image processing plays a vital role, and it is essential to study the various approaches to it. Initially, texture analysis concentrates on statistical measures of texture measured from the Grey Level Co-occurrence Matrix (GLCM) [1,2]. Texture is one of the visually significant characteristics to enrich the source information for further analysis. Image recognition has many applications, including remote sensing, content-based image representation, automatic inspection of data, and so on. Texture is a feature extraction that identifies structural, geometrical, statistical, and model-based representations [3]. The traditional image fusion approaches include PA-DCPCNN and MST-CSR. The performance of the PA-DCPCNN method is limited due to the inbuilt demerits of the Non-subsampled Contourlet Transform (NSCT) and Pulse Coupled Neural Network (PCNN). The effective fusion rule based on MST-CSR can be developed to achieve better fusion performance. To analyze and characterize the information, wavelets are most widely used. In this proposed method, precise and unified framework activity is constructed along with hybrid wavelets with the combination of SWT [4,5] and DTCWT [6,7,8,9]. Further, for efficient information extraction, texture features are applied [10,11,12]. This procedure for framework activity is described in Section 2.
Several approaches to MIF have been proposed over the years. For example, Mahesh et al. proposed the usage of Spatial Pyramid Zernike Moments (SPZM) and Law’s Textures Feature Set (LTFS)-based facial expression recognition system to describe the patterns of facial region changes for movement in the muzzles of the face. This work is constructed with multilayer perception and feedforward neural networks. An experiment is carried out to demonstrate concatenating feature vectors of facial expression with better accuracy and a low error rate [13]. Ganasala et al. proposed nonsubsampled shearlet transform (NSST) and TEM to extract helpful information that is practical and valuable related to the study of human body structure. In this work, the luminance, in-phase, quadrature (YIQ) colour model is implied for functional information confinement. The visual analysis is done with five quality metrics such as spatial frequency (SF), edge-intensity (EI), mutual information (MI), visual information fidelity (VIF), and structural similarity index measure (SSIM) [14]. In medical imaging, clinical procedures essential to the diagnosis of disease and surgery using image fusion. Medical procedures demand high accuracy. This work is implemented with the combination of SWT and TEM by Ganasala et al. The superiority of the work is proved with the help of fusion quality metrics, and practical analysis tasks are studied [15]. In multi-resolution (MR) fusion, to describe the pattern of an image, Gaussian Markov random fields (GMRF) and Gibbs random fields (GRF) play vital roles in characterizing the texture. This work was implemented with Law’s mask descriptor for MR images and a k-nearest neighborhood classifier for classifying each texture pattern into appropriate classes by Dash et al. [16]. Setiawan et al. concentrate on TEM laws for feature extraction and artificial neural network (ANN) for classification. The superiority of this work is proved by comparing it with other procedures in terms of accuracy [17]. The approaches cited in the literature are compared to the proposed methodology both qualitatively and quantitatively [4,18,19,20,21,22]. From the above literature study, it is identified that the following are weak points: lack of spatial distortion, image blurring, low efficiency of the method, results related to visual and quantitative quality needing improvement, lack of shift-invariance, and poor directional selectivity.
Numerous imaging fusion approaches are now being used in various applications, including security, remote sensing, machine vision, and medical imaging, thanks to recent technological breakthroughs. It is still necessary to investigate a variety of difficulties related to image fusion, specifically in biomedical image fusion. Additionally, a suitable, accurate and consistent fusion technique is needed for the various image types for diverse domains, which should be simple to understand to get better results. In addition, misregistration is a significant problem discovered when fusing images. Hence image fusion solutions must be resilient against unpredictable acquisition conditions or reasonable computing time in real-time systems. The critical idea of the proposed method is to investigate the suitability of the hybrid wavelet transforms using texture energy rules for a wide range of standard test images, including biomedical images. Further, it is well known that in the case of wavelet transform-based methods, the image is transformed into another space (using a transformation function) so that the texture is more easily distinguishable in the new space.
The directional selectivity and shift invariance of the fused image are two factors that significantly impact its quality. As a result of their weak directionality and shift invariance, conventional wavelet-based transforms, on the other hand, result in ringing distortions and aberrations. In order to address the shortcomings of the conventional wavelet-based fusion technique and maintain the directional and shift invariance qualities, the hybrid wavelet fusion algorithm uses DTCWT in combination with SWT. High-frequency components in this extraction are thought to execute the absolute-maximum fusion rule, while low-frequency components are thought to implement TEM. The absolute-maximum fusion rule is applied to the specific sub-bands. The accuracy of the output image after the fusion process is considerably increased by the texture energy rules classification of the image.
The proposed method aims to eliminate distortion for a better-quality fused image. Most multi-focus image fusion (MIF) algorithms suffer from blurring because of low spatial resolution. The SWT and DTCWT used with the TEM method considerably affect composite images. The proposed method successfully improves the quality of fused images by increasing their resolution, decreasing additive noise, minimizing distortion, and preserving edge detail and other important values such as the contrast in high-contrast regions of the image.
The key contributions of the proposed work are as follows:
- Multi-focus images are fused using a hybrid technique, i.e., Hybrid Wavelet with TEM;
- In the case of transform wavelet-based methods, the image is transformed into another space (using a transformation function) so that the texture is more easily distinguishable in the new space;
- The procedure plays a dominating role in the fusion of several source images to create a new image with enhanced quality, directionality, shift invariance, visual quality, and information retention over the source images;
- Using TEM Laws, various image characteristics are extracted. Using these attributes for fusion results in a fused image with much information;
- A process of analysing has been done both quantitatively and qualitatively;
- Feature extraction is more efficient than traditional methodologies.
2. Proposed Fusion Scheme
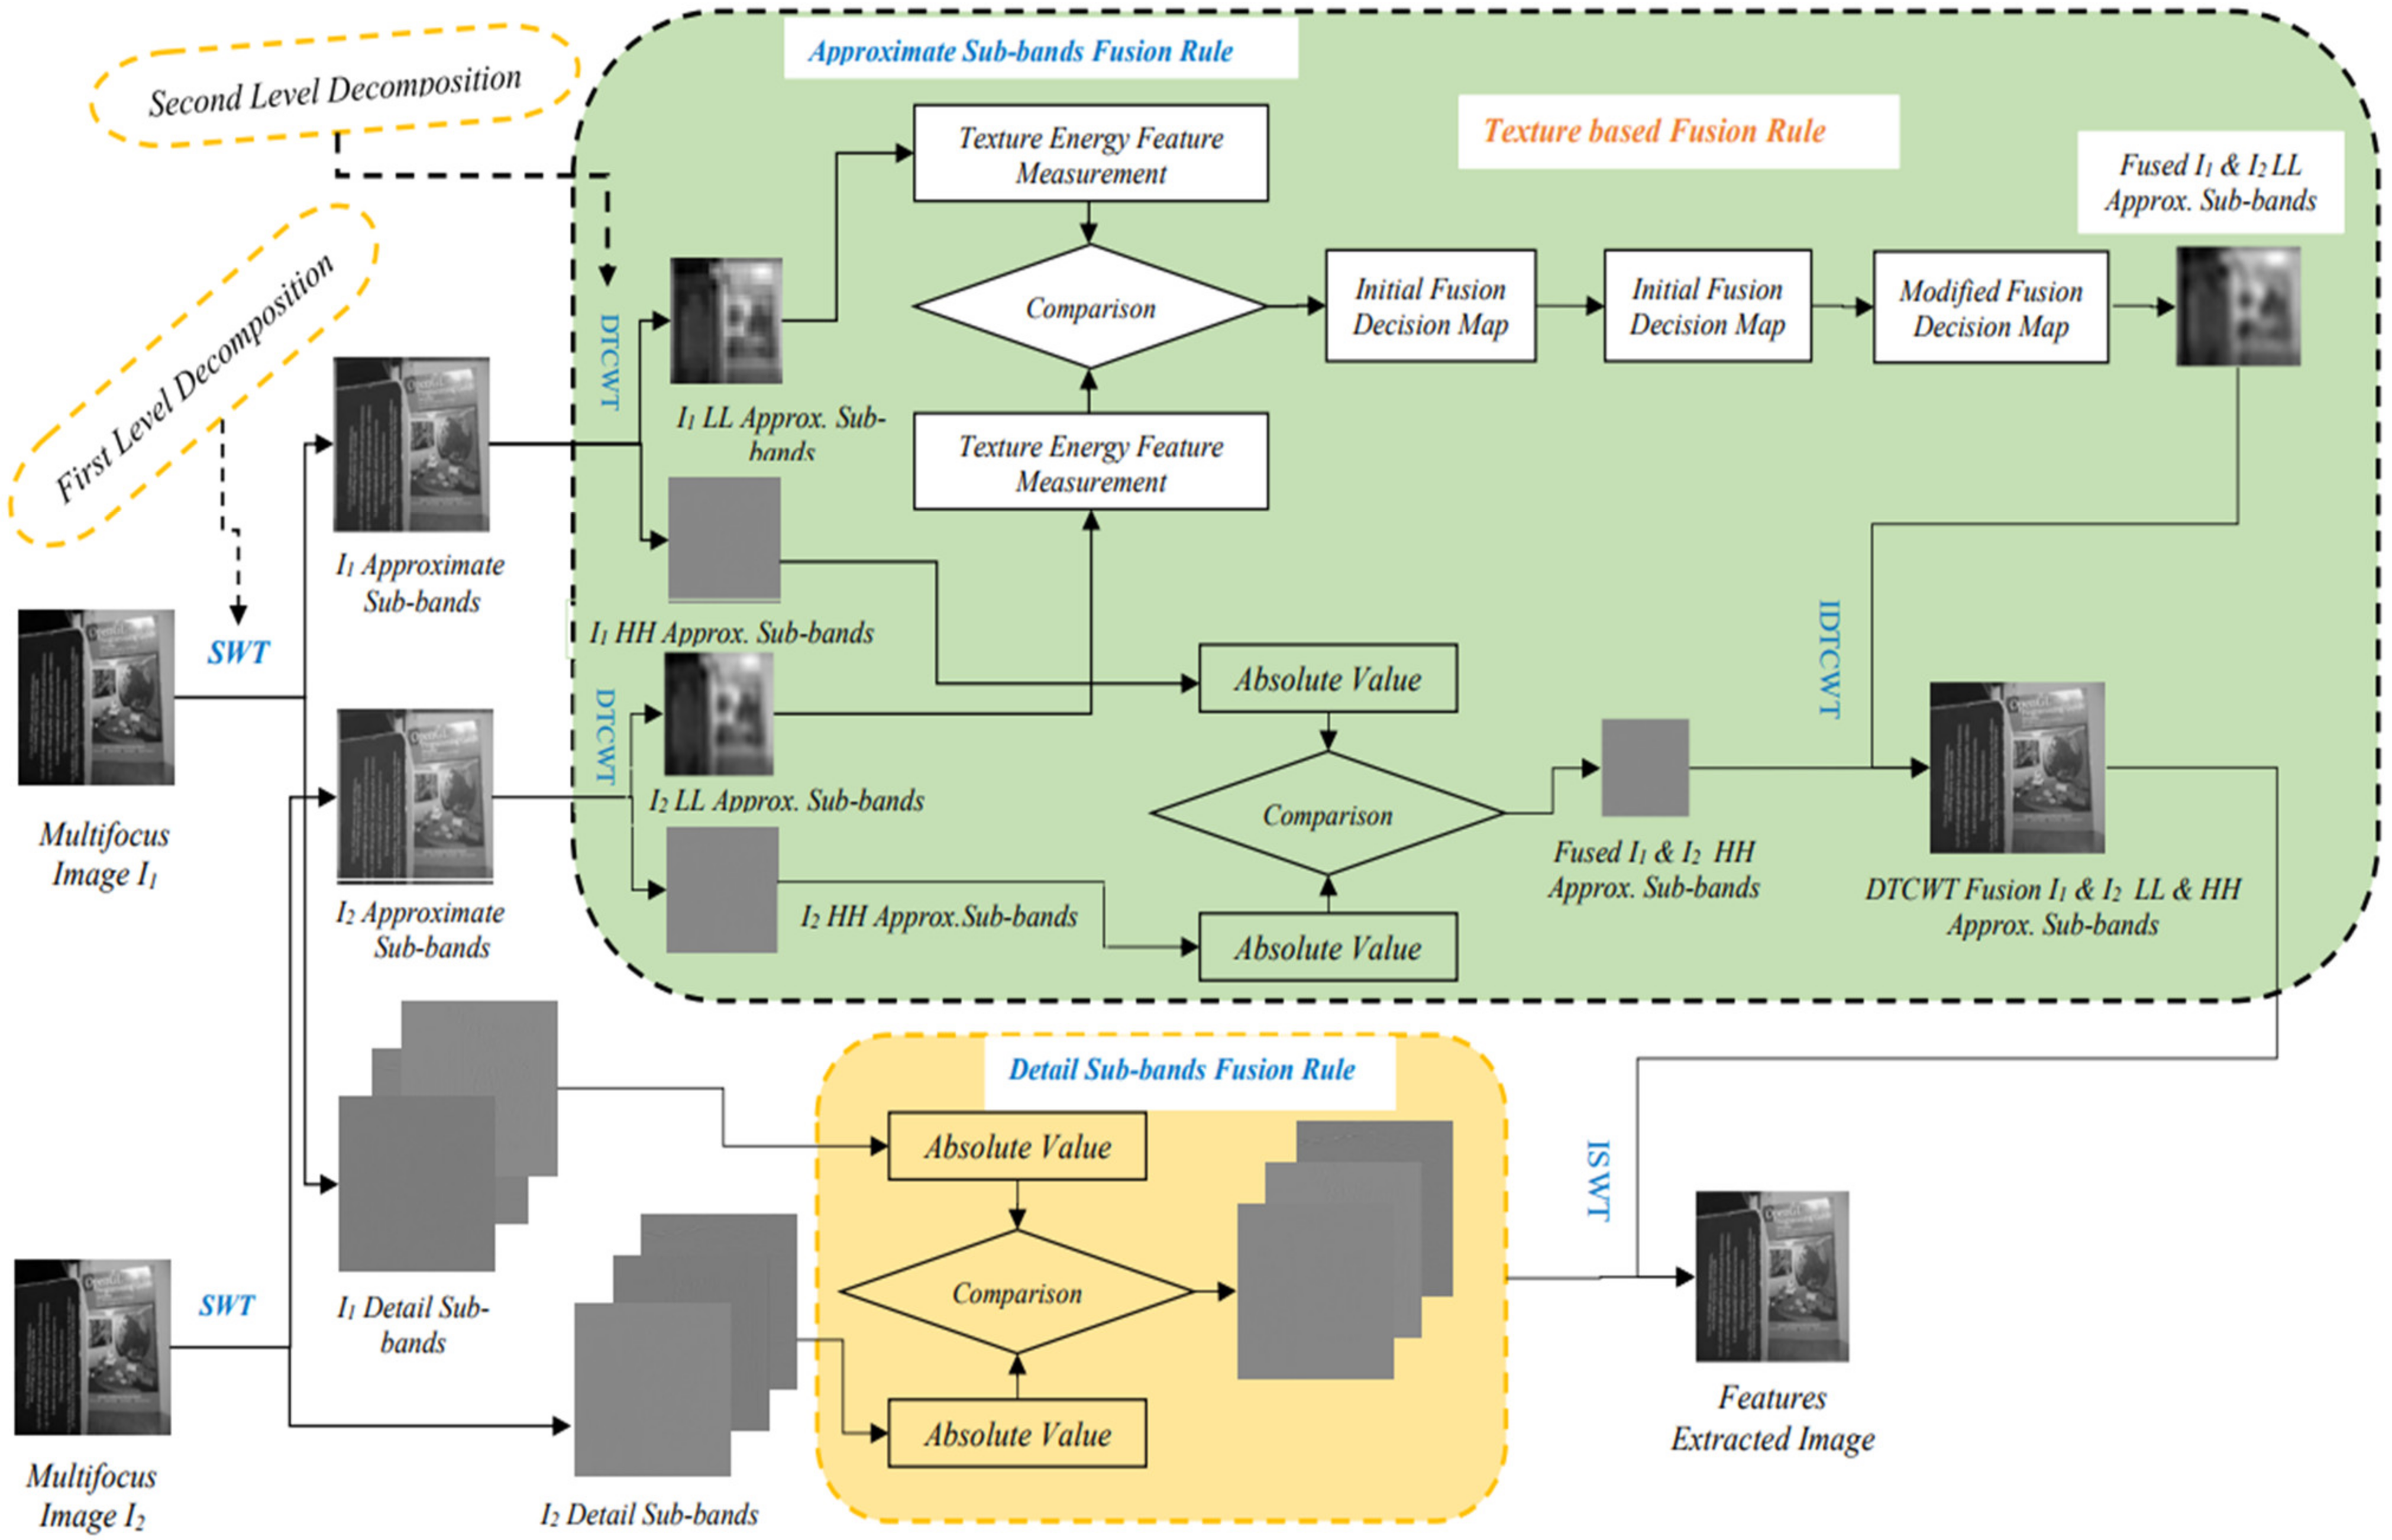
In this work, TEM laws [15] are used to predict the features of the image. The input image data is passed through with SWT [4,5], which quantifies the information into approximate and detailed bands. Subsequently, the approximate information is put into detailed and approximate bands again. Further, TEM laws are applied on the low contrast part of the approximate bands, and the absolute-maximum fusion rule is implemented on approximate bands of DTCWT [6,7,8,9]. Further, the inverse DTCWT procedure is applied to the output of the low contrast part and absolute maximum fusion rule. The absolute-maximum fusion rule is implemented in the case of SWT detailed bands. Further, inverse SWT is applied on the output of detailed sub-bands of SWT and output of IDTCWT to generate the final image, as shown in Algorithm 1. The proposed method can provide both good shift invariance and directional selectivity, enhances the resolution of fused images, eliminates additive noise, and reduces distortion, all of which increase image quality. Figure 1 represents the fusion scheme of the proposed method.
| Algorithm 1: Hybrid Wavelet (i.e., SWT and DTCWT) with laws of TEM |
|
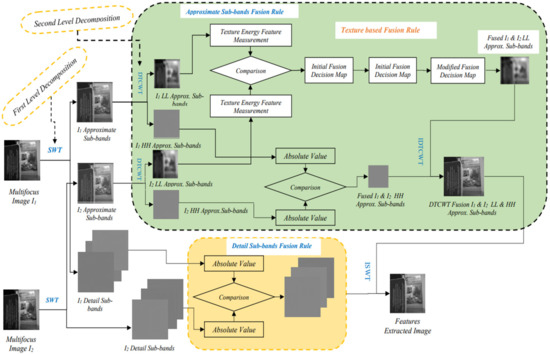
Figure 1.
Hypothesized SWT and D-TCWT with TEM-based image fusion.
The following significant steps of the proposed scheme involve SWT decomposition, DTCWT decomposition, and implementation of TEM, which are discussed in the following subsections.
2.1. Decomposition Procedure Using SWT
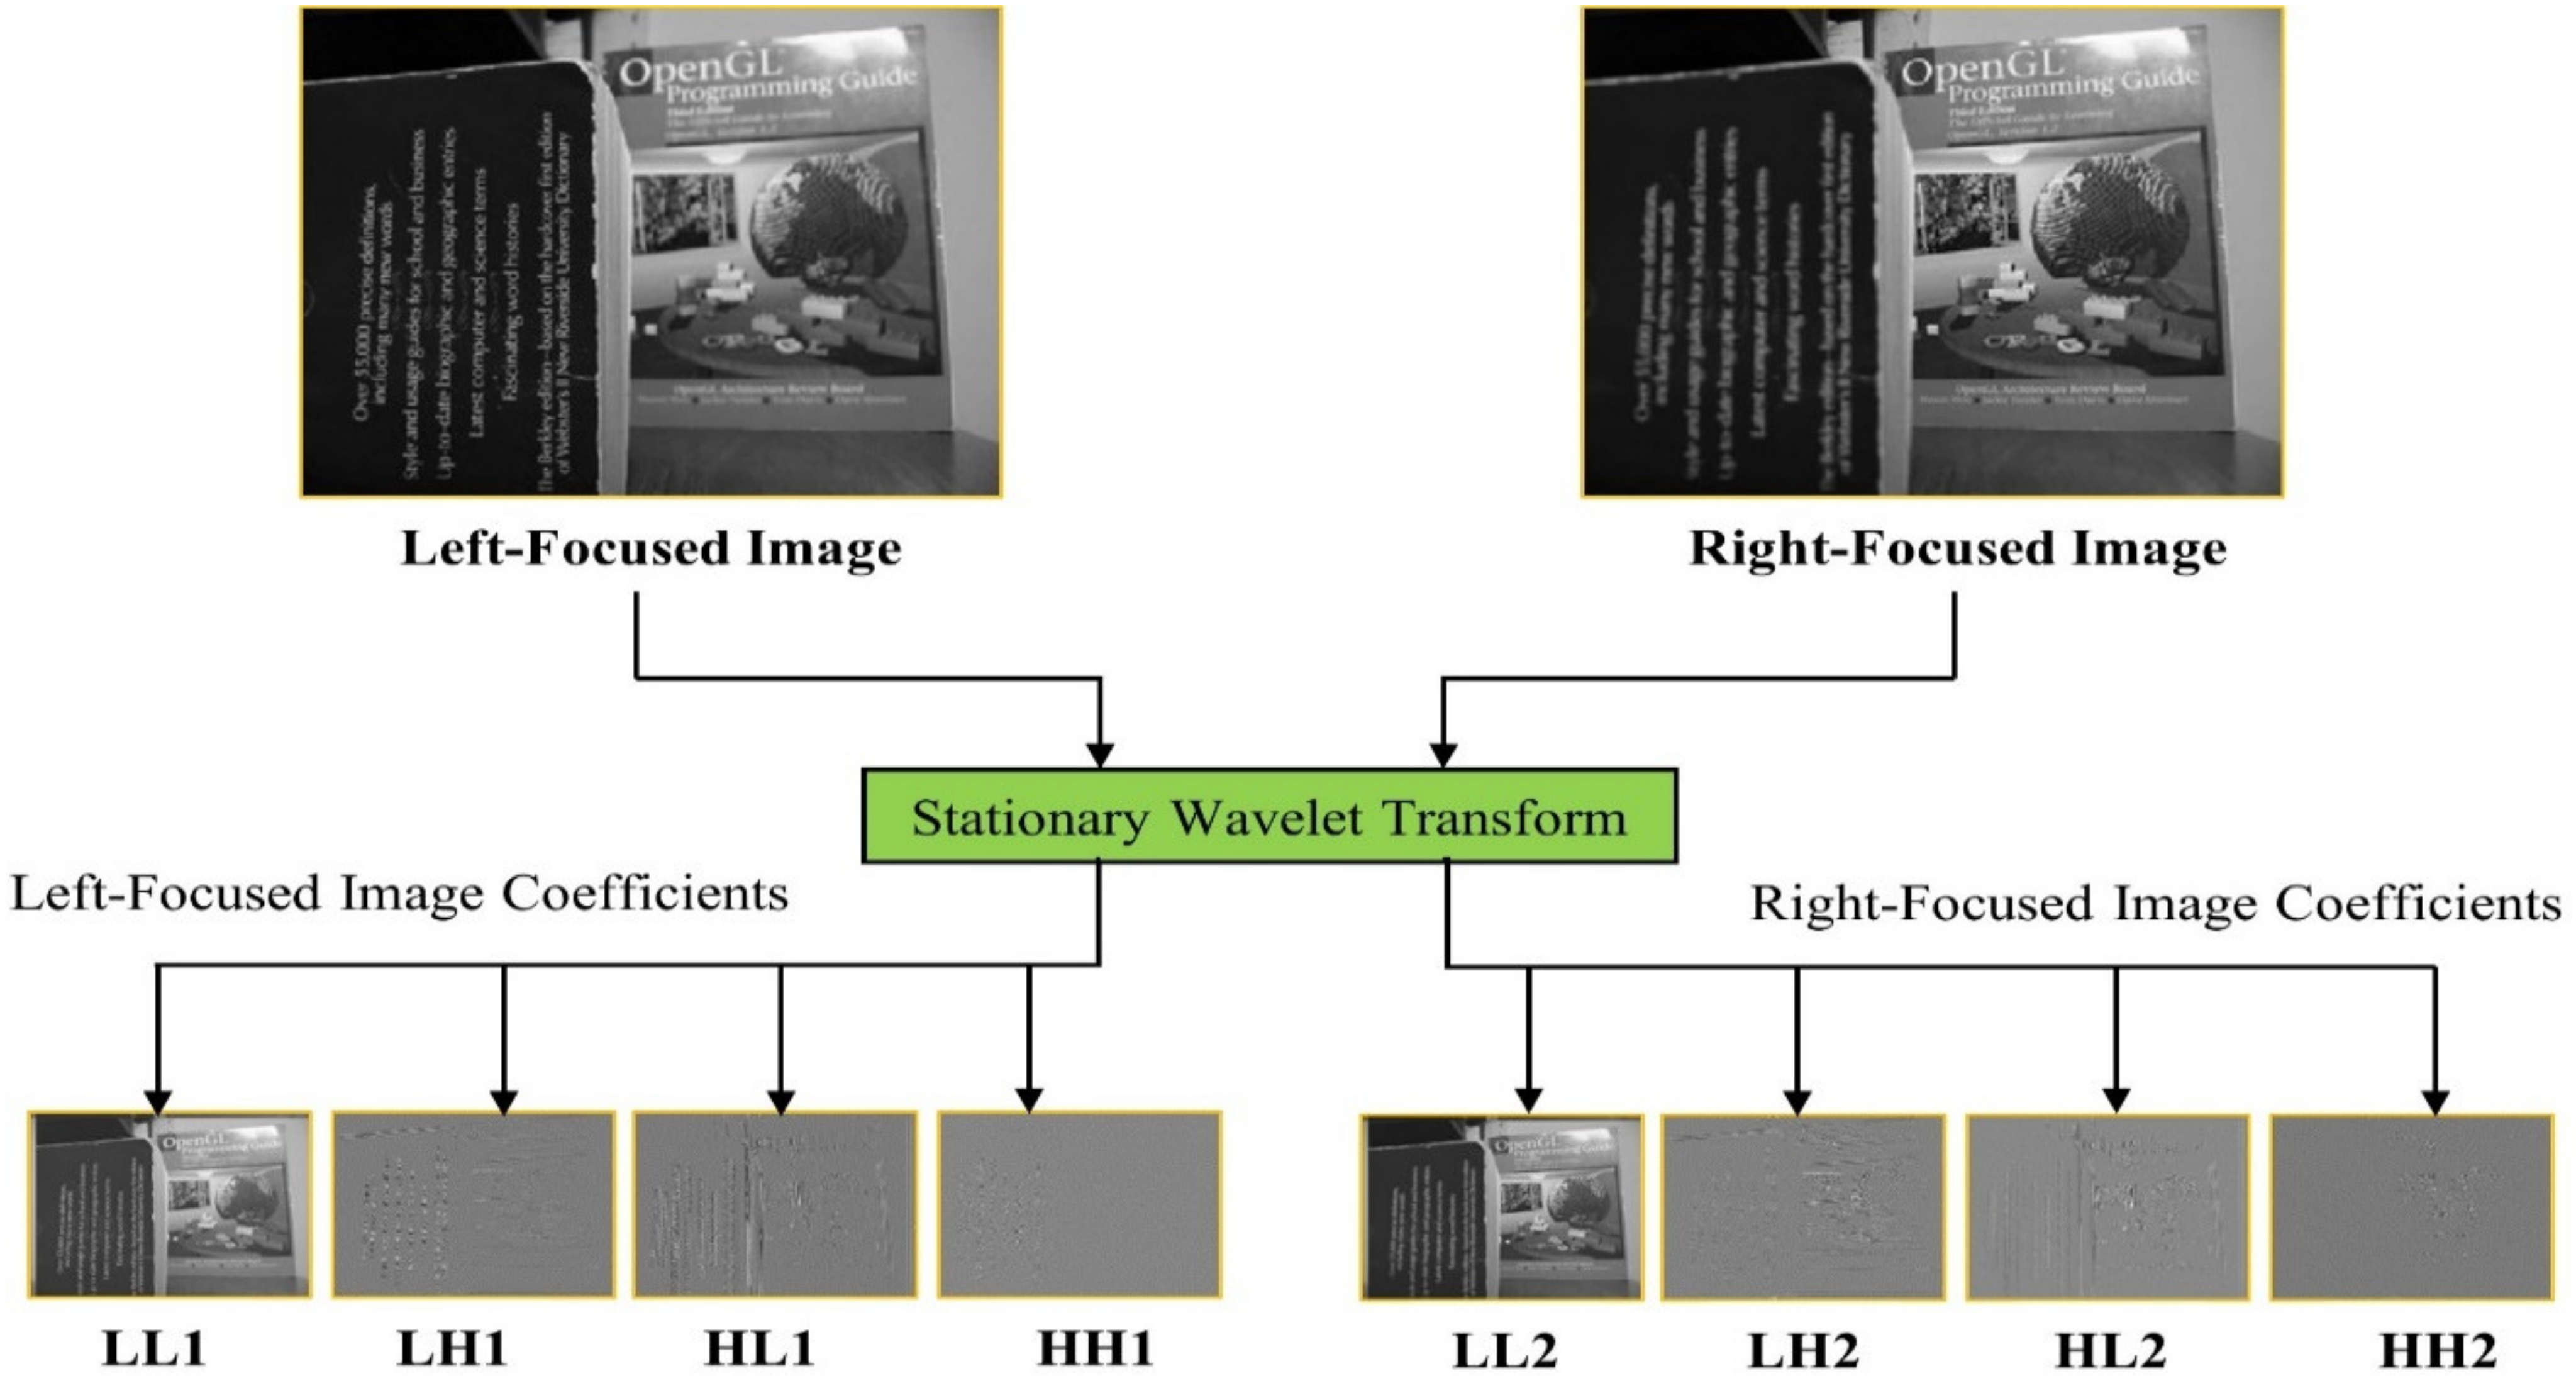
Down-sampling and up-sampling of two primary operations proposed in wavelet transformations. Regarding other wavelet transformations, SWT [4,5] implements an up-sampling procedure that up-samples the filters at each level of decomposition. Instead of down-sampling, it removes odd values. With this procedure, sub-bands are created. The sub-bands of the SWT wavelet have the same size as the source. The second degree of SWT sub-bands is represented by four levels: LL (low-low), LH (low-high), HL (high-low), and HH (high-high). Here, LL is referred to as approximation sub-bands and others are detailed sub-bands. The flow diagram of SWT is represented in Figure 2.
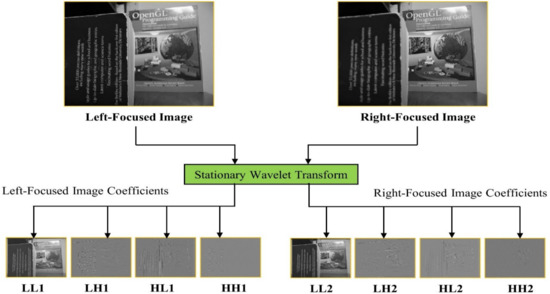
Figure 2.
SWT decomposition structure.
The source image is processed to low and high-pass extracts with SWT to get approximation and detailed coefficients. Ref. [23] illustrates the SWT at the jth level for the source image (M, N).
where r equals 1, 2, 3, 4, … M and c equals 1, 2, 3, 4, … N and the low and high values indicate the low_pass and high_pass extracts. The low-frequency sub-bands at level k + 1 are denoted by the notation Low_LowK+1, while Low_LowK denotes those at level k. Low_HighK+1 represents the signal’s horizontal-detail coefficient, High_LowK+1 represents the signal’s vertical-detail coefficient, and High_HighK+1 represents the signal’s diagonal-detail coefficient. SWT improves shift invariance and low computational time because the algorithm does not need to down-sample. In SWT, filters are applied first to rows and secondly to columns. Due to these advantages, SWT is selected for the proposed method.
2.2. DTCWT Based Decomposition
In this subsection, concerning the base of SWT approximate sub-bands, DTCWT [6,7,8,9] is implemented for further decomposition, decomposing the information into two bands, LL and HH, respectively. TEM laws are applied for the bands of LL, which is discussed in Section 2.3. When implementing the DTCWT, extract the sub = bands using Equation (5).
where stands for the L-level sub-bands at low frequencies (t orientation) and for the H-level sub-bands at high frequencies (d orientation); Low and High are constructed.
2.3. Implementation of TEM Laws for Final Fusion Process
In general, approximate sub-bands consist of much data from a source image. It is essential to transfer this information into a fused image, extracting features such as edges, ripples, waves, and sparks [15]. The following three primary vectors are used. , , . With these three vectors, nine convolution matrixes are listed as follows:
The mask of matrix1 is non-zero-sum, and the remaining are zero-sum. The mask matrix1 produces average energy. matrix2 and matrix3 produce first and second-order vertical edges. matrix6 gives horizontal edges. matrix4 refers to waves. matrix5, matrix7, and matrix9 represents ripples. The proposed image fusion process uses 3 × 3 masks, providing the fused image with detailed information. Using these 3 × 3 texture masks, the coefficient saliency measurement for the approximation sub-band is created. Assume that ASX represents the source image X’s approximate sub-band. Further, TEM, represented as TEM1 to TEM9, relates to convolution matrices: matrix1 to matrix9 are used in the following Equations (15)–(23).
The convolution matrix1 should be applied on the approximate sub-band corresponding block; the result is stored in the TEM1(r, c). Similarly, the remaining convolution matrices will be applied to the corresponding blocks of approximate sub-bands.
Absolute values of TEMs are evaluated by using the following formula. Let the normalized TEMs be NTEMX1, NTEMX2, NTEMX3, NTEMX4, NTEMX5, NTEMX6, NTEMX7, NTEMX8, NTEMX9
Saliency of approximate sub-bands is calculated using Equation (25).
In a similar way, the saliency measure SASY is determined for the approximate sub-bands ASY of the original image Y. The first fusion decision map (DM) is gathered by comparing the saliency values of the two source images at each position. Fusion decision maps for saliency measures are initially developed as
A structural element (SE), which fills in any minor gaps smaller than the SE, is used to perform additional morphological operations in closed as well as open procedures. Given in Equation (27), it is indicated by CD. The action of closing an image is denoted by the symbol “●”, and on a closed decision map, the morphological opening operation is carried out to remove any tiny white items that are smaller than the SE. OD, as given in Equation (28), designates the decision map that results. The picture closure action is represented by the operator “o” in this case.
CD = DM●SE
OD = CD o SE
Isolated white patches are removed by using the following Equation (29).
AD = bwareaopen (OD, N)
In order to eliminate black patches, the following Equation (30) is used
FD = bwareaclose (AD, N)
Finally, approximate coefficients fused information is represented by using Equation (31).
In the case of the detailed sub-band rule, fused information is obtained by using the following Equation (32).
2.4. Measuring the Performance of the Proposed Method
In this section, the proposed strategy’s effectiveness is evaluated subjectively and objectively compared to state-of-the-art approaches. The qualitative evaluation of the visual quality of the fused image is referred to as the subjective assessment. On the other hand, comparing the results of several image fusion efficiency measures is how objective evaluation, also known as quantitative evaluation, is carried out. This quantitative approach, known as objective analysis, is based on mathematical modeling. It assesses the spectral and spatial similarity of the fused image to the input images. There are two approaches to conducting quantitative analysis: with or without a reference image [24]. In this paper, the proposed fusion method experiments are conducted with and without reference images.
In this study, a total of eighteen well-known metrics, including entropy (E(F)) [20,24,25], average-gradient (AG) [20,25], correlation-coefficient (CC) [20,24,25], total-fusion-performance (QAB/F) [20,25], structural-similarity (SSIM) [20,24,26], edge-dependent-fusion-quality (QE) [20,27], standard-deviation (SD) [24,25], spatial-frequency (SF) [24,25], weighted-fusion-quality (Qw) [28], Feature-Mutual-Information (FMI) [24], Fusion-Loss (LAB/F) [25], Fusion-Artifacts (NAB/F) [25], Root-Mean-Square-Error (RMSE) [24], Peak-Signal-to-Noise-Ratio (PSNR) [24], Edge-Intensity (EI) [27], Gray-Mean-Value (GM) [29,30], Image-Definition (ID) [29,31], Percentage-Fit-Error (PFE) [24], and UIQI (Q0) [29,32] are used to assess the interpretations of dissimilar fusion approaches quantitatively.
3. Experimental Results
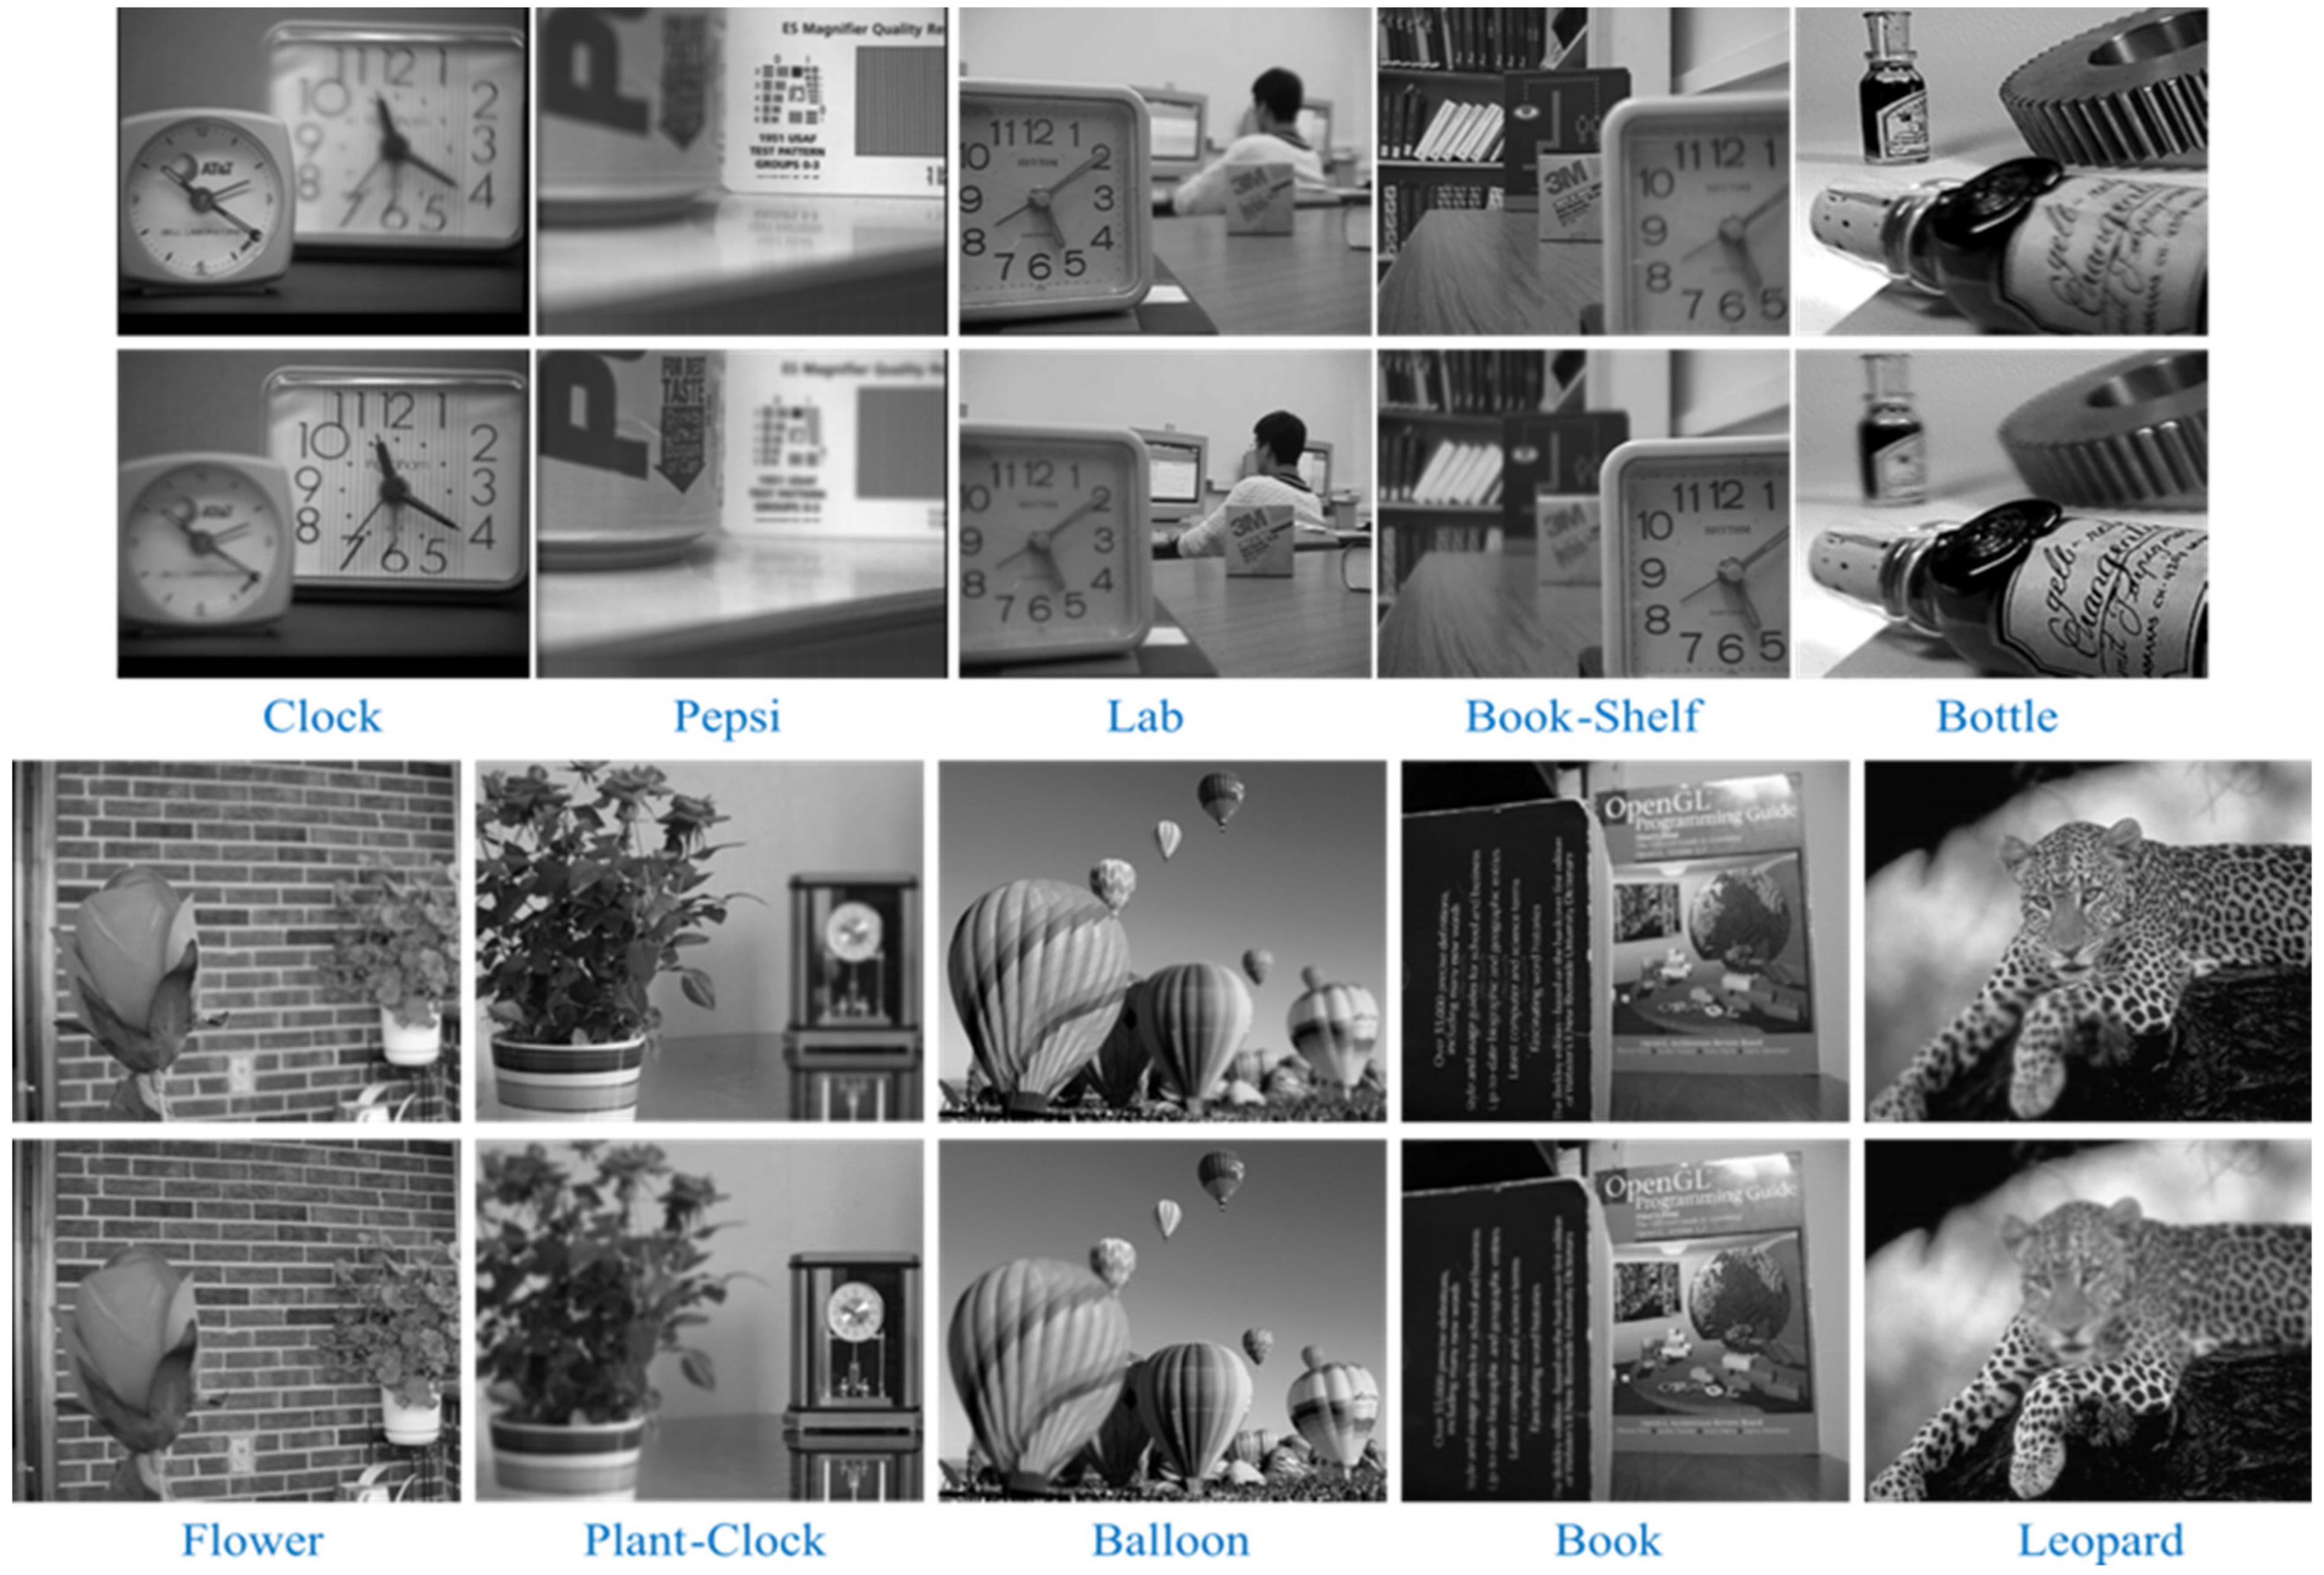
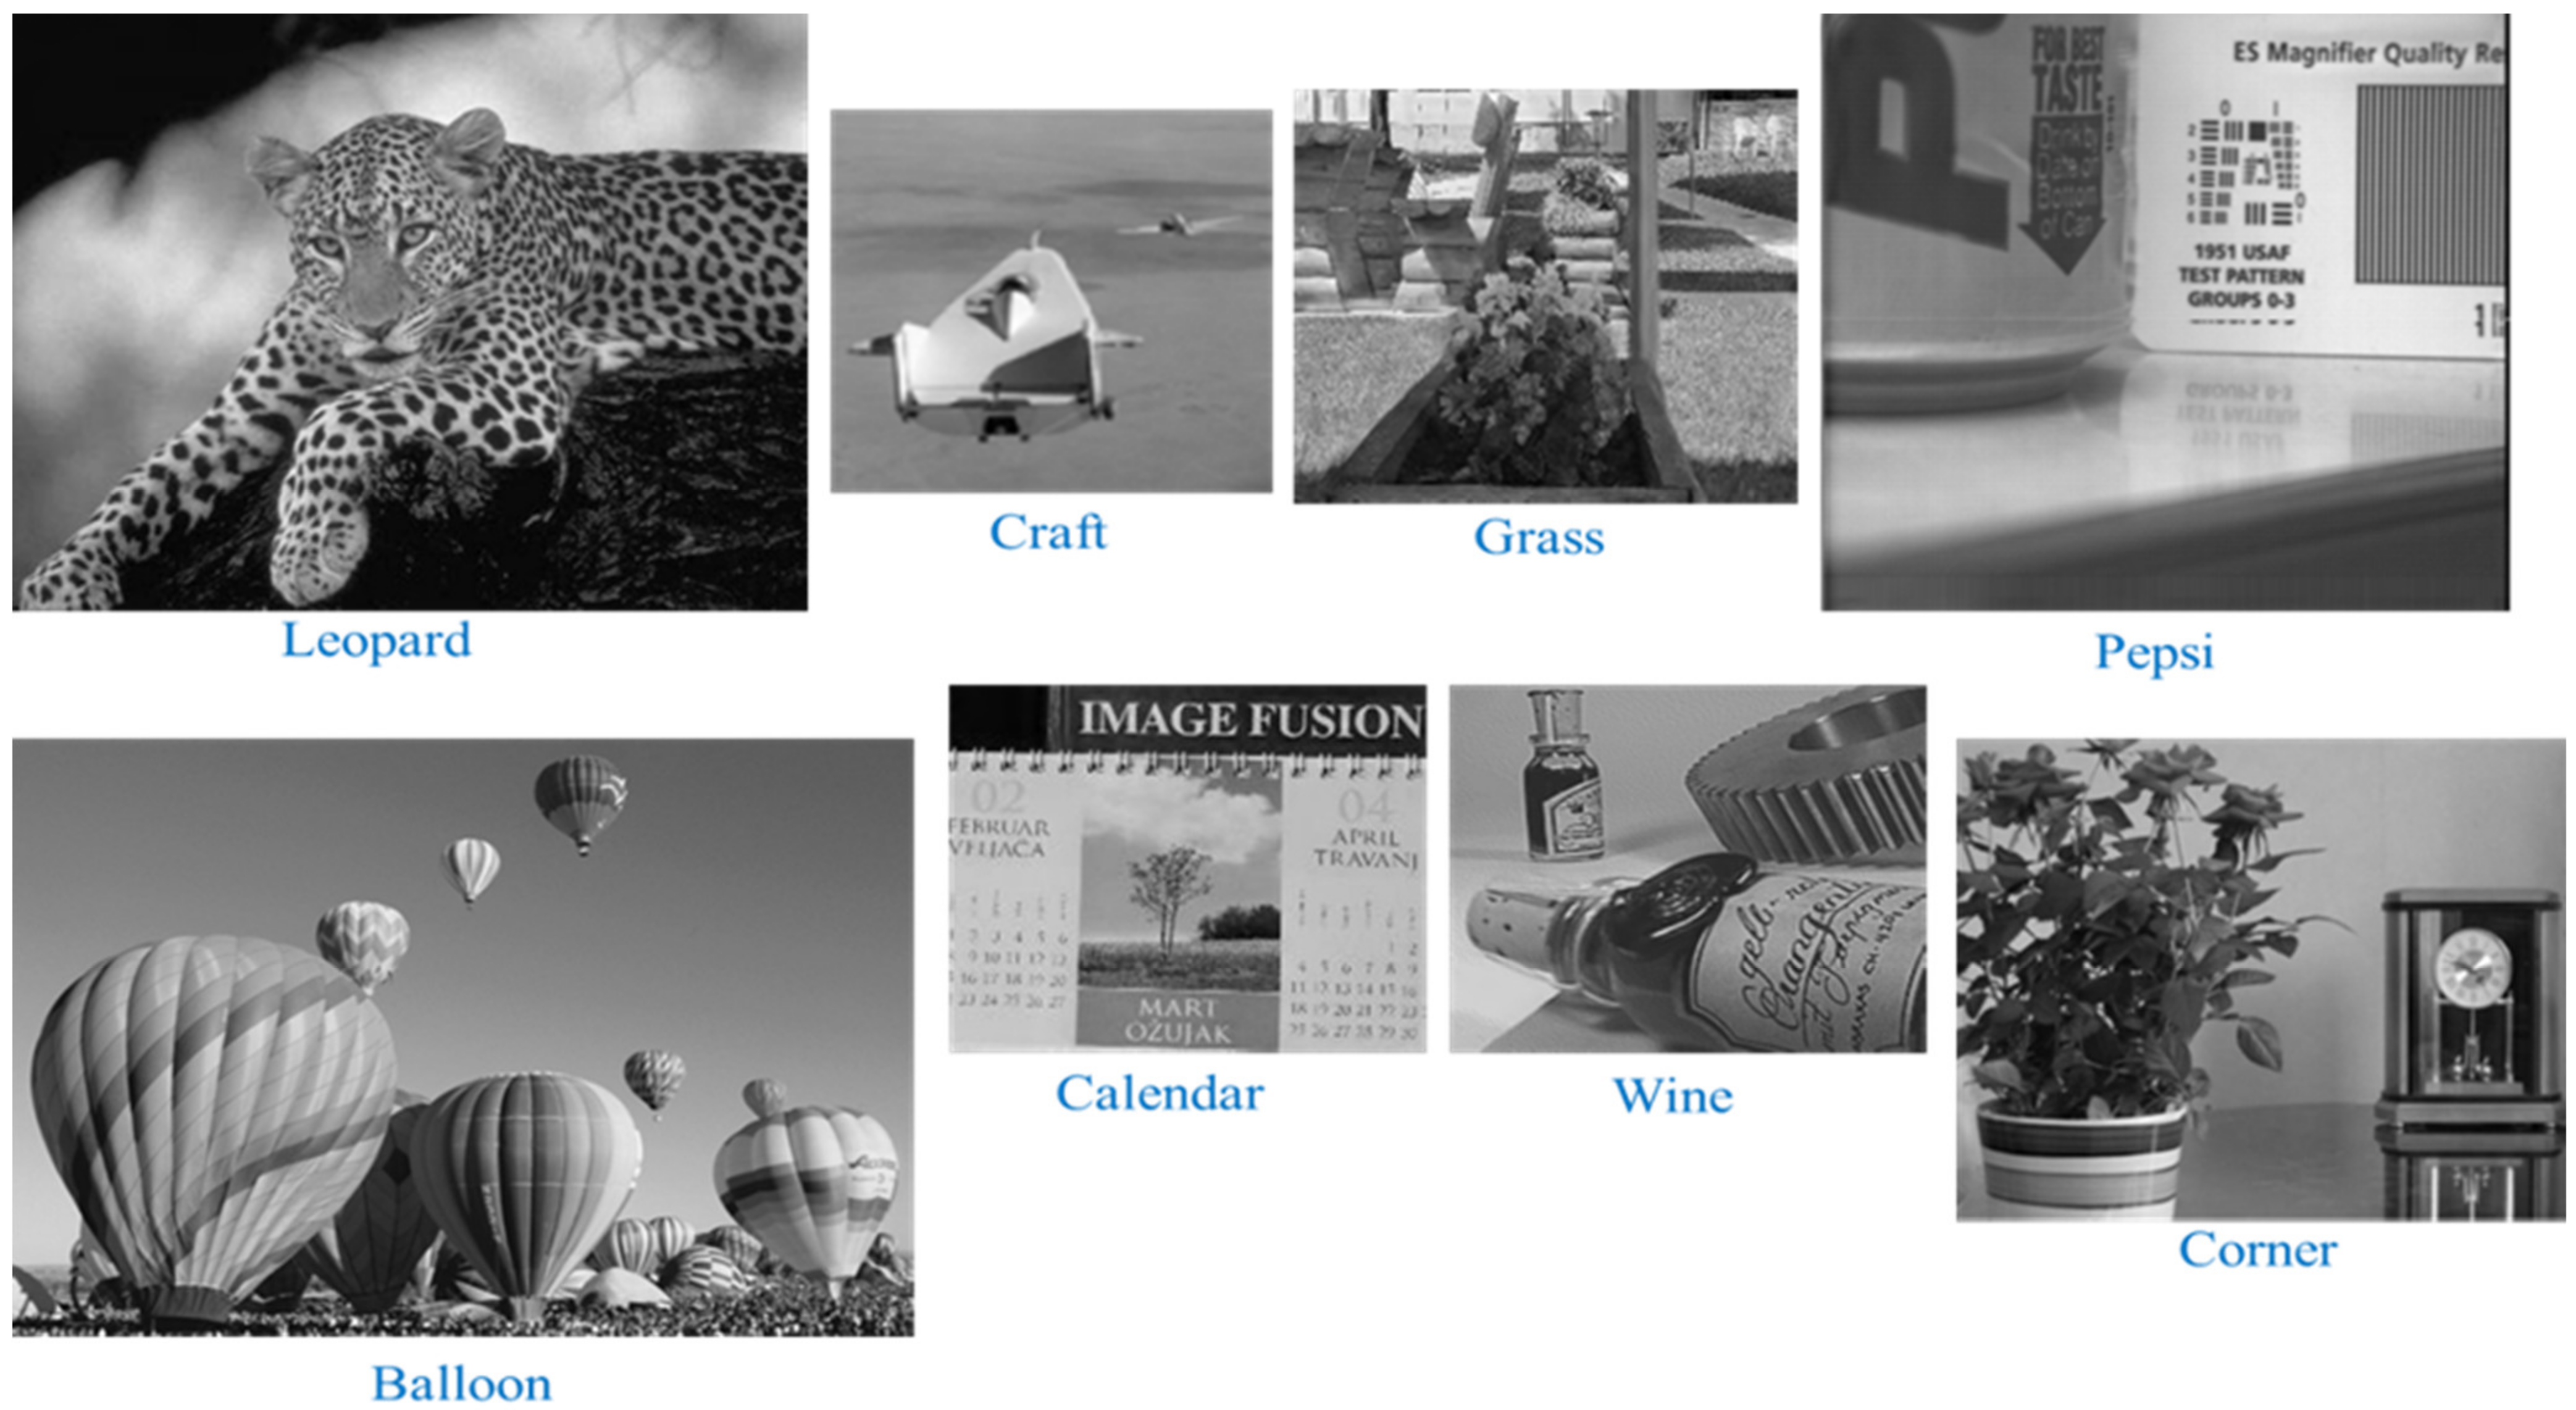
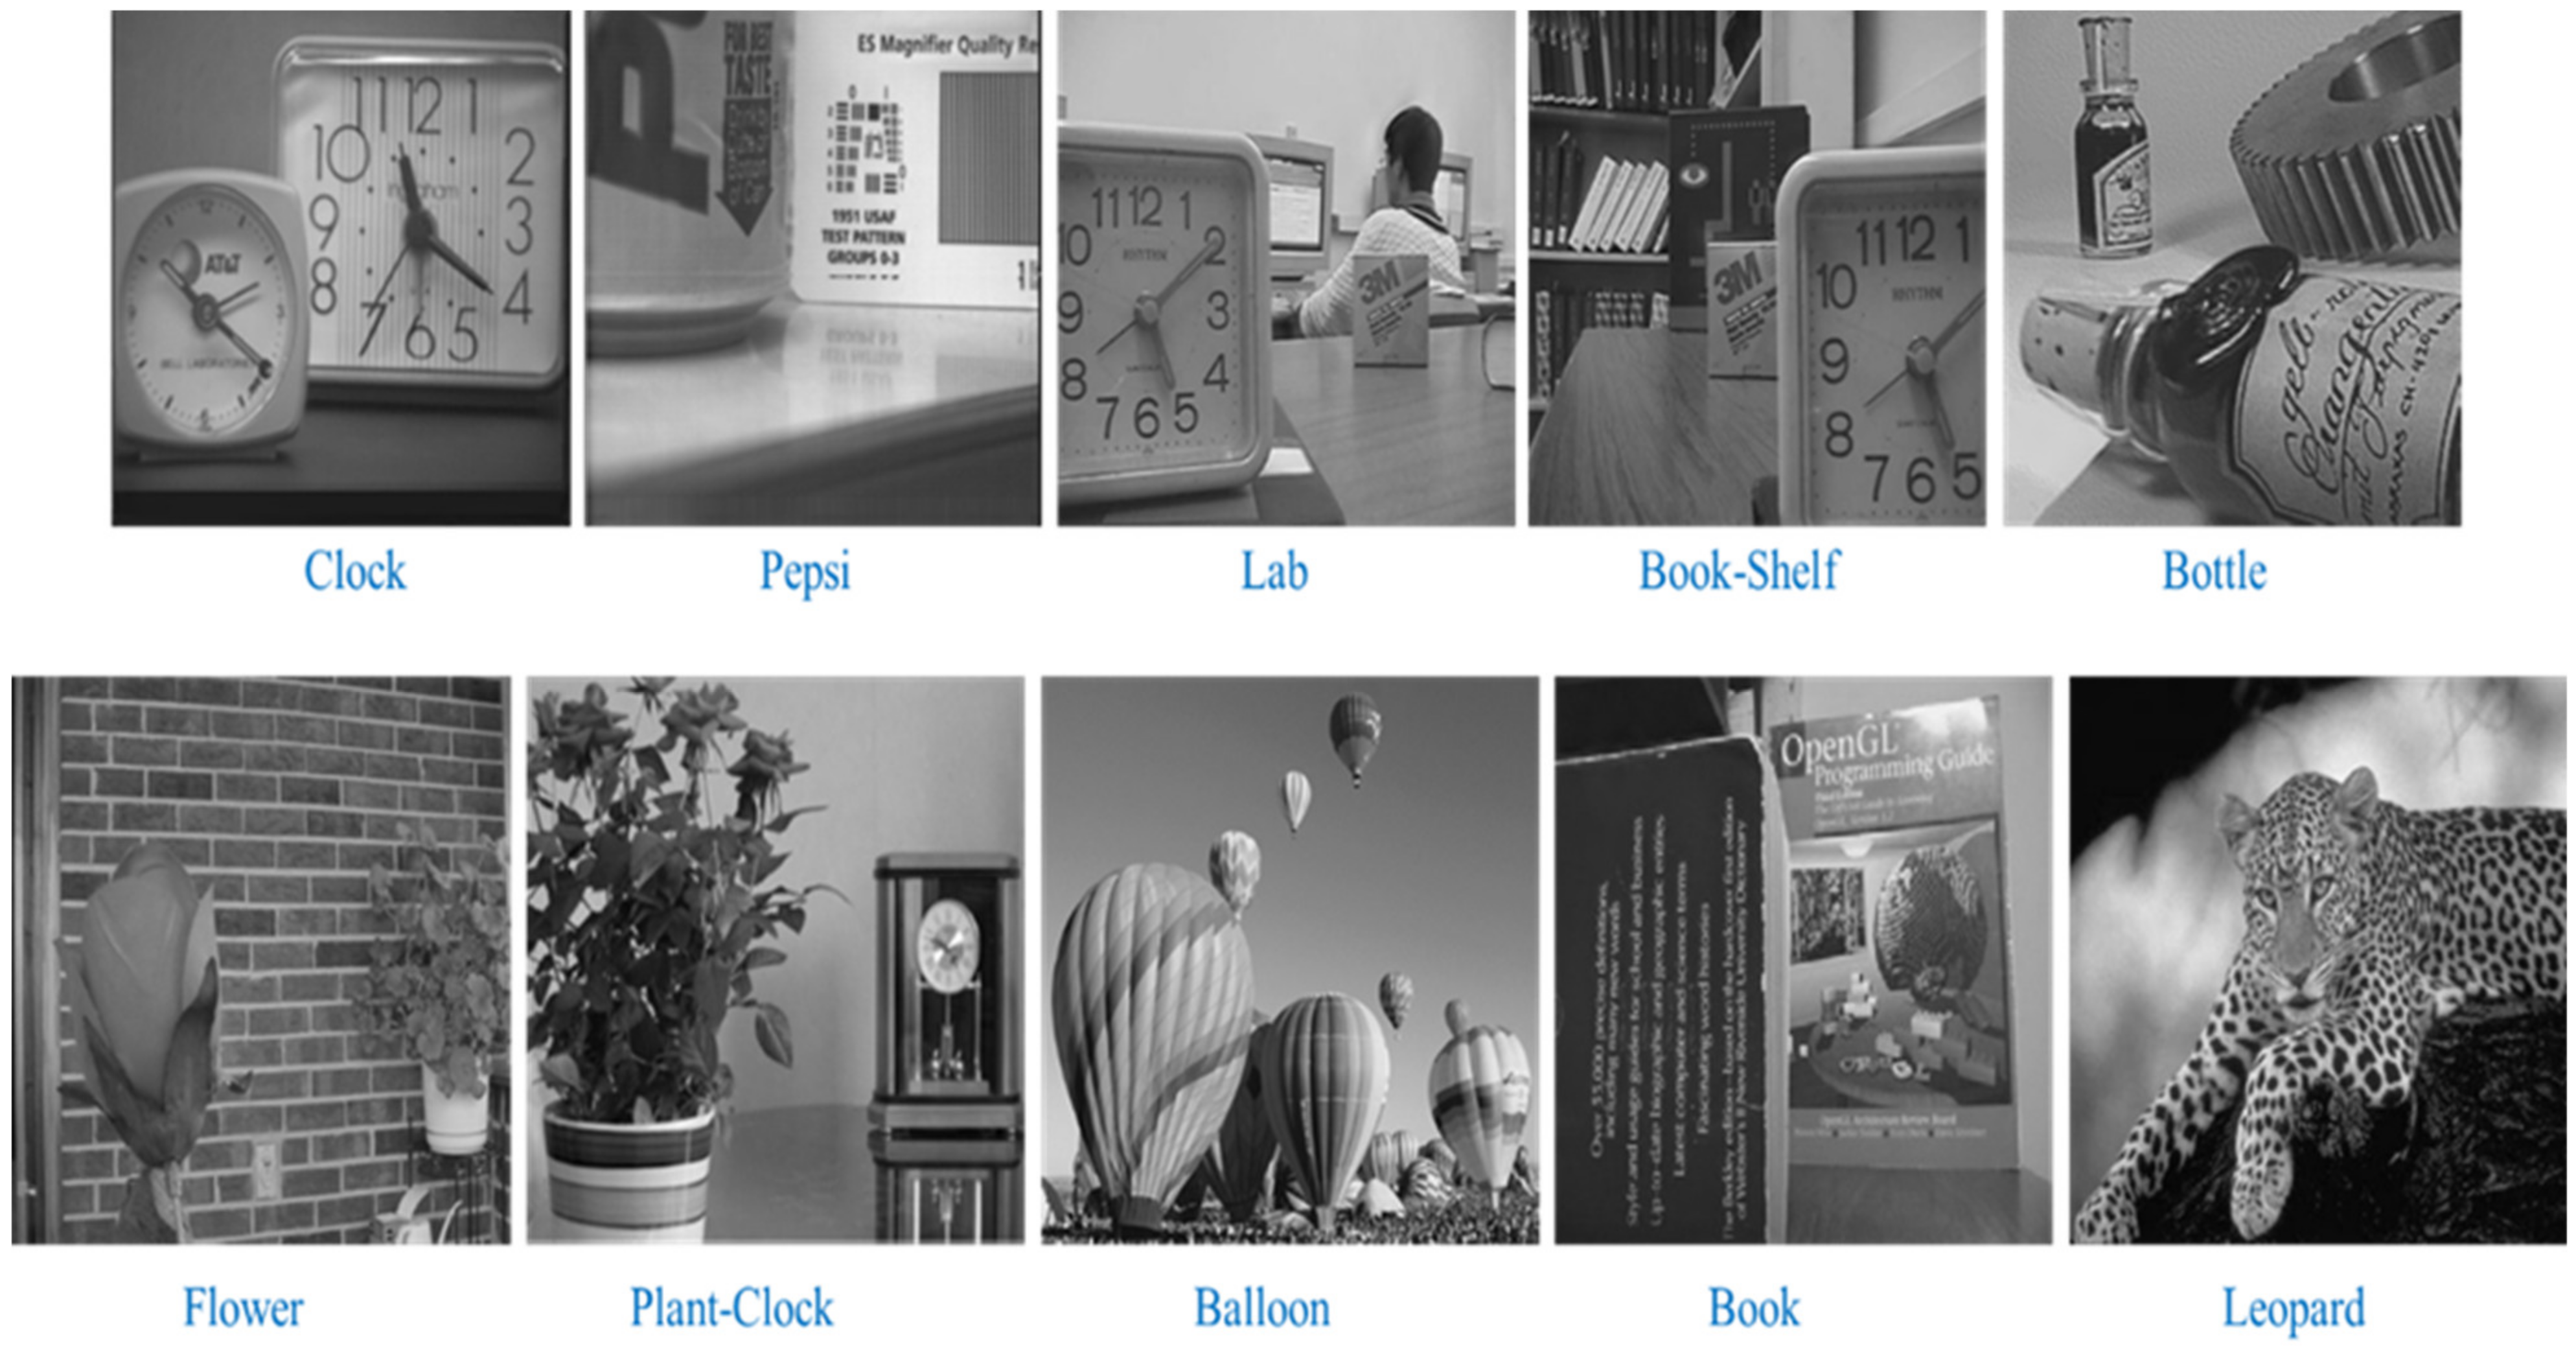
A hybrid wavelet (SWT and DTCWT) and TEM are proposed in this paper. The proposed algorithm’s quality was evaluated using quality metrics, including correlation-coefficient (CC), entropy (E(F)), total-fusion-performance (QAB/F), average-gradient (AG), structural-similarity (SSIM), standard-deviation (SD), spatial-frequency (SF), weighted-fusion-quality (QW), edge-dependent-fusion-quality (QE), feature-mutual-information (FMI), root-mean-square-error (RMSE), fusion-loss (LAB/F), peak-signal-to-noise-ratio (PSNR), fusion-artifacts (NAB/F), edge-intensity (EI), gray-mean-value (GM), image-definition (ID), percentage-fit-error (PFE), and universal quality index (Q0). The proposed strategy is contrasted with previously published methods using these metrics. These criteria are used to assess the comparison and robustness of the fused images against distortions. Source images that are utilized for comparison are familiar with multi-focus image fusion. Numerous images from various datasets are used in experiments [33]. The proposed method produces successful outcomes for these images. However, the approaches that are contrasted with the proposed methodology do not yield results for these images, so they are not included in the publication. This paper compares approaches in the literature with [4,18,19,20,21,22] using the desk, book, clock, flower, lab, leaf, flowerpot, Pepsi, balloon, grass, leopard, calendar, wine, craft, and remote sensing images. Additionally, the results of the proposed method for a few tested source images are shown. The images come in a range of sizes and quality. The proposed approach can be used with any multi-focus image, not just in this study.
3.1. Outcomes of the Proposed Methodology for a Few Specified Images
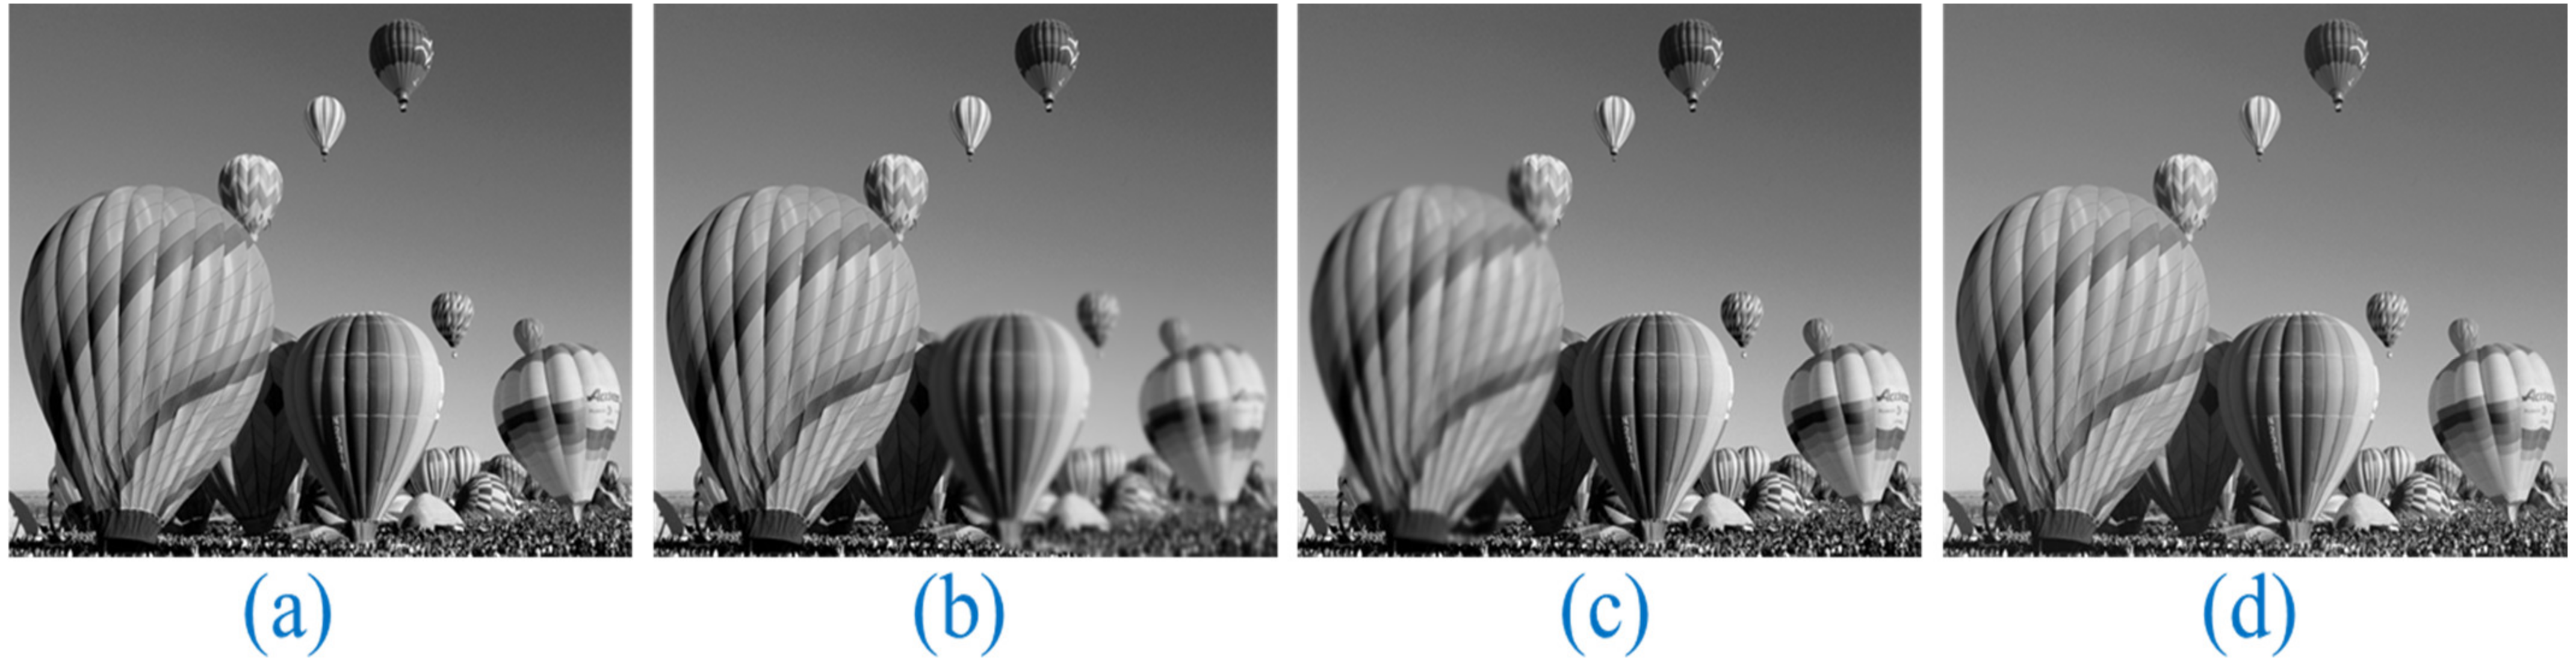
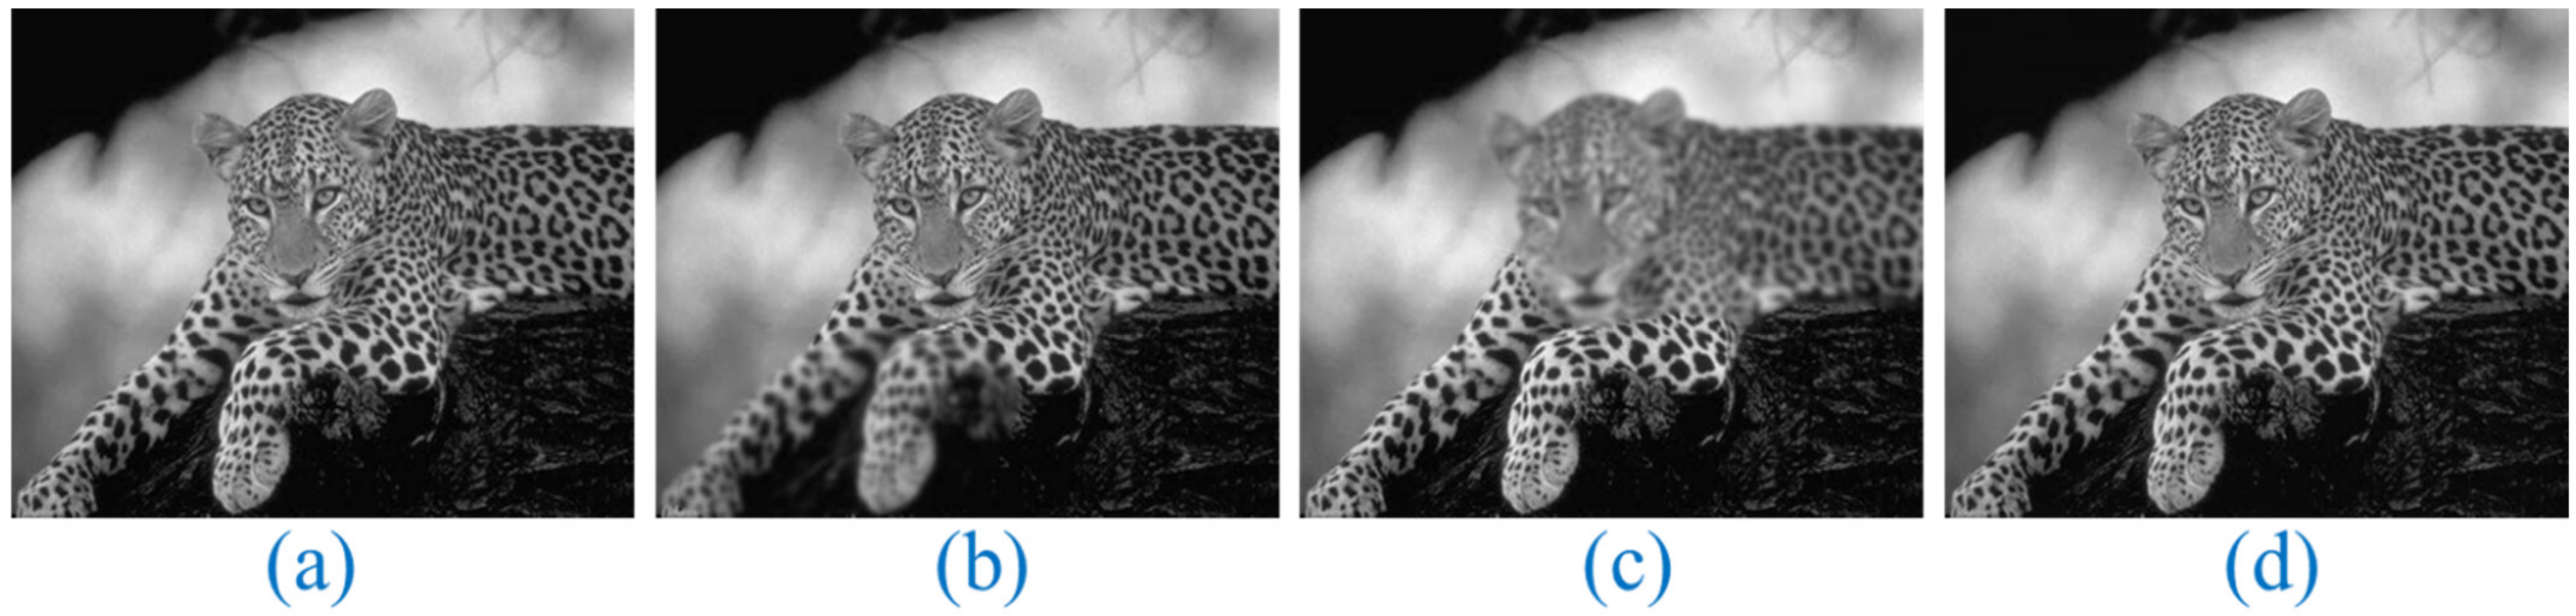
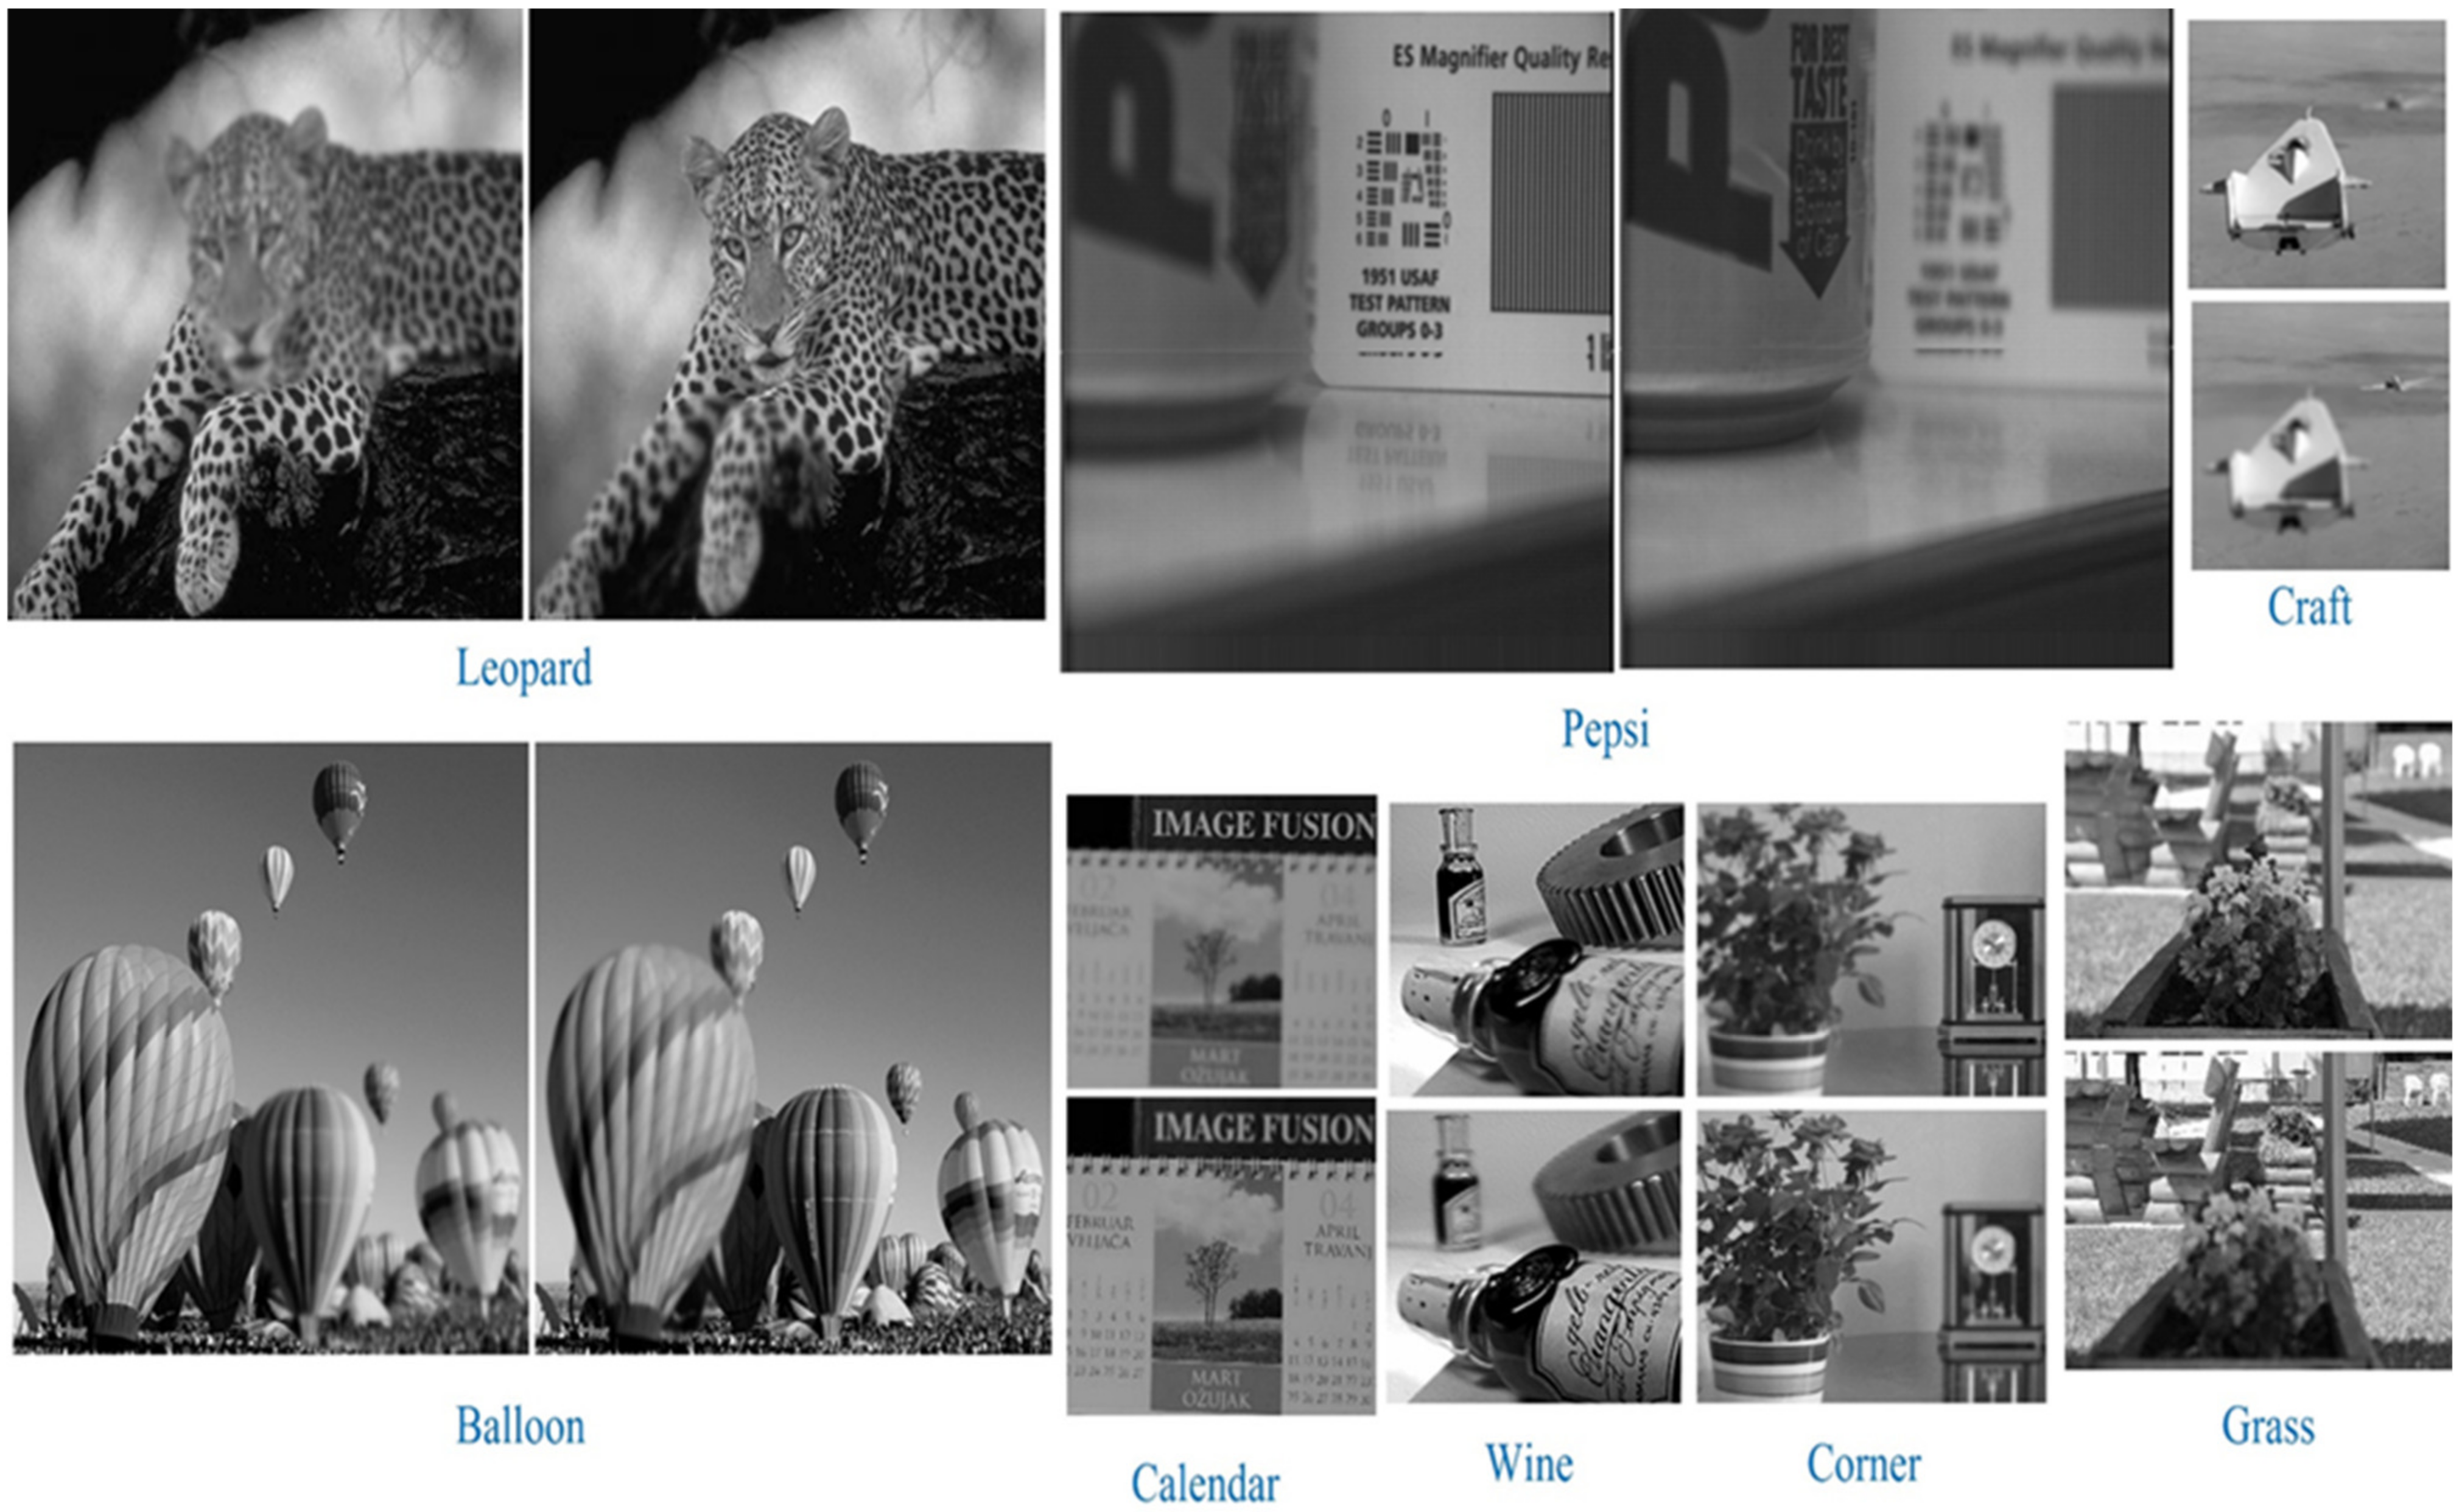
Several kinds of grayscale images are utilized to apply the proposed method. Analyses such as E(F), SD, AG, QE, CC, SSIM, QAB/F, RMSE, PFE, PSNR, and SF are applied to these images. Many different kinds of images are used and analysed. Images in Figure 3, Figure 4, Figure 5, Figure 6, Figure 7 and Figure 8 are the visual outcomes for the balloon, leopard, craft, wine, grass, and calendar images. Table 1 demonstrates the outcomes of the proposed process for a selection of trialed images. Table 2 shows the RMSE and PSNR values, two subjective measurements, for a selection of multi-focus images. In Table 2, the proposed method is compared to methods in the literature that use subjective criteria. The letter ‘X’ indicates that image specifications for the item are not available. Images of a flowerpot, a clock, a bottle of Pepsi, a cameraman, a desk, a book, a lab, and a flower are used to compare the proposed method to those already in use. The most favourable results are highlighted here. These metrics are practiced to evaluate the resistance of the proposed method to distortion. Conclusions suggest the proposed method fares well in subjective evaluations.
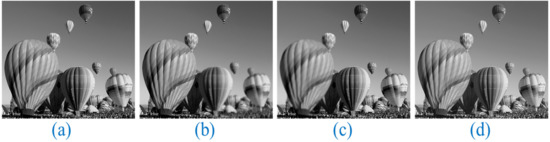
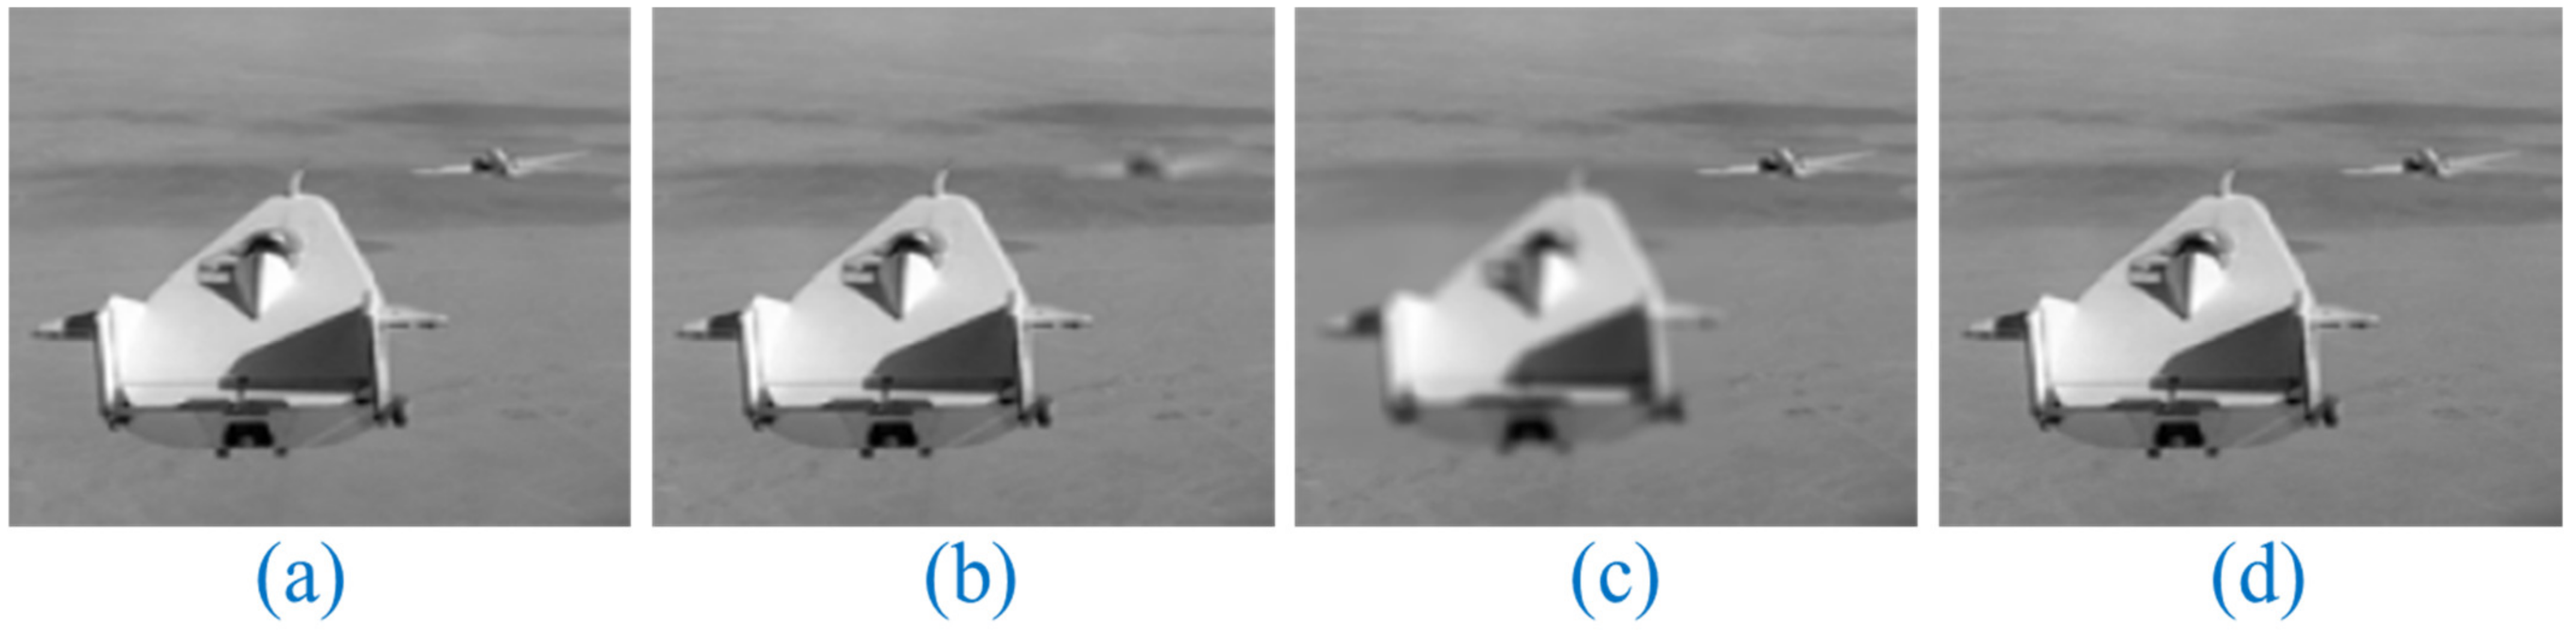
Figure 3.
Multi-focus image of a balloon from various perspectives. Original Image: (a), Multi-focus Input Images: (b,c), and Proposed Fusion: (d).
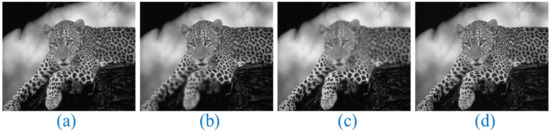
Figure 4.
Multi-focus image of a leopard from various perspectives. Original Image: (a), Multi-focus Input Images: (b,c), and Proposed Fusion: (d).
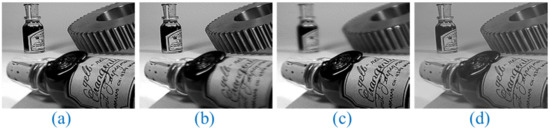
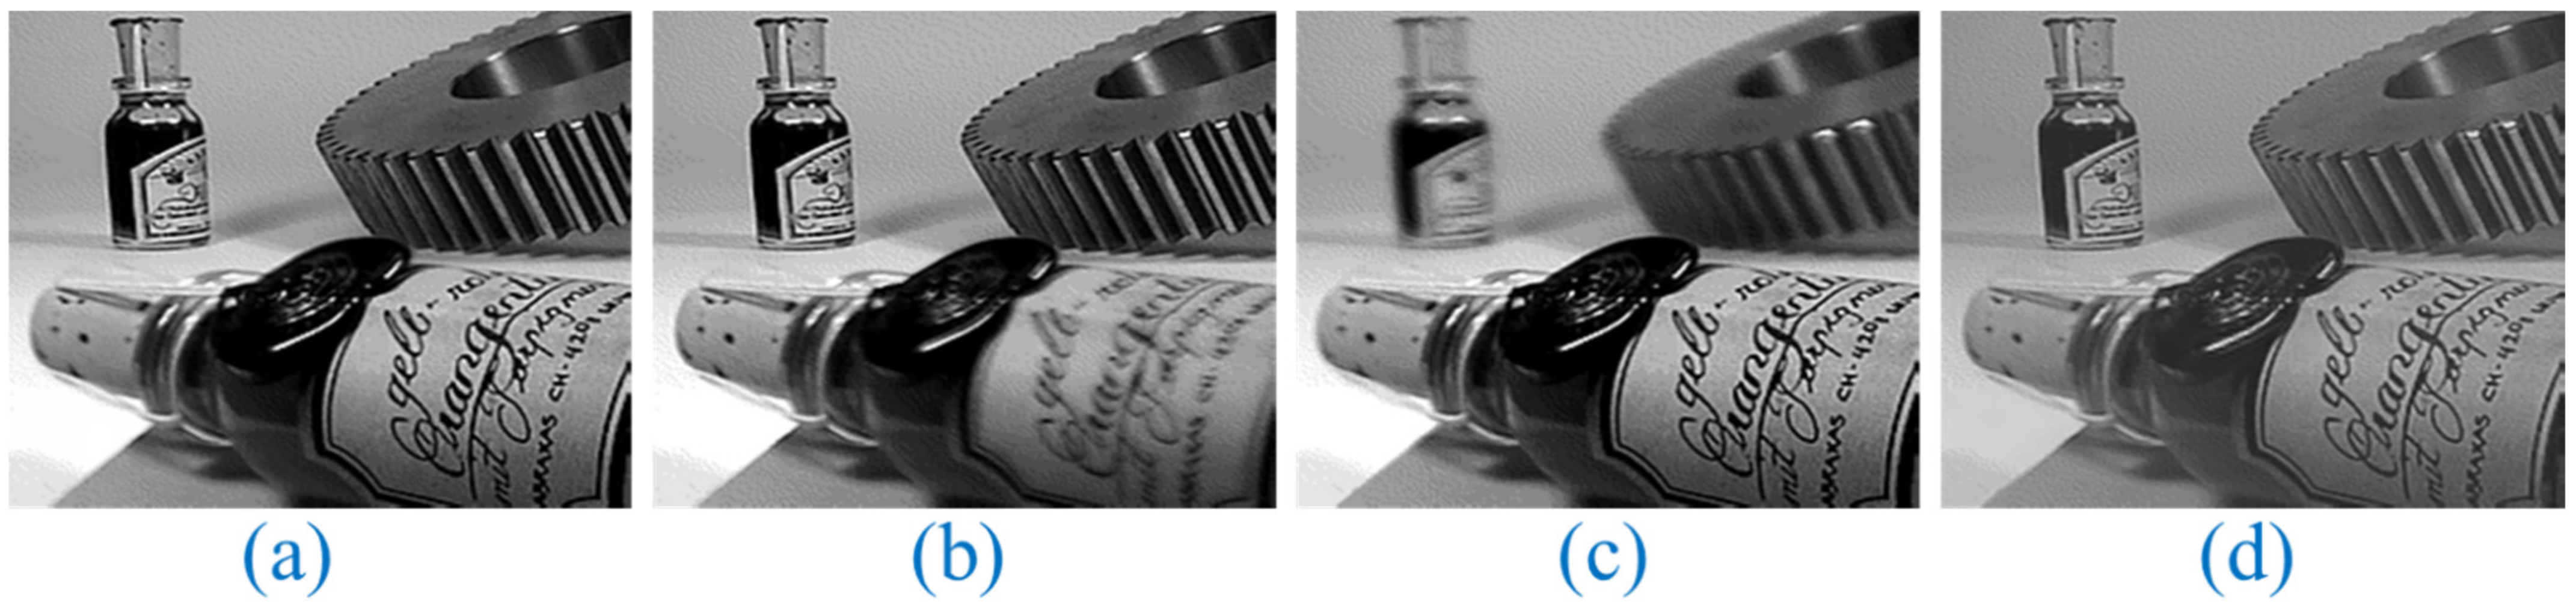
Figure 5.
Multi-focus image of a wine bottle from various perspectives. Original Image: (a), Multi-focus Input Images: (b,c), and Proposed Fusion: (d).
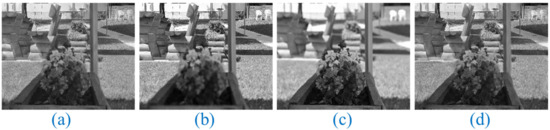
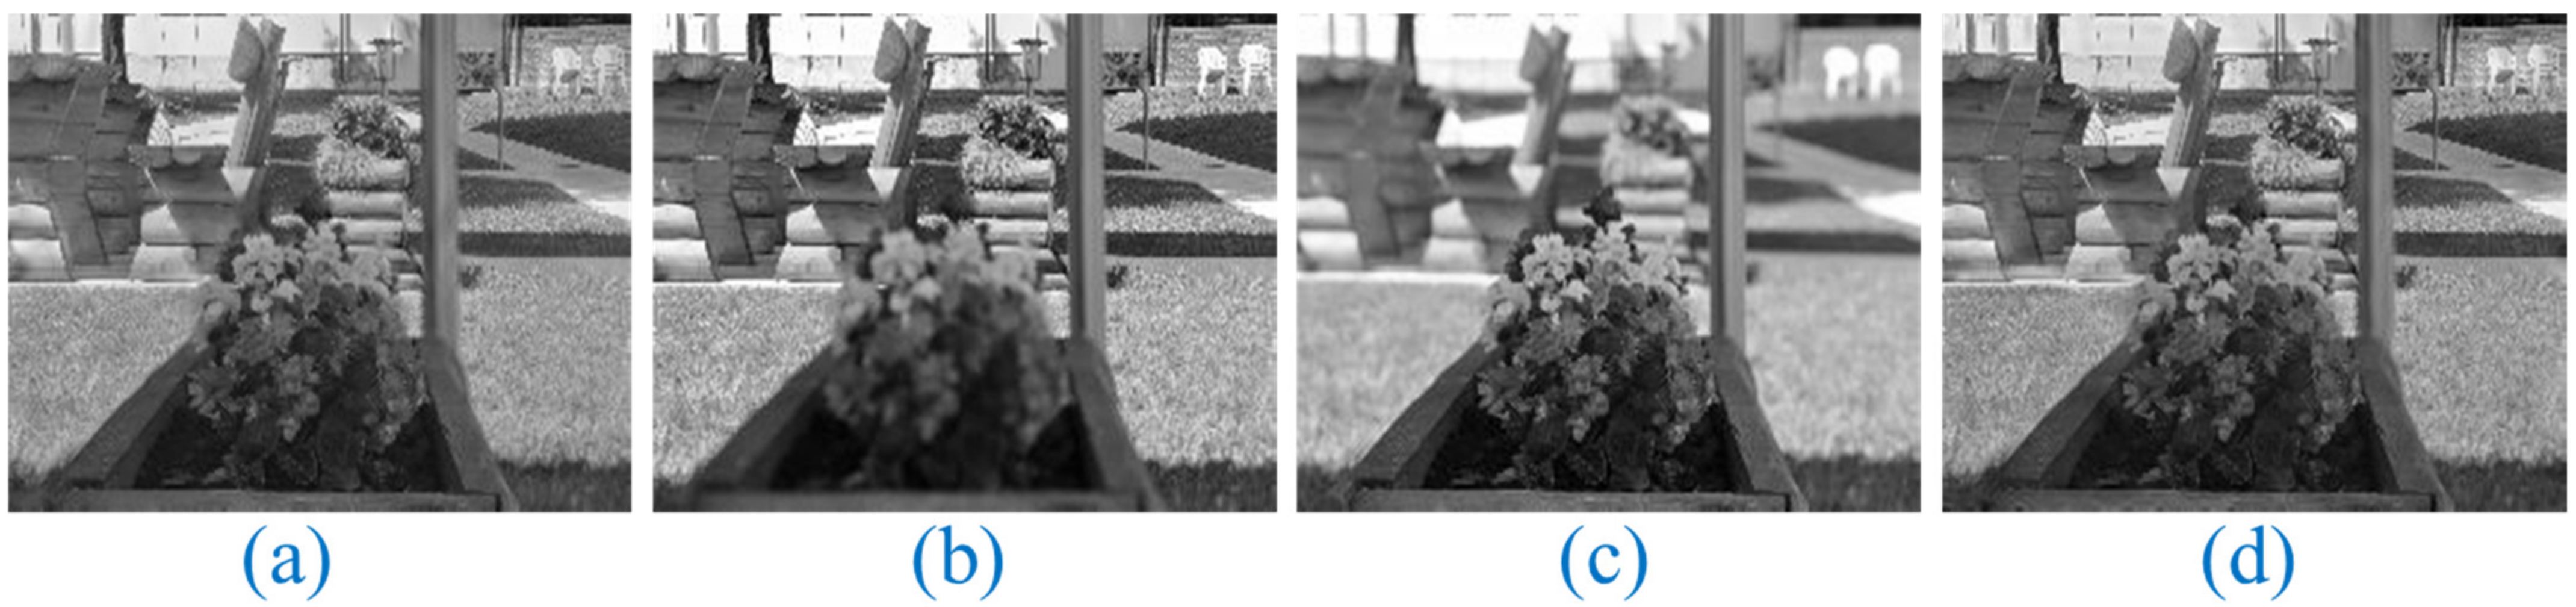
Figure 6.
Multi-focus image of a grass from various perspectives. Original Image: (a), Multi-focus Input Images: (b,c), and Proposed Fusion: (d).
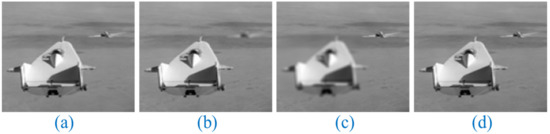
Figure 7.
Multi-focus image of a craft from various perspectives. Original Image: (a), Multi-focus Input Images: (b,c), and Proposed Fusion: (d).
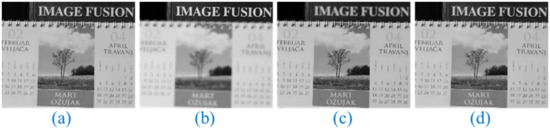
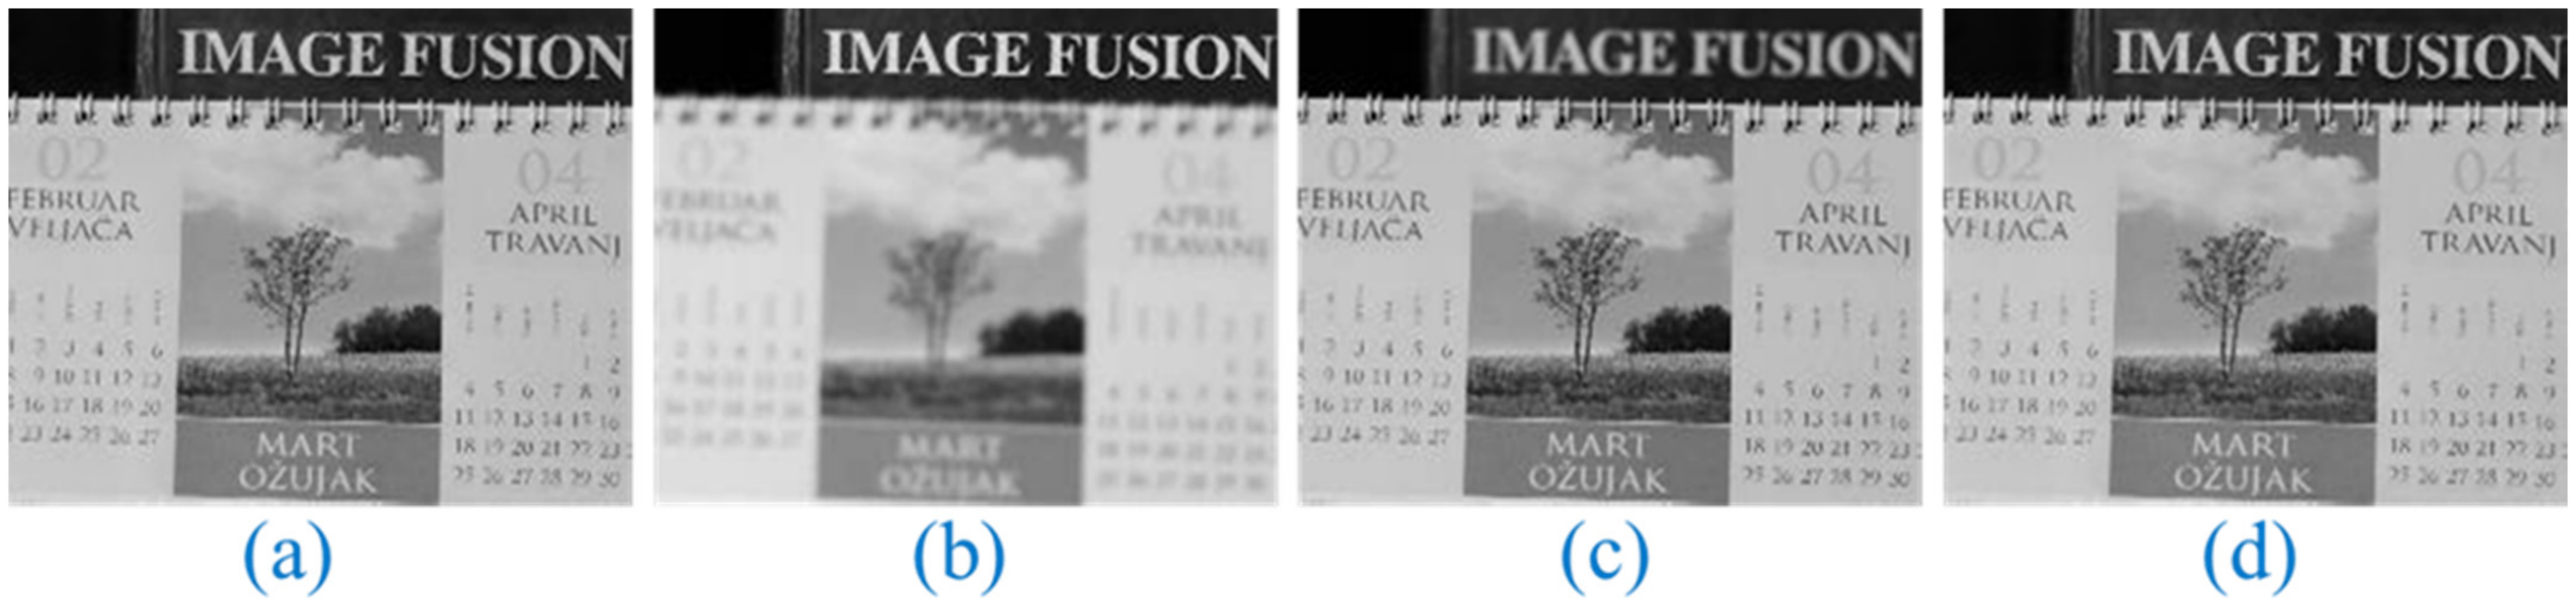
Figure 8.
Multi-focus image of a calendar from various perspectives. Original Image: (a), Multi-focus Input Images: (b,c), and Proposed Fusion: (d).

Table 1.
The performance of the proposed methodology for a couple of trailing images.
Table 2.
The methodologies from the literature have been compared to a number of images.
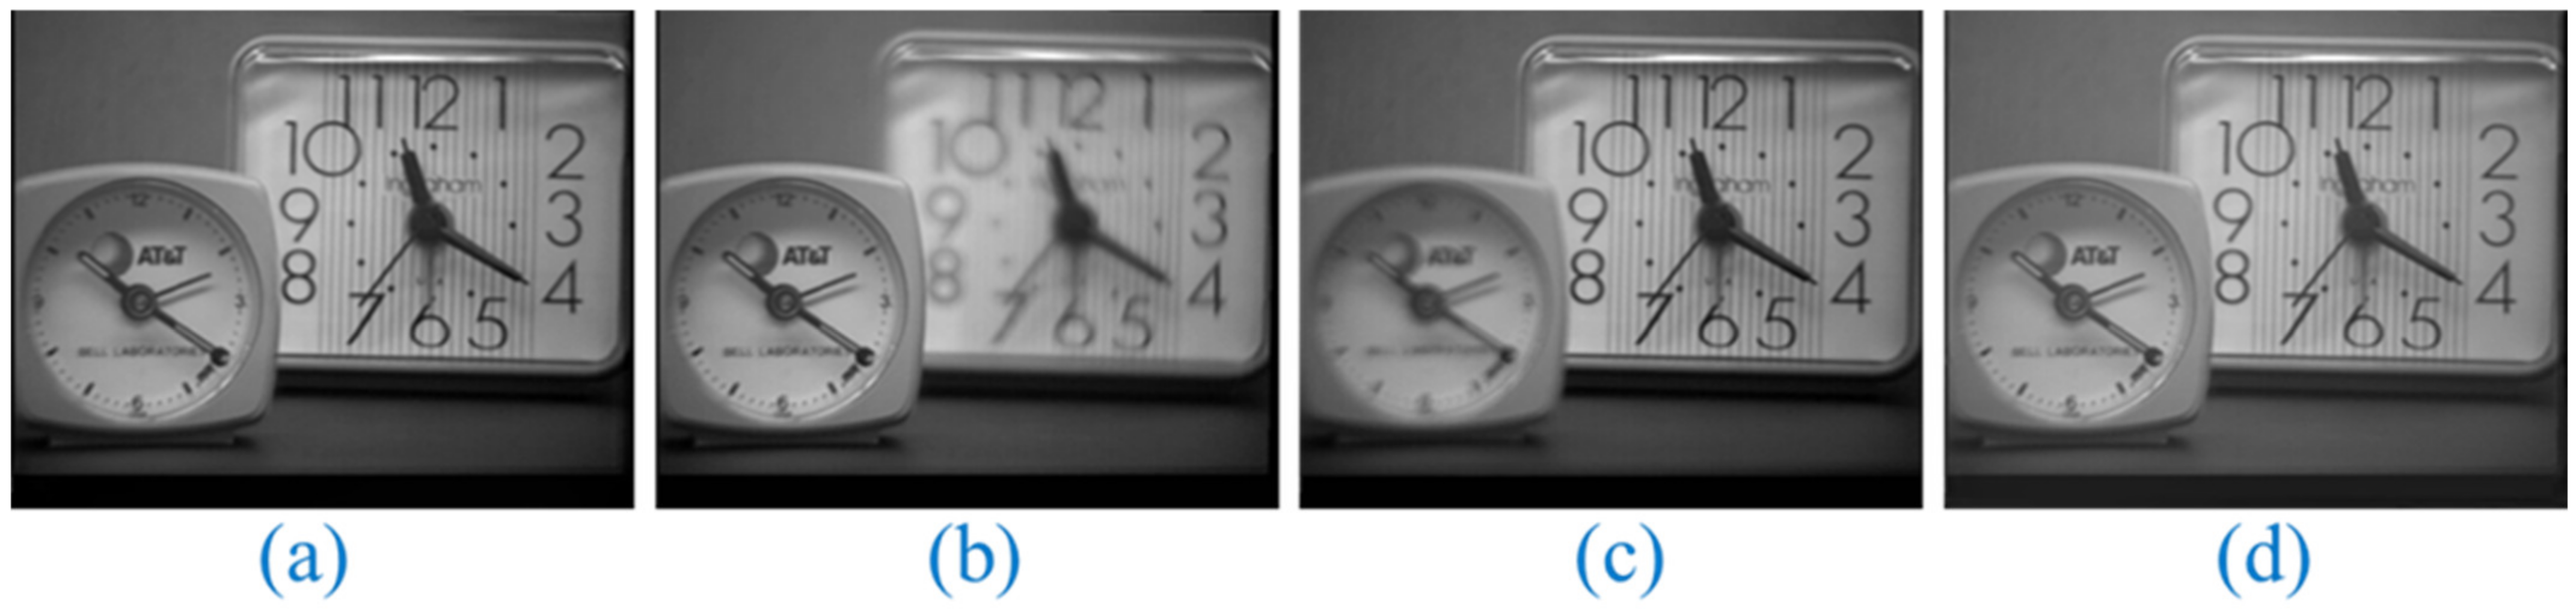
3.2. Comparison of Clock Image Fusion with the Literature
The clock, depicted in Figure 9, is used to evaluate the first multi-focus image. In Figure 9, the original image is depicted in (a). Images with a left focus and a right focus, respectively, are shown in Figure 9b,c. Left-side focus is referred to as a “left focused image”, while the right-side focus is referred to as a “right unfocused image”. An image that is right-focused but not left-focused is one that is dominated by the right. The approach is put into practice, and the result is the all-in-focus image, as seen in Figure 9d. The following calculations are used to assess the effectiveness of the proposed methodology: E(F), AGF, QE, CC, QAB/F, and SSIM. The evaluation of the proposed methodology is then compared to other strategies previously described in the literature. The comparison’s findings are displayed in Table 3 of the report. The proposed method outperforms those approaches, according to the literature [20], and the best results of the methods are highlighted.
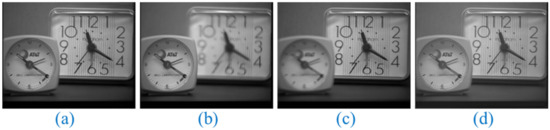
Figure 9.
Multi-focus image of a clock from various perspectives. Original Image: (a), Multi-focus Input Images: (b,c), and Proposed Fusion: (d).
Table 3.
The results and comparisons for clock image ([20]).
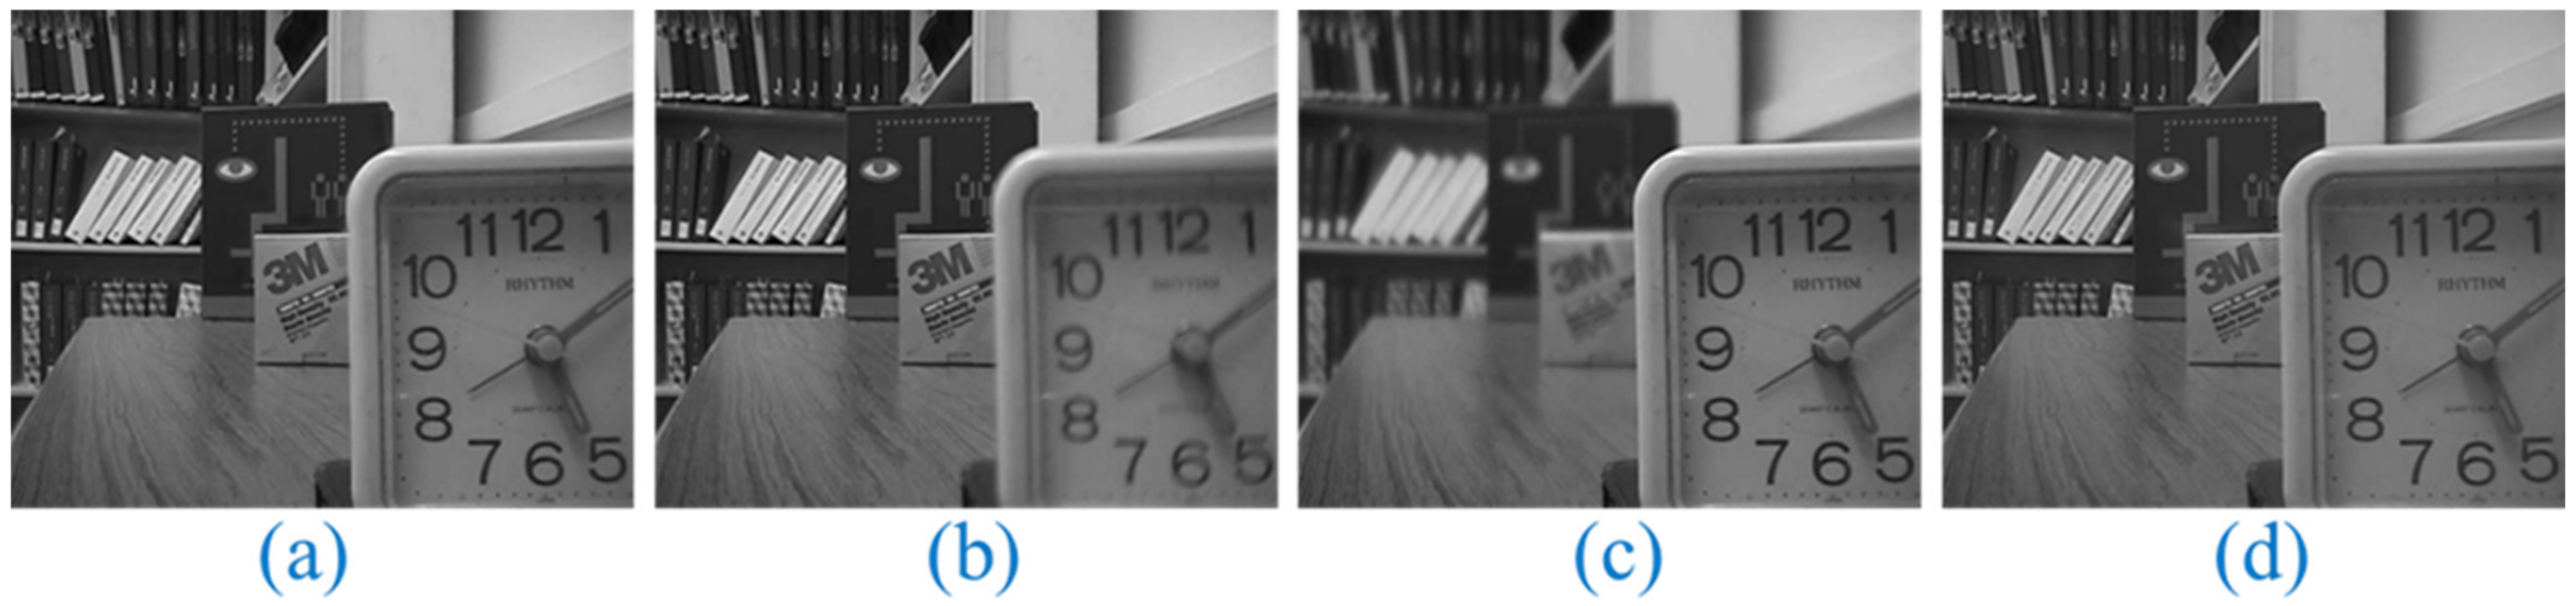
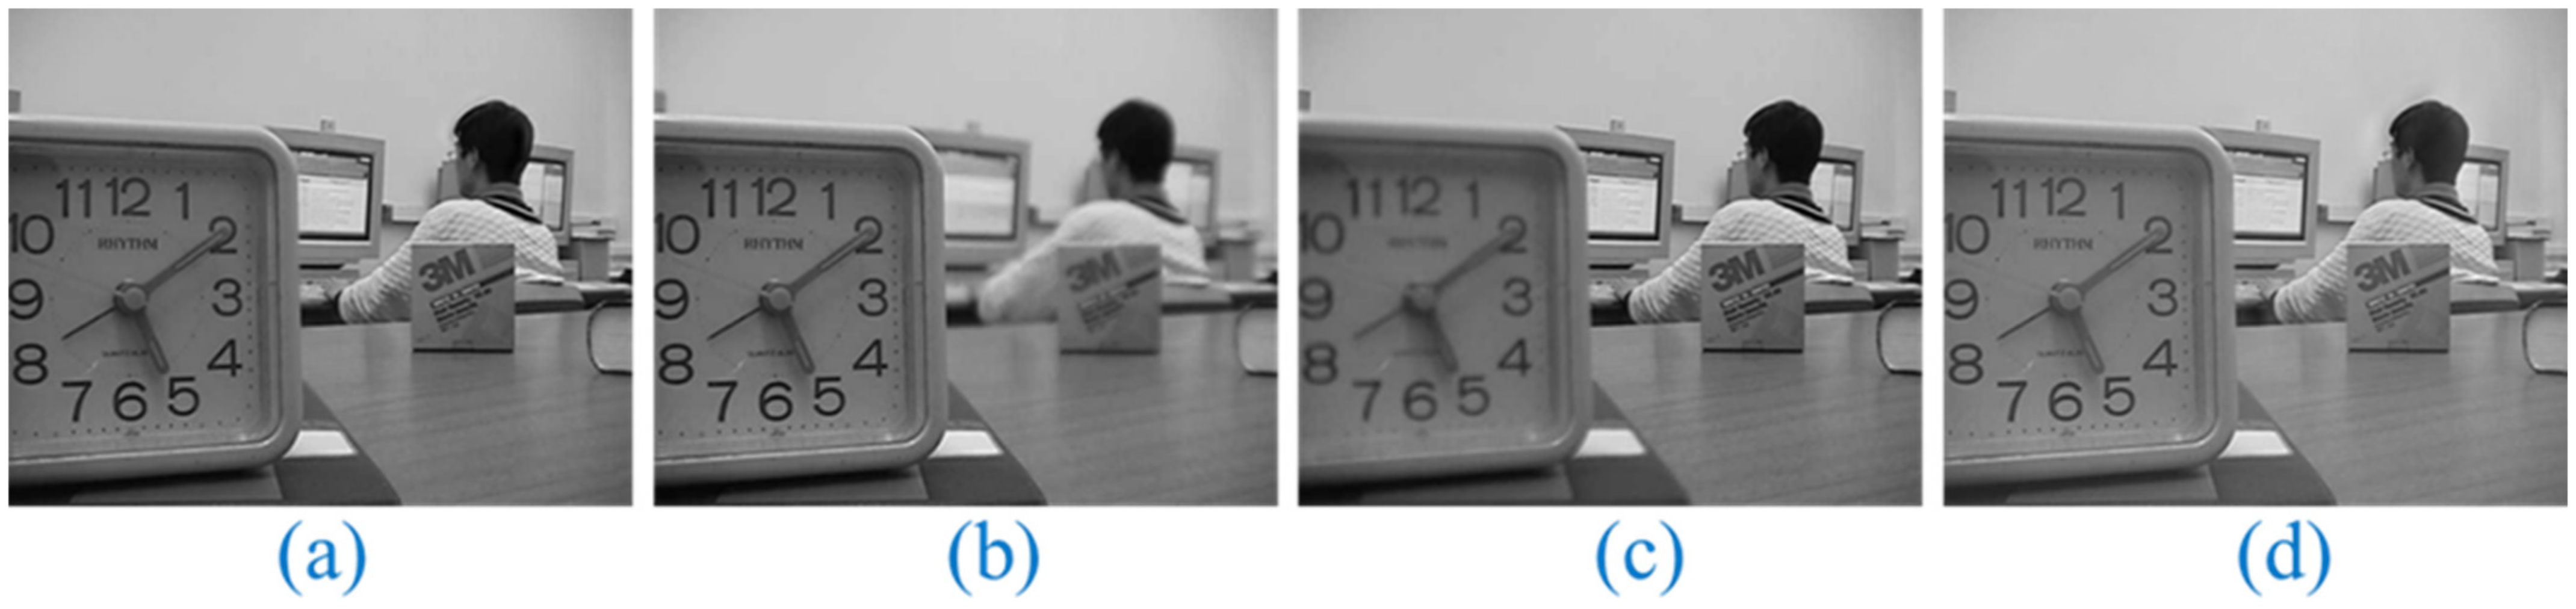
3.3. Comparison of Desk Image Fusion with the Literature
The desk, depicted in Figure 10, is used to evaluate the second multi-focus image. In Figure 10, the original image is depicted in (a). Images with a left focus and a right focus, respectively, are shown in Figure 10b,c. Left-side focus is referred to as a “left focused image”, while the right-side focus is referred to as a “right unfocused image”. A right-focused image has only its right side considered; the left side has not been considered. Following a successful strategy implementation, Figure 10d depicts the procedure for producing the entire in-focus image. The following parameters are computed to measure the effectiveness of the given technique: E(F), AGF, CC, QAB/F, SSIM, and QE. The proposed strategy’s performance is then compared to other approaches already published in the literature. The comparison’s findings are displayed in Table 4 of the report. The best results of methods are highlighted in bold, and the literature [20] indicates that the proposed strategy is more effective than existing methods.
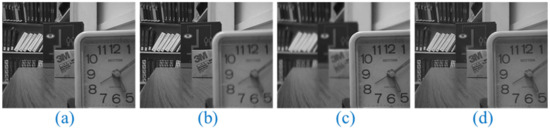
Figure 10.
Multi-focus image of a desk from various perspectives. Original Image: (a), Multi-focus Input Images: (b,c), and Proposed Fusion: (d).
Table 4.
The results and comparisons for desk image ([20]).
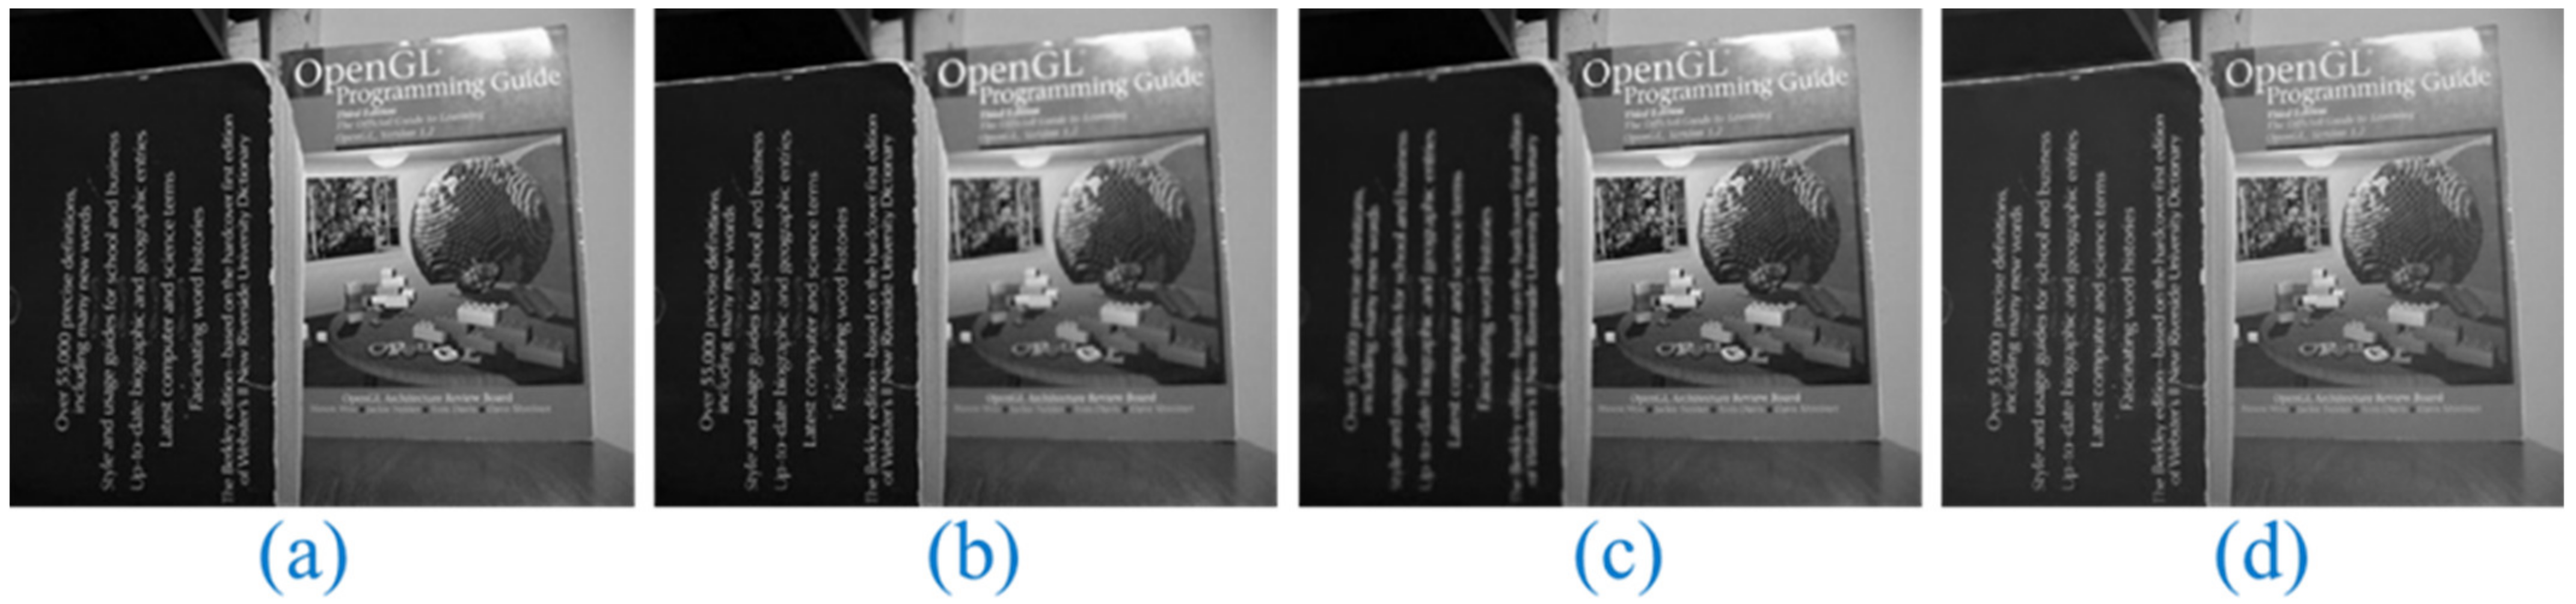
3.4. Comparison of Book Image Fusion with the Literature
The book, depicted in Figure 11, is used to evaluate the third multi-focus image. In Figure 11, in (a), the original image is depicted. Images with left and right focus are shown in Figure 11b,c, respectively. The phrase “left focused image” describes an image whose left side is focused but not right. While the left of the image is out of focus, the right side is. The method’s creation of the all-in-focus image is depicted in Figure 11d after it has been successfully applied. The following parameters are computed to assess the efficiency of the proposed methodology: E(F), AGF, SSIM, CC, QAB/F, and QE. Finally, the effectiveness of the proposed strategy is contrasted with other approaches previously reported in the literature. Table 5 of the report includes the comparison results. The proposed method is more effective than most of the other methods according to the literature [20] and the best results of the methods are noted in bold.
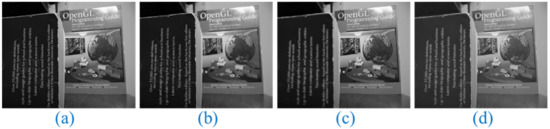
Figure 11.
Multi-focus image of a book from various perspectives. Original Image: (a), Multi-focus Input Images: (b,c), and Proposed Fusion: (d).
Table 5.
The results and comparisons for book image ([20]).
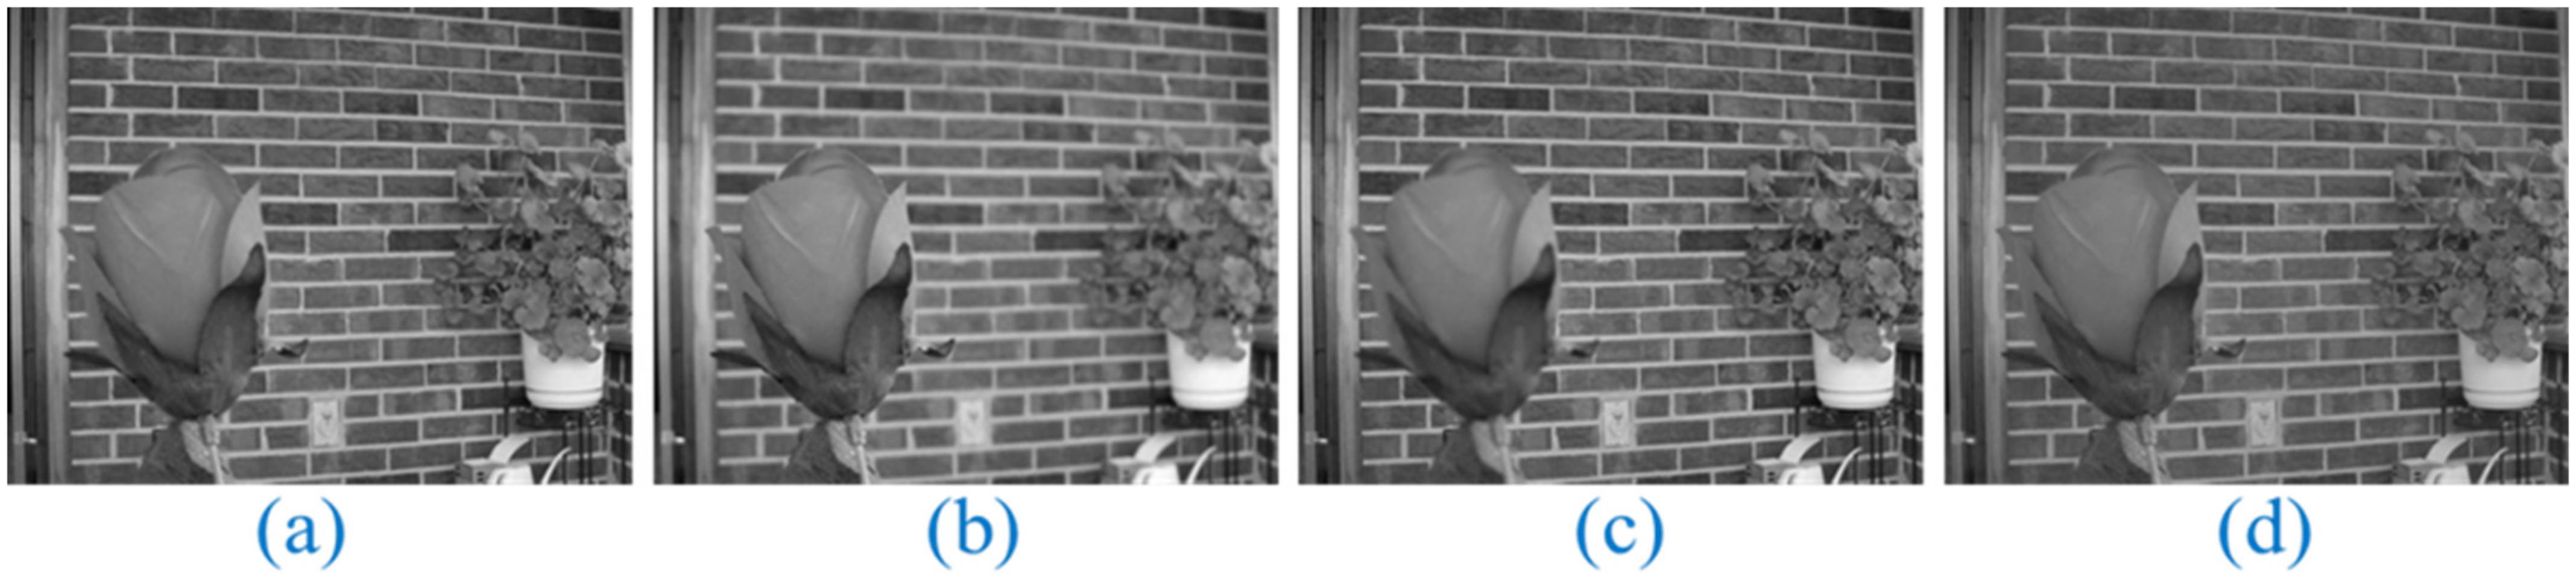
3.5. Comparison of Flower Image Fusion with the Literature
The flower in Figure 12 is used to evaluate the fourth multi-focus image. In Figure 12, the original image is depicted in (a). Images with a left focus and a right focus, respectively, are shown in Figure 12b,c. Left-side focus is referred to as a “left focused image”, while the right-side focus is referred to as a “right unfocused image”. An image that is right-focused but not left-focused is one that is dominated by the right. The approach is put into practice, and the result is the all-in-focus image, as seen in Figure 12d. To evaluate the performance of the proposed methodology, calculations are made for SSIM, E(F), CC, AGF, QAB/F, and QE. The performance of the proposed strategy is then contrasted with that of other approaches previously reported in the literature. The comparison’s findings are shown in Table 6 of the report. The best outcomes are given in bold, and the research [20] indicates that the proposed strategy is more effective than the alternatives.
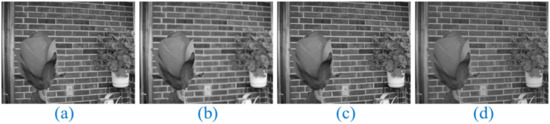
Figure 12.
Multi-focus image of a flower from various perspectives. Original Image: (a), Multi-focus Input Images: (b,c), and Proposed Fusion: (d).
Table 6.
The results and comparisons for flower image ([20]).
3.6. Comparison of Lab Image Fusion with the Literature
The lab, depicted in Figure 13, is used to evaluate the sixth multi-focus image. In Figure 13, the original image is depicted in (a). Images with a left focus and a right focus, respectively, are shown in Figure 13b,c. Left-side focus is referred to as a “left focused image”, while the right-side focus is referred to as a “right unfocused image.” A right-focused image has only its right side considered; the left side has not been taken into consideration. After the technique has been used effectively, Figure 13d illustrates the process of producing the all-in-focus image. The following parameters—E(F), QE, AGF, SSIM, CC, and QAB/F—are computed to assess the proposed technique performance. The performance of the proposed strategy is then contrasted with that of other approaches previously reported in the literature. The comparison’s findings are displayed in Table 7 of the report. The best results are highlighted in bold, and the literature [20] indicates that the proposed strategy is more effective than existing methods.
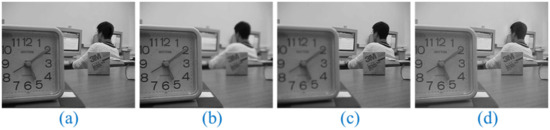
Figure 13.
Multi-focus image of a lab from various perspectives. Original Image: (a), Multi-focus Input Images: (b,c), and Proposed Fusion: (d).
Table 7.
The results and comparisons for lab image ([20]).
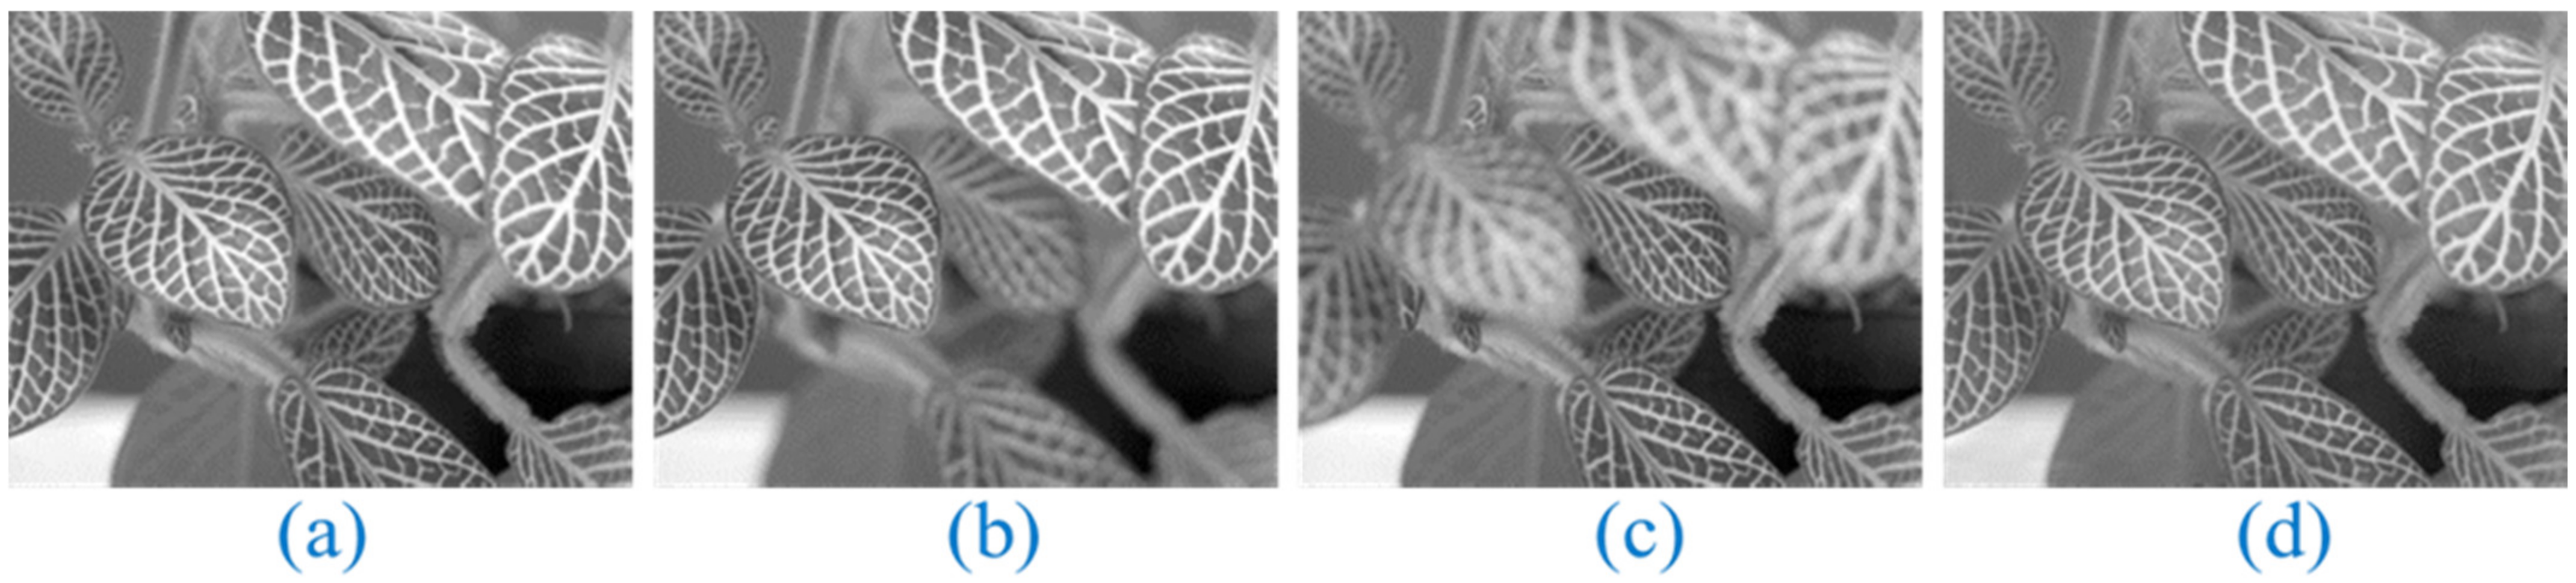
3.7. Comparison of Leaf Image Fusion with the Literature
In Figure 14, a leaf is used to evaluate the sixth multi-focus image. In Figure 14, the original image is depicted in (a). Images with a left focus and a right focus, respectively, are shown in Figure 14b,c. Left-side focus is referred to as a “left focused image”, while the right-side focus is referred to as a “right unfocused image”. The image is concentrated on its right side but not on its left. Following a successful strategy implementation, Figure 14d depicts the procedure for producing the entire in-focus image. To evaluate the performance of the proposed technique, the following parameters are computed: QE, E(F), SSIM, AGF, QAB/F, and CC. The proposed strategy’s performance is then compared to other approaches already published in the literature. The comparison’s findings are displayed in Table 8 of the report. The best results are highlighted in bold, and the literature [20] indicates that the proposed strategy is more effective than existing methods.
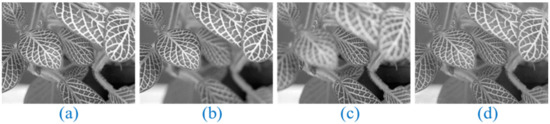
Figure 14.
Multi-focus image of a leaf from various perspectives. Original Image: (a), Multi-focus Input Images: (b,c), and Proposed Fusion: (d).
Table 8.
The results and comparisons for leaf image ([20]).
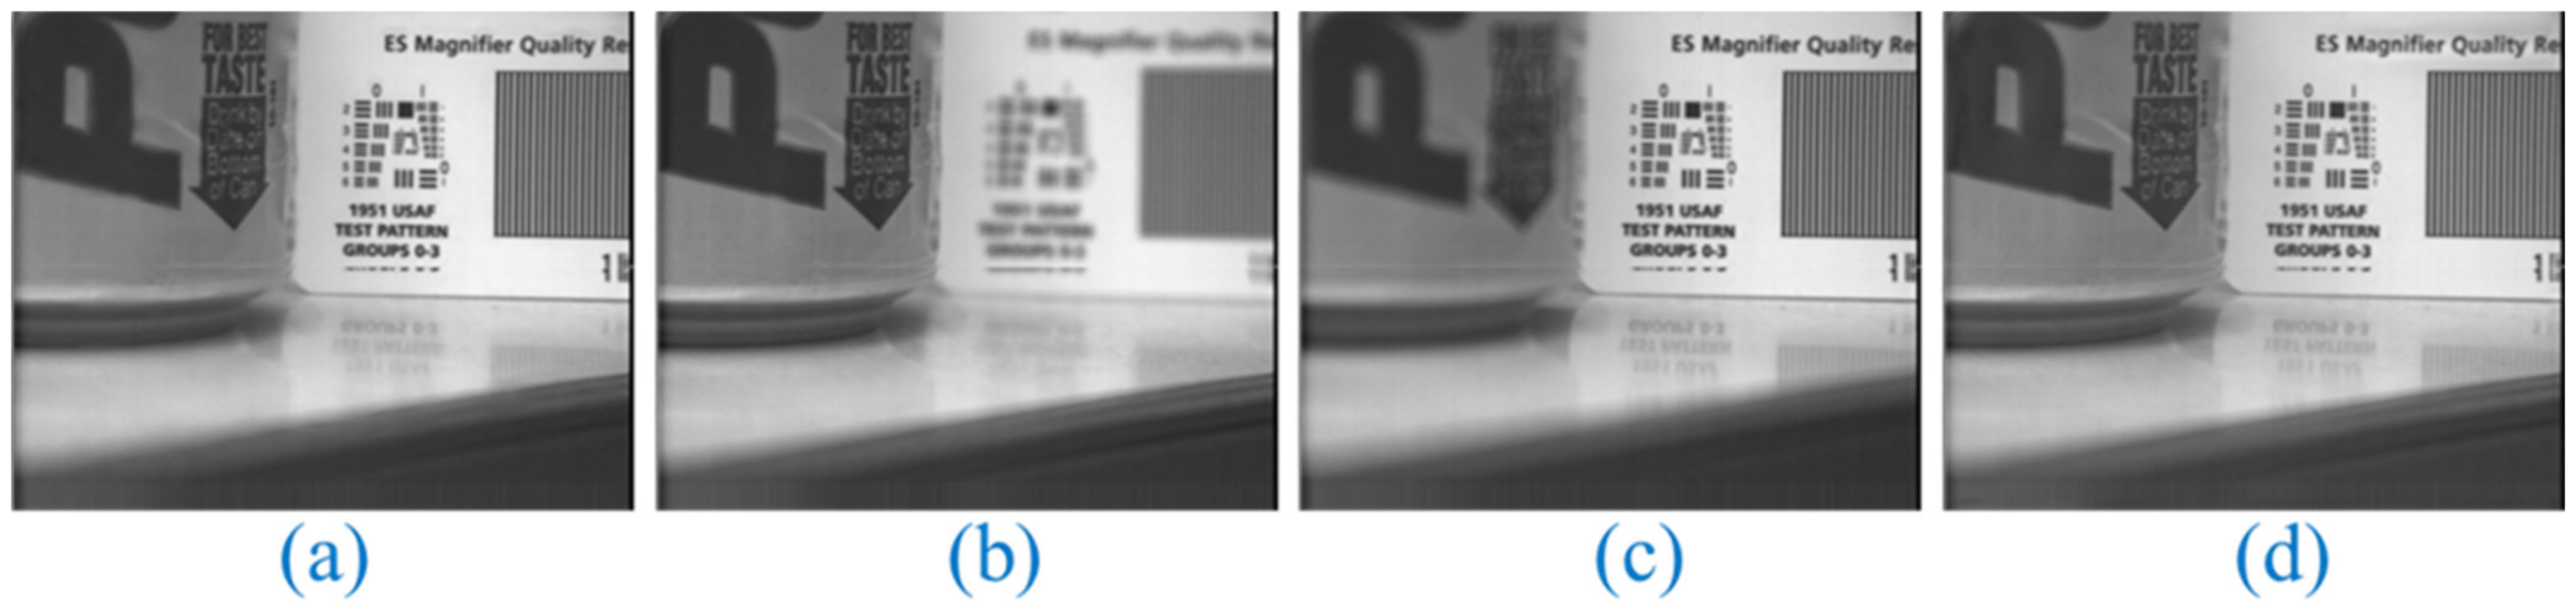
3.8. Comparison of Pepsi Image Fusion with the Literature
Pepsi, which is depicted in Figure 15, is the seventh multi-focus image that is being evaluated. In Figure 15, the original image is depicted in (a). Images with a left focus and a right focus, respectively, are shown in Figure 15b,c. Left-side focus is referred to as a “left focused image”, while the right-side focus is referred to as a “right unfocused image”. The right dominates an image that is right-focused but not left-focused. The approach is put into practice, and the result is the all-in-focus image, as seen in Figure 15d. The proposed methodology’s performance is evaluated using the calculations AGF, and QAB/F. The proposed strategy’s performance is then compared to that of other approaches already published in the literature. The comparison’s findings are displayed in Table 9 of the report. The best results are highlighted in bold, and the literature [4] indicates that the proposed strategy is more effective than existing methods.
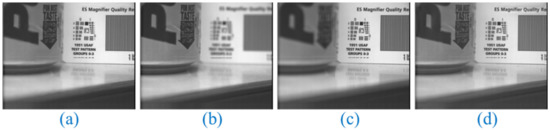
Figure 15.
Multi-focus image of a Pepsi from various perspectives. Original Image: (a), Multi-focus Input Images: (b,c), and Proposed Fusion: (d).
Table 9.
The results and comparisons for Pepsi image ([4]).
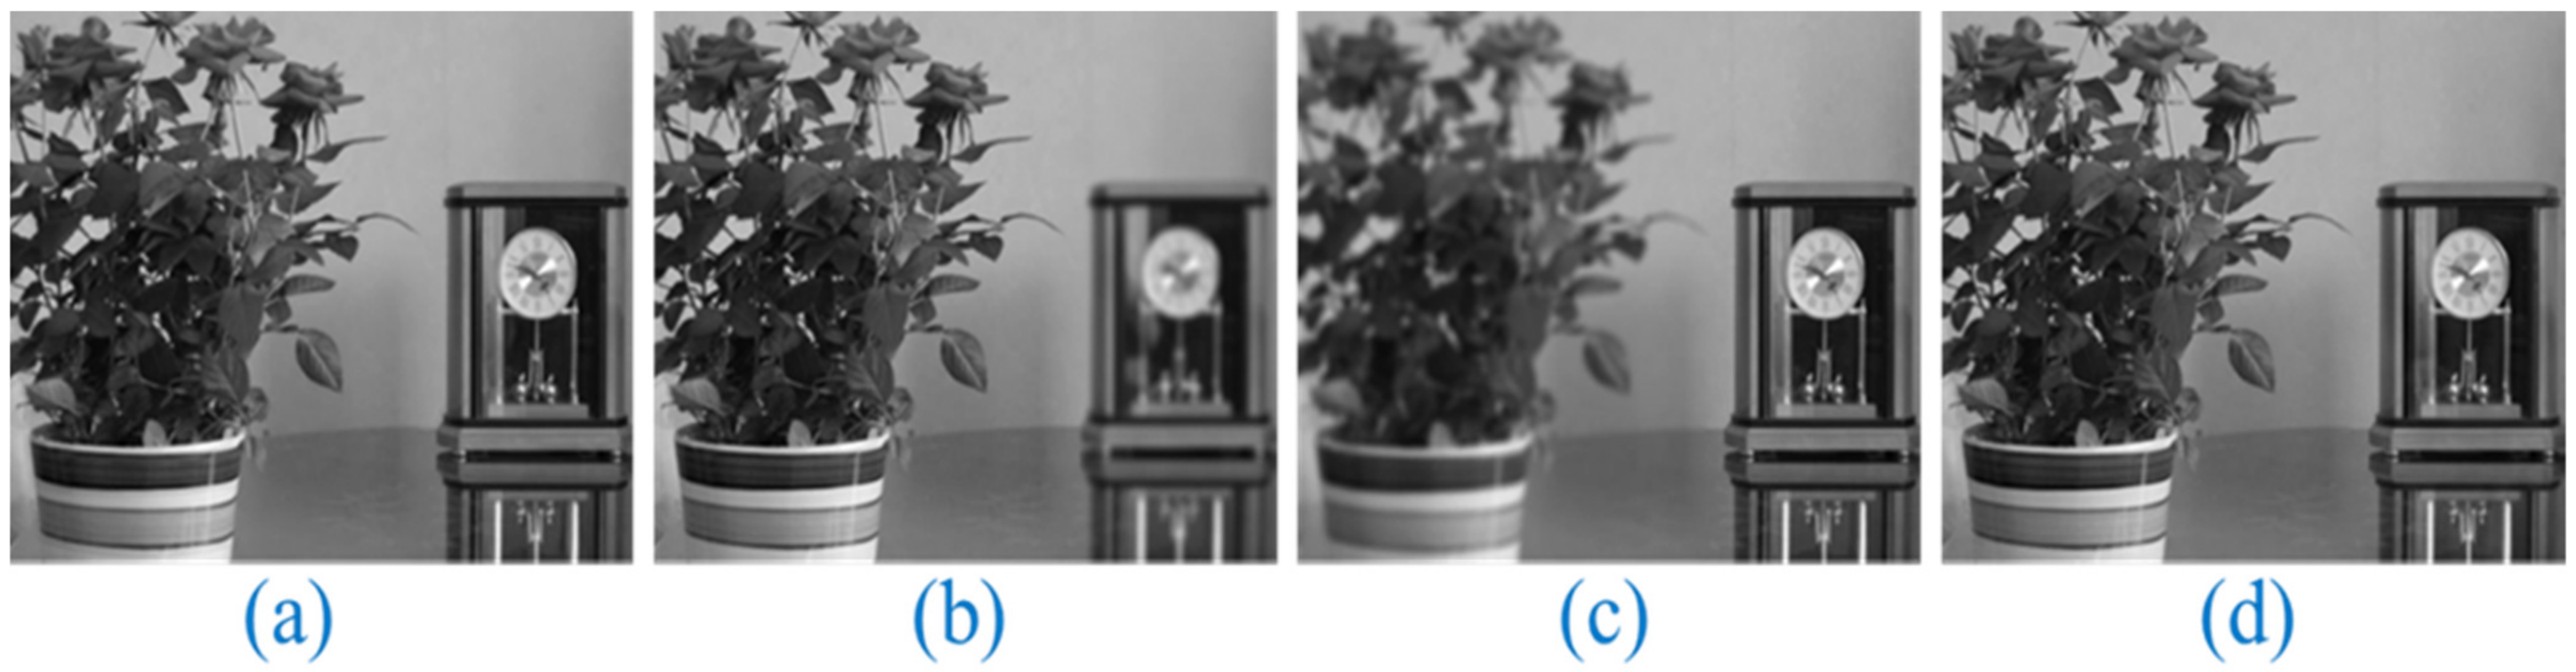
3.9. Comparison of Flowerpot Image Fusion with the Literature
The flowerpot, depicted in Figure 16, is the ninth multi-focus image being evaluated. In Figure 16, the original image is depicted in (a). Images with a left focus and a right focus, respectively, are shown in Figure 16b,c. Left-side focus is referred to as a “left focused image”, while the right-side focus is referred to as a “right unfocused image”. A right-focused image has only its right side considered; the left side has not been taken into consideration. After the technique has been used effectively, Figure 16d illustrates the process of producing the all-in-focus image. The proposed methodology’s performance is evaluated using the following parameters: QW and QE. The proposed strategy’s performance is then compared to that of other approaches already published in the literature. In Table 10 of the report, the comparison’s outcomes are displayed. The best results are highlighted in bold, and the literature [21] indicates that the proposed strategy is more successful than the existing methods.
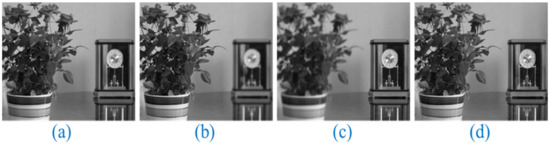
Figure 16.
Multi-focus image of a flowerpot from various perspectives. Original Image: (a), Multi-focus Input Images: (b,c), and Proposed Fusion: (d).
Table 10.
The results and comparisons for flowerpot image ([21]).
3.10. Comparison on More Multi-Focus Image Pairs
Optimal subjective and objective results cannot be achieved with a single method for all possible image pairs. In order to demonstrate the average performance of different methods, the flowing experiment uses eight and ten multi-focus image pairings, respectively (Figure 17 and Figure 18). Image pairs shown in Figure 17 and Figure 18 were processed using the proposed method to create the fused images shown in Figure 19 and Figure 20. As can be seen in Figure 19 and Figure 20, the proposed technique yields satisfactory fusion results for all the examined image pairs. Table 11 and Table 12 provide the average objective evaluation by various methods for the image pairs in Figure 17 and Figure 18. Table 11 and Table 12 display the comparison results. Compared to other methods detailed in the literature [20,22], the proposed method achieves better results, and the most beneficial aspects of each method are highlighted in bold.

Figure 17.
Some multi-focus image pairs.
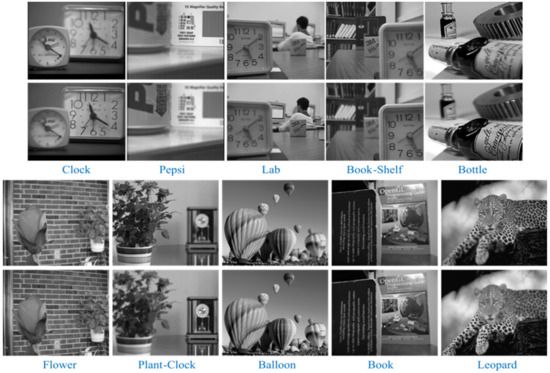
Figure 18.
Some multi-focus image pairs.
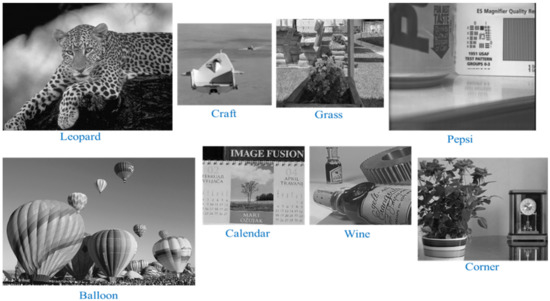
Figure 19.
Fusion results of the proposed method for the multi-focus image pairs shown in Figure 17.
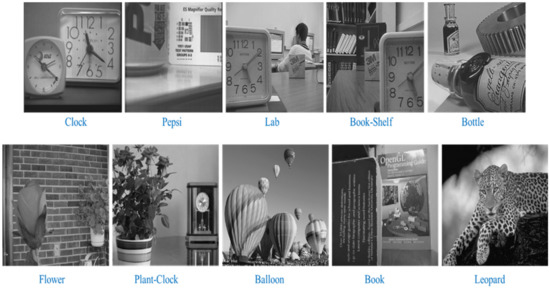
Figure 20.
Fusion results of the proposed method for the multi-focus image pairs shown in Figure 18.
Table 11.
The average objective evaluation of different techniques on multi-focus image pairs ([20]).
Table 12.
The average objective evaluation of different techniques on multi-focus image pairs ([22]).
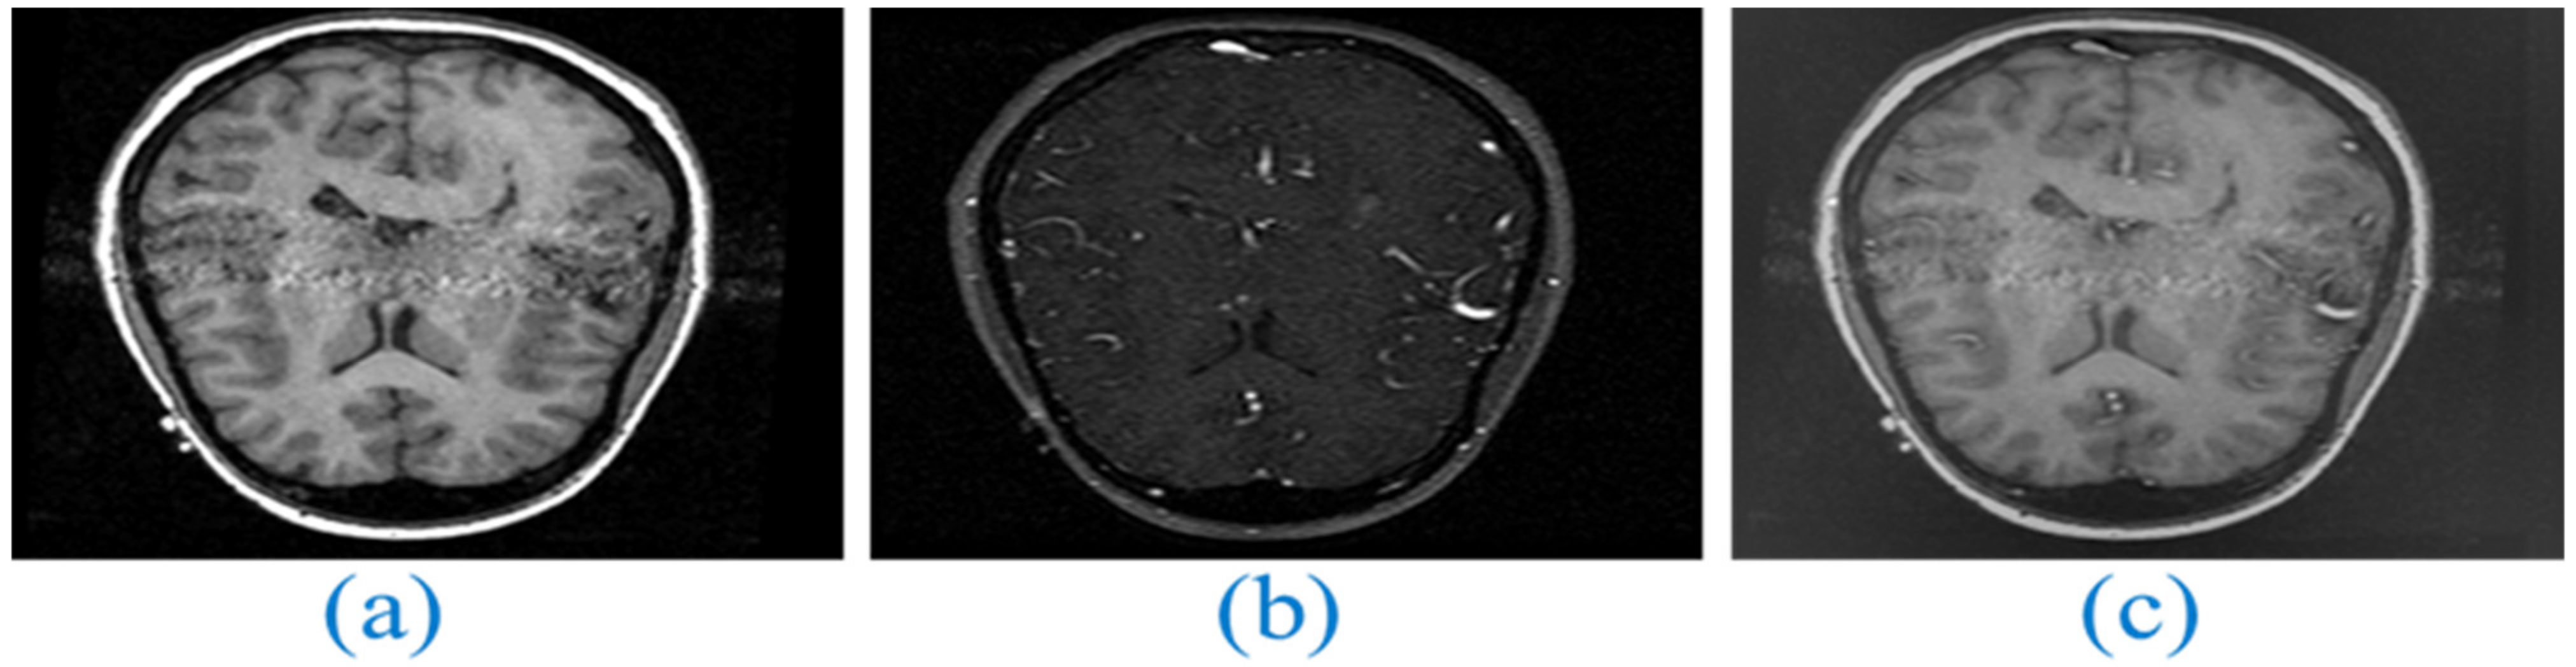
3.11. Test on a Medical Image Pair
In the medical image experiment, we used one image pair from medical image fusion trial to determine how well these methods generalize to other image fusion use cases. In Table 13, the fusion results for the “Medical” image pairings are displayed, while in Figure 21, the corresponding findings for the “Medical” image pairs are visualized. The parameters SSIM, E(F), CC, AGF, QAB/F, and QE are calculated to assess the effectiveness of the proposed methodology. Finally, we compare the proposed method to those already described in the literature. Table 13 presents the comparison results for the report. The best results of each methodology are highlighted in bold, supporting the conclusion that the proposed strategy is superior to the alternatives presented in the literature [20].
Table 13.
The results and comparisons for medical image ([20]).

Figure 21.
Medical Image Pair: (a,b) are source images, (c) Final fused image.
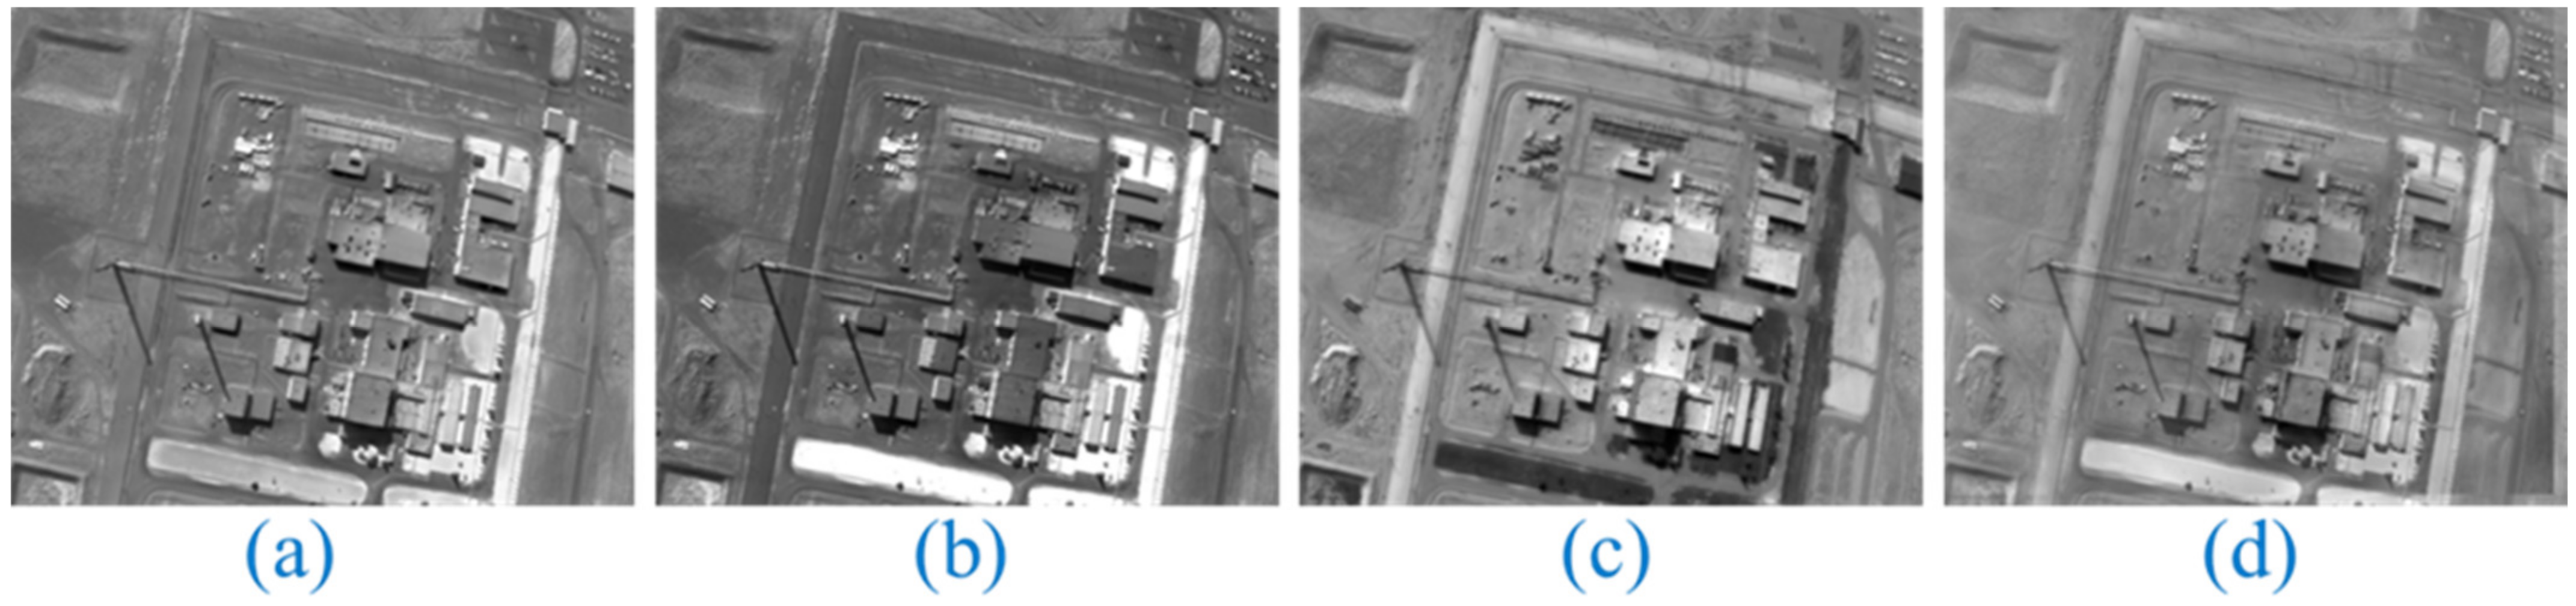
3.12. Test on a Remote Sensing Image Pair
In the remote sensing image experiment, we used one image pair from remote sensing image fusion trial to determine how well these methods generalize to other image fusion use cases. In Table 14, the fusion results for the “Remote sensing” image pairings are displayed, while in Figure 22, the corresponding findings for the “Remote sensing” image pairs are visualized. The parameters SSIM, E(F), CC, AGF, QAB/F, and QE are calculated to assess the effectiveness of the proposed methodology. Finally, we compare the proposed method to those already described in the literature. Table 14 presents the comparison results for the report. The best results of each methodology are highlighted in bold, supporting the conclusion that the proposed strategy is superior to the alternatives presented in the literature [20].
Table 14.
The results and comparisons for remote sensing image ([20]).
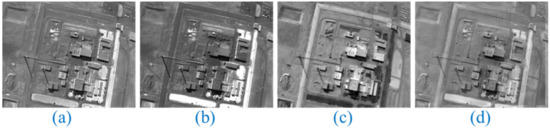
Figure 22.
Multi-focus image of a remote sensing from various perspectives: (a) the original image, (b) the image with the left focus, (c) the image with the right focus, and (d) the image fused using the proposed method.
4. Qualitative Comparison
Quantitative comparison is performed with E(F), QE, QAB/F, SSIM, CC, AGF Q0, SD, EI, ID, and GM. The entropy E(F) measures a fused image’s information content. When the entropy of the combined image is high, there is much information there. Figure 23 shows the value of this measure for several image fusion techniques. The average improvement of the proposed method concerning entropy is 0.39% with reference to PA-DCPCNN [20].
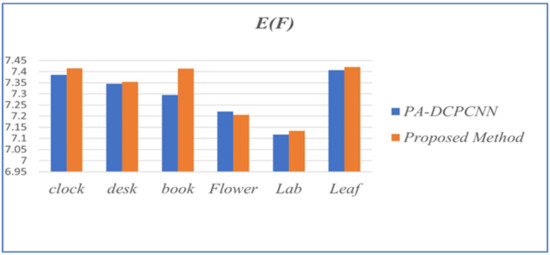
Figure 23.
Performance evaluation of image-fusion techniques in reference to E(F).
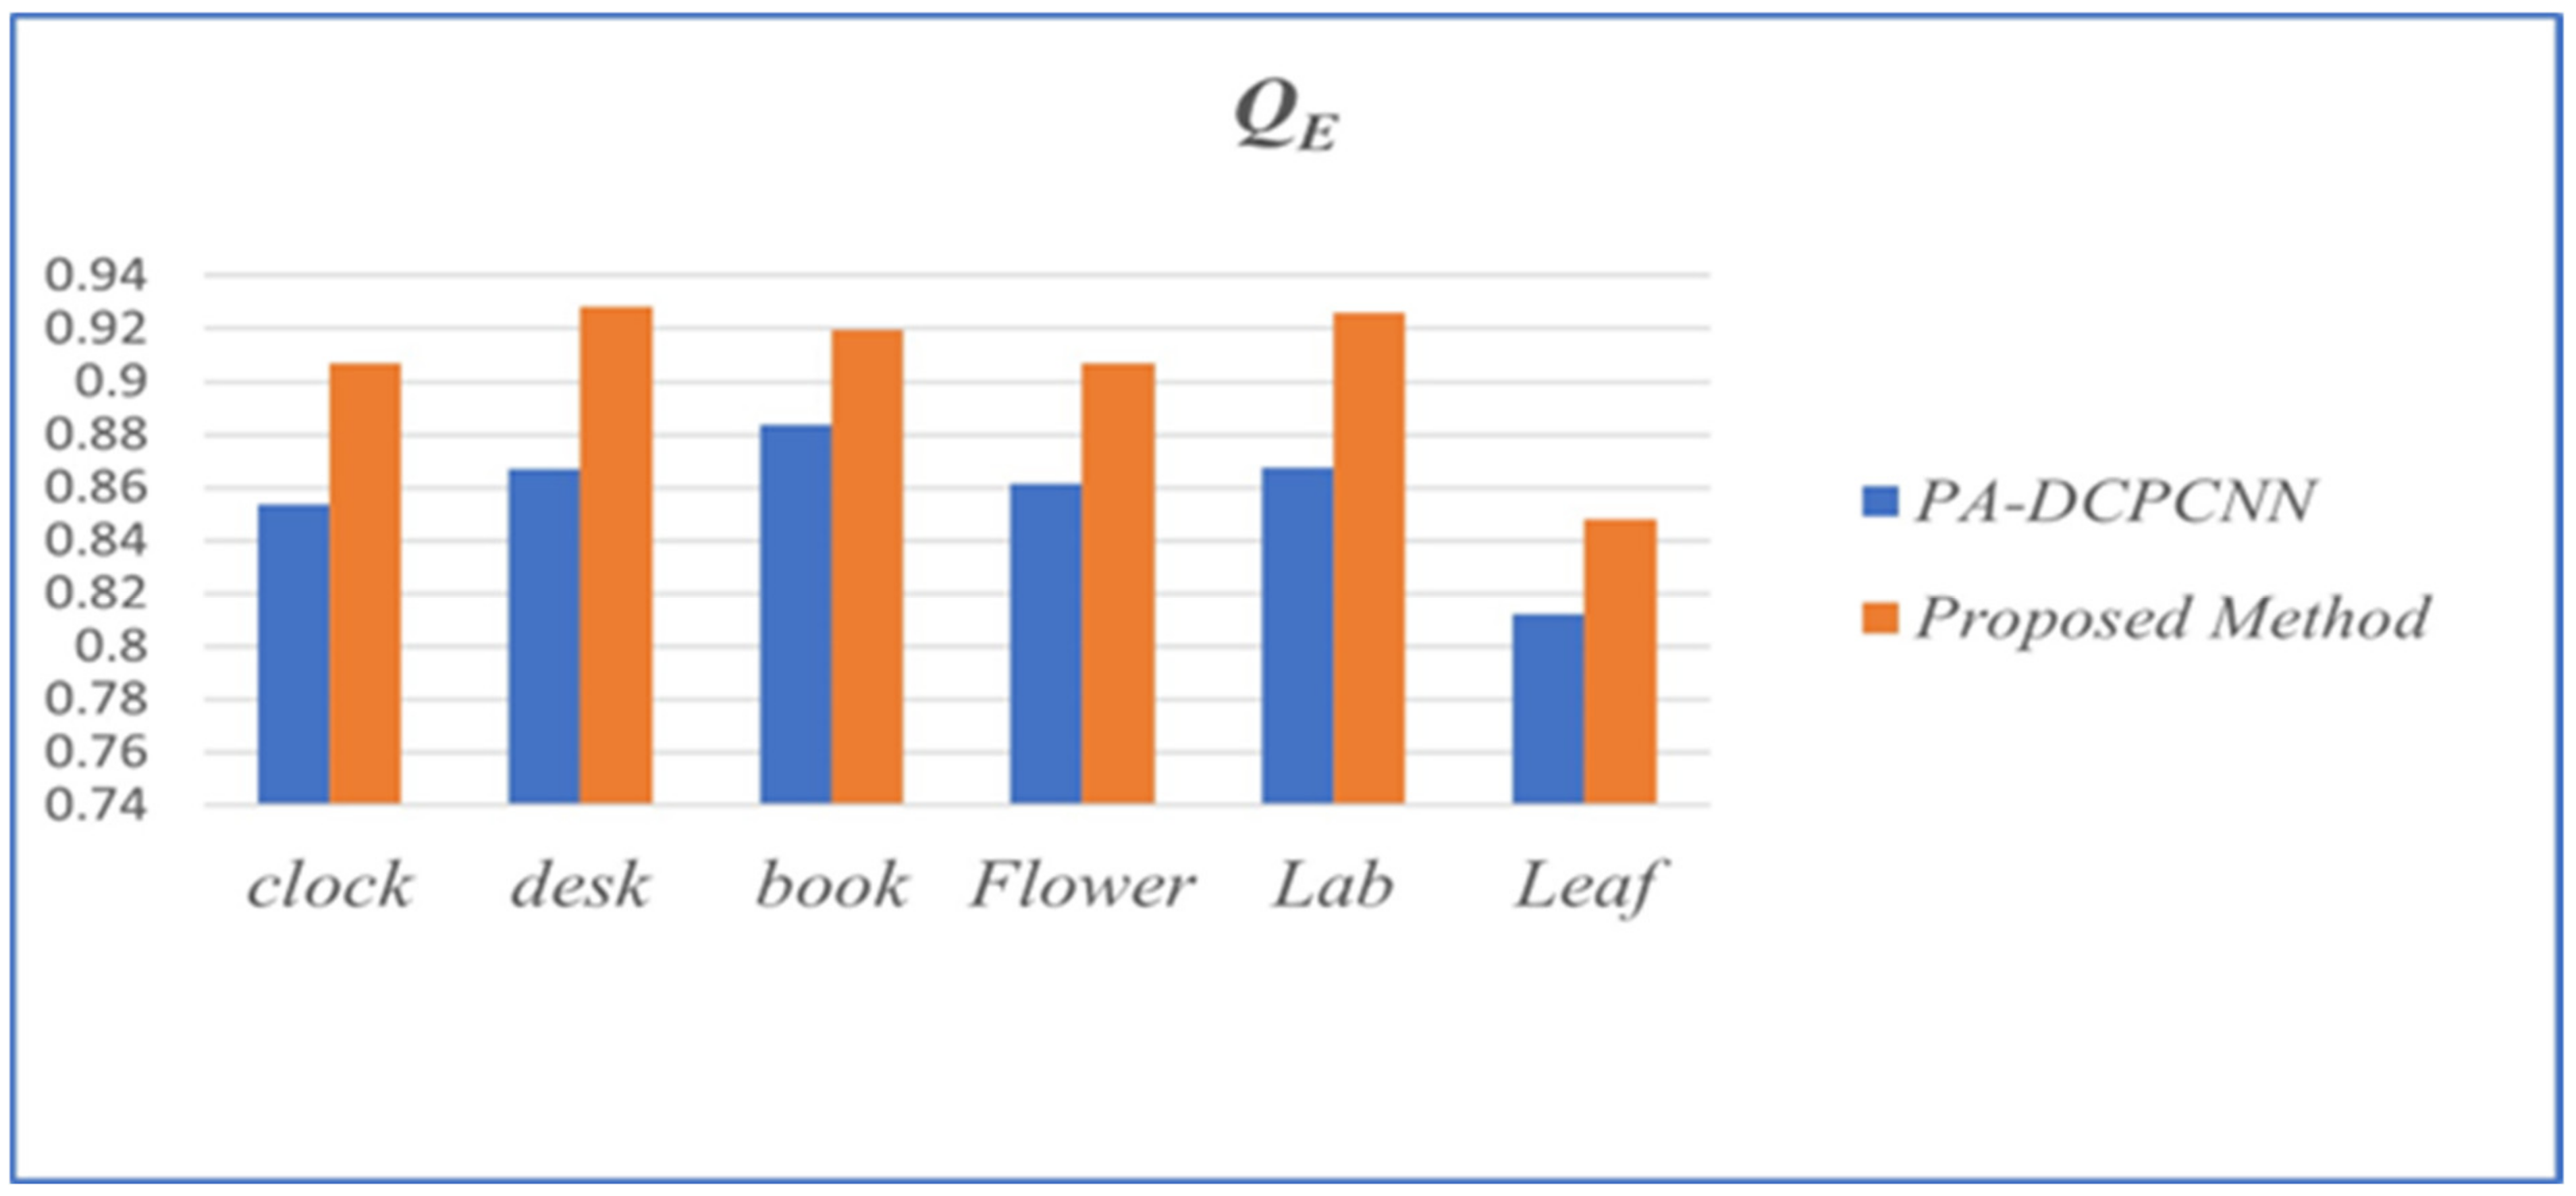
QE quantifies the edge-dependent fusion quality index of the fused image. A higher QE indicates a more effective fusion strategy. Figure 24 illustrates the significance of this statistic across several image fusion approaches. The average improvement of the proposed method concerning QE is 5.32% with reference to PA-DCPCNN [20].

Figure 24.
Performance evaluation of image-fusion techniques in reference to QE.
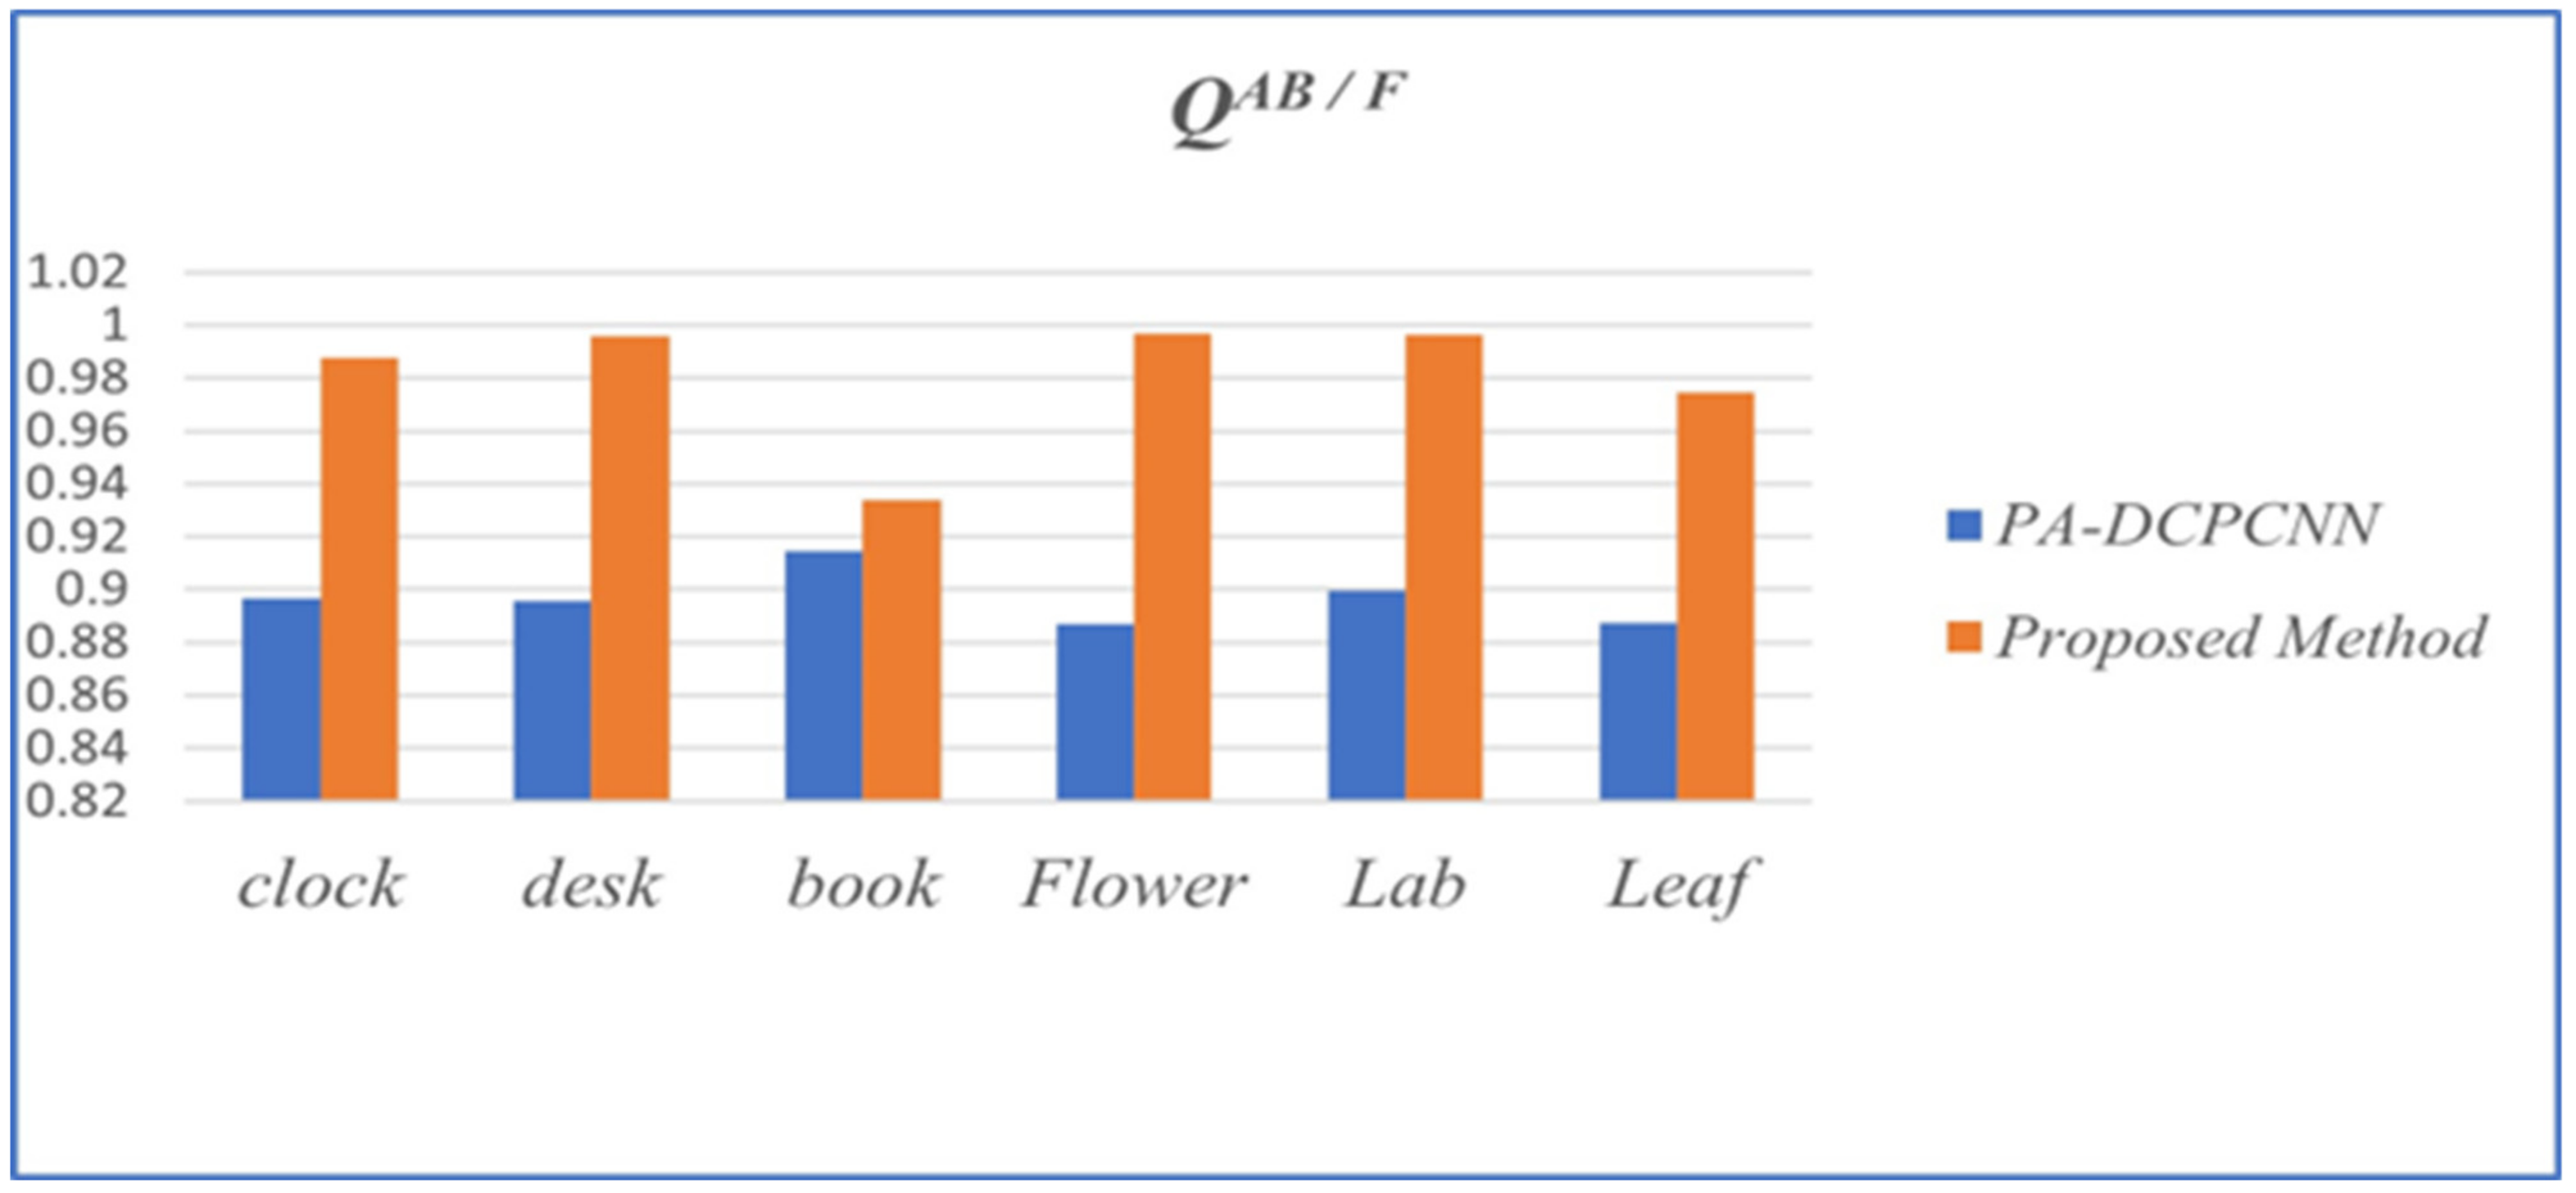
The amount of edge information (QAB/F) carried by the fused image within the source images is calculated by total-fusion performance. A larger value of QAB/F is desired. Figure 25 illustrates this metric’s value for several image fusion techniques. The average improvement of the proposed method concerning QAB/F is 8.56% with reference to PA-DCPCNN [20].

Figure 25.
Performance evaluation of image-fusion techniques in reference to QAB/F.
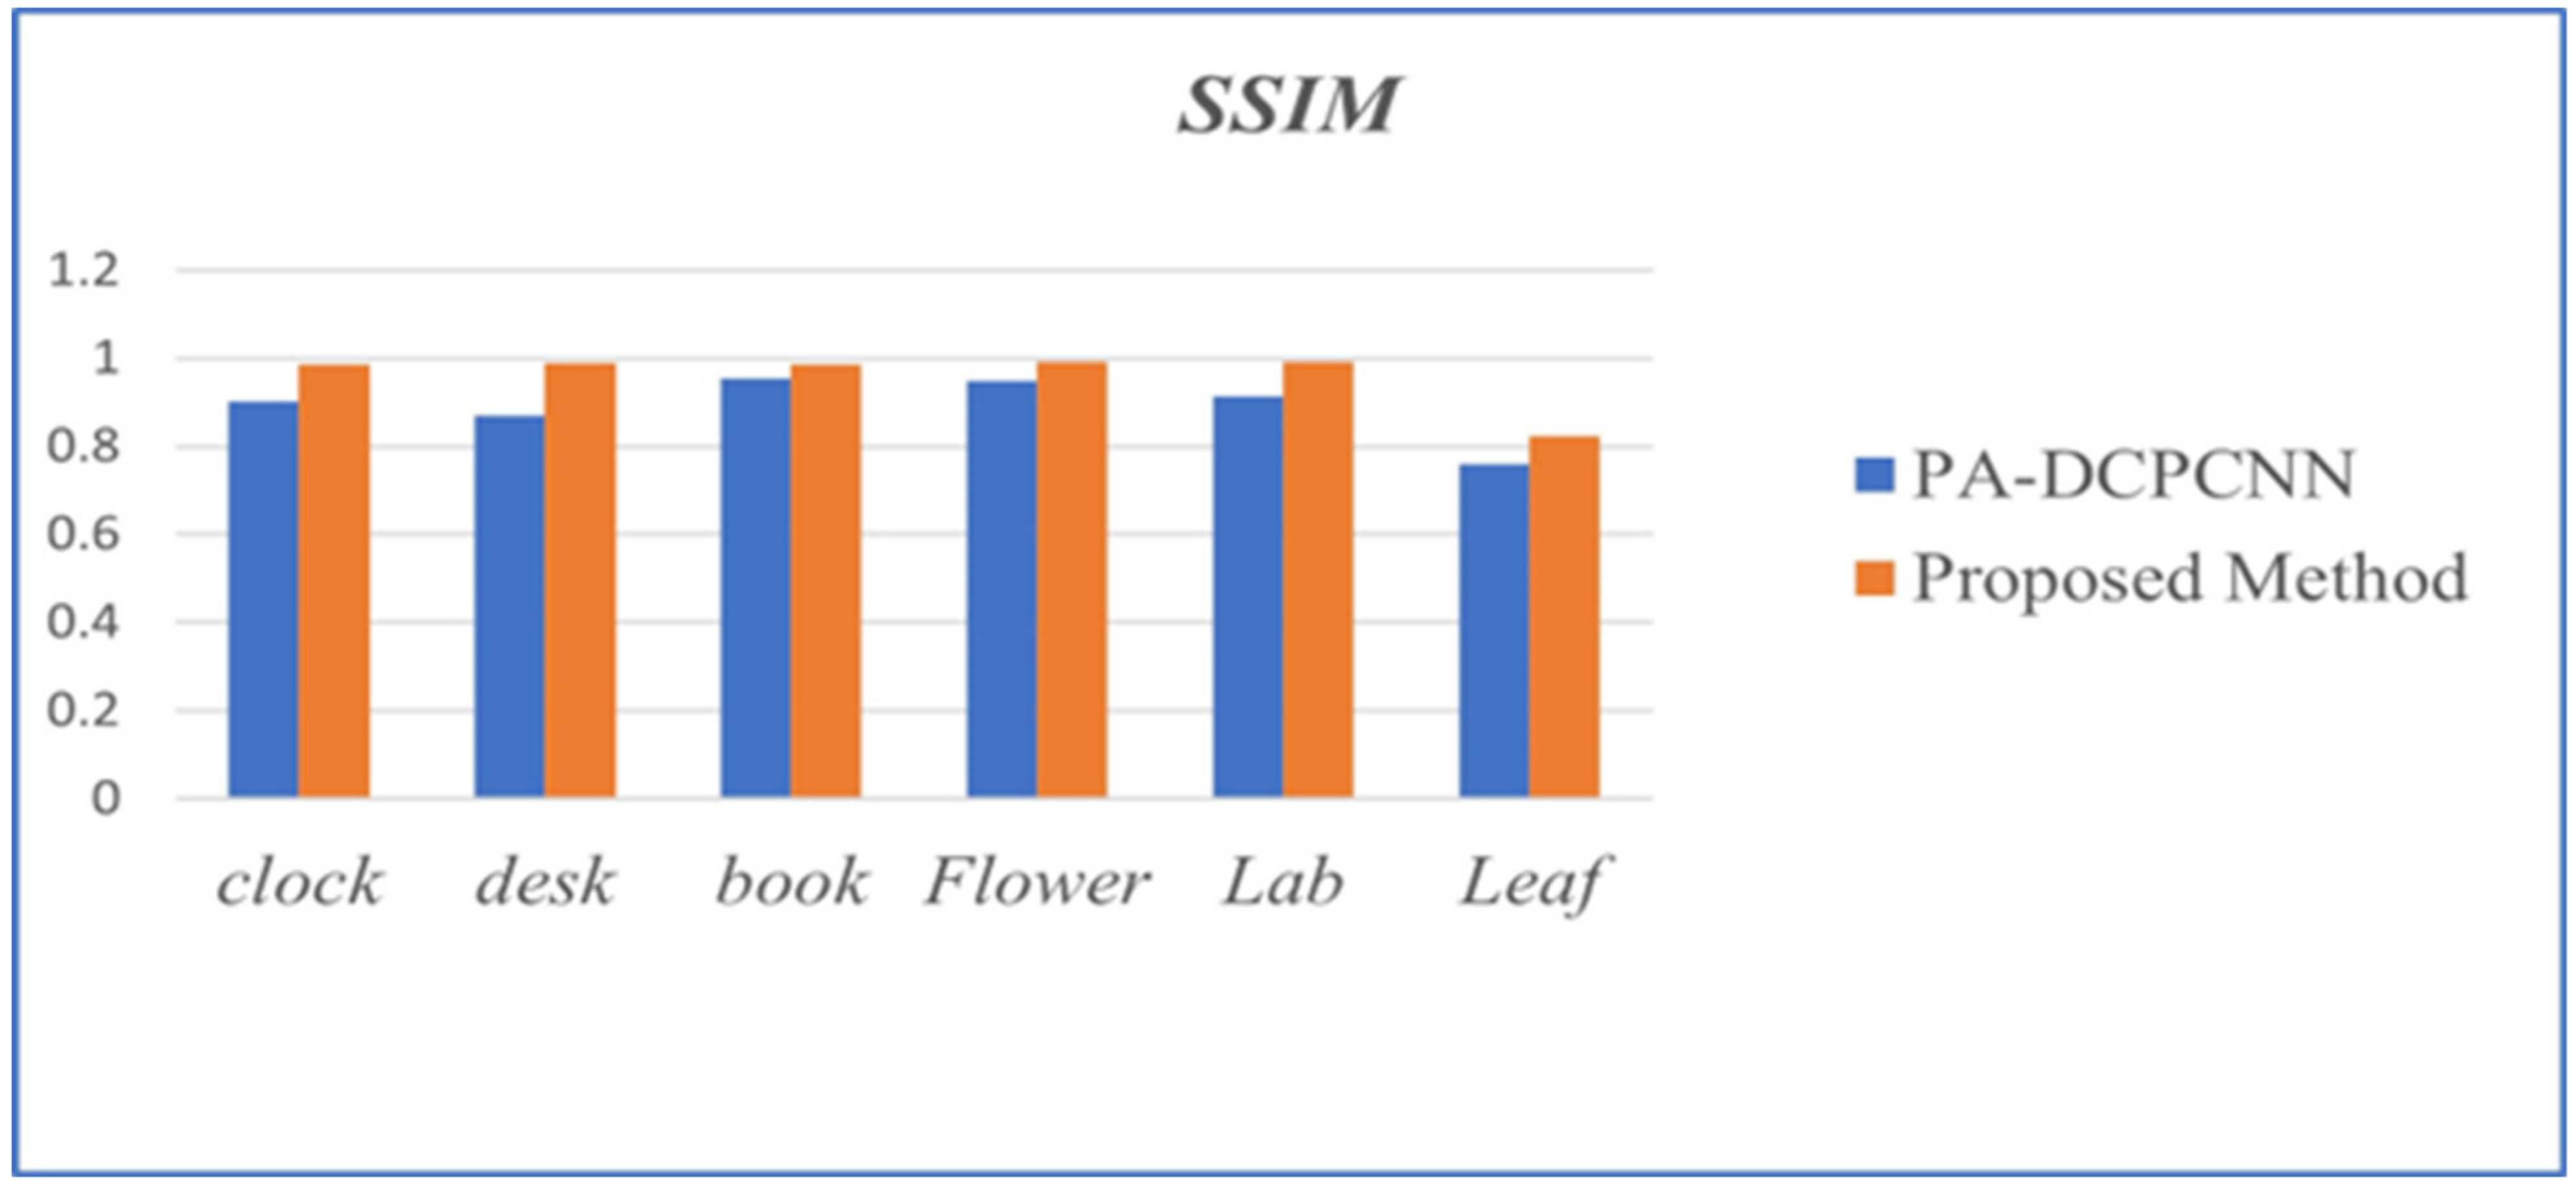
The structural similarity index measure (SSIM) is used to evaluate the degree to which the reference and fused images have comparable pixel intensities patterns locally. If the value is 1, it means that the reference image and the fused image are analogous. Figure 26 illustrates the relative importance of this metric in comparison with other image fusion techniques. The average improvement of the proposed method concerning SSIM is 7.32% with reference to PA-DCPCNN [20].

Figure 26.
Performance evaluation of image-fusion techniques in reference to SSIM.
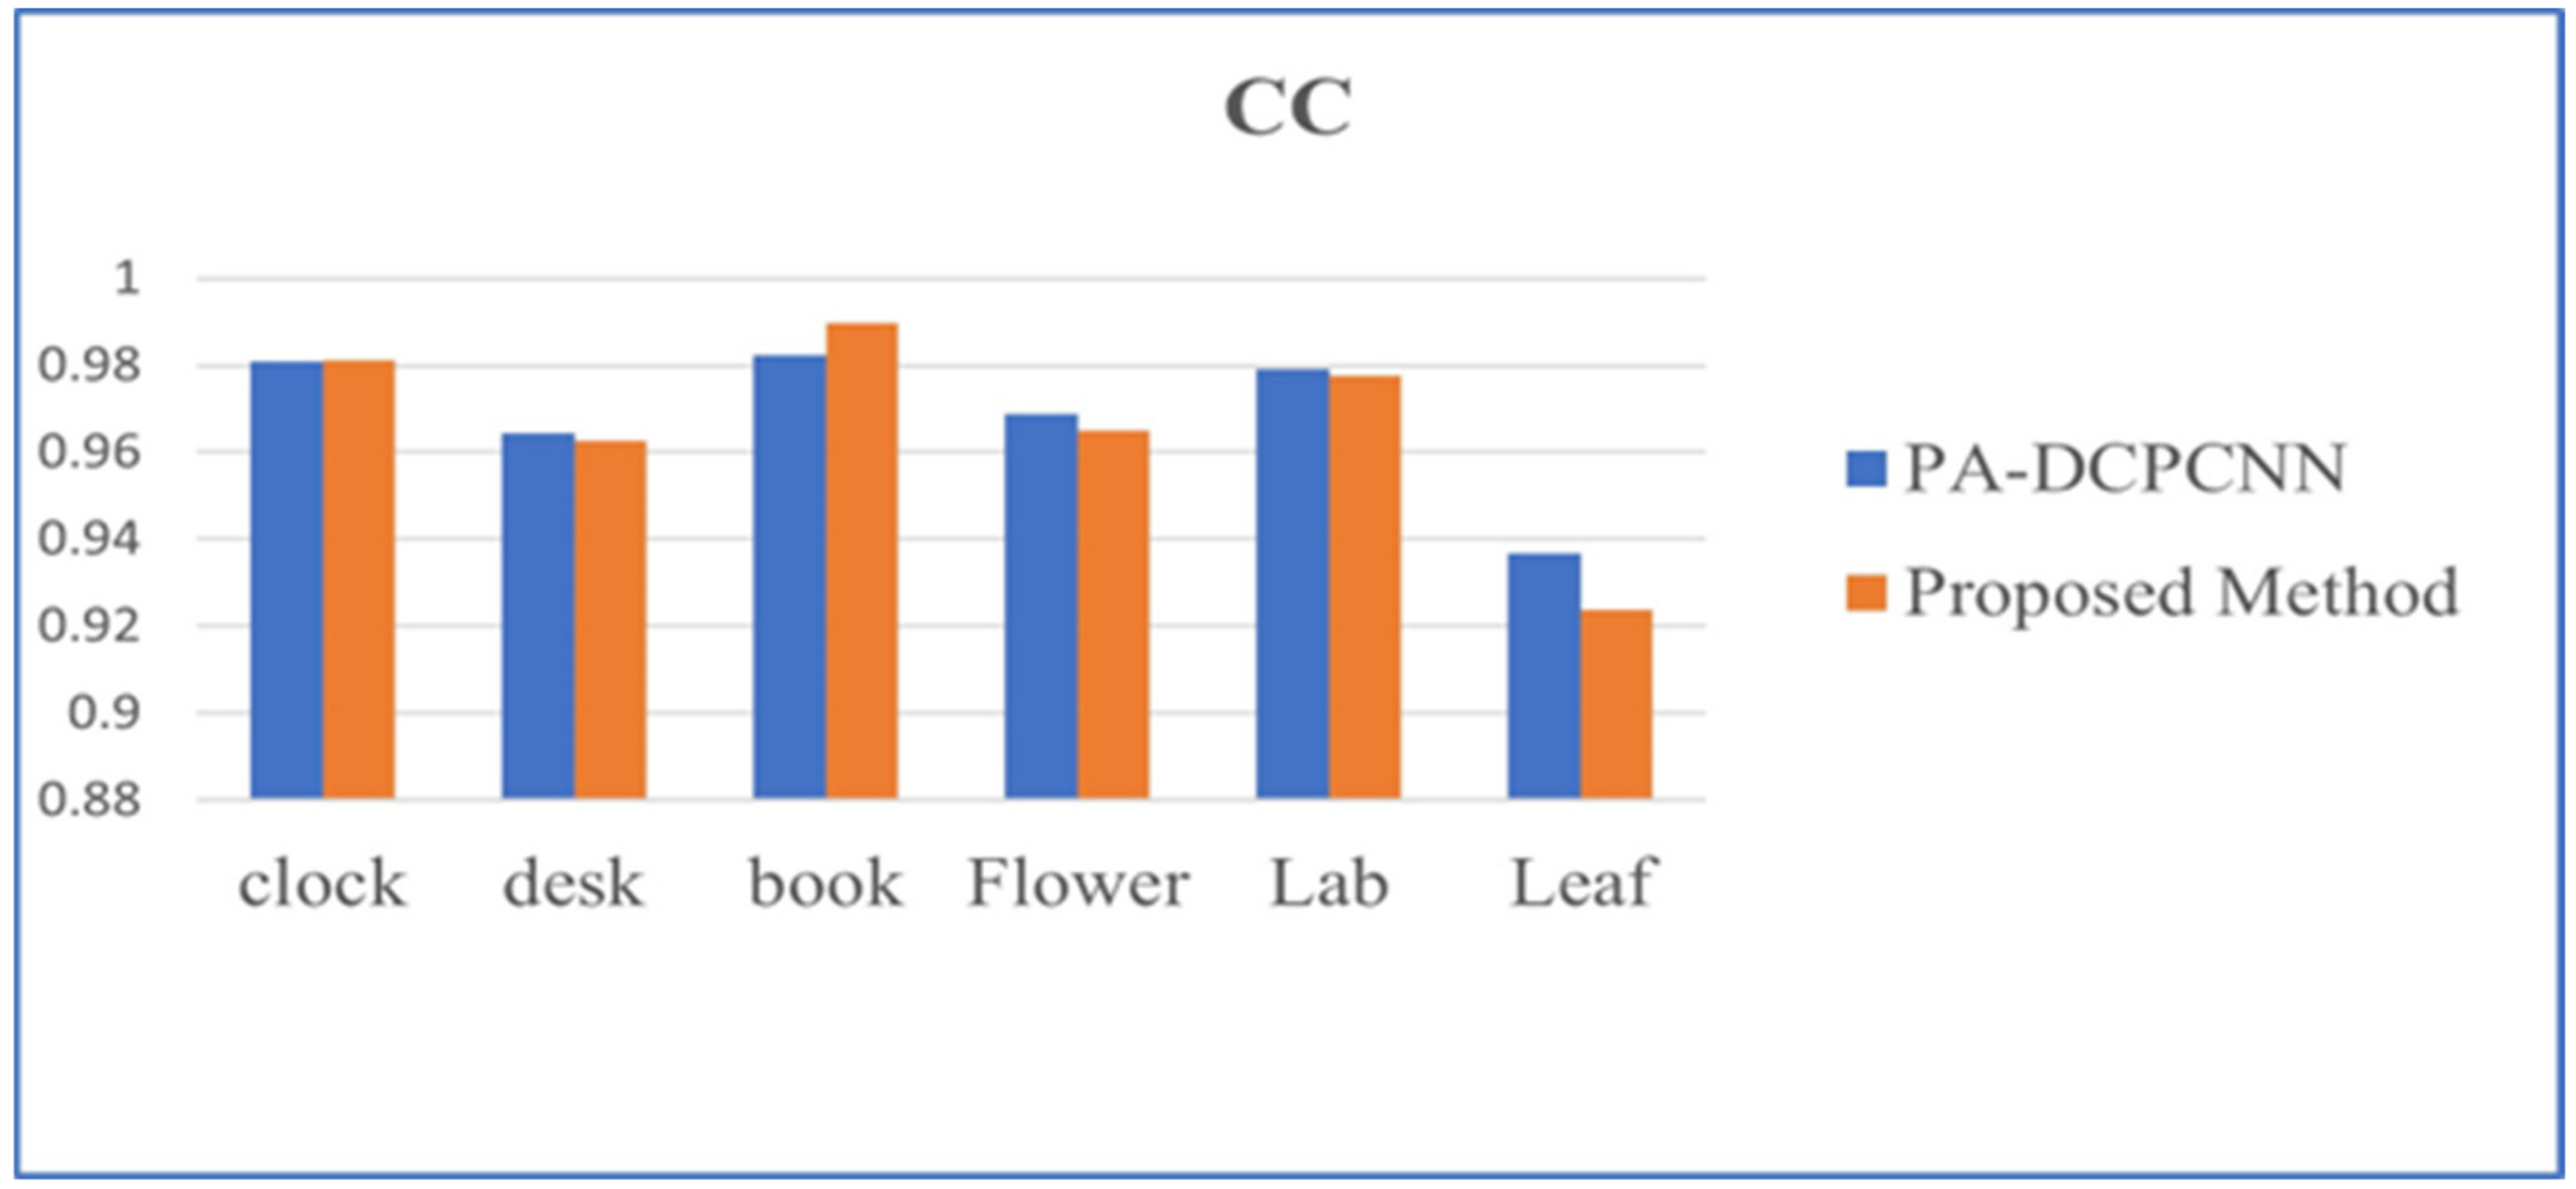
The correlation coefficient (CC) measures the degree to which the reference and fused images have the same spectral characteristics. Higher values of CC mean that the fusion method is better. Figure 27 illustrates the relative importance of this metric in comparison with other image fusion techniques. For this parameter, the resultant average value is less than PA-DCPCNN because this indicates that variables move in the opposite direction [20].
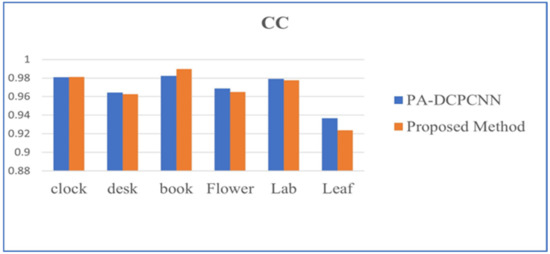
Figure 27.
Performance evaluation of image-fusion techniques in reference to CC.
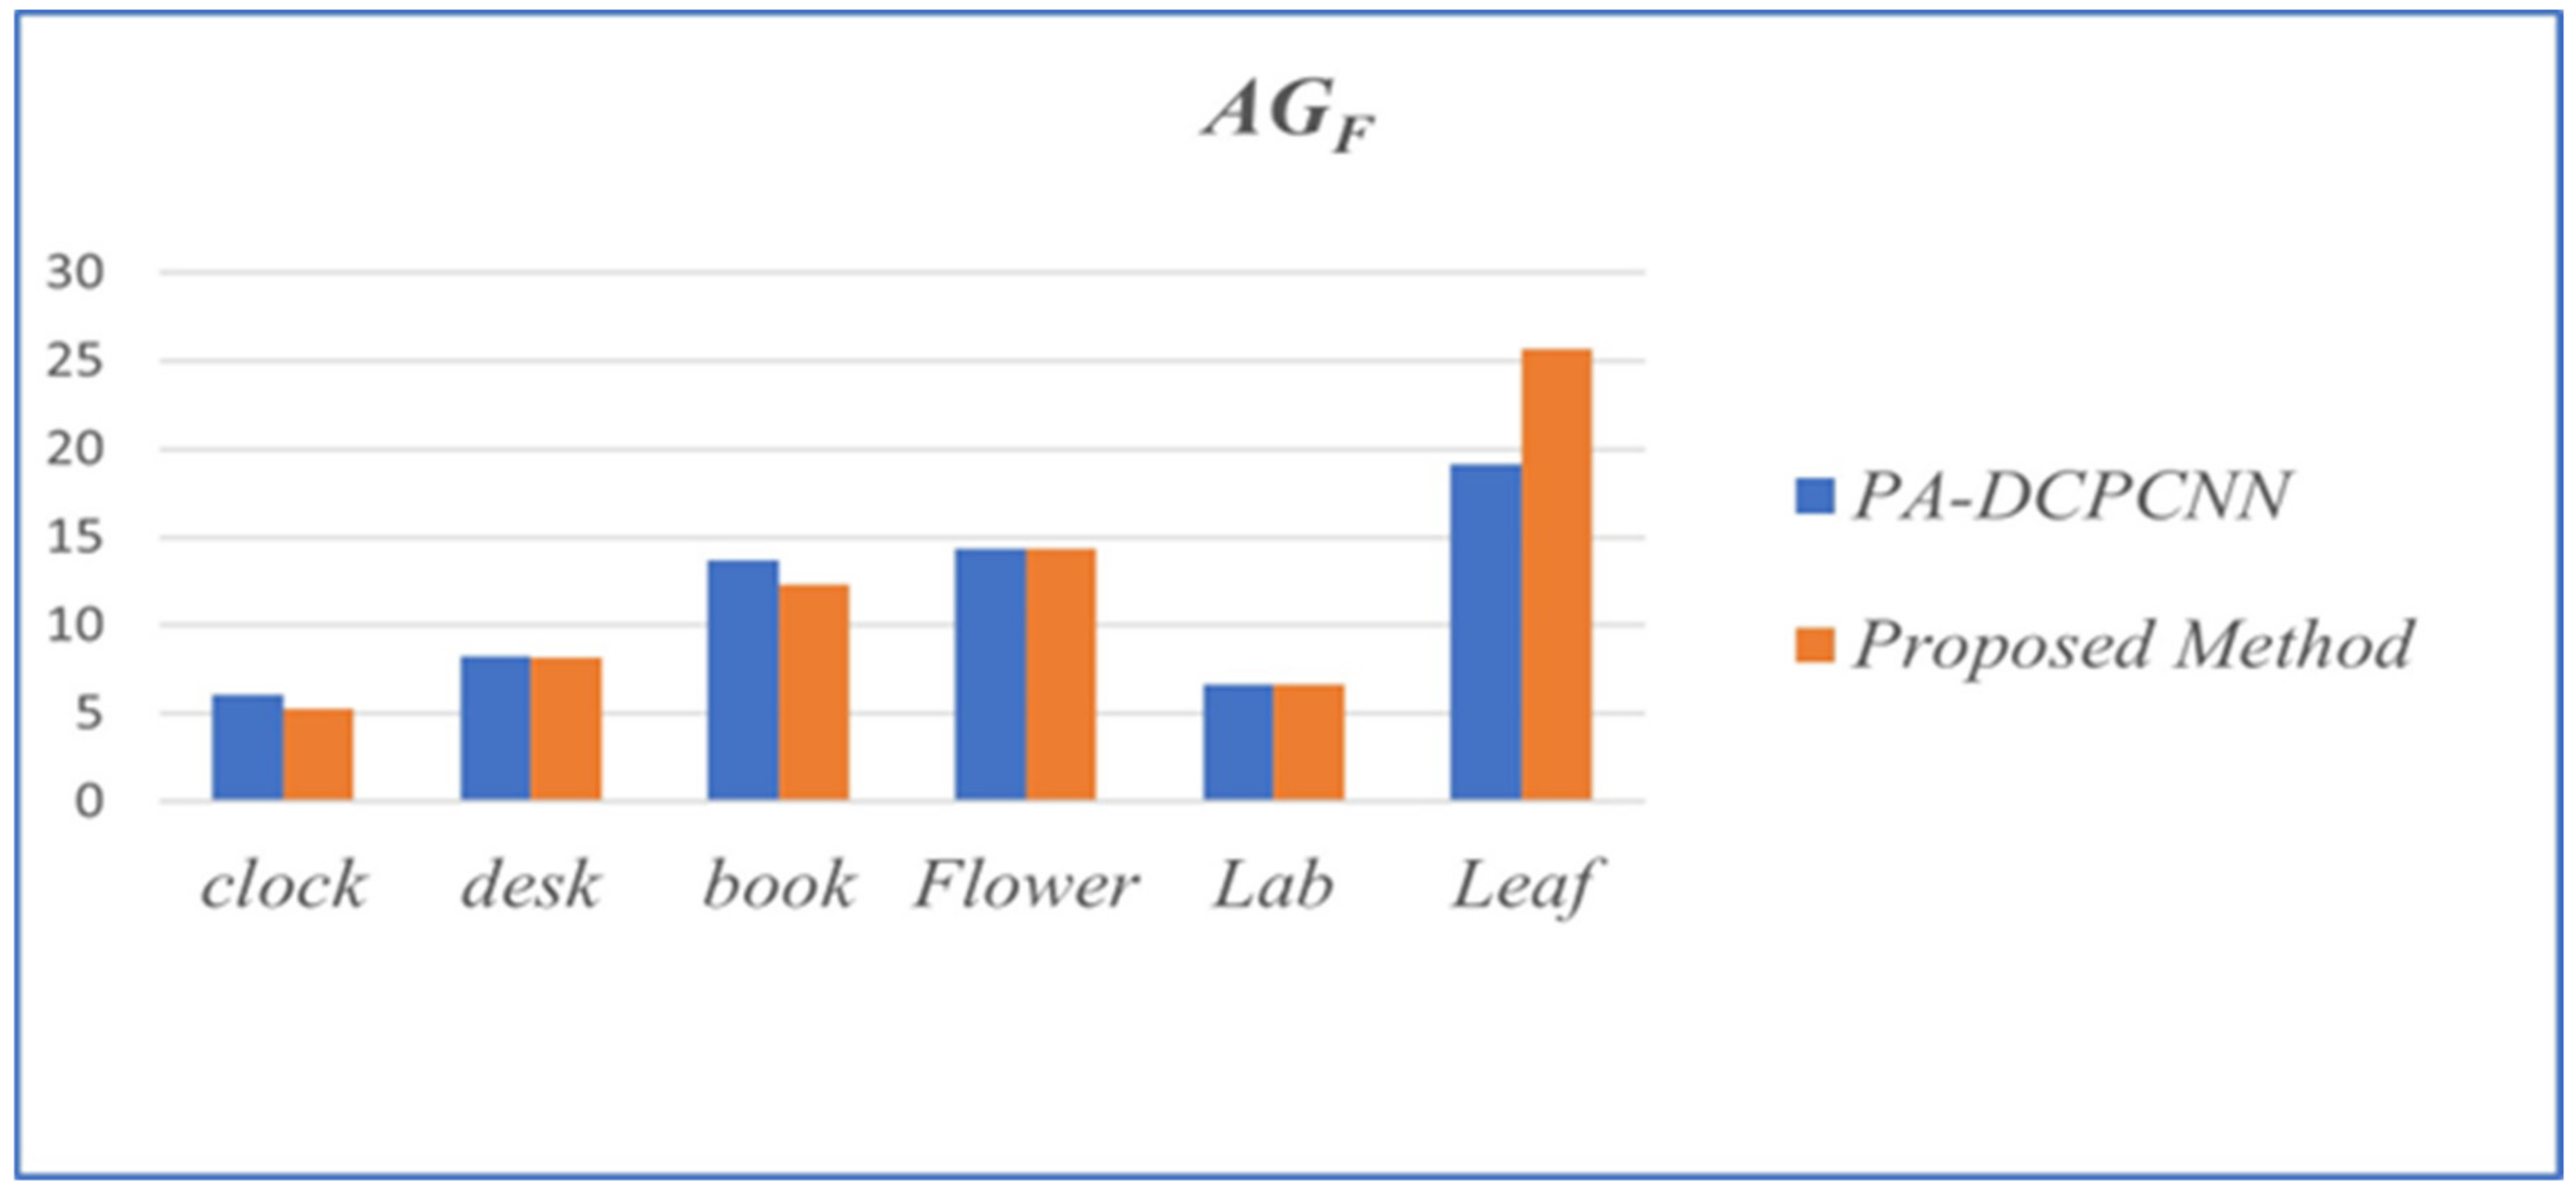
The average gradient (AGF) quantitatively represents the fused image’s detail and texture components. The fused image has increased sharpness and clarity proportional to the value of the AGF. Figure 28 illustrates the relative performance of various image fusion techniques based on this metric’s value. The average improvement of the proposed method concerning AGF is 5.95% with reference to PA-DCPCNN [20].
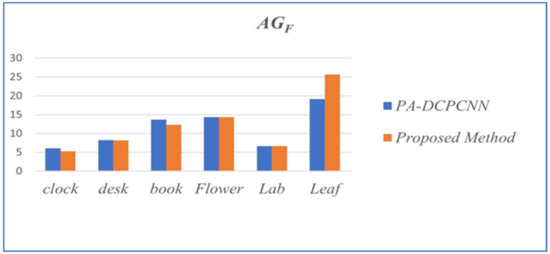
Figure 28.
Performance evaluation of image-fusion techniques in reference to AGF.
The evaluation of different fusion methods for different parameters based on their average values is depicted in Figure 29. Concerning QE, the proposed method is 19.50%, 22.89%, 22.17%, and 24.83% superior compared to methods 1, 2, 3, and 4, respectively. Concerning AG, the proposed method is 39.26%, 39.19%, 39.28%, and 38.50% superior compared to methods 1, 2, 3, and 4, respectively. Concerning Q0, the proposed method is 11.41%, 12.50%, 9.50%, and 11.23% superior compared to methods 1, 2, 3, and 4, respectively. Concerning QAB/F, the proposed method is 21.69%, 24.98%, 23.45%, and 25.58% superior compared to methods 1, 2, 3, and 4, respectively. Concerning GM, the proposed method is 0.27% superior compared to method 1. Concerning SD, the proposed method is 1.70%, 1.54%, 1.35%, and 1.19% superior compared to methods 1, 2, 3, and 4, respectively [22].
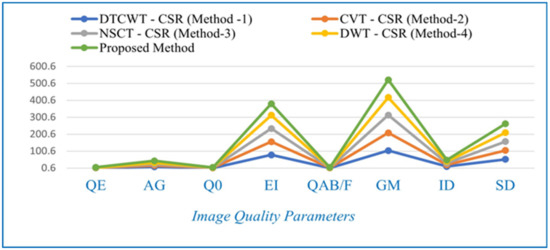
Figure 29.
Evaluation of different fusion methods for different parameters based on them average values.
Computational Efficiency
All of the experiments are carried out in MATLAB R2018b on a computer equipped with an Intel(R)-Core (TM) i5-11320H CPU operating at 3.20 GHz and 16 gigabytes of random-access memory (RAM). Comparing the average amounts of time these various methods take to compute results gives an evaluation of the computational burdens imposed by both existing and proposed approaches. Table 15 contains information on the typical amount of time required to complete these approaches. Since the proposed method integrates SWT, DTCWT, and TEM, the amount of time needed to complete the computations is significantly reduced. As a result, the proposed method has a shorter amount of computing time than existing methods [20].
Table 15.
Average running time (in seconds) of different methods.
5. Conclusions
In this paper, TEM laws are used in the hybrid wavelet domain combination of SWT and DTCWT to overcome the drawbacks of the PA-DCPCNN and MST-CSR based methods. The proposed work is implemented on standard images. As a result of using a hybrid algorithm with TEM, the proposed fused image can achieve higher visual quality when compared to input images because of its good directionality and a high degree of shift invariance. It is compared with recently published image fusion methods: PA-DCPCNN, and MST-CSR (i.e., DWT-CSR, DTCWT-CSR, CVT-CSR, and NSCT-CSR). The quantitative comparison with fusion quality metrics shows that the proposed method is better than the state-of-the-art methodologies. The detailed representation of the fusion outcome shows that the proposed method gives more information. The use of the fused images makes it easier to perform operations and understand the results. Further, the proposed method may combine deep learning algorithms with different colour spaces.
Author Contributions
Conceptualization, C.R.M.; methodology, C.R.M., S.K. and V.; Coding, C.R.M.; validation, S.K., V. and C.R.M.; investigation, S.K. and V.; resources, C.R.M.; writing—original draft preparation, C.R.M. and S.K.; writing—review and editing, C.R.M., S.K. and V. All authors have read and agreed to the published version of the manuscript.
Funding
This research received no external funding.
Institutional Review Board Statement
Not applicable.
Informed Consent Statement
Not applicable.
Data Availability Statement
Data can be available on request.
Acknowledgments
As the first author, I convey my acknowledgement to C. Rajendra (HOD), G. Srinivasulu Reddy (Principal), A.V.S. Prasad (Director) and management of NECN (Narayana Engineering College, Nellore) for their support.
Conflicts of Interest
The authors declare no conflict of interest.
References
- Mathavan, S.; Kumar, A.; Kamal, K.; Nieminen, M.; Shah, H.; Rahman, M. Fast segmentation of industrial quality pavement images using laws texture energy measures and k-means clustering. J. Electron. Imaging 2016, 25, 5. [Google Scholar] [CrossRef]
- Mohan, C.R.; Kiran, S.; Vasudeva, A. Strategic Approach for 2D Texture Analysis using DTCWT, SWT and GLCM. J. Sci. Technol. 2022, 07, 195–209. [Google Scholar] [CrossRef]
- Dash, S.; Jena, U.R. Texture classification using Steerable Pyramid based Laws’ Masks. J. Electr. Syst. Inf. Technol. 2016, 4, 185–197. [Google Scholar] [CrossRef]
- Aymaz, S.; Köse, C. A novel image decomposition-based hybrid technique with super-resolution method for multi-focus image fusion. Inf. Fusion 2019, 45, 113–127. [Google Scholar] [CrossRef]
- Mohan, C.R.; Kiran, S.; Vasudeva. Quality Enhancement of Multifocus & Medical Images Using Hybrid Wavelets Based Fusion for Bioengineering Applications. Biosc. Biotech. Res. Comm. 2022, 15, 4. [Google Scholar] [CrossRef]
- Yang, Y.; Tong, S.; Huang, S.; Lin, P. Dual-Tree Complex Wavelet Transform and Image Block Residual-Based Multi-Focus Image Fusion in Visual Sensor Networks. Sensors 2014, 14, 22408–22430. [Google Scholar] [CrossRef]
- Mohan, C.R.; Kiran, S.; Kumar, A.A. Multi-Focus Image Fusion Method with QshiftN-DTCWT and Modified PCA in Frequency Partition Domain. ICTACT J. Image Video Proc. 2020, 11, 2275–2282. [Google Scholar] [CrossRef]
- Mohan, C.R.; Kiran, S.; Vasudeva; Kumar, A.A. All-in-Focus Imaging using qshiftN DTCWT and LP in the Frequency Partition Domain. In Proceedings of the 2022 9th International Conference on Computing for Sustainable Global Development (INDIACom), New Delhi, India, 23–25 March 2022; pp. 754–759. [Google Scholar] [CrossRef]
- Radha, N.; Babu, T.R. Performance evaluation of quarter shift dual tree complex wavelet transform based multifocus image fusion using fusion rules. Int. J. Electr. Comput. Eng. 2019, 9, 2358–2377. [Google Scholar] [CrossRef]
- Kvyetnyy, R.; Sofina, O.; Olesenko, A.; Komada, P.; Sikora, J.; Kalizhanova, A.; Smailova, S. Method of image texture segmentation using Laws’ energy measures. In Proceedings of the Photonics Applications in Astronomy, Communications, Industry, and High Energy Physics Experiments, Wilga, Poland, 28 May–6 June 2017; Volume 10, pp. 1784–1792. [Google Scholar] [CrossRef]
- Govindaraj, P.; Sudhakar, M.S. Shape characterization using laws of texture energy measures facilitating retrieval. Imaging Sci. J. 2017, 66, 98–105. [Google Scholar] [CrossRef]
- Kamal, K.; Qayyum, R.; Mathavan, S.; Zafar, T. Wood defects classification using laws texture energy measures and supervised learning approach. Adv. Eng. Inform. 2017, 34, 125–135. [Google Scholar] [CrossRef]
- Mahesh, V.G.V.; Chen, C.; Rajangam, V.; Raj, A.N.J.; Krishnan, P.T. Shape and Texture Aware Facial Expression Recognition Using Spatial Pyramid Zernike Moments and Law’s Textures Feature Set. IEEE Access 2021, 9, 52509–52522. [Google Scholar] [CrossRef]
- Ganasala, P.; Prasad, A.D. Functional and Anatomical Image Fusion based on Texture Energy Measures in NSST Domain. In Proceedings of the 2020 First International Conference on Power, Control and Computing Technologies (ICPC2T), Raipur, India, 3–5 January 2020; pp. 417–420. [Google Scholar] [CrossRef]
- Ganasala, P.; Prasad, A.D. Medical image fusion based on laws of texture energy measures in stationary wavelet transform domain. Int. J. Imaging Syst. Technol. 2019, 1, 14. [Google Scholar] [CrossRef]
- Dash, S.; Jena, U. Multi-resolution Laws’ Masks based texture classification. J. Appl. Res. Technol. 2019, 15, 6. [Google Scholar] [CrossRef]
- Setiawan, A.S.; Wesley, J.; Purnama, Y. Mammogram classification using law’s texture energy measure and neural networks. Proc. Comput. Sci. 2015, 59, 92–97. [Google Scholar] [CrossRef]
- Moushmi, S.; Sowmya, V.; Soman, K.P. Empirical wavelet transform for multifocus image fusion. In Proceedings of the International Conference on Soft Computing Systems, Vellore, India, 19–21 December 2016. [Google Scholar] [CrossRef]
- Li, H.; Chai, Y.; Yin, H.; Liu, G. Multifocus image fusion denoising scheme based on homogeneity similarity. Opt. Commun. 2012, 285, 91–100. [Google Scholar] [CrossRef]
- Panigrahy, C.; Seal, A.; Mahato, N.K. Fractal dimension based parameter adaptive dual channel PCNN for multi-focus image fusion. Opt. Lasers Eng. 2020, 133, 106141–106163. [Google Scholar] [CrossRef]
- Wang, Z.; Li, X.; Duan, H.; Zhang, X.; Wang, H. Multifocus image fusion using convolutional neural networks in the discrete wavelet transform domain. In Multimedia Tools and Applications; Springer: Berlin/Heidelberg, Germany, 2019. [Google Scholar]
- Zhang, C. Multifocus image fusion using multiscale transform and convolution sparse representation. Int. J. Wavelets Multiresolution Inf. Proc. 2021, 19, 1. [Google Scholar] [CrossRef]
- Qayyum, H.; Majid, M.; Anwar, S.M.; Khan, B. Facial expression recognition using stationary wavelet transform features. Math. Probl. Eng. 2017, 1, 9. [Google Scholar] [CrossRef]
- Jagalingam, P.; Hegde, A.V. A Review of Quality Metrics for Fused Image. Aquat. Procedia 2015, 4, 133–142. [Google Scholar] [CrossRef]
- Shreyamsha Kumar, B.K. Image fusion based on pixel significance using cross bilateral filter. Signal Image Video Proc. 2015, 9, 1193–1204. [Google Scholar] [CrossRef]
- Wang, Z.; Bovik, A.C.; Sheikh, H.R.; Simoncelli, E.P. Image quality assessment: From error visibility to structural similarity. IEEE Trans. Image Proc. 2004, 13, 600–612. [Google Scholar] [CrossRef]
- Piella, G.; Heijmans, H. A new quality metric for image fusion in Image Processing. IEEE 2003, 3, 173. [Google Scholar] [CrossRef]
- Piella, G. New quality measures for image fusion. In Proceedings of the 7th International Conference on Information Fusion, Stockholm, Sweden, 28 June–1 July 2004; Volume 7, pp. 542–546. [Google Scholar]
- Liu, Z.; Blasch, E.; Xue, Z.; Zhao, J.; Laganiere, R.; Wu, W. Objective assessment of multiresolution image fusion algorithms for context enhancement in night vision: A comparative study. IEEE Trans. Pattern Anal. Mach. Intell. 2012, 34, 94–109. [Google Scholar] [CrossRef] [PubMed]
- Guang, Y.; Tao, T.; Song-yan, L.; Zi-yang, L.; Yue, Z. Fusion of infrared and visible images based on multifeatures. Opt. Precis. Eng. 2014, 22, 489–496. [Google Scholar] [CrossRef]
- Mengmeng, X. The research of image fusion algorithm based on wavelet transform. In Proceedings of the 4th International Conference on Advanced Information Technology and Sensor Application (AITS), Harbin, China, 21–23 August 2015; pp. 45–48. [Google Scholar]
- Wang, Z.; Bovik, A.C. A universal image quality index. IEEE Signal Proc. Lett. 2022, 9, 81–84. [Google Scholar] [CrossRef]
- Available online: https://sites.google.com/view/durgaprasadbavirisetti/datasets (accessed on 10 April 2022).


Disclaimer/Publisher’s Note: The statements, opinions and data contained in all publications are solely those of the individual author(s) and contributor(s) and not of MDPI and/or the editor(s). MDPI and/or the editor(s) disclaim responsibility for any injury to people or property resulting from any ideas, methods, instructions or products referred to in the content. |
© 2023 by the authors. Licensee MDPI, Basel, Switzerland. This article is an open access article distributed under the terms and conditions of the Creative Commons Attribution (CC BY) license (https://creativecommons.org/licenses/by/4.0/).