Abstract
In recent decades, the human demand for mineral resources has increased dramatically, and the mining of shallow deposits has basically been completed. The prospecting direction has turned to concealed deposits. For this reason, various penetrating geochemical methods have been developed to find concealed minerals and a series of geochemical exploration techniques have been proposed. At the same time, the use of the geochemical gene as a new technique presented in recent years is feasible in discussing component classification and provenance tracing. In this study, we applied these methods for mineral exploration in the Jiaojia gold deposit in Shandong Province, China. The results show that a large number of ore-forming element particles can be observed in ores, fault muds, and soils; compared with Chinese soil, Au has higher enrichment coefficients; according to the LG03 lithogene, the ores belong to a neutral composition, and the fault muds and soils belong to an acidic composition. Based on the above results, it can be found that the ore-forming elements in the Jiaojia gold deposit have migrated. Although this migration cannot change the original lithology, it can provide theoretical support for the fine-grained soil-prospecting method.
1. Introduction
As discoveries of world-class mineral deposits continue to decline, shallow deposits are no longer enough to meet the daily needs of human beings [1], and people turn their attention to the deep formation and pay more and more attention to geochemical exploration technology specially designed for the terrain covered by thick regolith. These techniques include: partial extraction, geogas analysis, electrogeochemistry, biogeochemistry, hydrochemistry, and soil fine particle separation [2,3,4,5,6,7,8,9,10,11,12,13,14,15]. Among the numerous geochemical exploration techniques, soil fine particle separation is an important method with which to find concealed deposits in thickly covered terrain. It is thought that this method mainly believes that in the process of the upward migration of elements from deep minerals, earth gas can carry ultra-fine particles containing metals or metal elements in the form of tiny bubbles or microflows to migrate upward and reach the surface, so the faults above the deep concealed minerals, fault muds, and topsoil contain metallic elements that can reflect anomalies in deep ore bodies. The best way to test this theory is to find ultrafine metal-bearing particles in soils and fault muds that must have come from deep ore bodies. After years of research, metal-bearing ultrafine particles from nanoscale studies have been widely used in soils and fault muds of different types of concealed minerals [7,10,16,17]. Zhang et al. [1] observed the existence of metallogenic metal nanoparticles in the soils and fault muds of the Shenjiayao gold deposit; Han et al. [18] observed mineralization in the ore rocks, fault muds, and soils of the Shanggong gold deposit in Henan, with the presence of metal nanoparticles. Often, the only source of anomalies in fault zones and surface soils surrounding a mine is the deep ore body. In order to explain the formation mechanism of the anomaly, the key is to determine the occurrence state and genesis of the ore-forming elements in the fault zone above the concealed mineral deposits and in the soil.
The geochemical gene is a new developing concept recently proposed in the identification and traceability of geological materials [19,20]. The term “gene” has been adopted in geochemistry from biology for two decades by Xuejin Xie and Xueqiu Wang [21] who proposed that the element is the gene of the earth and the geochemical map is the gene map of the earth surface. This is the “embryo” concept of the geochemical gene. Another term related to genes is the “gene-profile curve of geochemical elements” presented by Zhang et al. (2015, 2016) [22,23] in geochemistry which is like the REE pattern or spider diagram without gene properties [24]. Therefore, this idea can be viewed as the “fetal” stage of the geochemical gene concept. Although those primitive ideas were inspiring, the geochemical gene with tangible properties such as codes, heredity, inheritance, variability, and similarity has been proposed only recently [24,25,26]. The quantitatively defined geochemical gene was firstly presented by Yan et al. (2018) with an illustration on a geochemical lithogene [25]. It is proposed firstly as a lithogene named LG02 [25], and then followed by lithogenes called LG01 [26] and LG03 [27], gold metallogene (MGAu) [24], tungsten metallogene (MGW) [28], and tungsten metallogene (MGW11) [29], and REE (rare earth element) genes called REEG01 and REEG02 [26]. Therefore, there are a total of eight geochemical genes reported now, which were introduced and reviewed by Gong et al. (2022) [19] and the lithogene named MGW11 was introduced by Li et al. (2023) [29] recently.
These genes all have different codes and can represent the heritance, inheritance, variability, and similarity of different samples. According to the 39 elements or oxides analyzed by the RGNR project [30] and the NMPRGS project [31] in China, the geochemical gene is constructed in five steps.
The first step is to select elements. Generally, 11 kinds of fixed elements and indicator elements that can represent different characteristics are selected. The second step is to determine the reference value. According to the purpose of different genes, we select different data to standardize the data. For example, the element abundances of the upper continental crust (UCC) and acidic rocks and basic rocks compiled by Chi Qinghua and Yan Mingcai are selected for data standardization. The third step is to draw and code gene lines. The spectral line of the gene is like a spider map on the normalized value of the initial sequence. The length of the gene code is set to 11 because 11 elements are selected. The first digit of the code is set to 1, and then the next digit will be 0, 1, or 2 according to the decrease, stability, or rise of the next normalized value on the spectral line. We use the 0.1 logarithmic unit (base 10) value to evaluate the difference between two adjacent elements on the log-normalized value, marked as ∆, calculated as
where i is the sequence number from 2 to 11 of the elements in the spectral line, and the subscript N represents the normalized value. In addition to the first number set to 1, another number in the code is labeled gi and set as
where i is from 2 to 11, and the value of gi in gene coding is only 0, 1, or 2. According to the coding method, the gene of one sample can be 11011020011, and the gene of the other sample can be 12210202120. How to evaluate the similarity between two genes is the fourth step in constructing geochemical genes. The similarity of gi is marked as Ri and set as
∆i = lg(Ci)N − lg(Ci − 1)N
Then, the similarity between the two genes is labeled as R and calculated as
where n is 11 and the value of R is limited between 0% and 100%. For example, the similarity between Gene A and Gene B is calculated as
Gene A: 1 1 0 1 1 0 2 0 0 1 1
Gene B: 1 2 2 1 0 2 0 2 1 2 0
Rgi: 0.5 0 1 0.5 0 0 0 0.5 0.5 0.5
The last step in constructing geochemical genes is to adjust the sequence of elements in the spectral lines. According to the different research objects of genes, the most obvious differentiation can be achieved by adjusting the sequence of elements. For example, the element sequence of the lithogene LG03 is to effectively distinguish acidic rock and basic rock to maximize their genetic similarity. By repeatedly adjusting the initial element sequence in step 3, the positions of Ni and Cr are exchanged, and then the positions of V and Cr are exchanged to form the final sequence.
With respect to the lithogenes LG01 and LG03, the gene properties of their heredity and inheritance have been tested on many weathering profiles developed over different lithological rocks in different climate zones in China [26,27,32] according to the similar gene criterion of ≥80% on gene similarity by Yan et al. (2018) [25]. Their application in classifying geological materials is useful and suitable for fresh and altered rocks and weathered products such as fresh rocks, sediments, and soils [20].
In this paper, TEM was used to observed the ores, fault muds, and soils in the Jiaojia gold deposit, Shandong Province. Then, the element content of the samples were analyzed to determine the enrichment degree of different elements in the study area and the lithogenes such as LG01 and LG03 were used to determine the lithology of the different samples which provided theoretical support for the migration of elements in soil fine-grained exploration.
2. Regional Settings
The Jiaojia gold deposit is located in the Jiao-xin metallogenic belt in the east and west of Jiaojiao, including the Jiaojia, Wangershan, Matang, and other gold deposits. The Jiaojia gold deposit is a super-large gold deposit, and the overall type of the deposit is the trunk fault of Jiaojia (Figure 1). The Jiaojia-type altered gold deposit is controlled by the fractured alteration zone within its secondary Wangershan branch fault. The main strike of the fault in this area is NNE-NE, and the strike of the ore body is the same as the main strike. The Jiaojia gold deposit is exposed as Neoarchean gabbro on the side of the Jiaojia trunk fault, and on the east side of the fault is the Linglong sheet of biotite monzogranite. There are also diorite porphyrite, diabase porphyry, lamprophyre, and other rocks in the area. The main ore minerals are gold and silver ore, pyrite, siderite, chalcopyrite, galena, sphalerite, and mirror iron ore. Gangue minerals are mainly quartz, sericite, feldspar, and calcite. The bedrock in the study area is covered by the Quaternary system composed of loose sediments such as gray-brown clay and sandy clay, with a thickness of about 2–40 m [33].
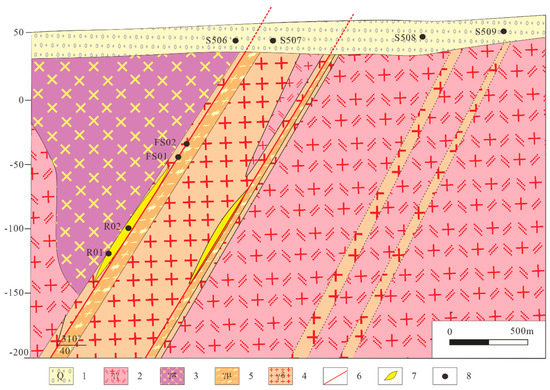
Figure 1.
Sampling points profile of Jiaojia gold mine. 1—quaternary clayey coarse sand and fine sand; 2—biotite monzogranite; 3—medium-fine-grained gabbro; 4—pyrite sericite granite; 5—pyrite sericite cataclastic granite; 6—fault; 7—ore body; 8—sampling point.
3. Samples and Methods
3.1. Sample Collection and Pretreatment
This research mainly collects and analyzes the ores, upper fault muds, and soils of the Jiaojia gold deposit in Shandong Province. The samples include two concealed ore body samples (R01, R02), two fault mud samples above the concealed ore body (FS01, FS02), two surface soil samples above the concealed ore body (S506, S507), and two surface soil samples around the concealed ore body (S508, S509). The collected soil samples were dried at 80 °C for 1 h, and sieved to ≤76 μm under the crusher. About 100 g of the fault muds were then dispersed using an electromagnetic vibrating micrometer shaker, which was connected to a concentrator and an air extractor (soil fine particle separation device) (Figure 2). The concentrator contains a 0.45 μm microporous filter membrane and six carbon-coated aluminum TEM (transmission microscope) grid slots, which are used to collect the oscillated nanoparticles. The shaker was turned on for 3 min to adsorb the appropriate amounts of nanoparticles on the aluminum grid, and then the six carbon-coated aluminum TEM (transmission microscope) grids in the concentrator were removed using tweezers and placed in a box for analysis. For the treatment of the fault mud and ore samples, the samples were ground to ≤76 μm using a ceramic grinder and the nanoparticles were separated using the same soil fine particle separation device.
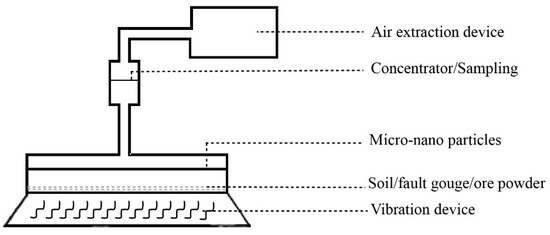
Figure 2.
Diagram of soil fine particle separation device.
3.2. TEM Observation
After the pretreatment, the samples to be tested were sent to the Beijing Physical and Chemical Analysis Center to analyze the TEM grid by transmission electron microscopy to observe the particle characteristics (such as size, shape, and composition) of the enriched nanoparticles. The transmission electron microscope (TEM) used for detection has a spot resolution of 0.20 nm, a lattice resolution of 0.1 nm, and a STEM-HAADF resolution of 0.17 nm, of which the minimum spot diameter is 0.8 nm. The transmission electron microscope is equipped with an X-ray energy dispersive spectrometer (EDS) with an accelerating voltage of 300 kV, and the samples observed under the microscope obtained in this study were all carried out in this environment. In the study, the composition of the particles was determined using EDS in the absence of reference substances; therefore, we cannot report the exact mass percentage of each chemical composition. When observing, we set the spot radius to <0.2 μm. The relative content of a specific element or component in the particle is expressed in mass percent. Two points were selected to study the background composition of the Al grid. The results show that the aluminum mesh is mainly composed of C, O, Al, and Si. One contains C (94.21%), O (3.55%), Al (1.61%), and Si (0.63%); the other contains C (92.68%), O (3.76%), Al (2.85%), and Si (0.71%) [18].
3.3. Chemical Analysis
The samples of soil, fault mud, and ore were sent to China University of Geosciences (Wuhan) for trace elements analysis. Inductively coupled plasma mass spectrometry (ICP-MS) was used for the determination of V, Co, Ni, Nb, Ti, Th, U, La, Y, Cu, Pb, Zn, Zr, Mn, Li, Ba, W, Ag, and Au concentrations. Atomic absorption spectrometry (AAS) was used to obtain the Cr and Ag concentrations (Table 1).

Table 1.
Analytical detection limits of elements.
4. Results and Discussion
4.1. Metal Particles Observed Using TEM
Complex micro-/nanoscale metal particles composed of Au, Cu, and other elements were observed in carriers (Al grids), which captured particles from soils, fault muds, and ores above the ore body, as shown in Figure 3. Nanoscale Au particles were found in the near-ore surface soils above the deposit (Figure 3a,b), the fault muds (Figure 3e,f), and the ores (Figure 3g,h), but nanoscale Au particles were not found in the near-ore surface soils above the background area (Figure 3c,d).
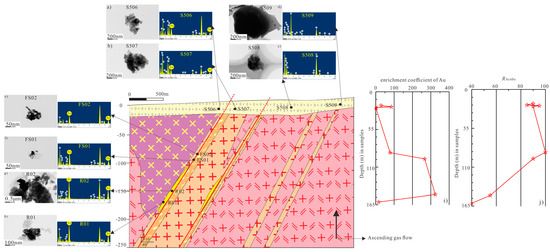
Figure 3.
Schematic diagram of the migration model of the metal-bearing nanoparticles. (a,b)—the TEM image of Au particles and the energy spectrum of the soils S506, S507 above the ore body; (c,d)—the TEM image and the energy spectrum of the soil samples S508, S509 away from the ore body; (e,f)—the TEM image of Au particles and the energy spectrum of the fault muds FS02, FS01 above the ore body; (g,h)—the TEM image of Au particles and the matching energy spectrum of ores R02, R01; (i)—enrichment coefficients of Au in different samples; (j)—gene similarities of different samples.
The characteristics of the particles in soils, fault muds, and ores are as follows: (1) the radii of metal particles are mainly in the order of several hundred or several tens of nm, with some several nm in size; (2) single metal particles are always ellipsoidal or polygonal, and may form clusters or aggregates (Figure 3e–h); (3) the EDS analysis shows that the metal particles are composed of metal complexes with Au, Cu–Co–Fe, Cu, and Fe–Co. Particles collected from background areas mainly contain Fe, Mn, Zn, Al, and Cu (Figure 3c,d). No Au- or Ag-bearing particles were observed in the background samples.
4.2. Elemental Composition
The concentrations of trace elements of the samples are listed in Table 2. The average concentration of Au in soils above the concealed ore body (S506, S507) was 74.8 ppm; relative to Chinese soil, the enrichment coefficient of S506 is 28.6 and S507 is 84.7; the overall enrichment coefficient of the two samples is 56.6 (Figure 3i). The average concentration of Au in soils around the concealed ore body (S508, S509) was 1.86 ppm; the enrichment coefficient of S508 and S509 is 1.4; the overall enrichment coefficient of the two samples is 1.4 (Figure 3i). The average concentration of Au in fault muds is 227.61 ppm; the enrichment coefficient of FS01 is 78 and FS02 is 267; the overall enrichment coefficient of the two samples is 172 (Figure 3i). The average concentration of Au in ores is 224.34 ppm; the enrichment coefficient of R01 is 324 and R02 is 15.7; the overall enrichment coefficient of the two samples is 170 (Figure 3i).
Table 2.
Trace element in surface soils, fault muds, and ores.
Moreover, the average concentrations of Au were significantly higher than those reported for soil from China by Chi et al. (2007) [34], and other elements, such as W, Pb, Zn, and Cu are not significantly enriched in this area. At the same time, the enrichment coefficient of the ore-forming element Au decreases from ores to fault muds to soils.
4.3. Geochemical Lithogene (LG03)
The geochemical gene is a new technique presented in recent years [19]. Although the term “gene” has been adopted in geochemistry from biology for two decades by Xuejin Xie and Xueqiu Wang [21,24,34,35] who proposed that the element is the gene of the earth and the geochemical map is the gene map of the earth surface, and another term related to genes is the “gene profile curve of geochemical elements” presented by Zhang et al. (2015, 2016) [22,23] in geochemistry which is like the REE pattern or spider diagram without gene properties [20,24], the above two studies do not have the essential connotation of genes, such as codes, heredity, inheritance, variability, similarity, and other characteristics, only the geochemical characteristics of elements. Therefore, it can be regarded as the germination and gestation stage of the geochemical gene. Geochemical genes with these characteristics have just been proposed only recently [24,25,28].
This technique combines the concept of biological gene with geochemistry, and proposes a complete geochemical gene construction process, including gene sequence, gene coding, and gene similarity calculation methods. Gong et al. (2020) proposed that the acidic similarities of genes can be used to classify the composition of rocks, soils, and stream sediment samples according to the characteristics of lithogenes [26]. In recent years, with the development of lithogenes, great achievements have been made in composition classification and provenance tracing [20,23,27,32,36,37,38,39].
According to the construction steps of a geochemical gene, Li et al. (2021) proposed a new lithogene labelled LG03 [27]. The gene eliminates the influence of the addition of aeolian sand, organisms, and other media on lithology determination, and is feasible in discussing component classification and provenance tracing. Gene coding and acidic similarities of soils, fault muds, and ores using LG03 lithogene calculate the following (Table 3):
Table 3.
Gene similarities of 8 samples with different sampling points.
It can be seen from Table 3 that the acidic similarities of ores are 40–55, the fault muds are 90–100, and the soils are 85–90 (Figure 3j). The proposed lithogene LG02 not only gives a clear meaning to the gene, but also stipulates the division of gene similarity. Yan et al. (2018) determined that the gene of acidic rock in China is 11012020211, the gene of neutral rock in China is 11210002110, and the gene of basic rock in China is 10210102200. According to the above gene similarity calculation method, the similarity to the other two rocks of a rock is calculated, respectively. Compared with acidic rock, the genetic similarity of neutral rock is 50%, and the genetic similarity of basic rock is 40%. Compared with intermediate rocks, the genetic similarity of basic rocks is 80% [25]. This indicates that the lithologic gene LG02 can significantly distinguish acidic rocks from the other two rocks. However, for the two kinds of rocks, neutral rock and basic rock, their differentiation is relatively low. In order to make up for the deficiency that the lithologic gene LG02 cannot effectively distinguish basic rock from neutral rock, Gong et al. [26] proposed that the ideal acidic rock in China (a virtual rock sample represented by the elemental abundance of acidic rock in China compositionally) has the same gene code of 10202020202 on LG01 and LG03, and the ideal basic rock in China also has the same gene code of 12020202020 on these two lithogenes. The gene similarity of a sample relative to the ideal acidic rock is called the sample’s acidic similarity and can be labeled as RAcidic. This also makes up for the fact that the genetic code of the lithogene LG02 is not easy to remember when expressing lithology. According to this definition, the RAcidic of the ideal acidic rock in China is 100%, while the RAcidic of the ideal basic rock in China is 0%. Geological materials can be classified into three groups: acidic-like composition with RAcidic ≥ 80% labeled 1, intermediate-like composition with RAcidic between 75% and 25% labeled 2, and basic-like composition with RAcidic ≤ 20% labeled 3. Therefore, according to the acidic similarities, the ores belong to neutral components, and fault muds and soils belong to acidic components. Three types of samples were clearly divided into two different components.
In summary, TEM observation and energy spectrum analysis showed that Au nanoparticles were found in the ores, fault muds, and soils above the concealed ore body, but not in the soils around the concealed ore body. At the same time, the element composition also proves that Au is much higher in the soils above the concealed ore body than in the soils around the concealed ore body. The LG03 lithogene shows that the ores are neutral components, and the fault muds and soils are acidic components; their sources are different, thus excluding the possibility that the soils above the concealed ore body are formed by ore weathering. This also provides an explanation for the source of the high concentration of Au in the top soil of the ore, that is, by the migration of the bottom ore, which also provides a basis for soil fine-grained prospecting (Figure 3).
5. Conclusions
- (1)
- The nanoscale Au particles were found in ores, fault muds, and soils above the concealed ore body, but not in the soils around the concealed ore body by TEM observation.
- (2)
- The concentration of nanoscale Au particles in ores, fault muds, and soil above the concealed ore body are much higher than that in Chinese soil and has a higher enrichment coefficient. On the contrary, the concentration of nanoscale Au particles in the soils around the concealed ore body are almost the same as that in Chinese soil.
- (3)
- The LG03 lithogene divides the ores into neutral components, and fault muds and soils into acidic components, which proved that they have different substrates. It is proven that the high concentration of nanoscale Au particles in soils above the concealed ore body migrate from ore to soil, which also provides a basis for soil fine-grained prospecting.
Author Contributions
J.L.: Conceptualization, data curation, and writing—original draft. B.Z.: Conceptualization, data curation, and writing—review and editing. Q.G.: Conceptualization, methodology, and writing—review and editing. H.L.: Conceptualization and data curation. N.L.: Conceptualization and formal analysis. All authors have read and agreed to the published version of the manuscript.
Funding
This work was financially supported by the National Natural Science Foundation of China (41573044, 41903071), the State Key Research & Development Project (2016YFC0600602) and the National Nonprofit Institute Research Grant of IGGE(AS2022P03).
Institutional Review Board Statement
Not applicable.
Data Availability Statement
Not applicable.
Acknowledgments
We greatly appreciate the comments from the anonymous reviewers and editors for their valuable suggestions to improve the quality of this manuscript.
Conflicts of Interest
The authors declare that they have no known competing financial interests or personal relationships that could have appeared to influence the work reported in this paper.
References
- Zhang, B.M.; Han, Z.X.; Wang, X.Q.; Liu, X.Q.; Wu, H.; Feng, H. Metal-Bearing Nanoparticles Observed in Soils and Fault Gouges over the Shenjiayao Gold Deposit and Their Significance. Minerals 2019, 9, 414. [Google Scholar] [CrossRef]
- Malmqvist, L.; Kristiansson, K. Microflow of geogas—A possible formation mechanism for deep-sea nodules. Mar. Geol. 1981, 40, M1–M8. [Google Scholar] [CrossRef]
- Malmqvist, L.; Kristiansson, K. Experimental evidence for an ascending microflow of geogas in the ground. Earth Planet. Sci. Lett. 1984, 70, 407–416. [Google Scholar] [CrossRef]
- Bradshaw, P.M.D.; Thomson, I.; Smee, B.W.; Larsson, J.O. The application of different analytical extractions and soil profile sampling in exploration geochemistry. J. Geochem. Explor. 1974, 3, 209–225. [Google Scholar] [CrossRef]
- Clark, R.J.; Meier, A.L.; Riddle, G. Enzyme leaching of surficial geochemical samples for detecting hydromorphic trace-element anomalies associated with precious-metal mineralized bedrock buried beneath glacial overburden in northern Minnesota. In Proceedings of the Gold ’90 Symposium—Gold ’90, Salt Lake City, UT, USA, 26 February–1 March 1990; pp. 189–207. [Google Scholar]
- Mann, A.W.; Birrell, R.D.; Gay, L.M.; Al, E. Partial extraction and mobile metal ions. In Proceedings of the 17th International Geochemical Exploration Symposium (IGES), Townsville, Australia, 15–19 May 1995; pp. 31–34. [Google Scholar]
- Clark, R.J. Innovative Enzyme Leach Provides. In Proceedings of the Exploration 97: Fourth Decennial International Conference on Mineral Exploration, Toronto, ON, Canada, 14–18 September 1997; pp. 371–374. [Google Scholar]
- Wang, X.Q.; Cheng, Z.Z.; Lu, Y.X.; Xie, X.J. Nanoscale metals in Earthgas and mobile forms of metals in overburden in wide-spaced regional exploration for giant deposits in overburden terrains. J. Geochem. Explor. 1997, 58, 63–72. [Google Scholar] [CrossRef]
- Mann, A.W.; Birrell, R.D.; Mann, A.T.; Humphreys, D.B.; Perdrix, J.L. Application of the mobile metal ion technique to routine geochemical exploration. Geochem. Explor. 1998, 61, 87–102. [Google Scholar] [CrossRef]
- Cohen, D.R.; Shen, X.C.; Dunlop, A.C.; Rutherford, N.F. A comparison of selective extraction soil geochemistry and biogeochemistry in the Cobar area, New South Wales. J. Geochem. Explor. 1998, 61, 173–189. [Google Scholar] [CrossRef]
- Chunhan, O.; Juchu, I.; Liangquan, E.; Fenggen, A. Experimental observation of the nano-scale particles in geogas matters and its geological significance. Sci. China (Ser. D Earth Sci.) 1998, 41, 325–329. [Google Scholar] [CrossRef]
- Wang, X.Q. Leaching of mobile forms of metals in overburden: Development and application. J. Geochem. Explor. 1998, 61, 39–55. [Google Scholar]
- Kelley, D.L. The use of partial extraction geochemistry for copper exploration in northern Chile. Geochem. Explor. Environ. Anal. 2003, 3, 85–104. [Google Scholar] [CrossRef]
- Cameron, E.M.; Hamilton, S.M.; Leybourne, M.I.; Hall, G.E.M.; McClenaghan, M.B. Finding deeply buried deposits using geochemistry. Geochem. Explor. Environ. Anal. 2004, 4, 7–32. [Google Scholar] [CrossRef]
- Leybourne, M.I.; Cameron, E.M. Groundwater in geochemical exploration. Geochem. Explor. Environ. Anal. 2010, 10, 99–118. [Google Scholar] [CrossRef]
- Kristiansson, K.; Malmqvist, L.; Persson, W. Geogas prospecting: A new tool in the search for concealed mineralizations. Endeavour 1990, 14, 28–33. [Google Scholar] [CrossRef]
- Tong, C.H.; Li, J.C. A New Method Searching for Concealed Mineral Resources: Geogas Prospecting Based on Nuclear Analysis and Accumulation Sampling. J. China Univ. Geosci. 1999, 10, 329–332. [Google Scholar]
- Han, Z.X.; Zhang, B.M.; Wu, H.; Liu, H.L.; Qiao, Y.; Zhang, S.K. Microscopic characterisation of metallic nanoparticles in ore rocks, fault gouge and geogas from the Shanggong gold deposit, China. J. Geochem. Explor. 2020, 217, 106562. [Google Scholar] [CrossRef]
- Gong, Q.J.; Yan, T.T.; Wu, X.; Li, R.K.; Wang, X.Q.; Liu, N.Q.; Li, X.L.; Wu, Y.; Li, J. Geochemical gene: A promising concept in discrimination and traceability of geological materials. Appl. Geochem. 2022, 136, 105133. [Google Scholar] [CrossRef]
- Wu, Y.; Gong, Q.J.; Liu, N.Q.; Wu, X.; Yan, T.T.; Xu, S.C.; Li, W.J. Classification of geological materials on geochemical lithogenes: Illustration on a case study in Gejiu area of Yunnan Province, China. Appl. Geochem. 2022, 146, 105460. [Google Scholar] [CrossRef]
- Wang, X.Q. Geochemistry of Exploration on Giant Ore Deposit and Large Mineral Camp. In Geochemistry of Exploration on Mineral Resources towards the 21st Century; Xie, X., Shao, Y., Wang, X., Eds.; Geological Publishing House: Beijing, China, 1999; pp. 35–47, (In Chinese with English abstract). [Google Scholar]
- Zhang, Y.F.; Yuan, J.M.; Wu, D.W.; Lü, W.Y.; Zhang, J.L. Basic principle and technical framework of analysis on geochemical elements sequence structure. Miner. Explor. 2015, 6, 39–746, (In Chinese with English abstract). [Google Scholar]
- Zhang, Y.F.; Zhang, J.L.; Wu, D.W.; Yuan, J.M.; Lü, W.Y. A preliminary study of gene profile curve of geochemical elements and its geological significance: A case study of the central-south part of Da Hinggan mountains metallogenic belt, Inner Mongolia. Geophys. Geochem. Explor. 2016, 40, 235–242, (In Chinese with English abstract). [Google Scholar]
- Li, R.K.; Liu, N.Q.; Gong, Q.J.; Wu, X.; Yan, T.T.; Li, X.L.; Liu, M.X. Construction, test and application of a geochemical gold metallogene: Case studies in China. Geochem. Explor. 2019, 204, 1–11. [Google Scholar] [CrossRef]
- Yan, T.T.; Wu, X.; Quan, Y.K.; Gong, Q.J.; Li, X.L.; Wang, P.; Li, R.K. Heredity, inheritance and similarity of element behaviors among parent rocks and their weathered products: A geochemical lithogene. Geoscience 2018, 32, 453–467, (In Chinese with English abstract). [Google Scholar]
- Gong, Q.J.; Wu, X.; Yan, T.T.; Liu, N.Q.; Li, X.L.; Li, R.K.; Liu, M.X. Construction and test of geochemical genes: Case studies in China. Geoscience 2020, 34, 865–882, (In Chinese with English abstract). [Google Scholar]
- Li, J.; Liu, N.Q.; Gong, Q.J.; Wu, X.; Yan, T.T. Construction and test of a geochemical lithogene based on trace elements: Case studies on weathering profiles in China. Geoscience 2021, 35, 1459–1470, (In Chinese with English abstract). [Google Scholar]
- Gong, Q.J.; Liu, N.Q.; Wu, X.; Yan, T.T.; Fan, T.Q.; Li, X.L.; Liu, M.X.; Li, R.K.; Albanese, S. Using regional geochemical survey data to trace anomalous samples through geochemical genes: The Tieshanlong tungsten deposit area (Southeastern China) case study. Geochem. Explor. 2020, 219, 106637. [Google Scholar] [CrossRef]
- Li, J.; Gong, Q.J.; Zhang, B.M.; Liu, N.Q.; Wu, X.; Yan, T.T.; Li, X.L.; Wu, Y. Construction, Test and Application of a Tungsten Metallogene Named MGW11: Case Studies in China. Appl. Sci. 2023, 13, 606. [Google Scholar] [CrossRef]
- Xie, X.J.; Cheng, H.X. Sixty years of exploration geochemistry in China. Geochem. Explor. 2014, 139, 4–8. [Google Scholar] [CrossRef]
- Li, M.; Xi, X.H.; Xiao, G.Y.; Cheng, H.X.; Yang, Z.F.; Zhou, G.H.; Ye, J.Y.; Li, Z.H. National multipurpose regional geochemical survey in China. Geochem. Explor. 2014, 139, 21–30. [Google Scholar] [CrossRef]
- Wu, Y.; Li, X.L.; Gong, Q.J.; Wu, X.; Yao, N.; Peng, C.; Chao, Y.D.; Wang, X.Y.; Pu, X.L. Test and application of the geochemical lithogene on weathering profiles developed over granitic and basaltic rocks in China. Appl. Geochem. 2021, 128, 104958. [Google Scholar] [CrossRef]
- Cheng, H.Y. Comparative Study on Geochemical Characteristics of Linglong Gold Deposit and Jiaojia Gold Deposit in Jiaodong; China University of Geossciences: Beijing, China, 2019; pp. 1–72. [Google Scholar]
- Chi, Q.H.; Yan, M.C. Handbook of Elemental Abundance for Applied Geochemistry; Geological Publishing House: Beijing, China, 2007; pp. 1–148. [Google Scholar]
- Shi, J.; Ma, H. Xie Xuejin: Drawing the gene map of the earth. Chin. Natl. Geograp. 2007, 6, 96–101. (In Chinese) [Google Scholar]
- Kong, L. Testing and Application of Geochemical Lithogene: A Case Study in Lianyang Area, Guangdong Province; China University of Geosciences: Beijing, China, 2020; pp. 1–60. [Google Scholar]
- Wang, X.Y.; Yao, N.; Gong, Q.J.; Chao, Y.D.; Peng, C.; Wu, Y. Properties of geochemical genes due to granite weathering in the Yunmengshan area of Beijing, China. Earth Sci. Front. 2021, 28, 363–374, (In Chinese with English abstract). [Google Scholar]
- Wang, X.Y. Geochemical Genes Related to Granite Weathering in the Yunmengshan Area of Beijing, China; China University of Geosciences: Beijing, China, 2021; pp. 1–67. [Google Scholar]
- Peng, C. Testing and Application of Geochemical Gene: A Case Study in Tieling Area, Liaoning Province; China University of Geosciences: Beijing, China, 2021; pp. 1–69. [Google Scholar]


Disclaimer/Publisher’s Note: The statements, opinions and data contained in all publications are solely those of the individual author(s) and contributor(s) and not of MDPI and/or the editor(s). MDPI and/or the editor(s) disclaim responsibility for any injury to people or property resulting from any ideas, methods, instructions or products referred to in the content. |
© 2023 by the authors. Licensee MDPI, Basel, Switzerland. This article is an open access article distributed under the terms and conditions of the Creative Commons Attribution (CC BY) license (https://creativecommons.org/licenses/by/4.0/).