Abstract
Malware is the primary attack vector against the modern enterprise. Therefore, it is crucial for businesses to exclude malware from their computer systems. The most responsive solution to this issue would operate in real time at the edge of the IT system using artificial intelligence. However, a lightweight solution is crucial at the edge because these options are restricted by the lack of available memory and processing power. The best contender to offer such a solution is application programming interface (API) calls. However, creating API call characteristics that offer a high malware detection rate with quick execution is a significant challenge. This work uses visualisation analysis and Jaccard similarity to uncover the hidden patterns produced by different API calls in order to accomplish this goal. This study also compared neural networks which use long sequences of API calls with shallow machine learning classifiers. Three classifiers are used: support vector machine (SVM), k-nearest neighbourhood (KNN), and random forest (RF). The benchmark data set comprises 43,876 examples of API call sequences, divided into two categories: malware and legitimate. The results showed that RF performed similarly to long short-term memory (LSTM) and deep graph convolutional neural networks (DGCNNs). They also suggest the potential for performing inference on edge devices in a real-time setting.
1. Introduction
Malware has emerged as the primary method of a network attack, causing not only significant difficulties for common users, but also causing significant losses for businesses and government agencies [1]. According to Cybercrime Magazine [2], ransomware (which is one type of malware) alone caused global damage totalling USD 20 billion in 2021 and projected to rise to USD 265 billion in 2031. In addition to the attackers’ innovative approaches, malware’s proliferation is also increasing rapidly, as more than 91 million new pieces of malware are expected to have been produced in 2022 [3]. This insatiable creation of malware exposes enterprises to a wide range of sophisticated dangers. Consequently, it is crucial to integrate technologies within enterprise networks to counter a large range of malware attacks.
Malware typically possesses characteristics of symbolic signatures. As a result, commercial antivirus applications most frequently employ signature-based techniques to detect malware attacks. Such a strategy, nevertheless, is unable to identify newly created malware [4] and by using techniques such as packing and obfuscation, attackers also try to decrease the reliability of such analysis [5].
Despite the attackers’ cunning ideas, a host operating system is still required for malicious programs to function and carry out their malicious actions [6]. Therefore, the malware asks the Windows operating system’s API call service to carry out the malicious deed. This action results in detrimental behaviour that is utilised to detect malware and, as stated by [7], malware is unable to hide the usage of the system’s API call. Malware, particularly zero-day malware, can be detected using machine learning approaches that operate on data extracted from the behaviour of executables. However, collecting effective API call features to distinguish between goodware and malware remains a difficult process. Additionally, the majority of research [8] in the field concentrates on the accuracy offered by API call features rather than providing fast solutions. Additionally, earlier research did not emphasise the use of the visualisation method to uncover hidden patterns of API calls between malicious and useful software. The usefulness of collecting API calls at an early stage of execution is also infrequently investigated.
Artificial intelligence at the edge (Edge AI) [9] enables machine learning inference to be performed at the point of direct data production. This method has the benefit of typically operating in real time, but it is also restricted by the amount of memory and computing power available, making execution time a crucial consideration. In order to create Edge AI systems that precisely identify hazardous situations while abiding by low complexity and execution time constraints, this research seeks to answer the following questions:
- -
- Which approach is most appropriate for use with edge computing hardware?
- -
- To what extent is the usage of API calls to provide a representation of software behaviour a potential compromise in the context of such solutions?The contributions of this research can be summarised as follows:
- -
- It presents the value of visual data analysis approaches to discover possible hidden patterns provided by API calls to explore the behaviour trend of malware and goodware.
- -
- It confirms that extracting the API calls from the parent process only and considering the first 100 non-consecutive repeated calls provides recognition of the malicious behaviour as early as possible.
- -
- It provides a simple feature representation for the API calls.
- -
- It makes a recommendation that a RF classifier with feature representation provided in this research delivers high accuracy with a low execution time, making it a suitable solution for Edge AI.
The rest of the paper is structured as follows: Section 2 describes malware detection methods; Section 3 presents the related works; API call analysis is described in Section 4; Section 5 provides API call visualisation; Section 6 presents the API call similarity network graph; Section 7 presents malware detection using the frequency of API calls; the experimental results of malware detection models are described in Section 8; and lastly, conclusions are drawn in Section 9.
2. Malware Detection Methods
Malware analysis explains how to examine a malware file in order to comprehend its behaviour and look at the many components of harmful software to identify and minimise the harm inflicted by attackers. Static and dynamic approaches can be used to analyse malware. It is not necessary to run the malware for simple static analysis. Instead, this analysis looks for indicators of harmful intent in the file. Static analysis can be used to gather a variety of static data, such as the data extracted from PE header [10,11], which is derived as string-based entropy. Static analysis has the advantages of being quick and not requiring an isolated environment to run malicious code. However, these advantages are thwarted by obfuscation methods, such as encryption and packing techniques used to hide the dangerous payload and render the malware unrecognisable [12,13].
On the other hand, dynamic analysis requires that the malware file be executed in isolated settings to observe the malware’s behaviour during runtime and then collect the dynamic features needed [14]. Using a dynamic analysis methodology, several types of data have been gathered. Malicious behaviours can be exhibited by maintaining memory images throughout the runtime, such as the memory image of Opcodes [15]. Additionally, the behaviour of the malware can be represented by gathering the triggered API calls [16,17], file information [18,19], machine operations [20,21], network data, and registry [22,23]. Even though malware that has been obfuscated cannot hide its behaviour from dynamic analysis, more research is still needed to extract characteristics that will meet all malicious conditions and allow for the exploration of all execution paths.
3. Related Works
Today, the world has become more vulnerable to cyberattacks due to the widespread use of computers and smart devices. The protection of networks from attacks has become a significant concern for governments and enterprises, especially enterprises which experience a severe financial impact if attacked. Attackers have developed numerous forms of malware for a variety of purposes because malware is the most popular method for conducting attacks against networks. Several malware detection techniques have emerged in response to the growth in malware activity. Malware detection and classification is successfully accomplished by machine learning solutions [24]. Researchers have used a variety of machine learning approaches with diverse dynamic and static properties [25,26,27,28]. To evade detection, malware developers have developed a range of obfuscation methods, such as API call insertion, packing, and encryption [29]. The dynamic detection approaches are immune to packing and encryption obfuscation methods. Because of this, dynamic detection has attracted a lot of interest from the malware detection community. However, the obfuscation method against detection approaches based on API calls such as insertion and rearrangement of API calls may lead to the failure of the detection system. Rosenberg et al. [30], for instance, concentrated on developing attacks against models based on API calls. Aggressive patterns make use of API calls, as well as static features. According to research, these attacks work effectively against a wide range of detection models. Therefore, researchers have conducted studies to propose features that are immune against API call obfuscation techniques. In order to produce a public data set, the research in [31] used Cuckoo Sandbox to extract a number of API calls from several malware types. The classification of malware families was then carried out using the deep learning model. According to [32], a sequence of API calls can be seen as a set of transaction data, where each API call and its arguments constitute a collection of items. Therefore, a frequent itemset in an API call sequence can reveal a pattern of behaviour. In contrast with these findings, Hansen et al. [33] identified and classified malware using API call sequences and frequency. Using the Random Forests classifier, a promising predictive performance was obtained.
API calls constitute various lengths of sequences, which makes it difficult to identify robust features. Therefore, based on API request sequences, researchers suggested utilising deep learning models. Recurrent neural networks (RNNs), for instance, are a very effective way to handle time series sequences, especially in the field of natural language processing. Using a RNN model, Li et al. [34] classify malware families where Long API call sequences are used to categorise different malware types. Also, for binary detection, Eskandari et al. [35] employ RNNs and features gleaned from API requests to distinguish malware. Converting API calls to graph structure proposed by Oliveira et al. [36]. Malware and legitimate samples are executed in a sandbox environment to extract the API call sequences and then generate the behavioural graph. The depth graph convolution neural network (DGCNN) is used as a detection model. Additionally, Tang et al. [37] convert API calls to images to represent the behaviour of malware in accordance with colour mapping criteria. The feature images were then categorised using a CNN (convolutional neural network). Some studies [38,39] transfer the sequences of API calls into TF-IDF feature representation. Different machine learning classifiers are then tested. Cannarile et al. [40] used the proposed data set by [36] to train different shallow learning methods and deep learning techniques. The results showed that shallow machine learning classifiers provide better performance with less training time.
The aforementioned classification methods are built on the API calls and their sequences. However, it is still challenging to extract effective features to differentiate between legitimate and malware while providing acceptable processing time. Previous research focused on the accuracy provided by API call-based classifiers. The deep analysis of these API calls to understand the trend in malware and goodware has not been investigated in depth. Recent work presented by Daeef et al. [41] used the Jaccard index and visualisation technique to explore the hidden pattern of malicious behaviour using API call combinations found in each malware family. Using the aforementioned discoveries as a foundation, this paper follows the same methodology presented in [41] but uses the visualisation technique to discover the hidden malicious indicators found in the combination of API calls in malware and goodware classes. It also makes reference to the possibility of employing the classification model on the edge to make inferences in real time.
4. API Call Analysis
The public data set in [42], consists of 43,876 API call sequences divided into two classes—malware, with 42,797 samples, and legitimate, with 1079 samples. The data set was produced after running Portable Executable (PE) files through Cuckoo Sandbox. After obtaining the dynamic analysis report, the API call sequences were obtained and processed in order to transfer the API calls into ordered values. Additionally, the sequences were only taken from the parent process, and the first 100 non-consecutive repeated API calls were taken into consideration.
To extract certain crucial statistics for initial comprehension of the data set, Python programs were built. The data set contained 264 distinct API calls in total. The distribution of these API calls between malware and goodware reveals the correlation between the two classes. Table 1 shows that 252 API calls were shared in the malware class. Although the legitimate class had a small number of samples compared to the malware class, 200 API calls were observed in this class. This shows that the majority of API calls present in the data set were shared by both classes. Figure 1 depicts the name of unique API calls found in the legitimate class with their number of occurrences, while Figure 2 shows the 64 unique API calls that exist in the malware class.

Table 1.
The total number of distinct API calls per class.
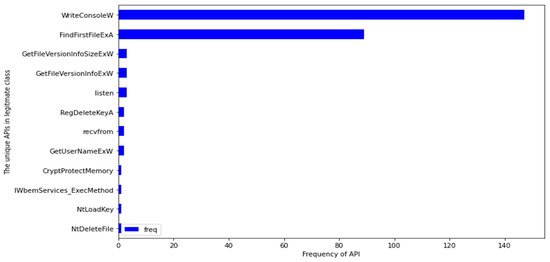
Figure 1.
The unique API calls of legitimate class.
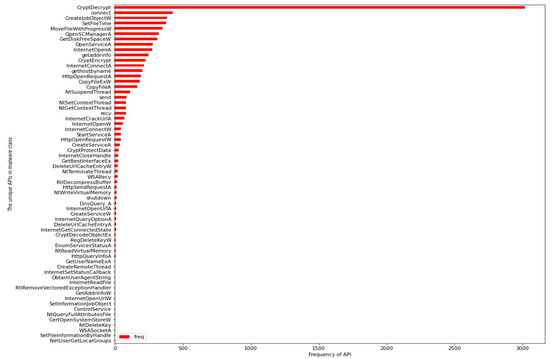
Figure 2.
The unique API calls of malware class.
Examining the most frequently used API calls of each class may uncover the thinking trend of malware creators. Figure 3 shows the top 30 most used API calls for each class. The interesting observation about Figure 3 is that both classes share 23 API calls. Table 2 lists the unique API calls for each class.
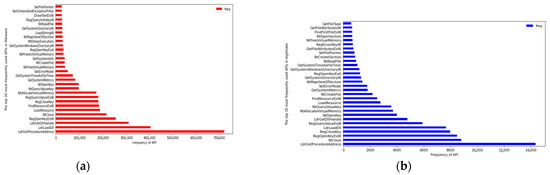
Figure 3.
The top 30 API requests that are used the most: (a) Malware class; (b) legitimate class.
Table 2.
The unique API calls in each class (out of 30).
The statistical analysis above shows that the majority of the 264 API calls were shared between malware and legitimate samples, making it difficult to separate classes. In order to uncover any potential hidden patterns, additional statistics and visualisations are necessary.
5. API Call Visualisation
The common characteristics of the malware class can be seen by looking at the shared API calls present in malware samples. API call visualisation is used to explore the extent of using the same sets of API calls in both classes. In machine learning and data science, the Jaccard coefficient is frequently used to compare data sets [43,44]. It can be applied to compare two sets of data to see how similar they are. Extracting the unique API calls from two malware, for example, A and B, the index of Jaccard similarity is one, if both malware shares the exact set of API calls. In contrast, if they do not have any shared API calls, the index will be zero. Equation (1) is used to calculate the similarity index.
To visualise the shared API calls found in malware and legitimate samples, 1079 unique malware samples containing all the 252 API calls are extracted from the data set. After this step, the first 500 malware samples are used for visualisation due to processing power limitations. This is followed by extracting the unique API calls found in each sample. These API calls are used to repeatedly compare each pair of samples by calculating the Jaccard index. After that, the sharing graph is constructed accordingly. The workflow of API calls sharing visualisation is depicted in Figure 4.
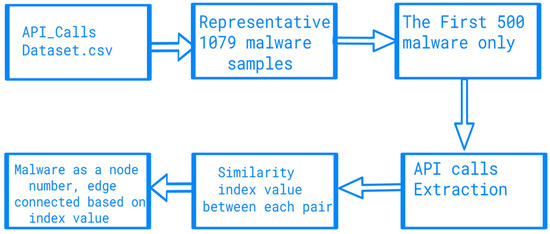
Figure 4.
The workflow of API call sharing visualisation.
As shown in Algorithm 1, the edge is drawn between the malware pair according to a threshold value. The Networkx Python library [45] is used to produce the dot file, while the Graphviz [46] tool is used to visualise the generated dot files.
| Algorithm 1: API Similarity Index Network. |
| Input: Unique API call sequence sets X |
| foreach x X do |
| foreach xn+1 X do |
| Intersection = len(xn xn+1) |
| Union = len(xn xn+1) |
| Similarity index = Intersection/Union |
| if Similarity index > threshold then |
| Create graph edge |
| End |
| End |
| End |
| Output: Networkx dot file |
6. API Call Similarity Network Graph
To visualise the network similarity, the threshold value should be selected first. Therefore, the first experiment uses 0.5 as a threshold value. Figure 5 depicts the network results of the malware and legitimate software. The results show that not even one pair is connected in malware, and the same is observed for the legitimate samples. Hence, the threshold value is decreased to 0.4, and as shown in Figure 6, significant numbers of malware are connected. The tightly connected malware can be seen as created by the same attack group or compilation tools. Although the network results indicate interesting findings that API calls connect or discriminate the samples within each class (samples that share the same combination of API calls), this result is obtained when the threshold value is set to 0.4. This means that the correlation is not very strong. To justify these results, the md5 hashes of the same 500 malware that were used to generate Figure 5 and Figure 6 are extracted from the data set. These hashes are then fed to VirusTotal [47] using API v3 interfacing to achieve the full JSON report. This step is necessary to extract the full API call sequences for each sample, not just the first 100 that were used to create the original data set. After extracting the full-length API call sequences from the JSON files, a threshold value of 0.5 is used to generate the malware similarity network. Based on Figure 7, it is clear that the correlation relationship becomes stronger compared with Figure 5a, in which no pairs are connected. This means that not extracting the full API call sequences causes weaker correlation among the samples. However, extracting the full API call sequences is a time-consuming process and makes deep learning solutions inapplicable because of the very long sequences that can reach the millions.
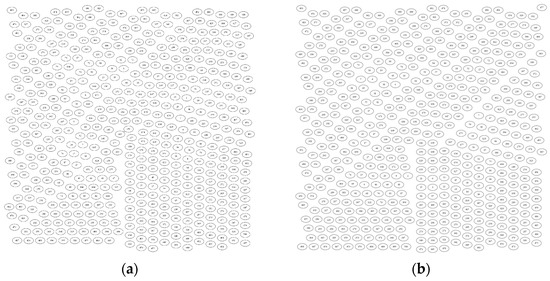
Figure 5.
The similarity graph of API calls (threshold = 0.5: (a) Malware; (b) legitimate.
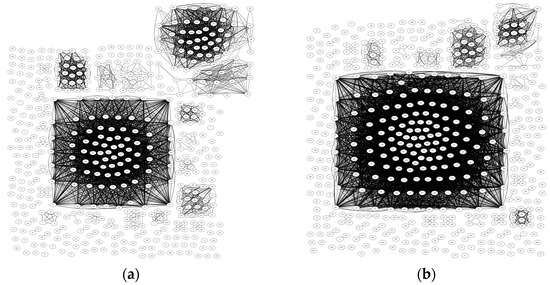
Figure 6.
The similarity graph of API calls threshold = 0.4: (a) Malware; (b) legitimate.
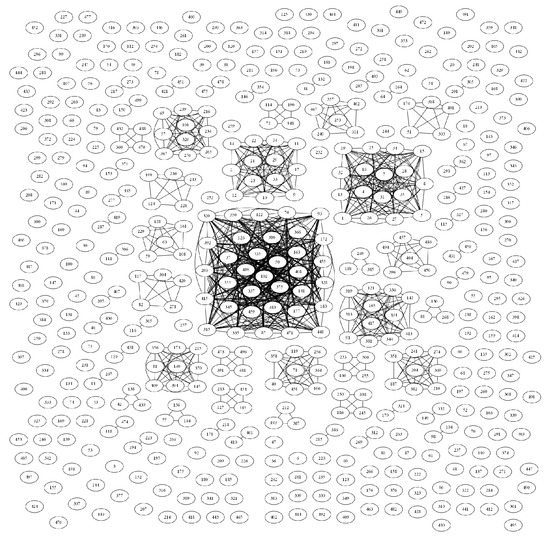
Figure 7.
The similarity graph of full API call sequences of malware samples (threshold = 0.5).
Achieving strong correlation requires extraction of the full API call sequences. However, extracting the first 100 non-consecutive repeated API calls still provides valuable correlation. Therefore, this work proposes to follow the same methodology as [36], which depends on the first 100 API calls but uses the number of occurrences of each API call instead of API call sequences. Traditional machine learning algorithms are then used instead of deep learning solutions.
7. Malware Detection Using the Frequency of API Calls
The workflow in this section is depicted in Figure 8. In the public domain data set [42], the API call sequences were gathered by running each sample on Cuckoo Sandbox. These sequences were only extracted from the parent process, since malware detection requires that malicious behaviour be recognised as early as possible. Additionally, only the first 100 API calls were taken into account. After these processes, the list containing unique API calls was created. In the final step, a unique integer number was given for each API call according to its index in the list. As stated in Section 4, the number of distinct API calls found in the data set was 264. It was decided to exclude any API call with a frequency of less than 100. This process is implemented for both malware and legitimate samples, and the only common API calls between both classes are taken into account. At the end of this process, 167 API calls remained. To generate the features vector, the API calls were formatted as a bag of words. Therefore, the length of the features vector was 167 and the value of each feature represented the frequency of that API call in the sample. This process is depicted in Algorithm 2.
| Algorithm 2: Features Extraction and Representation |
| Input: Data set of API calls X, class Y |
| foreach x X do |
| foreach API_Call X do |
| API_Call_Frequency = (Number_Of_Occurrences) |
| End |
| Create_Vector |
| End |
| XTrain, YTrain, XTest, YTest ← Splite_Rate (X, Y): 0.8 for Training |
| Output: Malware Detection Model |
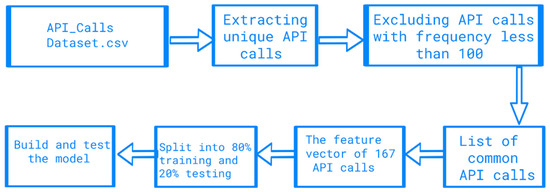
Figure 8.
The workflow of malware detection using API call frequency.
To generate the detection model, three classifiers were selected based on the success they had in malware detection. K-nearest neighbourhood (KNN), random forest (RF), and support vector machine (SVM) are used in this study. Practically, scikit-learn Python library is used to implement the detection models.
8. The Experimental Results of Malware Detection Models
There is an unbalanced number of API call sequences in the benchmark data set utilised in this study. Training the machine learning model using imbalanced data sets results in misunderstandings accuracy results. To avoid such issues relating to accuracy, F1 score, precision, and recall are used as evaluation metrics in this study. Additionally, the detection models are tested under two conditions: balanced and imbalanced data sets of API call sequences.
8.1. Experiment 1: Balanced Data Set of API Call Sequences
In this experiment, a balanced data set containing 1079 random malware and 1079 legitimate samples was used to create and test the models. The results in Table 3 reveal that the performances of SVM and KNN classifiers are quite comparable. SVM presents the weakest detection performance among all evaluation criteria, while RF has the best detection results. A high recall in balanced data sets suggests a small amount of false negatives, which can be seen as a high detection rate of malware. Low false-positive rates imply high precision, which is less important but still sought for malware detection. An ideal F1 score would have a high recall and precision. Last but not least, high accuracy denotes a large amount of overall predictions that are correct.
Table 3.
Detection Model Results (Balanced Data set).
8.2. Experiment 2: Imbalanced Data Set of API Call Sequences
In this experiment, the original imbalanced data set containing 42,797 malware and 1079 legitimate samples was used to create and test the models. Table 4 indicates that all classifiers’ performance is quite comparable on the imbalanced data set. Although training on an imbalanced data set makes models biased toward malware class, all evaluation metrics stated high scores which reflect the effectiveness of the models in detecting malware and goodware. The RF classifier presented the best performance on balanced and imbalanced data sets. Therefore, RF was selected for comparison with deep learning solutions.
Table 4.
Detection Model Results (Imbalanced Data set).
8.3. Comparisons, Discussion and Limitations
Two state-of-the-art deep learning classifiers (DGCNN and LSTM [36]) and one shallow model (CatBoost [40]) were selected for comparison due to their success in building models based on API call sequences to detect malware. Additionally, for fair comparison with [36,40] which uses the same data set described in Section 4 to build different shallow machine learning and deep learning models, the same evaluation metrics: F1 score, precision, and recall, are used for comparison.
The performance results of RF are pretty equal to deep learning techniques on both balanced and imbalanced data sets, as shown in Table 5 and Table 6, respectively. According to these findings, RF traditional classifier-based API call frequency provides a performance similar to deep learning-based API call sequences solutions. The RF model has a tendency to converge to a suitable solution faster. Additionally, the RF is less complex than deep learning classifiers. This suggests the prospect of performing inference in a real-time setting using RF on edge devices.
Table 5.
Comparative analysis with cutting-edge works (Balanced Data set).
Table 6.
Comparative analysis with cutting-edge works (Imbalanced Data set).
The imbalanced data set with only 1079 samples of goodware is considered one of the limitations of this work. Although the visualisation of the first 500 samples of malware and goodware draws a clear indication about the relation and sharing of API calls within malware and goodware, high computing resources are needed for the depiction of this Jaccard similarity. Therefore, considering only 500 samples for visualisation due to resource restriction is another limitation of this work.
9. Conclusions
Malware API calls were used in this study as classification features to detect malicious software. Extracting the API calls from the parent process only and considering the first 100 non-consecutive repeated calls provides recognition of the malicious behaviour as early as possible. Additionally, the network of similarity provides valuable information about how malware uses the same combinations of API calls and can uncover the malware creator trend. There was significant success in using API call sequences as a time series with neural network models to detect malware. However, such solutions require high computation power and resources. Traditional classifiers such as RF require less time for training, and possess lower intrinsic complexity. The experimental results showed that RF performed quite similarly to state-of-the-art-deep learning techniques. This suggests a viable prospect of performing inference in a real-time setting using RF on edge devices.
Using different data sets for similarity graphs with more goodware samples would be very interesting for future work. Additionally, testing the RF model on the condition of concept drift is another direction of future work. As an extension to this study, the next research will tackle the implementation scenarios of the RF model on edge devices.
Author Contributions
Conceptualization, A.Y.D. and A.A.-N.; data curation, A.Y.D. and A.K.N.; formal analysis, A.Y.D.; funding acquisition, J.C.; investigation, A.Y.D.; methodology, A.Y.D., A.K.N. and A.A.-N.; project administration, A.A.-N. and J.C.; resources, A.Y.D.; Software, A.Y.D.; validation, A.Y.D.; writing—original draft, A.Y.D.; writing—review and editing, A.A.-N., A.K.N. and J.C. All authors have read and agreed to the published version of the manuscript.
Funding
This research received no external funding.
Institutional Review Board Statement
Not applicable.
Informed Consent Statement
Not applicable.
Data Availability Statement
Not applicable.
Conflicts of Interest
The authors declare no conflict of interest.
References
- Al-Dwairi, M.; Shatnawi, A.S.; Al-Khaleel, O.; Al-Duwairi, B. Ransomware-Resilient Self-Healing XML Documents. Future Internet 2022, 14, 115. [Google Scholar] [CrossRef]
- Braue, D. Global Ransomware Damage Costs Predicted to Exceed 265 Billion by 2031. 2022. Available online: https://cybersecurityventures.com (accessed on 27 November 2022).
- Institute, A.T. ATLAS Malware & PUA. 2022. Available online: https://portal.av-atlas.org/malware (accessed on 25 November 2022).
- Akhtar, M.S.; Feng, T. Malware Analysis and Detection Using Machine Learning Algorithms. Symmetry 2022, 14, 2304. [Google Scholar] [CrossRef]
- Kimmell, J.C.; Abdelsalam, M.; Gupta, M. Analyzing machine learning approaches for online malware detection in cloud. In Proceedings of the 2021 IEEE International Conference on Smart Computing (SMARTCOMP), IEEE, Irvine, CA, USA, 23–27 August 2021; pp. 189–196. [Google Scholar]
- Catak, F.O.; Yazı, A.F. A benchmark API call dataset for windows PE malware classification. arXiv 2019, arXiv:1905.01999. [Google Scholar]
- Wagener, G.; State, R.; Dulaunoy, A. Malware behaviour analysis. J. Comput. Virol. 2008, 4, 279–287. [Google Scholar] [CrossRef]
- Aboaoja, F.A.; Zainal, A.; Ghaleb, F.A.; Al-Rimy, B.A.S.; Eisa, T.A.E.; Elnour, A.A.H. Malware detection issues, challenges, and future directions: A survey. Appl. Sci. 2022, 12, 8482. [Google Scholar] [CrossRef]
- Zeyu, H.; Geming, X.; Zhaohang, W.; Sen, Y. Survey on edge computing security. In Proceedings of the 2020 International Conference on Big Data, Artificial Intelligence and Internet of Things Engineering (ICBAIE), IEEE, Fuzhou, China, 12–14 June 2020; pp. 96–105. [Google Scholar]
- Naz, S.; Singh, D.K. Review of machine learning methods for windows malware detection. In Proceedings of the 2019 10th International Conference on Computing, Communication and Networking Technologies (ICCCNT), IEEE, Kanpur, India, 6–8 July 2019; pp. 1–6. [Google Scholar]
- Zelinka, I.; Amer, E. An ensemble-based malware detection model using minimum feature set. Mendel 2019, 25, 1–10. [Google Scholar] [CrossRef]
- Zhang, J.; Qin, Z.; Yin, H.; Ou, L.; Zhang, K. A feature-hybrid malware variants detection using CNN based opcode embedding and BPNN based API embedding. Comput. Secur. 2019, 84, 376–392. [Google Scholar] [CrossRef]
- Qiang, W.; Yang, L.; Jin, H. Efficient and Robust Malware Detection Based on Control Flow Traces Using Deep Neural Networks. Comput. Secur. 2022, 122, 102871. [Google Scholar] [CrossRef]
- Choudhary, S.; Vidyarthi, M.D. A simple method for detection of metamorphic malware using dynamic analysis and text mining. Procedia Comput. Sci. 2015, 54, 265–270. [Google Scholar] [CrossRef]
- Banin, S.; Shalaginov, A.; Franke, K. Memory access patterns for malware detection. In Proceedings of the NISK-2016 Conference, Bergen, Norway, 29–30 November 2016. [Google Scholar]
- Hwang, J.; Kim, J.; Lee, S.; Kim, K. Two-stage ransomware detection using dynamic analysis and machine learning techniques. Wirel. Pers. Commun. 2020, 112, 2597–2609. [Google Scholar] [CrossRef]
- Kim, H.; Kim, J.; Kim, Y.; Kim, I.; Kim, K.J.; Kim, H. Improvement of malware detection and classification using API call sequence alignment and visualization. Clust. Comput. 2019, 22, 921–929. [Google Scholar] [CrossRef]
- Singh, J.; Singh, J. Detection of malicious software by analyzing the behavioral artifacts using machine learning algorithms. Inf. Softw. Technol. 2020, 121, 106273. [Google Scholar] [CrossRef]
- Arabo, A.; Dijoux, R.; Poulain, T.; Chevalier, G. Detecting ransomware using process behavior analysis. Procedia Comput. Sci. 2020, 168, 289–296. [Google Scholar] [CrossRef]
- Fasano, F.; Martinelli, F.; Mercaldo, F.; Santone, A. Energy consumption metrics for mobile device dynamic malware detection. Procedia Comput. Sci. 2019, 159, 1045–1052. [Google Scholar] [CrossRef]
- Ahmed, Y.A.; Kocer, B.; Huda, S.; Al-Rimy, B.A.S.; Hassan, M.M. A system call refinement-based enhanced Minimum Redundancy Maximum Relevance method for ransomware early detection. J. Netw. Comput. Appl. 2020, 167, 102753. [Google Scholar] [CrossRef]
- Mosli, R.; Li, R.; Yuan, B.; Pan, Y. Automated malware detection using artifacts in forensic memory images. In Proceedings of the 2016 IEEE Symposium on Technologies for Homeland Security (HST), IEEE, Waltham, MA, USA, 10–11 May 2016; pp. 1–6. [Google Scholar]
- Belaoued, M.; Boukellal, A.; Koalal, M.A.; Derhab, A.; Mazouzi, S.; Khan, F.A. Combined dynamic multi-feature and rule-based behavior for accurate malware detection. Int. J. Distrib. Sens. Netw. 2019, 15, 1550147719889907. [Google Scholar] [CrossRef]
- Bahtiyar, S.; Yaman, M.B.; Altıniğne, C.Y. A multi-dimensional machine learning approach to predict advanced malware. Comput. Netw. 2019, 160, 118–129. [Google Scholar] [CrossRef]
- Han, W.; Xue, J.; Wang, Y.; Huang, L.; Kong, Z.; Mao, L. MalDAE: Detecting and explaining malware based on correlation and fusion of static and dynamic characteristics. Comput. Secur. 2019, 83, 208–233. [Google Scholar] [CrossRef]
- Xiaofeng, L.; Xiao, Z.; Fangshuo, J.; Shengwei, Y.; Jing, S. ASSCA: API based sequence and statistics features combined malware detection architecture. Procedia Comput. Sci. 2018, 129, 248–256. [Google Scholar] [CrossRef]
- Rhode, M.; Burnap, P.; Jones, K. Early-stage malware prediction using recurrent neural networks. Comput. Secur. 2018, 77, 578–594. [Google Scholar] [CrossRef]
- Ganesan, S.; Ravi, V.; Krichen, M.; Sowmya, V.; Alroobaea, R.; Soman, K. Robust malware detection using residual attention network. In Proceedings of the 2021 IEEE International Conference on Consumer Electronics (ICCE), IEEE, Las Vegas, NV, USA, 10–12 January 2021; pp. 1–6. [Google Scholar]
- Lu, F.; Cai, Z.; Lin, Z.; Bao, Y.; Tang, M. Research on the Construction of Malware Variant Datasets and Their Detection Method. Appl. Sci. 2022, 12, 7546. [Google Scholar] [CrossRef]
- Rosenberg, I.; Shabtai, A.; Rokach, L.; Elovici, Y. Generic black-box end-to-end attack against state of the art API call based malware classifiers. In Proceedings of the International Symposium on Research in Attacks, Intrusions, and Defenses, Heraklion, Greece, 10–12 September 2018; pp. 490–510. [Google Scholar]
- Yazi, A.F.; Catak, F.O.; Gul, E. Classification of methamorphic malware with deep learning (LSTM). In Proceedings of the 2019 27th Signal Processing and Communications Applications Conference (SIU), IEEE, Sivas, Turkey, 24–26 April 2019; pp. 1–4. [Google Scholar]
- Qiao, Y.; Yang, Y.; Ji, L.; He, J. Analyzing malware by abstracting the frequent itemsets in API call sequences. In Proceedings of the 2013 12th IEEE International Conference on Trust, Security and Privacy in Computing and Communications, IEEE, Melbourne, Australia, 16–18 July 2013; pp. 265–270. [Google Scholar]
- Hansen, S.S.; Larsen, T.M.T.; Stevanovic, M.; Pedersen, J.M. An approach for detection and family classification of malware based on behavioral analysis. In Proceedings of the 2016 International Conference on Computing, Networking and Communications (ICNC), IEEE, Kauai, HI, USA, 15–18 February 2016; pp. 1–5. [Google Scholar]
- Li, C.; Zheng, J. API call-based malware classification using recurrent neural networks. J. Cyber Secur. Mobil. 2021, 10, 617–640. [Google Scholar] [CrossRef]
- Eskandari, M.; Khorshidpur, Z.; Hashemi, S. To incorporate sequential dynamic features in malware detection engines. In Proceedings of the 2012 European Intelligence and Security Informatics Conference, IEEE, Odense, Denmark, 22–24 August 2012; pp. 46–52. [Google Scholar]
- Oliveira, A.; Sassi, R. Behavioral malware detection using deep graph convolutional neural networks. TechRxiv 2019, preprint. [Google Scholar] [CrossRef]
- Tang, M.; Qian, Q. Dynamic API call sequence visualisation for malware classification. IET Inf. Secur. 2019, 13, 367–377. [Google Scholar] [CrossRef]
- Schofield, M.; Alicioglu, G.; Binaco, R.; Turner, P.; Thatcher, C.; Lam, A.; Sun, B. Convolutional neural network for malware classification based on API call sequence. In Proceedings of the 8th International Conference on Artificial Intelligence and Applications (AIAP 2021), Zurich, Switzerland, 23–24 January 2021. [Google Scholar]
- Ali, M.; Shiaeles, S.; Bendiab, G.; Ghita, B. MALGRA: Machine learning and N-gram malware feature extraction and detection system. Electronics 2020, 9, 1777. [Google Scholar] [CrossRef]
- Cannarile, A.; Dentamaro, V.; Galantucci, S.; Iannacone, A.; Impedovo, D.; Pirlo, G. Comparing Deep Learning and Shallow Learning Techniques for API Calls Malware Prediction: A Study. Appl. Sci. 2022, 12, 1645. [Google Scholar] [CrossRef]
- Daeef, A.Y.; Al-Naji, A.; Chahl, J. Features Engineering for Malware Family Classification Based API Call. Computers 2022, 11, 160. [Google Scholar] [CrossRef]
- Oliveira, A. Malware Analysis Datasets: API Call Sequences. 2022. Available online: https://ieee-dataport.org/open-access/malware-analysis-datasets-api-call-sequences (accessed on 10 July 2022).
- Rogel-Salazar, J. Data Science and Analytics with Python; Chapman and Hall/CRC: Boca Raton, FL, USA, 2018. [Google Scholar]
- Saxe, J.; Sanders, H. Malware Data Science: Attack Detection and Attribution; No Starch Press: San Francisco, CA, USA, 2018. [Google Scholar]
- Networkx. NetworkX Network Analysis in Python. 2022. Available online: https://networkx.org/ (accessed on 15 October 2022).
- Graphviz. What is Graphviz? 2022. Available online: https://graphviz.org/ (accessed on 20 October 2022).
- VirusTotal. VirusTotal API v3 Overview. 2022. Available online: https://developers.virustotal.com/reference/overview (accessed on 16 October 2022).
Disclaimer/Publisher’s Note: The statements, opinions and data contained in all publications are solely those of the individual author(s) and contributor(s) and not of MDPI and/or the editor(s). MDPI and/or the editor(s) disclaim responsibility for any injury to people or property resulting from any ideas, methods, instructions or products referred to in the content. |
© 2023 by the authors. Licensee MDPI, Basel, Switzerland. This article is an open access article distributed under the terms and conditions of the Creative Commons Attribution (CC BY) license (https://creativecommons.org/licenses/by/4.0/).