

Hyperparameter Optimization of Ensemble Models for Spam Email Detection

Abstract
:1. Introduction
2. Related Work
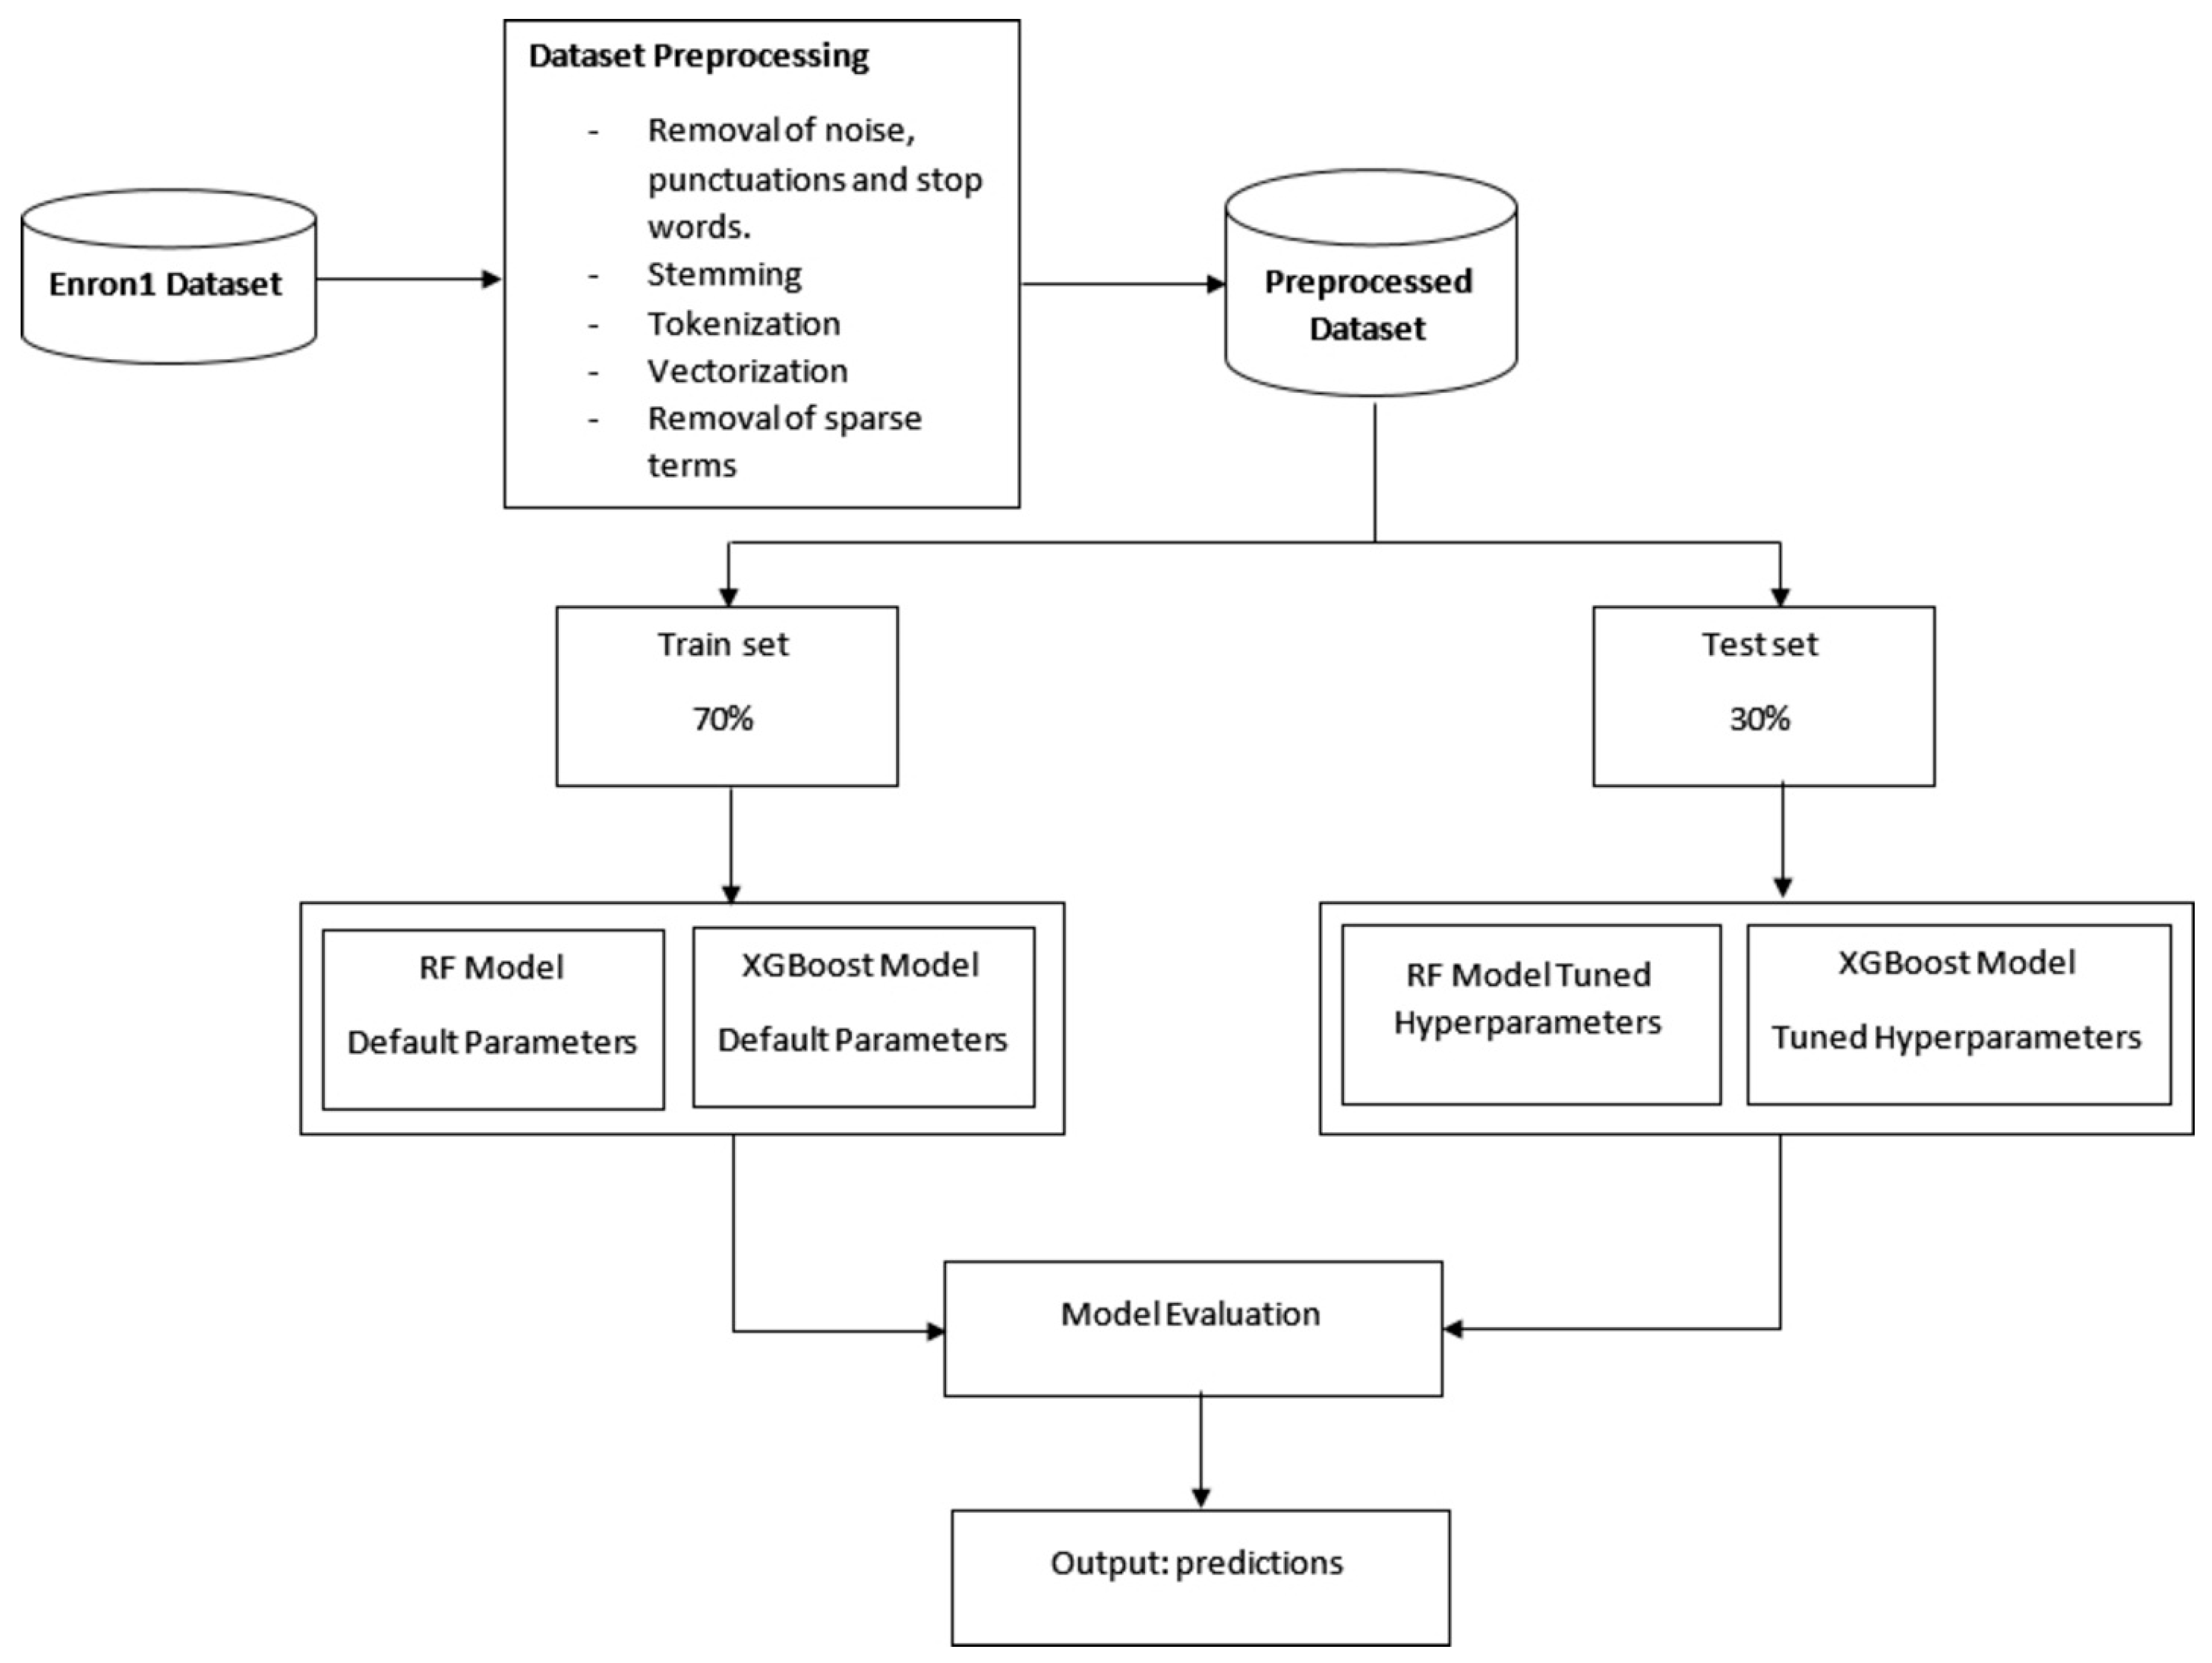
3. Methodology
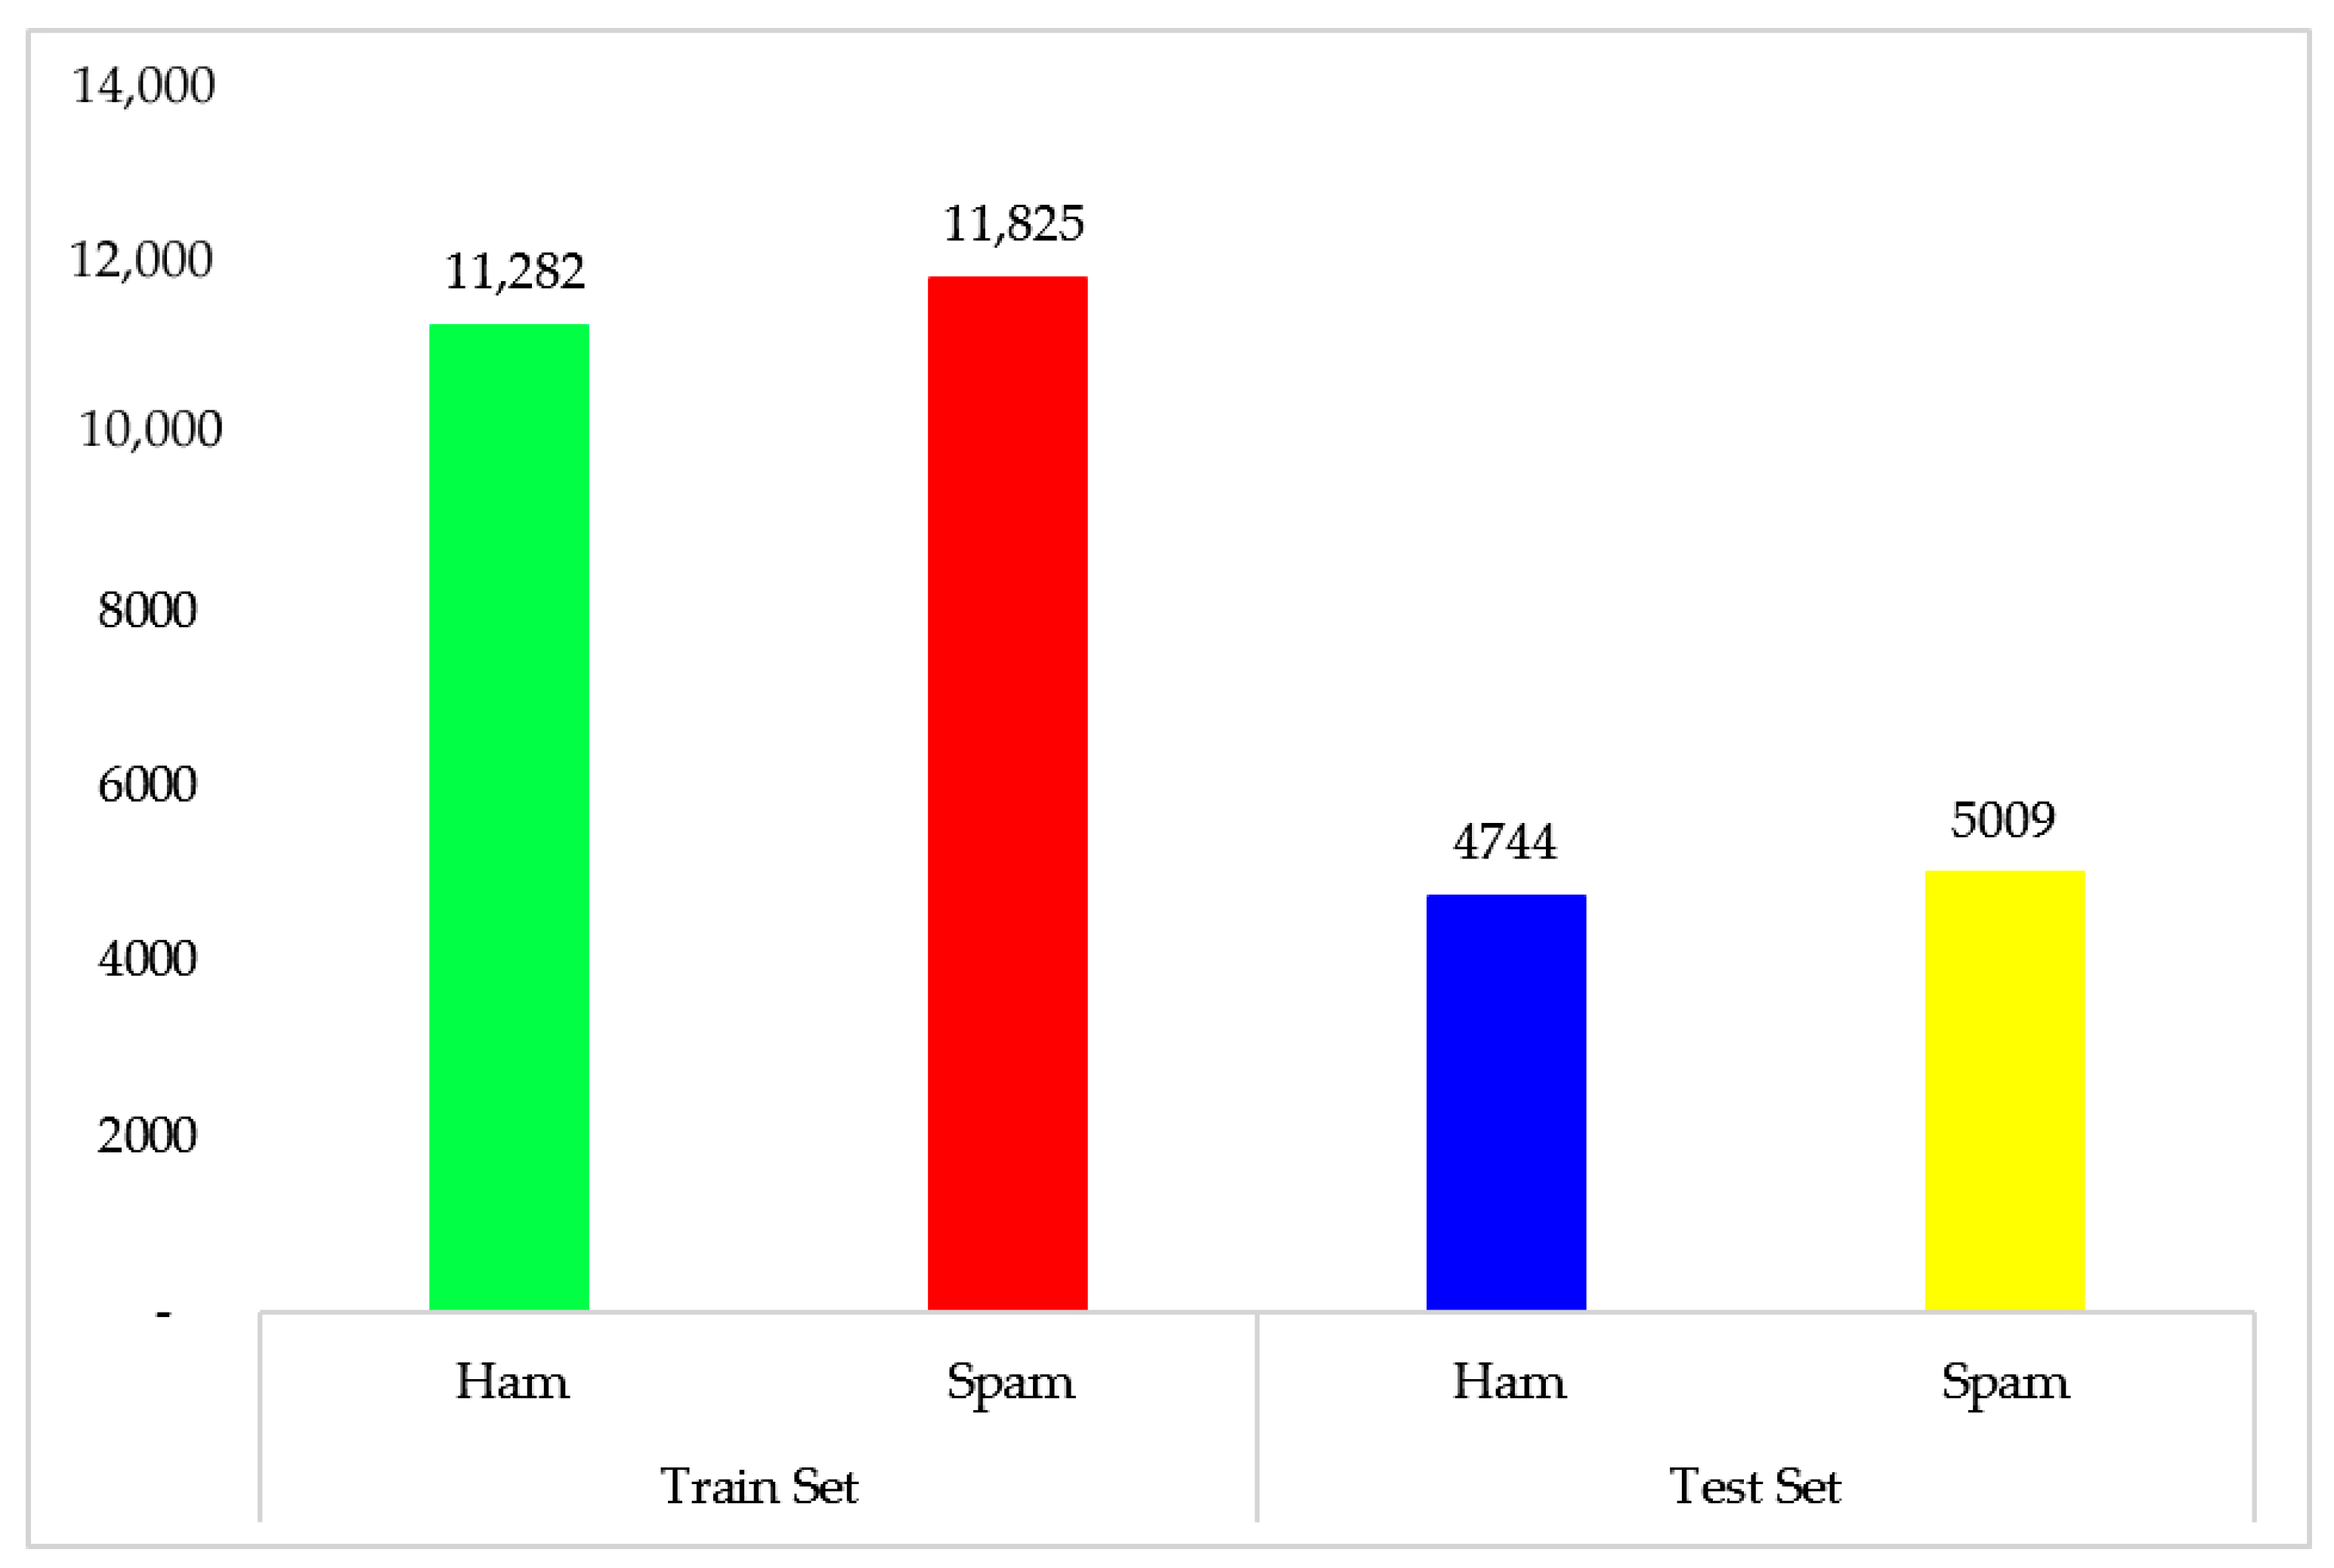
3.1. Dataset
3.2. Dataset Cleaning
3.3. Methods and Machine Learning Classifiers
3.3.1. Random Forest
3.3.2. XGBoost
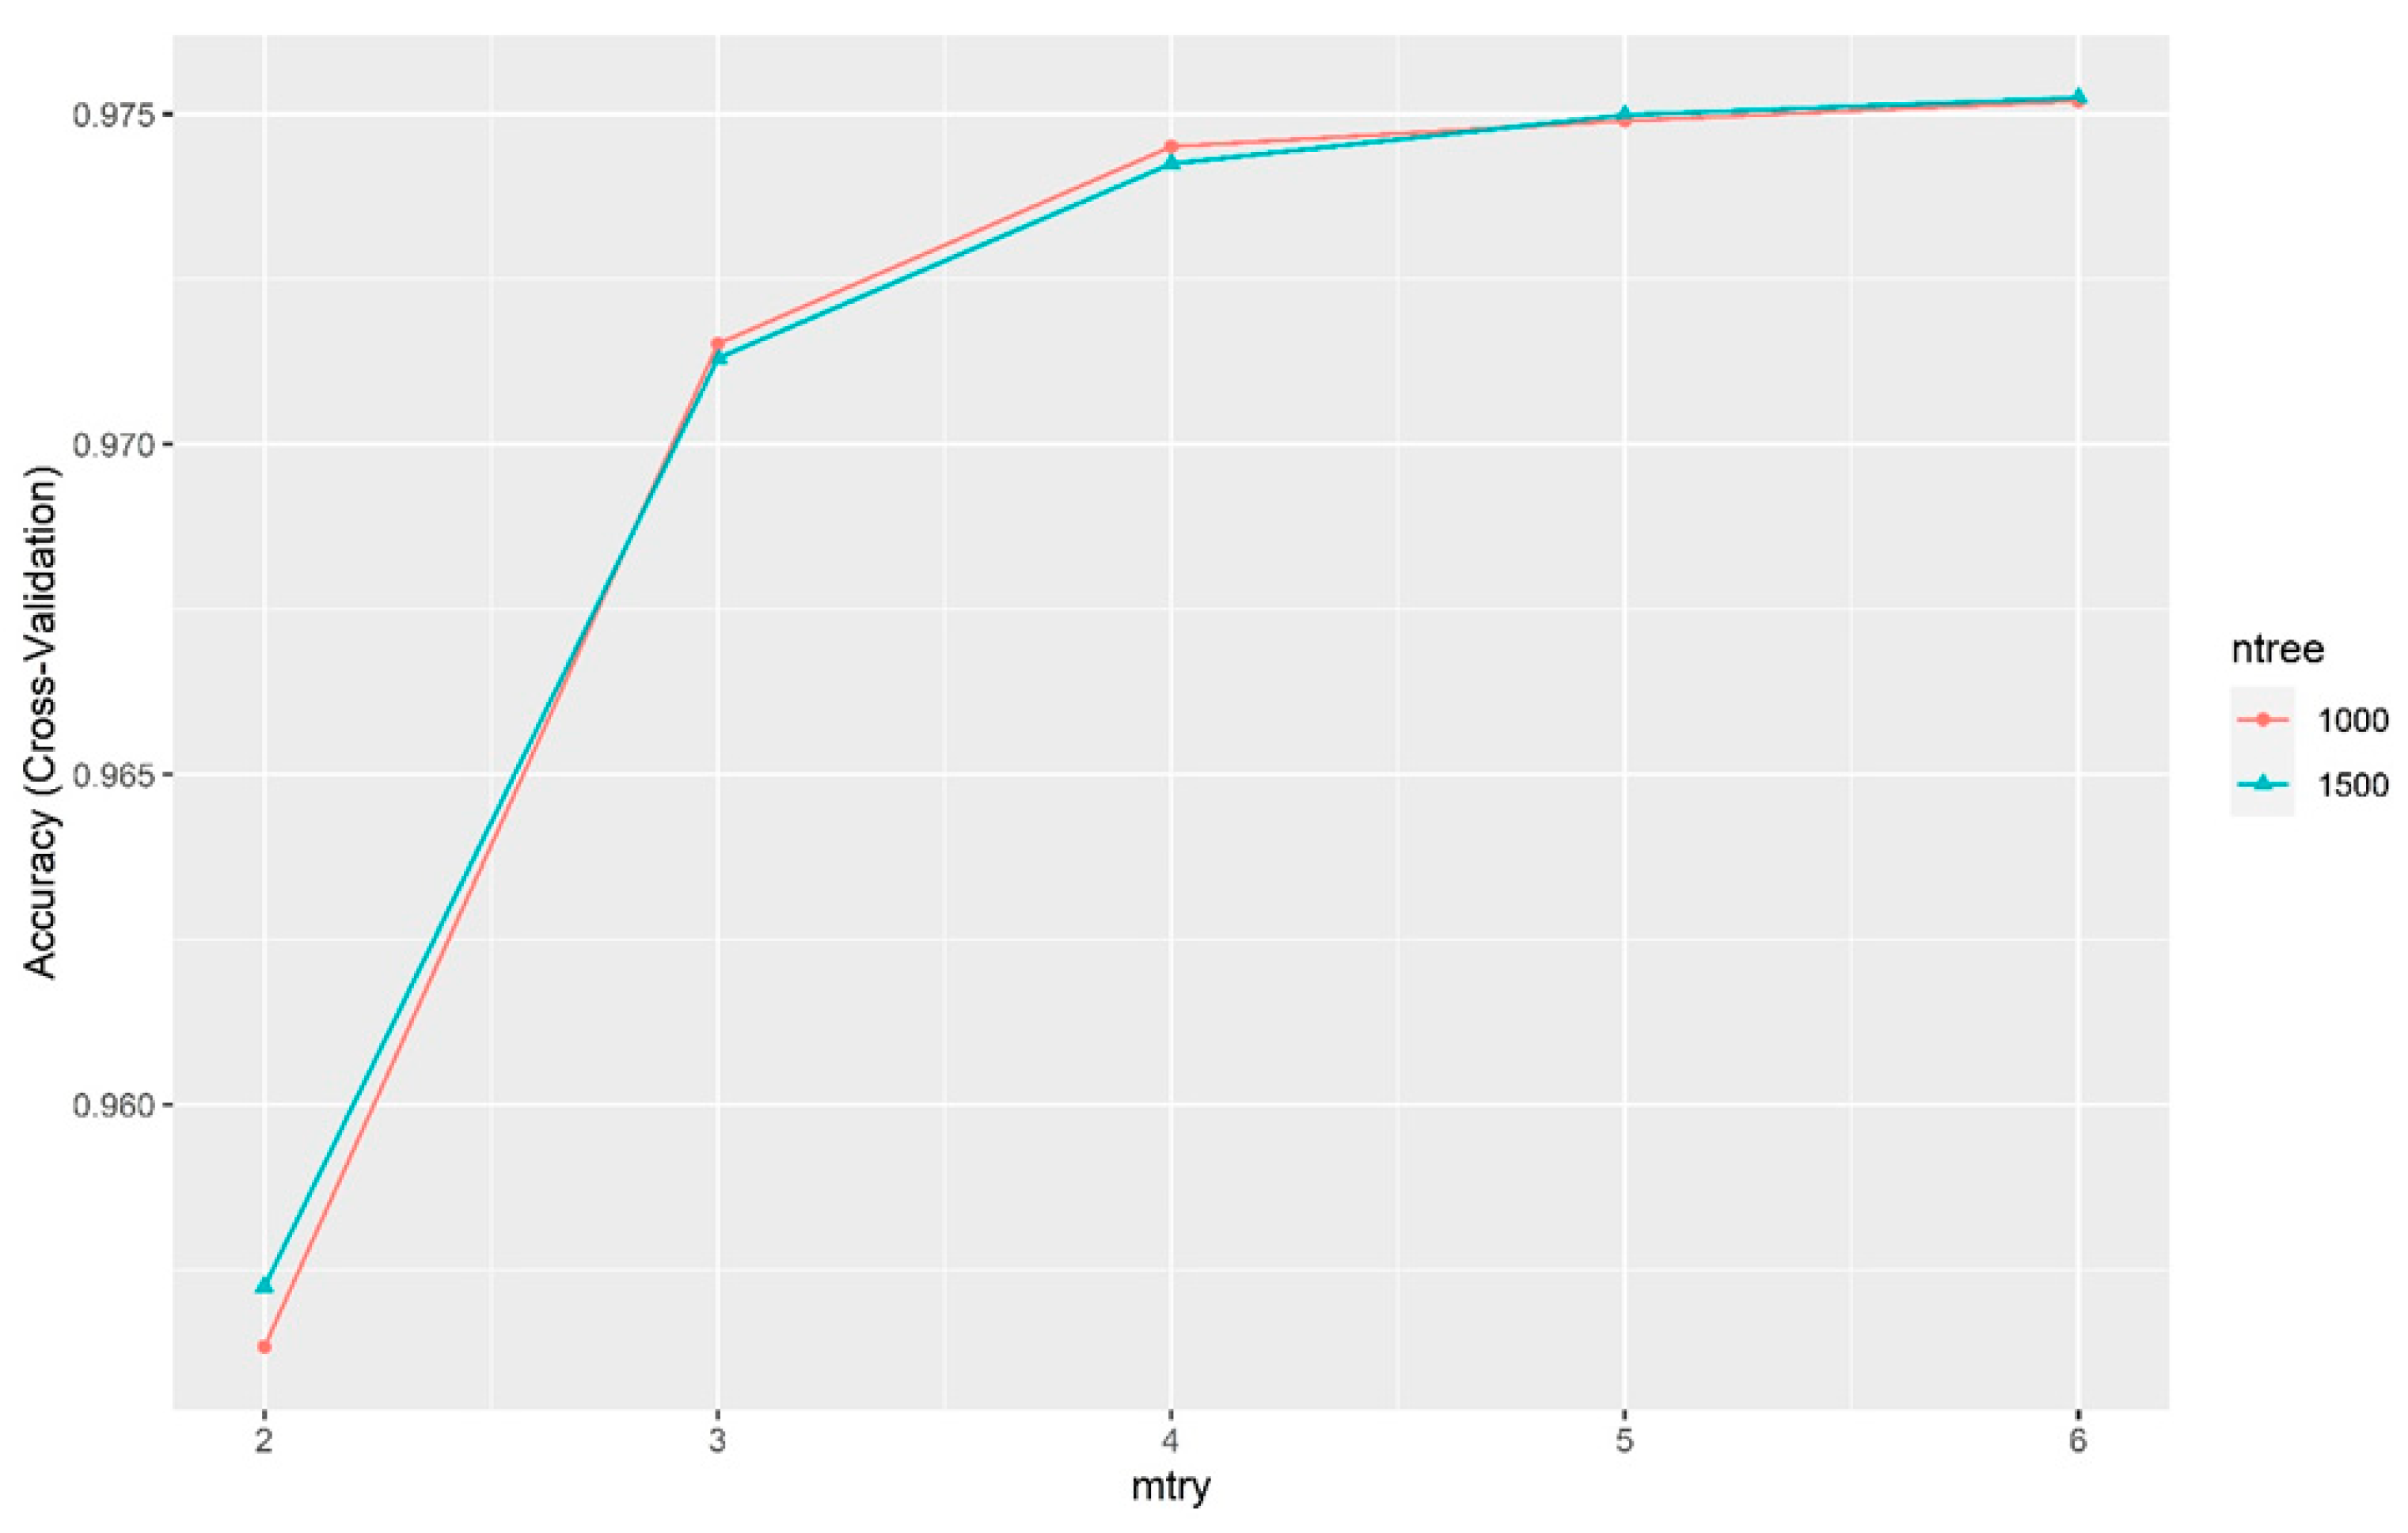
3.3.3. Hyperparameter Tuning Technique–Grid Search Method
3.3.4. Cross Validation
4. Results and Discussion
4.1. Experimental Testbed and Settings
4.2. Results and Discussion
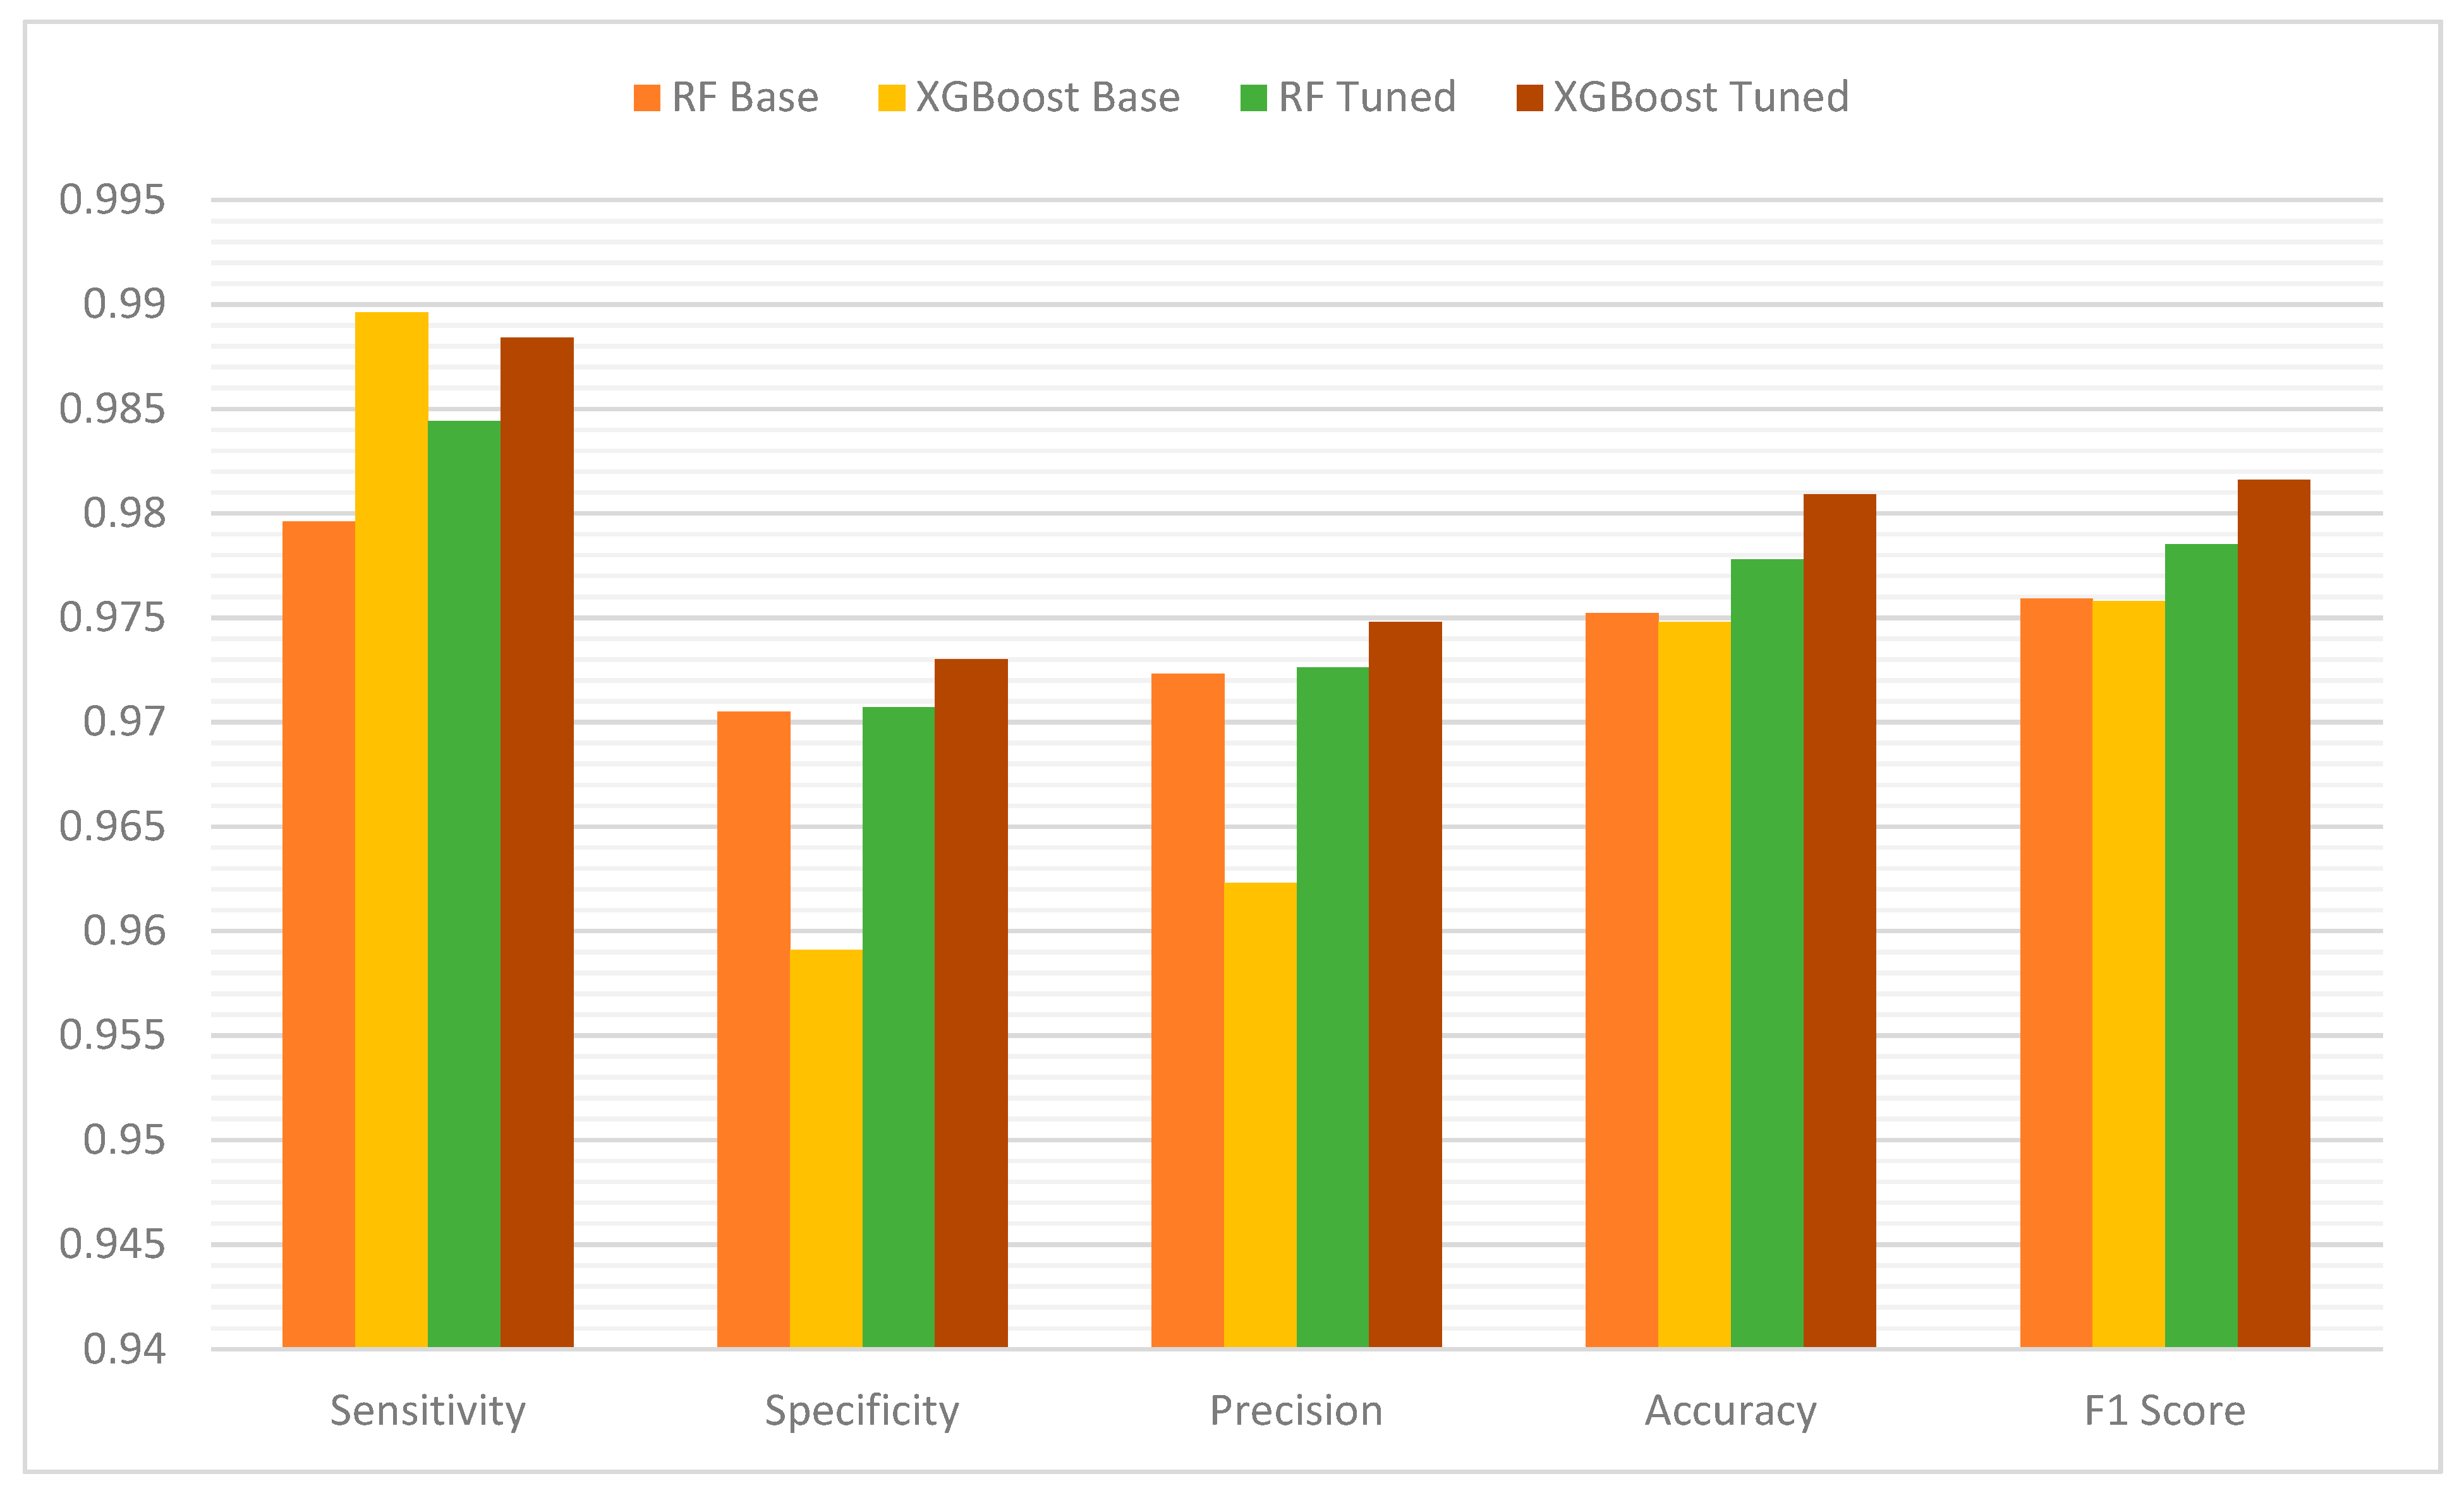
4.2.1. Performance Evaluation Metrics
Accuracy
Sensitivity (Recall)
Precision
F1-Score
Specificity
Receiver Operating Curve (ROC)
5. Conclusions
Author Contributions
Funding
Institutional Review Board Statement
Informed Consent Statement
Data Availability Statement
Conflicts of Interest
References
- Dixon, S. Global Average Daily Spam Volume 2021. Available online: https://www.statista.com/statistics/1270424/daily-spam-volume-global/ (accessed on 18 July 2022).
- FBI. Federal Bureau of Investigation: Internet Crime Report 2021. Available online: https://www.ic3.gov/Media/PDF/AnnualReport/2021_IC3Report.pdf (accessed on 6 August 2022).
- Securelist Types of Text-Based Fraud. Available online: https://securelist.com/mail-text-scam/106926/ (accessed on 4 August 2022).
- Onova, C.U.; Omotehinwa, T.O. Development of a Machine Learning Model for Image-Based Email Spam Detection. FUOYE J. Eng. Technol. 2021, 6, 336–340. [Google Scholar] [CrossRef]
- Bindu, V.; Thomas, C. Knowledge Base Representation of Emails Using Ontology for Spam Filtering. Adv. Intell. Syst. Comput. 2021, 1133, 723–735. [Google Scholar] [CrossRef]
- Kaddoura, S.; Chandrasekaran, G.; Popescu, D.E.; Duraisamy, J.H. A Systematic Literature Review on Spam Content Detection and Classification. PeerJ Comput. Sci. 2022, 8, e830. [Google Scholar] [CrossRef] [PubMed]
- Méndez, J.R.; Cotos-Yañez, T.R.; Ruano-Ordás, D. A New Semantic-Based Feature Selection Method for Spam Filtering. Appl. Soft Comput. 2019, 76, 89–104. [Google Scholar] [CrossRef]
- Ahmed, N.; Amin, R.; Aldabbas, H.; Koundal, D.; Alouffi, B.; Shah, T. Machine Learning Techniques for Spam Detection in Email and IoT Platforms: Analysis and Research Challenges. Secur. Commun. Networks 2022, 2022, 1862888. [Google Scholar] [CrossRef]
- Hosseinalipour, A.; Ghanbarzadeh, R. A Novel Approach for Spam Detection Using Horse Herd Optimization Algorithm. Neural Comput. Appl. 2022, 34, 13091–13105. [Google Scholar] [CrossRef]
- Ismail, S.S.I.; Mansour, R.F.; Abd El-Aziz, R.M.; Taloba, A.I. Efficient E-Mail Spam Detection Strategy Using Genetic Decision Tree Processing with NLP Features. Comput. Intell. Neurosci. 2022, 2022, 7710005. [Google Scholar] [CrossRef]
- Ravi Kumar, G.; Murthuja, P.; Anjan Babu, G.; Nagamani, K. An Efficient Email Spam Detection Utilizing Machine Learning Approaches. Proc. Lect. Notes Data Eng. Commun. Technol. 2022, 96, 141–151. [Google Scholar]
- Kontsewaya, Y.; Antonov, E.; Artamonov, A. Evaluating the Effectiveness of Machine Learning Methods for Spam Detection. Procedia Comput. Sci. 2021, 190, 479–486. [Google Scholar] [CrossRef]
- Batra, J.; Jain, R.; Tikkiwal, V.A.; Chakraborty, A. A Comprehensive Study of Spam Detection in E-Mails Using Bio-Inspired Optimization Techniques. Int. J. Inf. Manag. Data Insights 2021, 1, 100006. [Google Scholar] [CrossRef]
- Dedeturk, B.K.; Akay, B. Spam Filtering Using a Logistic Regression Model Trained by an Artificial Bee Colony Algorithm. Appl. Soft Comput. J. 2020, 91, 106229. [Google Scholar] [CrossRef]
- Sagi, O.; Rokach, L. Ensemble Learning: A Survey. Wiley Interdiscip. Rev. Data Min. Knowl. Discov. 2018, 8, e1249. [Google Scholar] [CrossRef]
- Sheu, J.J.; Chu, K.T.; Li, N.F.; Lee, C.C. An Efficient Incremental Learning Mechanism for Tracking Concept Drift in Spam Filtering. PLoS ONE 2017, 12, e0171518. [Google Scholar] [CrossRef]
- Liu, X.; Zou, P.; Zhang, W.; Zhou, J.; Dai, C.; Wang, F.; Zhang, X. CPSFS: A Credible Personalized Spam Filtering Scheme by Crowdsourcing. Wirel. Commun. Mob. Comput. 2017, 2017, 1457870. [Google Scholar] [CrossRef]
- Bahgat, E.M.; Rady, S.; Gad, W.; Moawad, I.F. Efficient Email Classification Approach Based on Semantic Methods. Ain Shams Eng. J. 2018, 9, 3259–3269. [Google Scholar] [CrossRef]
- Agarwal, K.; Kumar, T. Email Spam Detection Using Integrated Approach of Naïve Bayes and Particle Swarm Optimization. In Proceedings of the 2nd International Conference on Intelligent Computing and Control Systems, ICICCS 2018, Madurai, India, 14–15 June 2018; Institute of Electrical and Electronics Engineers Inc.: Piscataway, NJ, USA, 2019; pp. 685–690. [Google Scholar]
- Dada, E.G.; Bassi, J.S.; Chiroma, H.; Abdulhamid, S.M.; Adetunmbi, A.O.; Ajibuwa, O.E. Machine Learning for Email Spam Filtering: Review, Approaches and Open Research Problems. Heliyon 2019, 5, e01802. [Google Scholar] [CrossRef] [PubMed]
- Saha, S.; DasGupta, S.; Das, S.K. Spam Mail Detection Using Data Mining: A Comparative Analysis. Smart Innov. Syst. Technol. 2019, 104, 571–580. [Google Scholar] [CrossRef]
- Nandhini, S.; Marseline, D.J. Performance Evaluation of Machine Learning Algorithms for Email Spam Detection. In Proceedings of the International Conference on Emerging Trends in Information Technology and Engineering, ic-ETITE 2020, Vellore, India, 24–25 February 2020; Institute of Electrical and Electronics Engineers Inc.: Piscataway, NJ, USA, 2020. [Google Scholar]
- Guangjun, L.; Nazir, S.; Khan, H.U.; Haq, A.U. Spam Detection Approach for Secure Mobile Message Communication Using Machine Learning Algorithms. Secur. Commun. Networks 2020, 2020, 8873639. [Google Scholar] [CrossRef]
- Jancy Sickory Daisy, S.; Rijuvana Begum, A. Smart Material to Build Mail Spam Filtering Technique Using Naive Bayes and MRF Methodologies. Proc. Mater. Today 2021, 47, 446–452. [Google Scholar] [CrossRef]
- Xia, T.; Chen, X. A Weighted Feature Enhanced Hidden Markov Model for Spam SMS Filtering. Neurocomputing 2021, 444, 48–58. [Google Scholar] [CrossRef]
- Şimşek, H.; Aydemir, E. Classification of Unwanted E-Mails (Spam) with Turkish Text by Different Algorithms in Weka Program. J. Soft Comput. Artif. Intell. 2022, 3, 1–10. [Google Scholar] [CrossRef]
- Xia, T.; Chen, X. Category-Learning Attention Mechanism for Short Text Filtering. Neurocomputing 2022, 510, 15–23. [Google Scholar] [CrossRef]
- ENRON. The Enron-Spam Datasets. Available online: https://www2.aueb.gr/users/ion/data/enron-spam/ (accessed on 16 August 2022).
- Wiechmann, M. GitHub—MWiechmann/Enron_spam_data: The Enron-Spam Dataset Preprocessed in a Single, Clean Csv File. Available online: https://github.com/MWiechmann/enron_spam_data (accessed on 17 August 2022).
- Feinerer, I. Introduction to the Tm Package Text Mining in R. Available online: https://cran.r-project.org/web/packages/tm/vignettes/tm.pdf (accessed on 16 August 2022).
- Kolog, E.A.; Balogun, O.S.; Adjei, R.O.; Devine, S.N.O.; Atsa’am, D.D.; Dada, O.A.; Omotehinwa, T.O. Predictive Model for Early Detection of Mother’s Mode of Delivery with Feature Selection. In Delivering Distinctive Value in Emerging Economies; Anning-Dorson, T., Boateng, S.L., Boateng, R., Eds.; Productivity Press: New York, NY, USA, 2022; pp. 241–264. ISBN 9781003152217. [Google Scholar]
- Breiman, L. Random Forests. Mach. Learn. 2001, 45, 5–32. [Google Scholar] [CrossRef]
- Oshiro, T.M.; Perez, P.S.; Baranauskas, J.A. How Many Trees in a Random Forest? Proc. Lect. Notes Comput. Sci. 2012, 7376, 154–168. [Google Scholar]
- Guan, H.; Li, J.; Chapman, M.; Deng, F.; Ji, Z.; Yang, X. Integration of Orthoimagery and Lidar Data for Object-Based Urban Thematic Mapping Using Random Forests. Int. J. Remote Sens. 2013, 34, 5166–5186. [Google Scholar] [CrossRef]
- Chen, T.; Guestrin, C. XGBoost: A Scalable Tree Boosting System. In Proceedings of the ACM SIGKDD International Conference on Knowledge Discovery and Data Mining, San Francisco, CA, USA, 13–17 August 2016; ACM: New York, NY, USA, 2016; pp. 785–794. [Google Scholar]
- Oyewola, D.O.; Dada, E.G.; Omotehinwa, T.O.; Emebo, O.; Oluwagbemi, O.O. Application of Deep Learning Techniques and Bayesian Optimization with Tree Parzen Estimator in the Classification of Supply Chain Pricing Datasets of Health Medications. Appl. Sci. 2022, 12, 10166. [Google Scholar] [CrossRef]
- Hoque, K.E.; Aljamaan, H. Impact of Hyperparameter Tuning on Machine Learning Models in Stock Price Forecasting. IEEE Access 2021, 9, 163815–163830. [Google Scholar] [CrossRef]
- Bentéjac, C.; Csörgő, A.; Martínez-Muñoz, G. A Comparative Analysis of Gradient Boosting Algorithms. Artif. Intell. Rev. 2021, 54, 1937–1967. [Google Scholar] [CrossRef]


| Steps | Data Processing Activities | Functions |
|---|---|---|
| 1 | Removal of non-ASCII codes and emoticons | email_text = gsub(“[^\x01-\x7F]”, ““, email_text) |
| 2 | Removal of HTML tags | email_text = gsub(“<.*/>“,”“,email_text) |
| 3 | Removal of numbers | email_text = removeNumbers(email_text) |
| 4 | Remove all the URLs | email_text = gsub(“ ?(f|ht)tp(s?)://(.*)[.][a-z]+”, ““, email_text) |
| 5 | Remove extra white spaces | email_text = tm_map(email_text, stripWhitespace) |
| 6 | Removal of punctuations | email_text = tm_map(email_text,removePunctuation) |
| 7 | Removal of stop words | email_text = tm_map(corpus,removeWords, stopwords(“english”)) |
| 8 | Stemming | email_text = tm_map(email_text,stemDocument) |
| 9 | Tokenization and Vectorization | doc_mat = DocumentTermMatrix(email_text) |
| 10 | Removal of sparse terms | doc_mat_sr = removeSparseTerms(doc_mat, 0.98) |
| Algorithm | Hyperparameter Values |
|---|---|
| Baseline Models | |
| Random Forest | ntree = 500, mtry = 23 |
| XGBoost | max.depth = 6, nrounds = 100, objective = ”binary:logistic”, eta = 0.3 |
| Tuned Models | |
| Random Forest | First run: ntree = (1000, 1500) mtry = (7, 10, 13, 16, 19, 22, 25, 28, 31, 34, 37, 40) |
| Second run: ntree = (1000, 1500), mtry = (2, 3, 4, 5, 6) | |
| XGBoost | max.depth = (5, 6, 7), nrounds = (70, 140, 210, 280, 350, 420, 490, 560, 630, 700), objective = ”binary:logistic”, eta = (0.20, 0.21, 0.22, 0.23, 0.24, 0.25, 0.26, 0.27, 0.28, 0.29, 0.30), colsample_bytree = 0.6 |
| Predicted Class | ||
|---|---|---|
| Actual Class | TP | FN |
| FP | TN | |
| RF Baseline Model | XGBoost Baseline Model | ||||
|---|---|---|---|---|---|
| Spam | Ham | Spam | Ham | ||
| Spam | 4907 | 102 | Spam | 4957 | 52 |
| Ham | 140 | 4604 | Ham | 194 | 4550 |
| RF Tuned Model | XGBoost Tuned Model | ||||
| Spam | 4931 | 78 | Spam | 4951 | 58 |
| Ham | 139 | 4605 | Ham | 128 | 4616 |
Disclaimer/Publisher’s Note: The statements, opinions and data contained in all publications are solely those of the individual author(s) and contributor(s) and not of MDPI and/or the editor(s). MDPI and/or the editor(s) disclaim responsibility for any injury to people or property resulting from any ideas, methods, instructions or products referred to in the content. |
© 2023 by the authors. Licensee MDPI, Basel, Switzerland. This article is an open access article distributed under the terms and conditions of the Creative Commons Attribution (CC BY) license (https://creativecommons.org/licenses/by/4.0/).
Share and Cite
Omotehinwa, T.O.; Oyewola, D.O. Hyperparameter Optimization of Ensemble Models for Spam Email Detection. Appl. Sci. 2023, 13, 1971. https://doi.org/10.3390/app13031971
Omotehinwa TO, Oyewola DO. Hyperparameter Optimization of Ensemble Models for Spam Email Detection. Applied Sciences. 2023; 13(3):1971. https://doi.org/10.3390/app13031971
Chicago/Turabian StyleOmotehinwa, Temidayo Oluwatosin, and David Opeoluwa Oyewola. 2023. "Hyperparameter Optimization of Ensemble Models for Spam Email Detection" Applied Sciences 13, no. 3: 1971. https://doi.org/10.3390/app13031971
APA StyleOmotehinwa, T. O., & Oyewola, D. O. (2023). Hyperparameter Optimization of Ensemble Models for Spam Email Detection. Applied Sciences, 13(3), 1971. https://doi.org/10.3390/app13031971