Featured Application
Collapsing cavitation bubbles can be used in material surface cleaning, the medical field, and so on. By adjusting the micro-jet intensity of the collapsing bubbles, the cavitation phenomenon can be employed to clean irregular material surfaces, such as sections, cracks, and vegetable leaves. In the medical field, cavitation bubbles can be used as microbubble contrast agents for ultrasound diagnostic imaging or vehicles for drug or gene delivery. The growth and violent collapse of cavitation bubbles can also be employed in sterilization or killing viruses such as COVID-19.
Abstract
The interaction mechanism between the cavitation bubble and a solid wall is a basic problem in bubble collapse prevention and application. In particular, when bubble collapse occurs near solid walls with arbitrarily complex geometries, it is difficult to efficiently establish a model and quantitatively explore the interaction mechanism between bubbles and solid walls. Based on the advantages of the lattice Boltzmann method, a model for cavitation bubble collapse close to a solid wall was established using the pseudopotential multi-relaxation-time lattice Boltzmann model. Solid walls with arbitrarily complex geometries were introduced in the computational domain, and the fractal dimension was used to quantify the complexity of the solid wall. Furthermore, owing to the lack of periodicity, symmetry, spatial uniformity and obvious correlation in this process, the Minkowski functionals-based morphological analysis method was introduced to quantitatively describe the temporal evolution of collapsing bubble profiles and acquire effective information from the process. The interaction mechanism between the bubble and solid wall was investigated using evolutions of physical fields. In addition, the influences of the solid walls’ surface conditions and the position parameter on collapsing bubbles were discussed. These achievements provide an efficient tool for quantifying the morphological changes of the collapsing bubble.
1. Introduction
Cavitation occurs when the local pressure becomes less than a liquid’s saturated vapor pressure. The bubble collapse that happens near a solid wall can severely damage the neighboring solid surface owing to the resulting high velocities, pressure, and temperature [1]. In addition, the bubble experiences inward deformation, micro-jet formation, collapse, or multiple collapses owing to the retarding effect of the solid wall. The potential applications of cavitation have been extensively explored in material surface cleaning [2], ultrasonic therapy [3], and environmental protection [4].
The interaction mechanism between a cavitation bubble and a solid wall has an important role in various applications. In particular, when cavitation occurs near a solid wall involving a complex geometry, the profile evolution of the collapsing bubble can be more varied. The effect of the surface geometry of the solid wall on the dynamic behavior of the collapsing bubble has been experimentally investigated [5,6,7]. A complex boundary can significantly alter the dynamic behavior of cavitation bubbles, such as the bubble shape and micro-jet. However, it is difficult to investigate the interaction mechanism between bubbles and solid walls with arbitrarily complex geometries because of the limitations of experimental methods, e.g., experimental conditions cannot be changed at any time. Numerical methods have been adopted to efficiently simulate cavitation bubble collapse near a solid wall and investigate the dynamic bubble collapse process. Conventional numerical simulation methods include the finite volume method (FVM) [8,9], the boundary element method (BEM) [10], and the finite element method [11]. Yu et al. [9] investigated the dynamic process of a vapor bubble collapse near a rectangular groove wall using the FVM and the volume of fluid (VOF) method. Saleki-Haselghoubi and Dadvand [10] adopted the BEM to investigate the dynamics of a spark-generated bubble that oscillated near a circular aperture in a curved rigid plate. However, these macroscopic numerical methods require other approaches to track or capture gas–liquid interfaces, such as the VOF [12] and level set method [13], which may reduce computational efficiency. In implementing the complex geometry boundaries, it is difficult for these macroscopic models to choose approximate functions in each discrete unit to characterize changes in arbitrarily complex boundaries.
Over the past few decades, the lattice Boltzmann method (LBM), has been developed as a powerful tool for simulating multiphase flow problems [14,15,16,17,18,19]. The LBM based on the discrete Boltzmann equation with the simplified collision operator can model phase segregation and interfacial dynamics in multiphase flows with collision and streaming steps [15]. The mesoscopic approach has multiple unique advantages such as high efficiency, completely parallel algorithms, and the simplicity of programming. Generally, the multiphase models in the LBM inlude four kinds of different models, i.e., the color-gradient [20], pseudopotential [21,22,23], free-energy [24], and phase-field models [25]. The pseudopotential model proposed by Shan and Chen, is also named as Shan–Chen (SC) model. In this model, an interparticle potential is proposed to simulate the interactions between the fluids, from which a non-monotonic equation of state (EOS) can be obtained. As a result, the interface can be formed automatically, and the pressure can be calculated from the EOS efficiently. Sukop and Or [26] first introduced the Shan–Chen LBM into the cavitation field and concluded that applications to more complex problems should be possible. Later on, several scholars devoted themselves to investigating the cavitation phenomenon with the pseudopotential LBM [27,28,29,30,31]. Meantime, the LBM has good spatiotemporal flexibility in dealing with boundary conditions, which enables the easy introduction of solid boundaries with complex geometries into numerical models. Shan et al. [32,33] simulated the collapse process of a single bubble near a plane solid wall and between two parallel solid walls. Mao et al. [34] and He et al. [35] both used a multi-relaxation-time (MRT) pseudopotential model to simulate dual-bubble collapse near a rigid boundary. It can be found that the relative position of two bubbles plays an important role in the bubble near-wall collapse process. Xue et al. [36] simulated the cavitation bubble near a curved wall using the MRT-SC model and discussed the influence of bubble–wall distance on bubble collapse. Shan et al. [37,38] investigated the influence of a rectangular bulge solid wall and hydrophobic concave corner on cavitation bubble collapse from the evolution of physics fields. The geometry of the solid wall significantly influences bubble collapse. However, previous studies have considered the complex geometries of solid walls as periodic shapes with equal widths [9,37]. This cannot account for certain characteristics of actual complex solid walls, such as sections and cracks. Thus, it is necessary to accurately model actual complex solid walls.
In contrast to the solid walls in previous works, the arbitrarily complex geometry solid walls have more complex geometries. To reflect the differences between the solid walls, the fractal dimension is adopted to quantitatively describe the complexity of a solid wall, and it increases with the complexity. Various processes occur when a cavitation bubble collapses near a solid wall with a complex geometry. Further research is required on the methods for describing the cavitation bubble near-wall collapse process and the effect of the solid wall on the collapsing bubble considering the large amount of data obtained from the bubble collapse process, various complex configurations, and evolutions of physical fields. The Minkowski functionals-based morphological analysis method (Min-MAM) [39] has been introduced to investigate complicated physical fields. Sofonea and Mecke [40,41] introduced the Minkowski functionals to describe the morphological evolution of homogeneous phases during spinodal decomposition. Gan et al. [42] characterized the density and velocity fields of the phase separation process in a complex fluid using the Minkowski functionals. They clarified the effect of the temperature field on phase morphology and spinodal decomposition. Xu et al. [43] conducted a detailed review of the Minkowski functionals and adopted them to explore the complex procedure of shock wave reaction on porous material. The Min-MAM is an efficient tool for analyzing and acquiring effective information in complicated physical fields [44,45,46]. Therefore, the Min-MAM can potentially be adopted to quantify the profile evolution of collapsing bubbles.
In this study, we introduce a solid wall with an arbitrarily complex geometry and investigate the dynamic bubble collapse process. The pseudopotential MRT-LBM is adopted to establish the collapse model of a cavitation bubble in the vicinity of a solid wall with an arbitrarily complex geometry. Furthermore, the fractal dimension and Min-MAM are used to quantitatively describe the complexity of the solid wall and the evolution of bubble morphology. The interaction mechanism between a cavitation bubble and a solid wall is investigated by changing the surface complexity, geometric features of the solid wall, and position offset parameter. In general, this study systematically investigates the effect of solid walls with arbitrarily complex geometries on the bubble collapse process. The morphological evolution of the collapsing bubble is described with quantitative measures, which provides an alternative tool for analyzing the cavitation bubble near-wall collapse process. The remainder of this paper is organized as follows. The pseudopotential MRT-LBM and Min-MAM are presented in Section 2. The numerical simulation model and dynamic bubble collapse process are described in Section 3. The morphological characterization of the collapsing bubble in the vicinity of a solid wall with a complex geometry is discussed in Section 4. Finally, the conclusions are presented in Section 5.
2. Methods
2.1. Pseudopotential MRT-LBM
The pseudopotential MRT-LBM is adopted to simulate the flow field. By using the MRT collision operator, the evolution of the density distribution function can be expressed as [47]
where is the particle density distribution function, is the corresponding equilibrium distribution function, is the particle position, is the time step, is the discrete velocity along the direction, is the component of forcing term along the direction, is an orthogonal transformation matrix, and is the relaxation diagonal matrix.
For the D2Q9 lattice model, is defined as [48]
is given by
and is expressed as
where , , , , , and are the relaxation time factors for different moments. In the simulation, these relaxation times are selected as , , and .
Using and , and can be projected onto the moment space. Equation (1) can be transformed to [49]
where , is the unit tensor, and is the forcing term in the moment space with . For the D2Q9 lattice, can be expressed as
where is the macroscopic density, is the macroscopic velocity and .
Then, the streaming process can be given as
where .
in Equation (6) can be obtained from
where is the total force acting on the fluid system in the two-dimensional (2D) space. includes the fluid–fluid interactive, fluid–solid interactive, and bulk forces. According to the criteria described in Ref. [50], the influence of gravity can be neglected in the investigation of the cavitation bubble collapse problem. The fluid–fluid interaction force is adopted in the pseudopotential LBM, which is expressed as [51]
where is the overall interaction strength, is the pseudopotential, and is the weight coefficient, which is given by
In this study, is considered as [51]
where is the prescribed EOS, represents the lattice constant, and is the lattice sound speed. The Carnahan–Starling (C–S) EOS is adopted according to Ref. [52], which is expressed as
where and with and being the critical temperature and pressure, respectively. In our simulation, , , and [52].
For the D2Q9 lattice, the forcing term proposed by Li et al. is expressed as [49]
where is an adjustable coefficient used to tune the mechanical stability condition. In the present study, when is set as 1.86 in the case of a cavitation bubble, the coexistence curve simulated by the pseudopotential MRT-LBM agrees well with the solution of the Maxwell equal-area construction over a wide temperature range [33].
In addition, all physical quantities use the corresponding lattice units under the framework of the LBM, as shown in Table 1.

Table 1.
Basic physical quantity units.
2.2. Min-MAM
The Min-MAM is an effective quantitative method for characterizing shocked porous materials [43] and patterns in the phase separation of complex fluids [42]. Therefore, as the cavitation field is a typical multiphase flow system, the Min-MAM can be applied to quantify the profile evolution of cavitation bubble.
For a pixelized density map , the first step is to set a threshold value and form a binary map, which can be expressed as
where is the position, is the density at , and denotes the corresponding binary map. The grid node at is regarded as a black vertex when is less than . Otherwise, it is regarded as white. A region containing connected black (white) pixels is defined as the black (white) domain [42]. The value of the black (white) domain is 0 (1), as shown in Figure 1. In the 2D space, the three Minkowski functionals geometrically correspond to the fractional area , boundary length , and Euler characteristic .
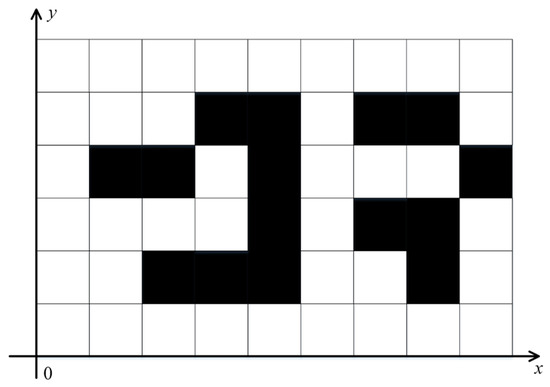
Figure 1.
Binary map.
represents the black domain in a binary map and can be given by
where is the number of white pixels and is the total number of pixels whose function is to normalize . The process of a cavitation bubble collapse near a solid wall is accompanied by the inward deformation of the bubble. Thus, decreases from the maximum value to zero in a certain curve form.
The second morphological parameter of the Minkowski functionals is , which is expressed as
where denotes the pixels that separate the black and white domains. decreases to zero with . However, the two curves are significantly different because of the depression at the top of the cavitation bubble, causing the acceleration of to decrease before the first collapse.
can directly reflect the number of bubbles in the bubble collapse process and is given by
where is the number of connected black domains.
When the first collapse occurs, increases from one to two or more and decreases to zero after the second collapse. The vanishing represents a complete collapse in the dynamic process of bubble near-wall collapse.
3. Cavitation Bubble Collapse near a Solid Wall with Complex Geometry
3.1. Numerical Model
The computational domain for the collapsing bubble near a solid wall with a complex geometry is established in a lattice system. The content inside the bubble is only vapor without other non-condensable gas. As shown in Figure 2, and are the internal and external pressure. denotes the maximum radius of the initial spherical bubble. represents the distance between the bubble center and the bottom of the solid wall. is defined as the dimensionless position offset parameter. A complex geometry boundary with a bounce-back boundary condition [53] is applied in the bottom region. The periodic boundary is defined in the vertical direction, and a pressure boundary by the Zou–He scheme [54] is applied in the top region.
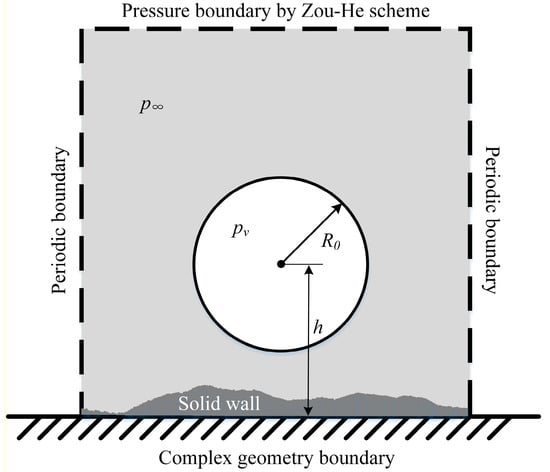
Figure 2.
Computational domain.
The process from the initial spherical bubble with the maximum radius to complete disappearance is studied to investigate the interaction mechanism between the bubble and solid wall. The maximum radius of the initial spherical bubble and the non-dimensional temperature are set as and
, respectively. The density field is initialized as [55]
where and denote the densities of the liquid outside the bubble and the vapor inside the bubble, respectively, denotes the coordinate of the bubble center, is the hyperbolic tangent function, and represents the prescribed width of the phase interface.
In simulating the process of cavitation bubble collapse, we can artificially tune the initial density of the liquid to achieve a positive pressure difference based on the C–S EOS.
3.2. Solution of Boundary Conditions
The fractal dimension, used to quantitatively describe the surface complexity of the solid wall with an arbitrarily complex geometry, is expressed as [56]
where is the fractal dimension which fluctuates between 1 and 2, is the scale number which is the total number of steps of the curve measured with the scale of step , and is the length of the straight line connecting the start and end points of the curve. and are the lengths of the red polyline and green straight line in Figure 3, respectively.
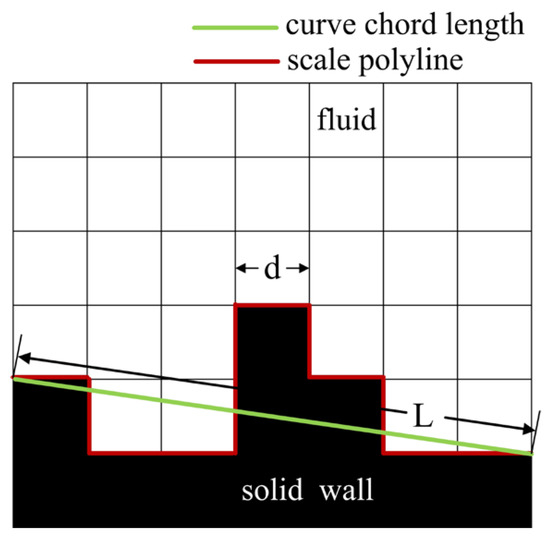
Figure 3.
Modified model of fractal dimension.
In the previous works [29,31,32,37], the fluid–solid interactive force is zero, and the interaction between the fluid and solid wall is considered as fully rebounded. However, in contrast to a plane solid wall, a solid wall with arbitrarily complex geometry exhibits irregular geometric shapes and a solid wall orientation, causing the fluid–solid interface to undulate. Thus, an algorithm is proposed to automatically differentiate between the fluid and the solid wall. In the simulation, a label array is adopted to signify the adjacent grid node that reaches in a time step along a certain direction , where represents the position of a certain lattice node in the first layer fluid above the solid wall. Therefore, the value of can be used to identify the fluid and solid wall. The grid node at location is viewed as a solid wall node when the value of is one. Otherwise, it is regarded as a fluid node.
In this study, the interaction between the fluid and solid wall is considered as fully rebounded, which can be expressed as
where and denote the density distribution functions along the directions toward and away from the solid wall, respectively.
When the value of is one, the interaction potential at location is numerically the interaction potential at position . Therefore, the pseudopotential force can be expressed as
The boundary condition and interaction potential of the interface between the liquid and rigid wall are discussed in this subsection. If the lattice node is fluid, it normally executes the collision and streaming processes, then enters the next round of evolution.
3.3. Verification of the Collapsing Bubble near the Solid Wall
In previous work, the validity of the pseudopotential MRT-LBM in simulating the cavitation bubble collapse process has been verified from the perspectives of coexistence curves and Laplace law verification [33]. As shown in Figure 4, the experimental and LBM simulation results are presented for comparison. Figure 4 depicts the profile evolutions of the collapsing bubble near a solid wall with complex geometry (). In the experiments, a metal block is attached to the solid wall sample to prevent the solid wall from moving, because the mass of the sample is light. So the bottom of the solid wall sample needs to be sketched in Figure 4a. It is clearly shown that the numerical result is in agreement with the experiment. These two groups of figures can present a similar dynamic process of the collapsing bubble. The validity of the numerical model to simulate the cavitation bubble near-wall collapse process is verified from the comparisons with the experimental photos. Owing to the solid wall with complex geometry, the bubble deformation is asymmetric. The evolutions of the physical fields will be analyzed in detail in the following subsections.
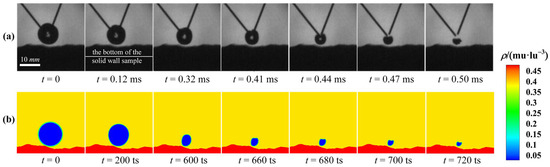
Figure 4.
Comparison of the profile evolutions of the collapsing bubble between (a) the experiments (, ) and (b) LBM simulations (, ).
In addition, the grid independence of the numerical model is verified. As shown in Figure 5, three different lattice systems, i.e., , , and , are chosen to carry out a more precise comparison and present asymmetry of the collapsing bubble near the solid wall with complex geometry. According to the same proportion principle, the maximum radii of the cavitation bubble are set as , , and , respectively, and the offset parameters are both . Moreover, a non-dimensional time is defined to represent the interval between the initial state and the first collapse. Therefore, Figure 5 extracts the bubble profiles at 0, , , , , and with the acquired coordinate points normalized in the x and y directions.
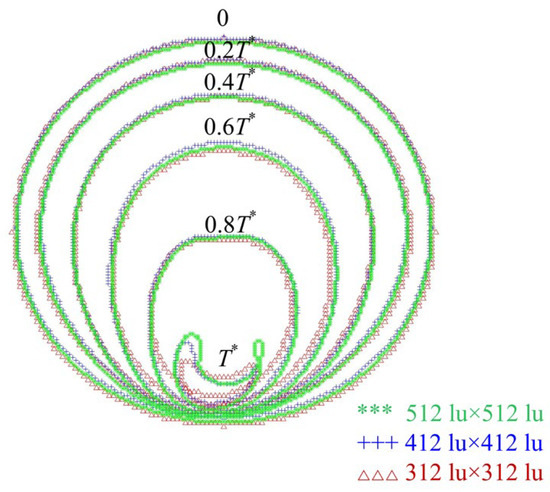
Figure 5.
Grid independence verification of the cavitation bubble collapse model near a solid wall with complex geometry.
The normalized profiles of the collapsing bubble near the solid wall with complex geometry almost coincide with one another under different grid resolutions. In other words, the collapse processes of the cavitation bubble near the solid wall under different grid resolutions are the same. Given the efficiency and accuracy of the numerical model, the computational domain is established in a lattice region in this manuscript.
3.4. Evolution of Density Field
Figure 6 shows the evolution of the density field, where the bubble profiles can be visually distinguished. This figure depicts the dynamic process of cavitation bubble collapse near two different solid walls, i.e., the plane solid wall and solid wall with a complex geometry (). The offset parameters are set as and in these two cases, respectively. The morphological evolution of the collapsing bubble in the vicinity of the solid wall with a complex geometry is analyzed in detail.
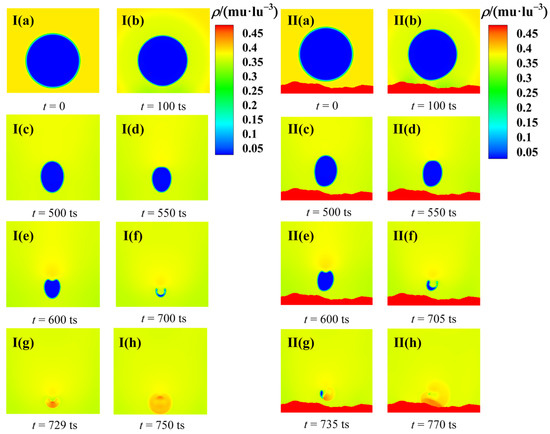
Figure 6.
Evolution of density field of the collapsing bubble near a solid wall ((I): plane solid wall and (II): solid wall with complex geometry).
The initial spherical bubble starts to collapse under the pressure difference . The collapse velocity of the bubble is low in its initial stage, and the bottom bubble wall exhibits a significant deformation at . The bubble is elongated into an ellipsoid before , owing to the retarding effect of the solid wall. With the higher density area diffusing, the upper bubble wall is flattened, then it becomes concave from . There appears a denser density area in the concave region, which accelerates the change of the bubble profiles. Consequently, a micro-jet is formed because of the interaction between the bubble and the solid wall. When the upper and bottom bubble walls collide, the cavitation bubble splits into small bubbles. This phenomenon can be referred to as the first collapse. The bubble deformation is asymmetric, and the deformed bubble tends to collapse into two asymmetric small bubbles owing to the irregular geometry of the solid wall. Subsequently, the small bubbles continue to collapse, and the visible bubble surface completely disappears after the second collapse.
The processes of bubble collapse near the plane solid wall and solid wall with a complex geometry exhibit a similar dynamic process. However, the solid wall with a complex geometry causes the asymmetric deformation of the bubble. The effect of the solid wall with complex geometry on the collapsing bubble can be reflected in the profile evolution. Meantime, the validity and feasibility of the numerical model to simulate the bubble collapse process are again verified.
3.5. Evolution of Pressure and Velocity Fields
In contrast to the density field evolution, the evolution of the pressure and velocity fields can clearly and intuitively reflect the driving force behind the dynamic process of the collapsing bubble close to a solid wall with a complex boundary and reveal the corresponding physical mechanism. The simulated pressure and velocity fields are shown for several representative moments in Figure 7.
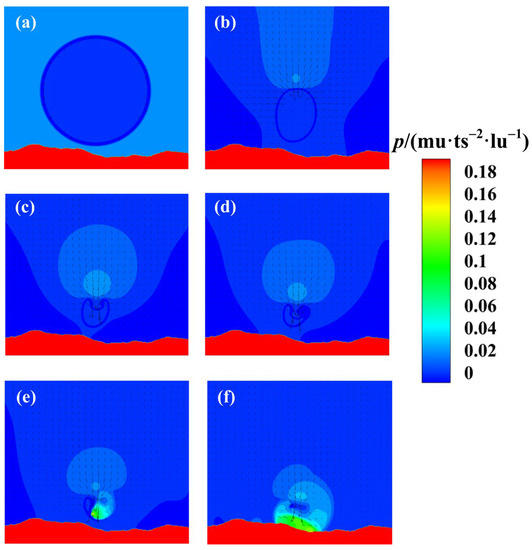
Figure 7.
Evolution of pressure and velocity fields of the collapsing bubble near a solid wall with complex geometry for and : (a) , (b) , (c) , (d) , (e) , and (f) .
Initially, the cavitation bubble is spherical. Thereafter, it deforms into an elliptical bubble under the pressure difference . A micro-jet is formed, and the micro-jet in the concave area is considerably stronger than that in other areas. The micro-jet velocity increases as the upper bubble wall sags. The micro-jet breaks through the bubble wall when the first collapse occurs at . The cavitation bubble splits into two asymmetric small bubbles owing to the retarding effect of the solid wall with a complex geometry. The smaller right bubble collapses first and forms a radial pressure propagation trend at the collapse point. After the second collapse at , the cavitation bubble completely collapses, and there appears a high-pressure shock wave near the surface of the solid wall. Then, the shock wave is driven by the micro-jet and spread to the surrounding solid wall until it disappears at the collapse point.
4. Morphological Analysis Method Exerted on the Cavitation Bubble Collapse Model
4.1. Morphological Verification
The phenomenon examined in this study belongs to multiphase flow. However, it is necessary to verify the validity and feasibility of the Min-MAM in quantitatively describing the evolution of collapsing bubble profiles. Therefore, Figure 8 depicts the time evolution of the Minkowski measures for the collapsing cavitation bubble near a solid wall with a complex geometry. This figure also includes the density field at several representative moments and the extended dot–line diagrams of the Minkowski measures for the period before the second collapse.
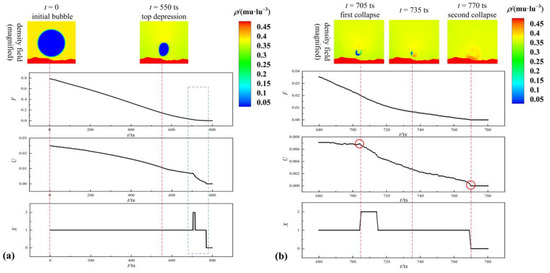
Figure 8.
Time evolution of Minkowski measures for the collapsing bubble near a solid wall with complex geometry. (a) the whole process from t = 0 to t = 800 ts, (b) the part process from t = 680 ts to t = 780 ts.
As shown in Figure 6, the collapsing bubble near the solid wall generally goes through the stages of inward collapse, top depression, micro-jet formation, first collapse, and second collapse. Therefore, as shown in Figure 8, the entire evolution process can be divided into the following parts: the first deformation from to , the second deformation before , the first collapse at , the circular bubble formation from to , and the second collapse at . In the first deformation part, the initial spherical bubble deforms into an elliptical bubble under the pressure difference . The fractional area and boundary length decrease during this period, and their slopes increase with time . This indicates that the inward collapse velocity of the bubble increases gradually. In addition, the fluid velocity increases toward the solid wall, thereby forming an inceptive micro-jet. In the second deformation part, and continue to decrease, but their corresponding accelerations begin to increase. From , the bubble top wall begins to sag downwards, which partly compensates for the effect of the inward collapse on the bubble fractional area and boundary length. When the upper and bottom bubble walls collide at , the cavitation bubble splits into two small asymmetrical bubbles. After the first collapse, the visible bubble surface is composed of two asymmetrical bubbles in the 2D space and an annular bubble in the three-dimensional (3D) space. At this stage, the smaller bubble collapses earlier than the larger bubble, causing the slope of the curve to increase significantly. After the second collapse, the values of and simultaneously decrease to zero.
As the third Minkowski measure, the Euler characteristic can directly reflect the number of bubbles in the bubble collapse process. remains at 1 before the first collapse. increases to 2 at and remains at 2 before the smaller bubble collapses. decreases to 1 when the smaller bubble collapses. decreases to 0 after , indicating that the cavitation bubble completely collapses. In the curves for and , the red circles in the figure can be described as “the first collapse point” and “the second collapse point”.
The results demonstrate that the three Minkowski measures can describe the morphological characteristics of the collapsing bubble in the vicinity of a solid wall with a complex geometry from different perspectives. The three curves can clearly distinguish between several typical moments in the cavitation bubble collapse process. Hence, we successfully verify the validity and feasibility of the Min-MAM in quantifying the morphological evolution of the collapsing bubble.
4.2. Evolution of Bubble Profiles
In the simulation, solid walls with arbitrarily complex geometries are synthesized, and their complexities are quantified by the fractal dimension. It is found in processing a fractal wall that two solid walls with different geometric features may have the same fractal dimension. Therefore, similar complex solid walls with different fractal dimensions and different complex solid walls with the same fractal dimension are designed as rigid boundaries to comprehensively analyze the effect of the fractal wall on the profile evolution of the collapsing bubble. Meanwhile, given that the bubble’s relative position to the solid wall has an important significance for the retarding effect of the solid wall, the influence of the position offset parameter on the bubble collapse process is also analyzed.
4.2.1. Complexity of Solid Walls
The first factor involves the complexity of the solid wall, which can be quantitatively described using the fractal dimension. As shown in Figure 9, there are five solid walls with different fractal dimensions but similar orientations. Figure 10 depicts the morphological metric curves of the Minkowski functionals for and , , , , and .
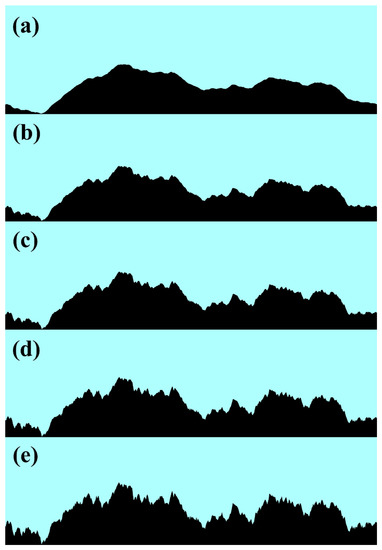
Figure 9.
Similar solid walls with different fractal dimensions: (a) , (b) , (c) , (d) , and (e) .
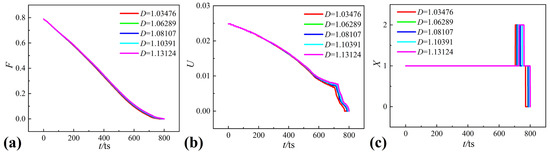
Figure 10.
Morphological analysis of the collapsing bubble under different fractal dimensions: (a) fractional area , (b) boundary length , and (c) Euler characteristic .
The three Minkowski measures for the collapsing bubble near a solid wall with a complex geometry depict similar trends regardless of the fractal dimension. It can be obviously observed from Figure 9 that the surface of the solid wall with a higher fractal dimension is rougher than the one of the solid wall with a lower fractal dimension. The maximum scale difference of the solid wall surface is about in these five solid walls, which is much less than the radius of the bubble . As a result, it takes more time to reflect the differences in the retarding effect of the solid wall on the collapsing bubble. Therefore, from the beginning to , the variation curves of the fractal dimension and boundary length almost coincide with each other. It is illustrated that the dynamic processes of the collapsing bubbles have very high similarity. In addition, there is a clear distinction between these curves from . This is because the differences in the retarding effect of the solid wall on the collapsing bubble begin to take effect as the time goes on.
There is no doubt that the retarding effect of the solid wall becomes stronger as the fractal dimension increases. The velocity of the bubble’s inward collapse will be different because of the variation in the retarding effect of the solid wall, which directly influences the size of the collapsing bubble at . In Figure 10b,c, as increases, the first and second collapses are delayed, and the interval between the first and second collapses evidently increases. These changes are also closely associated with the size of the collapsing bubble. The smaller the bubble, the faster it collapses. Therefore, the retarding effect of the solid wall on the collapsing bubble can be indicated by the occurrence time of the first and second collapses. In conclusion, the retarding effect of the solid wall is proportional to its complexity when the solid walls with complex geometries have similar orientations.
Figure 11 depicts the jet velocity evolution of the collapsing bubble from to the first collapse. The figure also shows the corresponding boundary length of the collapsing bubble under five different fractal dimensions to clearly interpret the variations in the cavitation bubble jet velocity. The evolution of the jet velocity almost follows a trend, that is, it gradually increases to a peak and then slightly decreases with time. Moreover, the intervals at which the jet velocity reaches its peak are the same. The variation range of the jet velocity decreases as the fractal dimension increases. The trend in the boundary length indicates that an increase in the fractal dimension influences the depression speed of the collapsing bubble and causes the depression degree of the bubble top wall to increase slowly. When the depression degree of the bubble top wall increases with time, the surface tension increases correspondingly, causing the acceleration of the jet velocity to decrease. Therefore, the higher the fractal dimension, the slower the peak jet velocity. Based on the above analysis, an increase in the fractal dimension can also affect the evolution of the jet velocity.
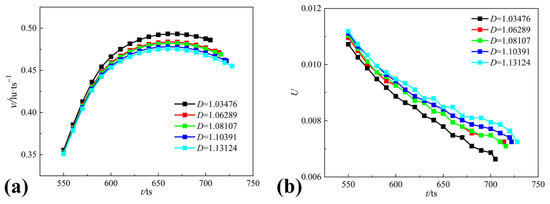
Figure 11.
Jet velocity and boundary length vs. time under the different fractal dimensions: (a) jet velocity and (b) boundary length.
4.2.2. Geometric Features of Solid Walls
As shown in Figure 12, three solid walls with the same fractal dimension are selected as rigid boundaries to further analyze the effect of the surface geometry of the solid wall on the collapsing bubble. From Figure 12, it can be found that the actual distance between the bubble and the solid wall’s surface has a great difference in these three solid walls. The difference between the solid walls a and b is up to . Figure 13 depicts the morphological metric curves of the Minkowski functionals for and .
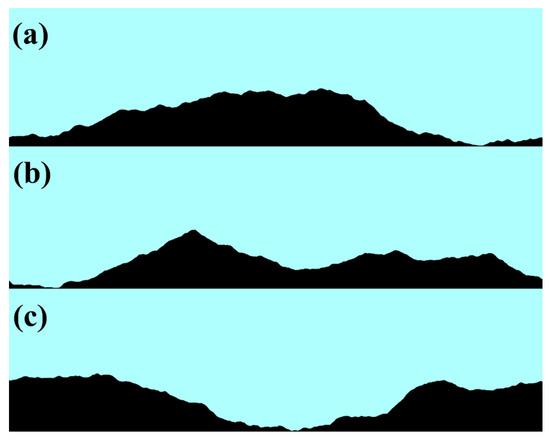
Figure 12.
Different solid walls with the same fractal dimension: (a) solid wall a, (b) solid wall b, and (c) solid wall c.
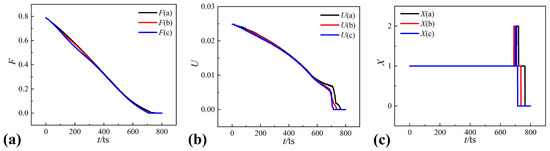
Figure 13.
Morphological analysis of the collapsing bubble under the same fractal dimension: (a) fractional area , (b) boundary length , and (c) Euler characteristic .
The three Minkowski measures for the collapsing bubble near a solid wall with a complex geometry no longer show similar trends, as shown in Figure 13. In the initial stage of bubble collapse, the actual distance from the bubble to solid wall’s surface plays a major role in the morphological evolution of the collapsing bubble. As a result, the curves of and have a certain difference before . Except for the actual distance between the bubble and the solid wall’s surface, the variations in the surface geometry of the solid wall also influence the dynamic process of the collapsing bubble. For instance, the first collapse near the solid wall b occurs before that near the solid wall c, but the corresponding second collapse occurs after that near the solid wall c. This is because the surface geometry of the solid wall influences its retarding effect on bubble collapse and leads to differences in the size of the collapsing bubble at the first collapse and the length of the collapse time. Therefore, the geometric feature of the solid wall plays a significant part in the evolution of the bubble profiles, thereby affecting the bubble collapse process.
Figure 14 depicts the evolution of the boundary length and jet velocity of the collapsing bubble near the three different solid walls from to the first collapse. The trend of the jet velocity shows clear differences before the first collapse due to the differences in the surface geometry of the solid wall. For instance, the evolution of the jet velocity of the collapsing bubble near the solid wall a is similar to that in Figure 11. However, the jet velocities near solid walls b and c increase almost throughout the process. Moreover, the evolution of the corresponding boundary length of the collapsing bubble appears to have no apparent connection. Therefore, the surface geometry of the solid boundary affects the bubble collapse process, and there are no evident trends in the jet velocity evolution.
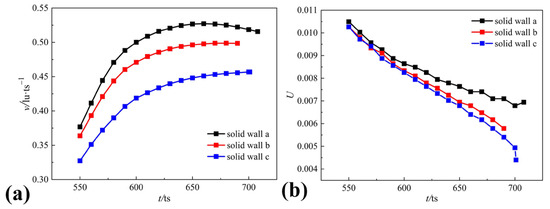
Figure 14.
Jet velocity and boundary length vs. time under the same fractal dimension: (a) jet velocity and (b) boundary length.
4.2.3. Dimensionless Position Offset Parameter
In this subsection, the effect of the position offset parameter on the collapsing bubble is discussed. Five offset parameters are selected, and the corresponding morphological metric curves of the Minkowski functionals are obtained under two different fractal dimensions. The position offset parameter influences the deformation speed of the collapsing bubble (Figure 15), causing the curves of the Minkowski functionals to clearly differ from . It is apparent that the deformation speed increases with . The retarding effect of the solid wall on the collapsing bubble is more suitable with the vapor bubble in the lower region of the liquid (), making the interval between the first and second collapses more obvious.
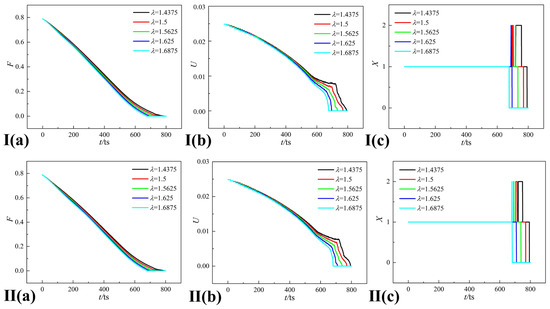
Figure 15.
Morphological analysis of the collapsing bubble under different offset parameters ((I): and (II): ; (a) fractional area , (b) boundary length , and (c) Euler characteristic ).
Figure 15I,II demonstrates that the absence of the second collapse is related to and the geometric characteristics of the solid wall. The profile evolution of the collapsing bubble illustrates that the bubble deformation process is significantly affected by the solid wall. There is a significant difference between the shrinkage speeds of the left and right bubble walls because of the geometric characteristics of the solid wall, determining the size of the bubble at the first collapse. When the bubble at the first collapse is extremely small, the corresponding second collapse disappears during the entire process. Therefore, it is necessary to comprehensively consider various parameters that affect the deformation of bubbles to reduce the instability of the collapse process.
5. Conclusions
The interaction mechanism between a cavitation bubble and a solid wall with a complex geometry is investigated using the pseudopotential MRT-LBM. In this study, we introduce an arbitrarily complex geometry and propose an effective boundary processing method. A model of gas–liquid–solid three–phase coupling with adjustable solid boundary characteristics is established. The dynamics of the collapsing bubble are investigated using the evolution of the density, pressure, and velocity fields. The Min-MAM is used to quantitatively describe the evolution of the bubble profiles. Several representative moments of bubble collapse can be clearly distinguished from the morphological metric curves of the Minkowski functionals. Furthermore, the effect of different surface conditions of the solid walls on the dynamic characteristics of the collapsing bubble is systematically analyzed. The results indicate that the shift in the bubble profiles is inseparable from the surface geometry of the solid wall. The conclusions of this study are summarized below.
(1) The validity and feasibility of the numerical model to simulate the bubble collapse process are verified by comparing the LBM simulation with experimental results. The collapse process of a vapor bubble close to a solid wall with an arbitrarily complex geometry is accurately simulated. This provides theoretical support for investigating the dynamics of collapsing bubbles in fractal cracks.
(2) The Min-MAM is adopted to quantitatively describe the evolution of the bubble profiles and acquire effective information from the collapse process. The morphological metric curves of the Minkowski functionals can characterize several typical moments, including the top depression, first collapse, and second collapse of the bubble.
(3) The inherent properties of the solid wall, such as its complexity and surface geometry, should be considered when the solid wall is generalized from a plane solid wall to a solid wall with a complex geometry. Specifically, the influence of the solid wall on collapsing bubble profiles can be analyzed by tuning different parameters, e.g., the complexity of solid walls, geometric features of solid walls, and the position offset parameter. The results demonstrate that the bubble collapse becomes slower as the complexity of the solid wall increases. The geometric features of the solid wall can influence its retarding effect on the collapsing bubble, making the bubble collapse process more varied. The effect of the geometric features of the solid wall on the collapsing bubble is stronger than that of the surface complexity. In addition, the length of the collapse time is affected by the position offset parameter. Bubble collapse becomes faster as the offset parameter increases. However, the effect of the position offset parameter on the collapsing bubble is also associated with the geometric features of the solid wall, which influences the length of the collapse time and the occurrence of the second collapse.
Last but not least, based on the advantages of the pseudopotential MRT-LBM, the model in this paper can simulate the bubble dynamics near a solid wall with arbitrarily complex geometry. Several typical solid walls are introduced in this study to investigate the effect of fractal walls on the bubble collapse process, and general conclusions can be drawn. In the future, we will further study the temporal evolution of the collapsing bubble profiles near more solid walls with complex geometry or in a fractal crack. Moreover, the effect of the viscosity and surface tension on the bubble collapse model will be discussed in the subsequent study. Then we will attempt to extend the present 2D model into a 3D one and explore the dynamic characteristics of the collapsing bubble near a solid wall with complex geometry in the 3D space.
Author Contributions
Conceptualization, M.S. and Y.Y.; methodology, M.S. and F.S.; software, Y.S.; validation, M.S., F.S. and Y.Y.; formal analysis, C.Y.; investigation, F.S. and Y.S.; resources, M.S.; data curation, M.S. and F.S.; writing—original draft preparation, F.S.; writing—review and editing, M.S., Y.Y. and Q.H.; visualization, Y.Y. and Y.S.; supervision, M.S. and C.Y.; project administration, M.S.; funding acquisition, M.S. and Q.H. All authors have read and agreed to the published version of the manuscript.
Funding
This research was funded by the National Natural Science Foundation of China under grant numbers 11874140 (M.S.) and 12174085 (Q.H.), and the State Key Laboratory of Acoustics, Chinese Academy of Sciences under grant number SKLA201913 (Q.H.).
Institutional Review Board Statement
Not applicable.
Informed Consent Statement
Not applicable.
Data Availability Statement
Data are contained within this article.
Conflicts of Interest
The authors declare no conflict of interest.
Nomenclature
| Roman letters | |
| the particle density distribution function | |
| the equilibrium particle density distribution function | |
| the particle position | |
| the discrete velocity | |
| the time step | |
| the inverse of the orthogonal transformation matrix | |
| the orthogonal transformation matrix | |
| the forcing term | |
| the density distribution function | |
| the equilibrium density distribution function | |
| the unit tensor | |
| the forcing term in the moment space | |
| the macroscopic velocity | |
| the fluid–fluid interactive force | |
| the fractional area | |
| the boundary length | |
| the Euler characteristics | |
| the number of the white pixels | |
| the total number of the pixels | |
| the number of the pixels separating the black and white domains | |
| the number of connected black domains | |
| the maximum radius of the cavitation bubble | |
| the distance from the bubble to the wall | |
| the prescribed width of the phase interface | |
| the critical temperature | |
| temperature | |
| the critical temperature | |
| the overall interaction strength | |
| the lattice constant | |
| the lattice sound speed | |
| the fractal dimension | |
| the scale number | |
| the non-dimensional time | |
| the external pressure | |
| the internal pressure | |
| the pressure difference | |
| Greek letters | |
| the relaxation diagonal matrix | |
| the relaxation time factor | |
| density | |
| the pseudopotential | |
| the weight coefficient | |
| an adjustable coefficient used to tune the mechanical stability condition | |
| a threshold value | |
| the dimensionless position the offset parameter | |
| the density of the liquid | |
| the density of the vapor | |
References
- Reuter, F.; Deiter, C.; Ohl, C.D. Cavitation erosion by shockwave self-focusing of a single bubble. Ultrason. Sonochem. 2022, 90, 106131. [Google Scholar] [CrossRef]
- Chahine, G.L.; Kapahi, A.; Choi, J.K.; Hsiao, C.T. Modeling of surface cleaning by cavitation bubble dynamics and collapse. Ultrason. Sonochem. 2016, 29, 528–549. [Google Scholar] [CrossRef]
- Tu, J.; Li, Q.; Zhang, C.B.; Zhang, D. Enhancement effect of ultrasound-induced microbubble cavitation on branched polyethylenimine-mediated vascular endothelial growth factor 165 (VEGF165) transfection. J. Acoust. Soc. Am. 2013, 133, 3496. [Google Scholar] [CrossRef]
- Li, G.S.; Yi, L.D.; Wang, J.; Song, Y.T. Hydrodynamic cavitation degradation of Rhodamine B assisted by Fe3+-doped TiO2: Mechanisms, geometric and operation parameters. Ultrason. Sonochem. 2020, 60, 104806. [Google Scholar] [CrossRef] [PubMed]
- Lauterborn, W.; Bolle, H. Experimental investigations of cavitation-bubble collapse in the neighbourhood of a solid boundary. J. Fluid Mech. 1975, 72, 391–399. [Google Scholar] [CrossRef]
- Kim, D.; Kim, D. Underwater bubble collapse on a ridge-patterned structure. Phys. Fluids 2020, 32, 053312. [Google Scholar] [CrossRef]
- Sun, Y.R.; Du, Y.X.; Yao, Z.F.; Zhong, Q.; Geng, S.Y.; Wang, F.J. The effect of surface geometry of solid wall on the collapse of a cavitation bubble. J. Fluids Eng. 2022, 144, 071402. [Google Scholar] [CrossRef]
- Liu, L.T.; Gan, N.; Wang, J.X.; Zhang, Y.F. Study on bubble collapse near a solid wall under different hypergravity environments. Ocean Eng. 2021, 221, 108563. [Google Scholar] [CrossRef]
- Yu, Y.; Sun, C.G.; Liu, Y.Z.; Liu, Y.; Xia, D.S. CFD simulation of cavitation bubble collapse near a rectangular groove wall. IOP Conf. Ser. Mater. Sci. Eng. 2019, 538, 012056. [Google Scholar] [CrossRef]
- Saleki-Haselghoubi, N.; Dadvand, A. Simulation of bubble dynamics oscillating near a circular aperture made in a curved rigid plate using boundary element method. Ocean Eng. 2018, 151, 12–22. [Google Scholar] [CrossRef]
- Xu, Z. Numerical simulation of the coalescence of two bubbles in an ultrasound field. Ultrason. Sonochem. 2018, 49, 277–282. [Google Scholar] [CrossRef] [PubMed]
- Lechner, C.; Koch, M.; Lauterborn, W.; Mettin, R. Pressure and tension waves from bubble collapse near a solid boundary: A numerical approach. J. Acoust. Soc. Am. 2017, 142, 3649. [Google Scholar] [CrossRef] [PubMed]
- Samiei, E.; Shams, M.; Ebrahimi, R. A novel numerical scheme for the investigation of surface tension effects on growth and collapse stages of cavitation bubbles. Eur. J. Mech. B Fluids 2010, 30, 41–50. [Google Scholar] [CrossRef]
- Succi, S. The Lattice Boltzmann Equation for Fluid Dynamics and Beyond; Oxford University Press: New York, NY, USA, 2001; pp. 40–50. [Google Scholar]
- Yan, Y.Y.; Zu, Y.Q.; Dong, B. LBM, a useful tool for mesoscale modelling of single-phase and multiphase flow. Appl. Therm. Eng. 2011, 31, 649–655. [Google Scholar] [CrossRef]
- Xu, A.G.; Zhang, G.C.; Gan, Y.B.; Chen, F.; Yu, X.J. Lattice Boltzmann modeling and simulation of compressible flows. Front. Phys. 2012, 7, 582–600. [Google Scholar] [CrossRef]
- Li, Q.; Luo, K.H.; Kang, Q.J.; He, Y.L.; Chen, Q.; Liu, Q. Lattice Boltzmann methods for multiphase flow and phase-change heat transfer. Prog. Energ. Combust. 2016, 52, 62–105. [Google Scholar] [CrossRef]
- Petersen, K.J.; Brinkerhoff, J.R. On the lattice Boltzmann method and its application to turbulent, multiphase flows of various fluids including cryogens: A review. Phys. Fluids 2021, 33, 041302. [Google Scholar] [CrossRef]
- Yang, Y.; Shan, M.L.; Su, N.N.; Kan, X.F.; Shangguan, Y.Q.; Han, Q.B. Role of wall temperature on cavitation bubble collapse near a wall investigated using thermal lattice Boltzmann method. Int. Commun. Heat Mass 2022, 134, 105988. [Google Scholar] [CrossRef]
- Gunstensen, A.K.; Rothman, D.H.; Zaleski, S.; Zanetti, G. Lattice Boltzmann model of immiscible fluids. Phys. Rev. A 1991, 43, 4320. [Google Scholar] [CrossRef]
- Shan, X.W.; Chen, H.D. Lattice Boltzmann model for simulating flows with multiple phases and components. Phys. Rev. E 1993, 47, 1815. [Google Scholar] [CrossRef]
- Shan, X.W.; Chen, H.D. Simulation of nonideal gases and liquid-gas phase transitions by the lattice Boltzmann equation. Phys. Rev. E 1994, 49, 2941. [Google Scholar] [CrossRef] [PubMed]
- Li, Q.; Luo, K.H.; Gao, Y.J.; He, Y.L. Additional interfacial force in lattice Boltzmann models for incompressible multiphase flows. Phys. Rev. E 2012, 85, 026704. [Google Scholar] [CrossRef] [PubMed]
- Swift, M.R.; Osborn, W.R.; Yeomans, J.M. Lattice Boltzmann simulations for nonideal fluids. Phys. Rev. Lett. 1995, 75, 830. [Google Scholar] [CrossRef] [PubMed]
- Jacqmin, D. Calculation of two-phase Navier–Stokes flows using phase-field modeling. J. Comput. Phys. 1999, 155, 96–127. [Google Scholar] [CrossRef]
- Sukop, M.C.; Or, D. Lattice Boltzmann method for homogeneous and heterogeneous cavitation. Phys. Rev. E Stat. Nonlin. Soft Matter Phys. 2005, 71, 046703. [Google Scholar] [CrossRef]
- Chen, X.P.; Zhong, C.W.; Yuan, X.L. Lattice Boltzmann simulation of cavitating bubble growth with large density ratio. Comput. Math. with Appl. 2011, 61, 3577–3584. [Google Scholar] [CrossRef]
- Mishra, S.K.; Deymier, P.A.; Muralidharan, K.; Frantziskonis, G.; Pannala, S.; Simunovic, S. Modeling the coupling of reaction kinetics and hydrodynamics in a collapsing cavity. Ultrason. Sonochem. 2010, 17, 258–265. [Google Scholar] [CrossRef]
- Yang, Y.; Shan, M.L.; Kan, X.F.; Shangguan, Y.Q.; Han, Q.B. Thermodynamic of collapsing cavitation bubble investigated by pseudopotential and thermal MRT-LBM. Ultrason. Sonochem. 2019, 62, 104873. [Google Scholar] [CrossRef]
- Ezzatneshan, E.; Vaseghnia, H. Dynamics of an acoustically driven cavitation bubble cluster in the vicinity of a solid surface. Phys. Fluids 2021, 33, 123311. [Google Scholar] [CrossRef]
- Yang, Y.; Shan, M.L.; Han, Q.B.; Kan, X.F. Effect of non-condensable gas on a collapsing cavitation bubble near solid wall investigated by multicomponent thermal MRT-LBM. Chin. Phys. B 2021, 30, 024701. [Google Scholar] [CrossRef]
- Shan, M.L.; Yang, Y.; Peng, H.; Han, Q.B.; Zhu, C.P. Modeling of collapsing cavitation bubble near solid wall by 3D pseudopotential multi-relaxation-time lattice Boltzmann method. Proc. Inst. Mech. Eng. C J. Mec. Eng. Sci. 2018, 232, 445–456. [Google Scholar] [CrossRef]
- Shan, M.L.; Zhu, C.P.; Yao, C.; Yin, C.; Jiang, X.Y. Pseudopotential multi-relaxation-time lattice Boltzmann model for cavitation bubble collapse with high density ratio. Chin. Phys. B 2016, 25, 104701. [Google Scholar] [CrossRef]
- Mao, Y.F.; Peng, Y.; Zhang, J.M. Study of cavitation bubble collapse near a wall by the modified lattice Boltzmann method. Water 2018, 10, 1439. [Google Scholar] [CrossRef]
- He, X.L.; Zhang, J.M.; Xu, W.L. Study of cavitation bubble collapse near a rigid boundary with a multi-relaxation-time pseudo-potential lattice Boltzmann method. AIP Adv. 2020, 10, 035315. [Google Scholar]
- Xue, H.H.; Shan, F.; Guo, X.S.; Tu, J.; Zhang, D. Cavitation bubble collapse near a curved wall by the multiple-relaxation-time Shan-Chen lattice Boltzmann model. Chin. Phys. Lett. 2017, 34, 90–94. [Google Scholar] [CrossRef]
- Shan, M.L.; Zhu, Y.P.; Yao, C.; Han, Q.B.; Zhu, C.P. Modeling for collapsing cavitation bubble near rough solid wall by mulit-relaxation-time pseudopotential lattice Boltzmann model. J. Appl. Math. Phys. 2017, 5, 1243–1256. [Google Scholar] [CrossRef]
- Shan, M.L.; Yang, Y.; Zhao, X.M.; Han, Q.B.; Yao, C. Investigation of cavitation bubble collapse in hydrophobic concave using the pseudopotential multi-relaxation-time lattice Boltzmann method. Chin. Phys. B 2021, 30, 044701. [Google Scholar] [CrossRef]
- Serra, J. Image analysis and mathematical morphology. Biometrics 1983, 39, 536–537. [Google Scholar]
- Mecke, K.R.; Sofonea, V. Morphology of spinodal decomposition. Phys. Rev. E 1997, 56, R3761. [Google Scholar] [CrossRef]
- Sofonea, V.; Mecke, K.R. Morphological characterization of spinodal decomposition kinetics. Eur. Phys. J. B 1999, 8, 99–112. [Google Scholar] [CrossRef]
- Gan, Y.B.; Xu, A.G.; Zhang, G.C.; Li, Y.J.; Li, H. Phase separation in thermal systems: A lattice Boltzmann study and morphological characterization. Phys. Rev. E 2011, 84, 046715. [Google Scholar] [CrossRef] [PubMed]
- Xu, A.G.; Zhang, G.C.; Li, H.; Ying, Y.J.; Zhu, J.S. Dynamical similarity in shock wave response of porous material: From the view of pressure. Comput. Math. Appl. 2011, 61, 3618–3627. [Google Scholar] [CrossRef]
- Aksimentiev, A.; Holyst, R.; Moorthi, K. Scaling properties of the morphological measures at the early and intermediate stages of the spinodal decomposition in homopolymer blends. J. Chem. Phys. 2000, 112, 6049. [Google Scholar] [CrossRef]
- Gan, Y.B.; Xu, A.G.; Zhang, G.C.; Lin, C.D.; Lai, H.L.; Liu, Z.P. Nonequilibrium and morphological characterizations of Kelvin–Helmholtz instability in compressible flows. Front. Phys. 2019, 14, 43602. [Google Scholar] [CrossRef]
- Chen, F.; Xu, A.G.; Zhang, Y.D.; Zeng, Q.K. Morphological and non-equilibrium analysis of coupled Rayleigh-Taylor-Kelvin-Helmholtz instability. Phys. Fluids 2020, 32, 104111. [Google Scholar] [CrossRef]
- Mukherjee, S.; Abraham, J. A pressure-evolution-based multi-relaxation-time high-density-ratio two-phase lattice-Boltzmann model. Comput. Fluids 2007, 36, 1149–1158. [Google Scholar] [CrossRef]
- Qian, Y.H.; D’Humières, D.; Lallemand, P. Lattice BGK models for Navier-Stokes equation. EPL 1992, 17, 479–484. [Google Scholar] [CrossRef]
- Li, Q.; Luo, K.H.; Li, X.J. Lattice Boltzmann modeling of multiphase flows at large density ratio with an improved pseudopotential model. Phys. Rev. E Stat. Nonlin. Soft Matter Phys. 2013, 87, 053301. [Google Scholar] [CrossRef]
- Klaseboer, E.; Khoo, B.C.; Hung, K.C. Dynamics of an oscillating bubble near a floating structure. J. Fluid. Struct. 2005, 21, 395–412. [Google Scholar] [CrossRef]
- Shan, X.W. Pressure tensor calculation in a class of nonideal gas lattice Boltzmann models. Phys. Rev. E Stat. Nonlin. Soft Matter Phys. 2008, 77, 066702. [Google Scholar] [CrossRef]
- Yuan, P.; Schaefer, L. Equations of state in a lattice Boltzmann model. Phys. Fluids 2006, 18, 042101. [Google Scholar] [CrossRef]
- Mohamad, A.A. The Lattice Boltzmann Method; Springer International Publishing: New York, NY, USA, 2011; pp. 155–175. [Google Scholar]
- Zou, Q.; He, Y. On pressure and velocity boundary conditions for the lattice Boltzmann BGK model. Phys. Fluids 1997, 9, 1591. [Google Scholar] [CrossRef]
- Huang, H.B.; Krafczyk, M.; Lu, X. Forcing term in single-phase and Shan-Chen-type multiphase lattice Boltzmann models. Phys. Rev. E 2011, 84, 046710. [Google Scholar] [CrossRef] [PubMed]
- Li, B.; Xu, Y.L.; Zhang, J.H.; Wang, W.M.; Xu, M.X. Correction calculation model of curve’s interval fractal dimension. In Proceedings of the 2010 Third International Symposium on Information Science and Engineering, Shanghai, China, 24–26 December 2010. [Google Scholar]
Disclaimer/Publisher’s Note: The statements, opinions and data contained in all publications are solely those of the individual author(s) and contributor(s) and not of MDPI and/or the editor(s). MDPI and/or the editor(s) disclaim responsibility for any injury to people or property resulting from any ideas, methods, instructions or products referred to in the content. |
© 2023 by the authors. Licensee MDPI, Basel, Switzerland. This article is an open access article distributed under the terms and conditions of the Creative Commons Attribution (CC BY) license (https://creativecommons.org/licenses/by/4.0/).