Abstract
In the recent past, the COVID-19 epidemic has impeded global economic progress and, by extension, all of society. This type of pandemic has spread rapidly, posing a threat to human lives and the economy. Because of the growing scale of COVID-19 cases, employing artificial intelligence for future prediction purposes during this pandemic is crucial. Consequently, the major objective of this research paper is to compare various deep learning forecasting algorithms, including auto-regressive integrated moving average, long short-term memory, and conventional neural network techniques to forecast how COVID-19 would spread in Saudi Arabia in terms of the number of people infected, the number of deaths, and the number of recovered cases. Three different time horizons were used for COVID-19 predictions: short-term forecasting, medium-term forecasting, and long-term forecasting. Data pre-processing and feature extraction steps were performed as an integral part of the analysis work. Six performance measures were applied for comparing the efficacy of the developed models. LSTM and CNN algorithms have shown superior predictive precision with errors of less than 5% measured on available real data sets. The best model to predict the confirmed death cases is LSTM, which has better RMSE and values. Still, CNN has a similar comparative performance to LSTM. LSTM unexpectedly performed badly when predicting the recovered cases, with RMSE and values of 641.3 and 0.313, respectively. This work helps decisionmakers and health authorities reasonably evaluate the status of the pandemic in the country and act accordingly.
1. Introduction
The current outbreak of the COVID-19 pandemic has acted as a warning to global economic growth and, as a result, to society as a whole. Also, we know that this virus outbreak may cause dangerous threats to the lives of human individuals and the whole community because there are no specific, practical, proven treatments for fighting this virus [1]. Potential antiviral therapies, such as plasma transfusion, are precarious and are carefully implemented in the clinical sector [2], and taking preventive measures such as hand washing and keeping social distancing between individuals is important. Also, using face masks may be a limitation to the spread of infection from one individual to another. Moreover, there is a particular obligation on health officials to control chronic situations to prevent disease outbreaks [3]. Production of vaccines in a newly effective way is essential, despite the importance of the antiviral drug used at this time as a treatment for coronavirus patients [4]. Neither a curing medication nor a preventative immunization has been considerably and effectively accessed. The outbreak of COVID-19 is again a disaster; it will hurt all countries’ economies. Unfortunately, many variants of the virus have been recently detected worldwide, and there exists no focused and guaranteed 100% treatment for this disease yet. Saudi Arabia is one of the countries that has been negatively affected by this pandemic. The country is in urgent need of developing forecasting models for the cases of coronavirus disease in the future. Because of the massive increase in COVID-19 instances, AI’s role is critical in the current scenario for effectively predicting the virus’s increased cases. Machine learning as a branch of AI and its applications in the field of interest can help mitigate this issue effectively in terms of cost, effectiveness, and reliability.
In this paper, time-series data based on deep learning algorithms are employed for a comparative assessment for forecasting COVID-19 cases, in which three models were built using three different algorithms; auto-regressive integrated moving average (ARIMA), long short-term memory (LSTM), and convolutional neural network (CNN). The paper focuses mainly on Saudi Arabia for three periods; short-term, medium-term, and long-term. Therefore, this work will help decisionmakers reasonably evaluate the status of the pandemic in the country and act accordingly. Furthermore, the development of KSA-wise prediction deep learning-based models for predicting pandemic spread in this country is a first-of-its-kind work.
In light of the reasoning above, the major focus of this paper is to forecast the spread of COVID-19 cases using historical transmission time-series data and hypothesis analysis in Saudi Arabia. The novelty of this research work can be summarized as follows: this study’s objective is to compare various forecasting algorithms, including ARIMA, LSTM, and CNN techniques, to forecast how COVID-19 would spread in Saudi Arabia in terms of the number of people infected, the number of deaths, and the number of recovered cases. There are three different time horizons used in this paper for COVID-19 prediction: short-term forecasting, medium-term forecasting, and long-term forecasting. They give the study solidarity, comprehensiveness, and sufficiency. The precision of the different forecasts is compared, and the best model is then chosen based on the various performance measures and statistical hypothesis analysis. This research work is the first of its kind to build country-wide forecasting models based on deep learning approaches to predict the spread of COVID-19 cases in Saudi Arabia. The work helps decisionmakers and health authorities reasonably evaluate the status of the pandemic in the country and act accordingly. The work introduced in this paper can help future researchers build city-wide forecasting models to predict the spread of the COVID-19 cases in major cities in Saudi Arabia, such as Riyadh and Mecca.
2. Related Work
Some literature studies try to foresee the spread of the coronavirus infection and examine the phase of the transmission. This section discusses recent publications in the literature related to this subject.
Deep Learning and COVID-19 Forecasting
Several studies focused on forecasting coronavirus transmission in various parts of the world were interested in analyzing the states of this virus’s spread. Here we will discuss the most critical publications at present and their research contributions.
A mathematical model was implemented by Kucharski et al., which uses serial Monte Carlo simulations where the rate of early virus transmission is determined by calculating the average number of daily reproduction, or the time-varying basic reproduction number called Rt in various measures, such as the proportion of confirmed cases. Suppose the communication becomes homogeneous, and the risk of spreading the disease increases [5]. In addition, the transmission of the virus was controlled by deriving a mathematical model that relies on isolation and contact tracing. The delay in the back of symptoms is determined, and isolation leads to an increase in the probability of spreading the virus. There is doubt about identifying symptoms if the stage is early and a lower evaluation test threshold, which lengthens the wait in detecting signs. It is expected that there will be an effect on more people [6]. It is also possible to take advantage of modern technologies to obtain various predictions for different aspects of the answer to COVID-19 using AI, machine learning, deep learning, and massive data. Below are some of the critical ways technologies can be used, such as early diagnosis of many diseases, contact tracing, development of drugs and vaccines, making predictions of future cases, etc. [7]. Another study used a clustering algorithm known as K-means; this is an unsupervised machine learning algorithm. The aim is to gather COVID-19 data for various predictive variables and concepts. The model assisted in studying the state of countries infected by coronavirus or those that are very likely to be affected by it shortly [8]. Additionally, some recent works aimed at predicting cases of coronavirus are illustrated. For instance, in 2020, Butt et al. developed a CNN system to discover coronavirus patients. This was done by employing a computerized tomography (CT) scan that scans the chest. Better results were obtained using the CNN model in that detection of COVID-19 via a CT scan is performed to examine the chest by comparing the conventional RT-PCR test. Overall, the CNN model is a COVID-19 infection detection model that is both accurate and fast [9]. In addition, Huang et al., in their study, used one of the deep learning algorithms for chest tomography of patients who were infected with coronavirus to determine the impact on the lungs of those infected, where the coronavirus patients were classified as moderate; based on CT scan findings, cases are categorized as mild, serious, or critical. Using a chest X-ray as well as a health assessment and lab findings, a deep learning algorithm was applied to determine the extent of the patient’s lung disease. The researchers found that lung opacity assessment using a chest CT scan differed greatly from the assessment of clinical groups, insisting that the model can eliminate the subjectivity that resulted from the initial evaluation in the original estimation of the coronavirus results [10].
On the other hand, Mai et al. developed a joint-based model, which includes a CNN in addition to a random tree, a support vector machine (SVM), random forest, and the result of a CT scan of the chest and non-imaging clinical information with the aim of early prediction of the coronavirus infection. The CNN is applied to a tomography image. Other algorithms for coronavirus have been classified using clinical information that is invisible and using a set of outputs from the CNN algorithm and various other algorithms to predict the patient’s infection with the virus. Using these three models, the diagnostic tool can quickly detect patients with coronavirus [11]. Loey et al. diagnosed coronavirus in patients by developing a generative adversarial network (GAN) and a CNN variant. However, the data gleaned from the virus are insufficient, since the GAN was used to produce a huge number of X-ray images. In addition to that, they used the GoogLeNet and AlexNet applications, as well as the ResNet18 application, as models of deep transfer learning. Whereas GoogLeNet and AlexNet scored 80%, 85.4%, and 100%, respectively, the method that they developed can work in the early detection of coronavirus patients and thus help the radiologist detect the virus [12].
In 2020, Ucar and Korkmaz developed a model for diagnosing COVID-19 patients using SqueezeNet (pre-defined CNN), X-ray images, and the Bayesian optimization method. The parameters that exceed the network pressure have been improved by SqueezeNet and were implemented using the Bayesian optimization technique, with X-ray images labeled plain, pneumonia, and COVID-19, which is based on Bayesian optimization to diagnose coronavirus, to answer the question: where is it? Based on Bayesian philosophy, basic diagnostic instruments were outperformed by SqueezeNet [13]. Tiwari et al., in 2020, created a machine learning model that forecasts the number of cases infected with coronavirus and recovery cases. Based on data from China, the number of deaths in the Indian state indicated that the prediction for the virus reached its peak in April 2020, starting in the third week and ending in the fourth week. The Indian government benefits from this research, as it makes appropriate decisions to mitigate the spread of coronavirus and limit its spread [14]. In 2020, Qiang et al. predicted the risk of possible infection of non-human origin coronavirus from the spike protein for immediate warning via the random forest algorithm. It consists of data that are known as the resulting genome data of the origin of the non-human coronavirus (positive) and the origin of the human coronavirus (negative), where it is used in random forest algorithm training to predict the origin of the non-human coronavirus. The random forest model estimated the origin of the non-human coronavirus with high precision, according to the findings. This study is useful in tracking the coronavirus genome’s mutation and exploring the dynamics of evolution in simple development, fast development, and large-scale development [15].
Furthermore, in 2020, Ke et al. used two models of machine learning to identify already marketed drugs that could be used in treating patients with coronavirus. They collected a set of data to refine the two models. Whereas the first model was based on drugs that were both successful and usually antiviral, the second model relied on protease inhibitors that are similar to the main protease found in coronaviruses. It predicts which drugs have the most effectiveness against viruses through a test called the multiplication of the peritonitis virus, which leads to infection of cells. The reactions of the machine learning model were the results of the test. Finally, 80 drugs with efficacy and ability to combat coronavirus-induced peritonitis were identified [16].
As well, Kirbas and his colleagues executed a comprehensive comparative assessment of some of the available time-series algorithms for modeling and predicting the coronavirus’s accumulated confirmed cases and the overall rates of increase in some European countries. The ARIMA is one of the algorithms used with the LSTM and the NARNN [17]. The prediction time horizon is 14 days ahead. The accumulated data of confirmed cases were collected from 8 different European nations, and the dataset up to 3 May 2020 was considered. The analysis shows that the LSTM model’s MAPE values are higher than the other models for achieving a prediction process.
Also, Chimmula and Zhang used the LSTM algorithm to forecast the next two weeks of confirmed coronavirus cases in both Canada and Italy. The analysis’s primary aim was to predict and compare the rate of increase in the number of confirmed cases in these two countries. In this analysis, the time horizon is considered short-term. The dataset used in the study on coronavirus cases is with the participation of Johns Hopkins University in the United States and the Canadian Health Authority. The obtained MAPE had a 92% accuracy. This high accuracy achieved by the LSTM algorithm proves its effectiveness in dealing with this problem [18].
In Saudi Arabia, Alzahrani et al. forecasted the daily increase in the confirmed cases of COVID-19, one month ahead of time. They used two popular algorithms, ARIMA and ARMA, where ARMA is used as a statistical analysis model. The datasets of COVID-19 cases were obtained from the Saudi Arabian government website. The result found that ARIMA outperformed ARMA [19]. However, in this study, no deep learning algorithms were used, and the time horizon is long and did not consider short-term intervals. Also, this study has not considered forecasting the recovered and death cases in the country. On the other hand, the linear regression model was used by Roseline et al. to predict the next eight days of confirmed cases in Nigeria, where the data were collected through the NCDC website. A confidence interval of 95% accuracy was achieved as a result [20]. Additionally, in India, Tomer and Gupta performed a prediction mission by adopting the LSTM deep learning algorithm to forecast the next month of both the confirmed and recovered case numbers, where the datasets of the study were collected from the Center for Systems Science and Engineering (CSSE) at Johns Hopkins University. The LSTM had a 90% accuracy rate in predicting COVID-19 cases, according to the findings [21].
Likewise, Hawas used only the RNN deep learning algorithm to predict the next 30 and 40 days of Brazil’s confirmed cases of coronavirus. The data were also collected through the CSSE at Johns Hopkins University. The RNN achieved a forecasting accuracy of 60.17% [22]. Different algorithms were utilized by Papastefanopoulos et al. to predict the next week of confirmed dead and recovered cases in 10 countries. The algorithms used include ARIMA, TBAT, Prophet, and DeepAR, and their proposed model is the Holt–Winters additive model (HWAAS). The datasets used for that were collected mainly from the website of kaggle.com. The findings show that ARIMA and TBAT are better than the others in predicting virus cases [23].
Car et al. used an artificial neural network, the multilayer perceptron, to forecast the next month of the number of all confirmed, dead, and recovered cases globally. The study’s datasets were obtained from CSSE for cases that had been confirmed [24]. Moreover, the algorithms of RNN, LSTM, and VAE were utilized by Zeroual et al. to predict the next 17 days of confirmed, recovered cases for 6 states. The datasets for all six states were also collected from CSSE. Based on the error measures, the results found that variational autoencoder (VAE) forecasting capability is better than the other algorithms [25]. Arora et al. used four algorithms to forecast the next day or week of India’s confirmed cases. The information and data were gathered from the Ministry of Health and Family Welfare. The analysis showed that the bidirectional LSTM gives better results and minor errors [26]. Hemdan et al. suggested a deep learning transfer strategy to predict coronavirus patients automatically in which chest X-ray images were taken from coronavirus patients. A healthy person is used as data for the model. This data include 50 patients infected with coronavirus. From the shared GitHub repository, X-rays were taken. In addition, 50 X-rays of recovered and healthy people were taken from a Kaggle warehouse. According to the results, the model that was learned in advance and the residual network, which is denoted by ResNet50, have given a high prediction accuracy of 98%. This ratio is higher than the other models [27]. Also, in this study, the researchers developed a currency principle model based on the early detection of coronavirus using computed tomography images using various methods of machine learning, with a dataset was collected from the Societa Italiana di Radiologia Medica e Interventistica (SIRM). As the dataset contains 53 cases of coronavirus and includes a CT scan of 150 CT images, the correction areas were cut from the images. The SVM algorithm was used for extraction properties, as the best results were obtained from the occurrence matrix with an accuracy rate of 99.7% [28].
Likewise, Hu et al. proposed a model for epidemiological prediction. The model data were 15,384 and 36,602 clinically-confirmed and laboratory-confirmed cases, respectively. The data type was time series and was collected from Chinese news [29]. Gozes et al. developed a model to diagnose COVID-19. The model’s data included 157 patients. The data type was CT scan images of lungs and was collected from the testing dataset source at the hospital in Wenzhou, China, Chainz, and El-Camino Hospital [30].
Moreover, Yang et al. developed an epidemiological prediction model. The type of data used in this study was non imaged and was obtained through a collection of data reported by the Chinese National Health Commission in the outbreak of coronavirus [31]. Furthermore, Alok et al. analyzed the time series data of the five countries most affected by coronavirus to predict the spread of the epidemic. The data collected from the United States, Brazil, India, Russia, and Spain were forecasted for the next 77 days. The results obtained suggest that India and Brazil will reach 1.38 million and 2.47 million, while the United States will reach 4.29 million, with no cure for this epidemic [32]. Also, Tania et al. studied daily confirmed cases of COVID-19 data from Johns Hopkins University using the ARIMA algorithm, and the results showed that China and Thailand have a stable trend; at the same time, South Korea is decreasing and then becoming stable in the future, while Iran and Italy are unstable [33]. Hernandez et al. analyzed the spread of COVID-19 on 6 continents and predicted the spread of the virus. The ARIMA model was used for 145 countries distributed on different continents. The results showed a relationship between the spread of the virus and variables in the country such as humidity, climate, culture, etc. [34]. Afshin et al. have also used AI methodologies such as deep learning, which has gained more popularity than machine learning. A full survey of studies on the application of deep learning techniques in COVID-19 for diagnostic and mechanistic segmentation of the lungs is discussed [35]. Elsheikh et al. used the LSTM algorithm to predict the number of confirmed and recovered cases in Saudi Arabia. The accuracy of the model was evaluated using seven criteria for statistical evaluation, and reasonable prediction accuracy was obtained [36]. Marzouk et al. used the LSTM and CNN algorithms and a multilayer perceptron neural network on data from 14 February to 15 August 2020, for the country of Egypt. The results were evaluated for models through the coefficient of determination and RMSE. The LSTM model showed the best performance in predicting the number of cumulative injuries for a week and a month [37]. Interestingly, Akdi et al. developed an essential harmonic regression technique to reveal the daily infected cases’ hidden periodic structure. Their research study attempted to answer the question of whether there will be a second wave of the virus [38]. Additionally, a number of research works have appeared with a focus on the analysis of people’s feeling about the negative effects of coronavirus in several countries around the world, such as [39,40,41,42,43,44,45,46,47,48].
Consequently, this paper focuses on conducting a comparative assessment of deep learning algorithms for the prediction of the spread of the COVID-19 pandemic in KSA using real-time series data. The paper mainly concentrates on estimating short-term and medium-term but also also long-term forecasting time horizons regarding infections, recoveries, and deaths for coronavirus cases in the coming days, weeks, and months in Saudi Arabia.
3. Methods and Data
3.1. Methodology
The flowchart shown in Figure 1 is designed to demonstrate the methodology steps, presenting the sequence of the work as follows:
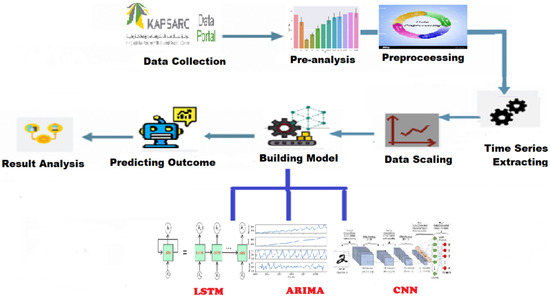
Figure 1.
Methodology Chart.
- (1)
- Data Collection: The required dataset of COVID-19 in Saudi Arabia provided by the Ministry of Health.
- (2)
- Pre-Analysis: Some analysis steps were made on the data to discover hidden patterns.
- (3)
- Processing: Processing data and cleaning missing values or unimportant variables.
- (4)
- Time Series Extraction: Extraction of a day, month, and year from collected data and making them into separate attributes for the analysis.
- (5)
- Data Scaling: Scaling data is very important to get good performance when applying models.
- (6)
- Building Models: It is the core step, where three models are built based on three different algorithms; LSTM, CNN, and ARIMA.
- (7)
- Predicting Outcomes: For each model, we predict the outcomes of different cases in cities.
- (8)
- Results of Analysis: After applying the models, the results of each algorithm are analyzed separately.
3.2. Research Datasets
Some governments have published a variety of publicly accessible data sources. Additionally, actual and real-time observations are available to be used for up-to-date real-time evaluations of COVID-19 event forecasting by researchers of interest. Saudi Arabia’s government is one of the first governments to make all data related to coronavirus infections publicly available to all interested researchers. The data provide complete transparency to support scientific research related to this pandemic. Such datasets can be downloaded through the website of Saudi Arabia’s Ministry of Health. Practically, all datasets on COVID-19 issued by the Ministry of Health of Saudi Arabia can also be accessed and found easily through the platform of King Abdullah Petroleum Studies and Research Center (KAPSARC). The time-series data of the overall Saudi Arabian cases of COVID-19 and the cases associated with each city and region are collected. For the analysis in this paper, there are three independent time-series datasets gathered as follows:
- (1)
- Confirmed cases (newly infected cases).
- (2)
- Recovered cases.
- (3)
- Death/mortality cases.
The confirmed, recovered, and death cases were collected from 1 April 2020 to 31 May 2021 for our analysis and research purposes.
3.3. Data Preprocessing Steps
Data pre-processing is a necessary task before starting data analysis. The pre-processing includes several steps as follows:
- Step 1: The dataset needs to be cleaned before applying the algorithm; in this step, we process the missing values and fill them with zero.
- Step 2: Sort the date in ascending order starting with 1 April 2020.
- Step 3: Extract day, month, and year from the date column for analysis.
- Step 4: Split weekend days from weekdays and apply pivoting on the indicator column to get case type in different columns, then fill missing values with zero.
- Step 5: Create and prepare a new dataset for each case daily and cumulatively for Saudi Arabia.
3.4. Selection of the Deep Learning Algorithms
Three different types of deep learning algorithms were selected, demonstrated briefly in the following sections:
- (1)
- Long short-term memory (LSTM)
- (2)
- Convolutional neural network (CNN)
- (3)
- Autoregressive integrated moving average (ARIMA)
3.5. Performance Evaluation Metrics
Several statistical performance metrics are used to evaluate the predictive efficacy of established models. The root mean square error (RMSE), normalized root mean square error (nRMSE), R-squared (), the mean absolute percentage error (MAPE), mean absolute error (MAE), and normalized mean absolute error (nMAE) are the six metrics that have been applied in this study. These metrics are mathematically represented in Equations (1)–(6).
3.6. COVID-19 Assumptions
A mathematical model was constructed based on the following assumptions based on the features of COVID-19 disease transmission: (A1): the transmission force of infectious diseases, such as the basic reproduction number, the probability of contact between susceptible and infected individuals, and the investment in prevention and control resources, such as quarantine, isolation, and precautionary measures, determine the number of confirmed, recovered, and death cases. (A2): the daily new confirmed, recovered, and death cases provide information on the force of infection and investment in epidemic prevention resources. Such information will not alter appreciably in the near future and will impact the number of new infections. It is possible to anticipate the number of daily new confirmed, recovered, and death cases for the short term with the reasonable modeling of these time series data. In other words, the number of new confirmed, recovered, and death cases reported daily follows a clear trend. (A3): because of symptoms or widespread monitoring, the majority of infectious persons will be diagnosed within 14 days. Individuals who have been diagnosed positive will be isolated and treated, and their potential to transmit the infection further will be lost. Infected persons who otherwise could not have been diagnosed with a large-scale test can infect vulnerable individuals throughout the incubation period, according to assumption (A3). Increasing the extent of testing measures might reduce the duration of infection in COVID-19 infected persons. Many infectious individuals have the potential to spread COVID-19 disease within 14 days of infection, and the infection lasts no more than 14 days in COVID-19 infected people. People who have been diagnosed during the last 14 days affect the new confirmed individuals. The number of new confirmed COVID-19 cases each day is associated with the number of new confirmed persons in the previous 14 days. Based on assumptions (A1)–(A3), we identify the critical elements to develop a prediction model, The average number of new confirmed, recovered, and death COVID-19 cases in the past two weeks are represented by the means and characterize the average level of disease transmission force and investment in epidemic control resources in the near future. A predictive model based on the COVID-19 time series data from Saudi Arabia is proposed that combines ARIMA, LSTM, and CNN deep learning algorithms, which can deal with time series and extract features from these, using the number of new infected confirmed, recovered, and death cases.
4. Implementation and Discussion of Results
This section is mainly focused on the implementation phase and the results of this research. Each model is built based on three different deep learning algorithms; CNN, LSTM, and ARIMA. In this section, those algorithms are applied in different experiments. Finally, the performance of each algorithm is calculated by using the six various metrics presented above.
4.1. Experimental Setup
All the tests are run on a 64-bit Windows operating system with an Intel Core i5-7200U (2.50 GHz) processor, 8.00 GB of RAM, a 128 GB solid-state drive, and no graphics card. ARIMA, LSTM, and CNN were implemented using well-known deep learning Python libraries including Keras, TensorFlow, and NumPy. The activation function for the input layer was set to ReLU with accurate return time series sequences. In the final layer, the Adam optimizer was employed. The validation length for the training process was set to 10 and the batch size to 1, together with the early-stopping epochs criteria. Furthermore, one model’s experiment contains a total of 100 epochs, with 10 epochs every step.
4.2. LSTM Deep Learning (Setup and Training)
To build a forecasting model, a two-layer LSTM neural network structure has been employed. In different aspects, the presented LSTM algorithm varies from other predictive algorithms. For instance, while choosing hyperparameters, the presented LSTM reflects actual-time datasets without making any assumptions. We use the currently available COVID-19 Saudi Arabia dataset to train and test the LSTM proposed model in this analysis. From the original data, the LSTM chooses dependent input variables that affect the training process. The lag observations of the previous 14 days, as well as the mean for the previous 14 days, have been selected as features of the COVID-19 dataset of confirmed cases, death cases, and recovered cases. The purpose of this step is to train the models because the period of infection with COVID-19 in an infected person lasts less than 14 days. It is worth noting that in training the models, each dataset of the three output variables includes: confirmed cases, death cases, and recovered cases independent of the others. The outcome is an output vector containing the predicted output values of confirmed cases, death cases, and recovered cases. The features are translated into a machine-readable form, and the Keras package is used to manage variable input shapes. The original dataset is turned into data-wise total numbers of the COVID-19 confirmed, death, and recovered cases across Saudi Arabia. For further assessment, all lists and arrays should be joined with the same shape, and Python lists require more memory than NumPy arrays.
4.2.1. Selecting the Nodes, Layers, and Hyper-Parameters of LSTM
Multiple layers are layered one on top of the other in Keras, and the model must be initialized as sequential. Depending on the dataset, excellent forecasting outcomes can be acquired using a trial-and-error technique to choose nodes and layers. The optimal model can be selected depending on the value of the loss function. In this analysis, the loss function is used to calculate the error of forecasting for optimizing the hyperparameters of the LSTM models, which is the mean squared error (MSE). In the spectrum of normalization and reshaping, the datasets are normalized and reshaped between [0, 1]. The original dataset is split into two parts: training and testing. Two hidden LSTM layers were chosen because they are sufficient for recognizing complicated patterns. To avoid over-fitting problems, the dropout layer is designated to disregard some neurons throughout the training phase. The dropout layer has a value of 0.2 and is introduced after each layer of the LSTM to maintain the model’s accuracy. The parameter settings in the experiment include the learning rate, which was set to 0.0005; the number of time steps, which was set to 7; the number of features, which was set to 16; and the number of hidden units, which was set to 200. The activation function employed is ReLU. The data sequence is organized in an appropriate format that can be analyzed. A sequence of data points is included in every training sample. The sequence of data is provided to the LSTM layers to forecast future COVID-19 cases. Afterward, the output of the last time step is passed to the next input sequence and so on.
4.2.2. Building, Training, and Testing the LSTM Model
The LSTM method is used to forecast the number of new confirmed, recovered, and mortality cases in the test dataset by fitting the training dataset. The Adam optimizer is an adaptive optimization approach for reducing MSE (the loss function). It optimizes the loss function with minimal hyperparameter modification, which is a key feature that encourages its employment. The forecasting findings of the LSTM model for future COVID-19 instances are described in this section. The dataset is divided between training and testing, with anticipated and actual values presented for the test dataset. With the confirmed, dead, and recovered cases forecast by using the LSTM model, good forecasting efficiency and precision are attained. We summarize the different values of the error metrics in Table 1. From Table 1, the MAPE’s values of the confirmed, dead, and recovered cases for the LSTM model were found to be 11.65%, 16.9%, and 32.7%, respectively. By further looking at the six error measures of the LSTM model, it can be observed that LSTM has an excellent performance in predicting confirmed and mortality cases. For example, the LSTM’s nRMSE and values for predicting the number of confirmed cases are 4.64% and 0.96, respectively. For the mortality cases, the values of the nRMSE and are 6.33% and 0.94, respectively. However, its performance ability decreased markedly when it predicted the number of recovered cases. For example, the LSTM’s nRMSE and values for predicting the number of recovered cases are 13.6% and 0.313, respectively. The scatter plots that compare the actual and the predicted values of the three cases on the testing sets can be seen in Figure 2, Figure 3 and Figure 4.

Table 1.
Performance evaluation of the test dataset forecasting using the LSTM model.
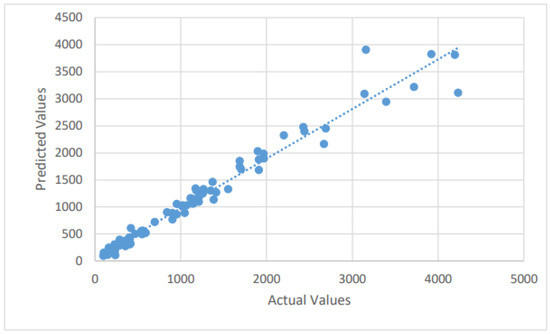
Figure 2.
A scatter plot of the confirmed cases by the LSTM on the testing dataset.
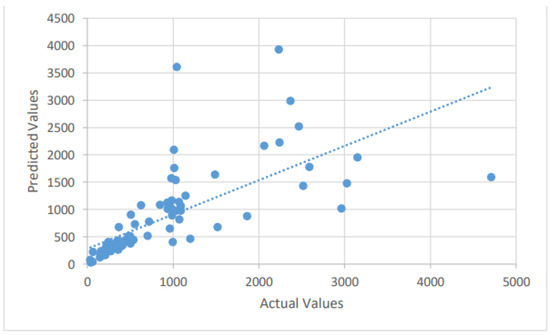
Figure 3.
A scatter plot of the recovered cases by the LSTM on the testing dataset.
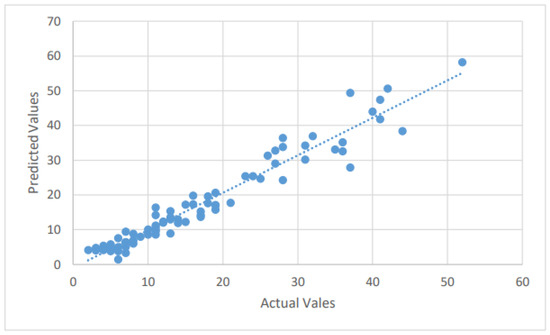
Figure 4.
A scatter plot of the mortality cases by the LSTM on the testing dataset.
4.2.3. Prediction of Future Confirmed, Death, and Recovered Cases
The time-series data provide information on COVID-19 disease development and investment resource management. Such information can be used to analyze new confirmed, recovered, and mortality cases that will occur. The LSTM model is used to fit COVID-19 cases from 1 April 2020 to 31 May 2021, based on the assumptions and by applying the feature set utilizing the current available time-series data. We report a 14-day forecast, 30-day forecast, and 60-day forecast of the COVID-19 pandemic for each of the three cases: confirmed (Figure 5), recovered (Figure 6), and mortality (Figure 7).
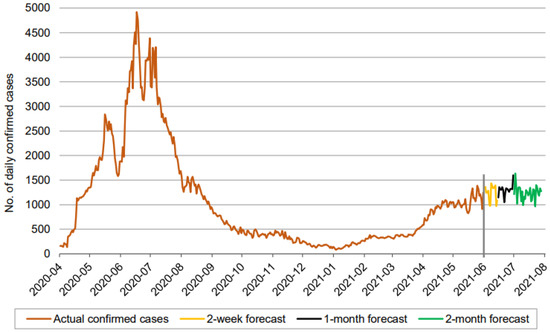
Figure 5.
Prediction over a 60-day forecast for the confirmed cases using the LSTM model.
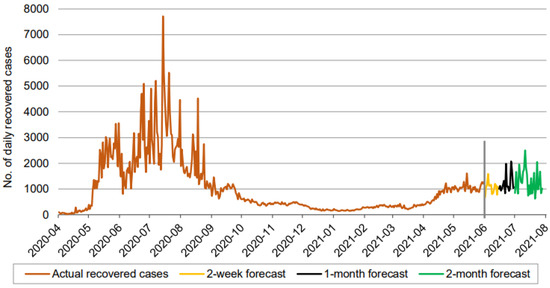
Figure 6.
Prediction over a 60-day forecast for the recovered cases using the LSTM model.
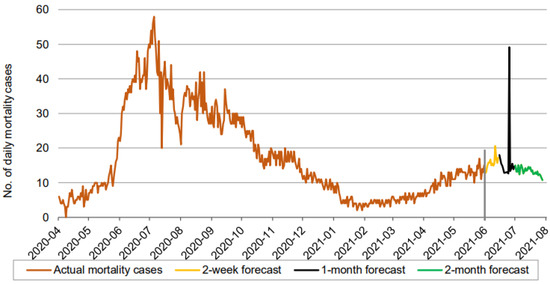
Figure 7.
Prediction over a 60-day forecast for the mortality cases using the LSTM model.
In Figure 5, Figure 6 and Figure 7, the orange line extending to June 2021 represents the actual daily confirmed, recovered, and mortality cases, and is followed by the forecasts for 3 periods: 0–2 weeks (yellow line), 2 weeks–1 month (black line), and 1–2 months (green line).
Figure 5 indicates that the number of daily new confirmed cases (based on 60-day ahead forecasts) fluctuates between approximately 900 and 1600. It is seen that the number of daily new confirmed cases maintains a consistent fluctuation without any clear sign of a downtrend for the next 60 days, assuming existing illness preventive measures, the social environment, and medical service investment remain unchanged. In addition, the 60-day ahead forecast does not show periodic growth.
Figure 6 indicates that the number of daily new recovered cases (based on 60-day ahead forecasts) fluctuates between approximately 600 and 2600, in a somewhat wider range than the confirmed cases. The forecast curve, though inflating after the first two weeks, does not reveal any increasing or decreasing trends. Thus, based purely on the LSTM model, we maintain a similar conclusion about the recovered cases, given all other conditions are unchanged.
A forecast of the mortality cases reveals an interesting picture. There is an increasing trend in the forecasted mortality cases during the first two weeks, until it falls initially during the interim period of 2 weeks to 1 month before spiking suddenly, and finally showing a clear downtrend during the final phase of our 60-day forecast. The model of the mortality cases appears to be reflecting the trend that prevailed in the actual daily mortality cases from the start of our records until February 2021. We now present our forecasts using the three models for each of the three cases: confirmed, recovered, and mortality.
4.3. Selecting the ARIMA Parameters
The parameters used to construct the ARIMA model, along with their values, are: ARIMA (1,1,1) is a model with one auto-regressive (AR) term, one first-order difference, and one moving average (MA) term applied to the z variable, which indicates the linear trend in the data.
4.3.1. Building, Training, and Testing the ARIMA Model
By fitting the training dataset, the ARIMA method is used to predict the number of new confirmed, recovered, and mortality cases on the test dataset. This section describes the ARIMA model’s forecasting findings for future COVID-19 cases. The dataset is split into training and testing, and the test dataset’s forecast and actual values are reported. With the forecasted confirmed, dead, and recovered cases using the ARIMA model, good forecasting efficiency and precision are attained. We summarize the different values of the error metrics in Table 2. From Table 2, the MAPE values of the confirmed, dead, and recovered cases for the ARIMA model were found to be 21.4%, 16.27%, and 34.98%, respectively. By further looking at the six error measures of the ARIMA model, it can be observed that ARIMA has excellent performance in predicting the death cases, but poor performance for confirmed and recovered cases. For example, ARIMA’s nRMSE and values for predicting the number of death cases are 7.0% and 0.88, respectively. For the confirmed cases, the values of the nRMSE and are 13.7% and 0.15, respectively, while for recovered they are 10.05% and 0.39, respectively. The scatter plots that compare the actual and the predicted values of the three cases on the testing sets can be seen in Figure 8, Figure 9 and Figure 10.
Table 2.
Performance evaluation of the test dataset forecasting using the ARIMA model.
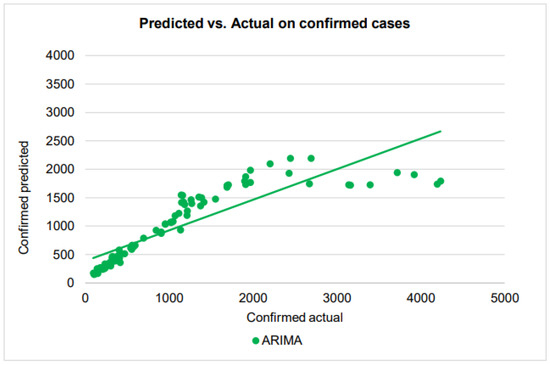
Figure 8.
A scatter plot of the confirmed cases by ARIMA on the testing dataset.
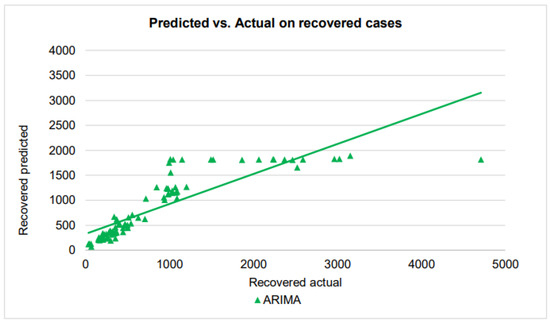
Figure 9.
A scatter plot of the recovered cases by ARIMA on the testing dataset.
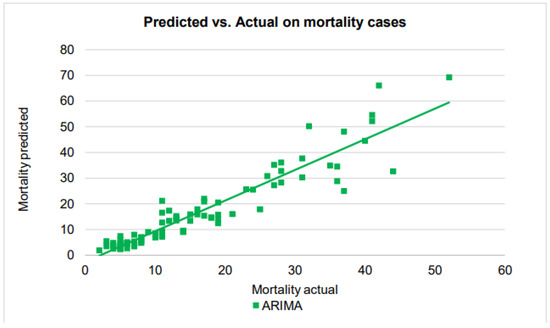
Figure 10.
A scatter plot of the death cases by the ARIMA on the testing dataset.
As we see in the scatter plot, the predicted confirmed cases show some higher-order polynomial relationship, rather than the first-order linear relationship with the actual confirmed cases. The regression line in the plot, which has been drawn assuming a linear relationship and placed in the plot for comparison with other similar plots, is therefore not valid.
As in the performance in confirmed cases, ARIMA prediction of recovered cases shows some non-linear function relationship with the actual cases. When the number of cases is around 1000 with small differences, ARIMA made predictions of a large range from 1000 to 1800. On the other hand, for actual cases from about 1100 to about 5000, ARIMA makes an almost constant prediction of about 1800 to 1900, making the overall scatter plot a stage-wise appearance.
In contrast to the performances in confirmed and recovered cases, ARIMA’s predictions in the mortality cases are very good, finally managing to establish a linear relationship between the actual cases and predicted cases. Also, the points in the scatter plot closely follow the regression line for the number of cases up to 30, before starting to show performance deterioration for the number of mortality cases beyond 30.
4.3.2. Prediction of Future Confirmed, Death, and Recovered Cases
The number of new confirmed, recovered, and death cases are determined by the disease transmission force and the investment in disease prevention resources, according to assumptions (A1)–(A3). The time-series data give existing information on COVID-19 disease development and investment resource management. Such information can be used to analyze new confirmed, recovered, and mortality cases that have occurred recently. The ARIMA model was used to fit COVID-19 cases from 1 April 2020 to 31 May 2021, based on the assumptions and by applying the features set utilizing the current available time-series data. We report a 14-day forecast, 30-day forecast, and 60-day forecast of the COVID-19 pandemic for each of the three cases (see Figure 11, Figure 12 and Figure 13). The orange line extending until June 2021 represents the actual daily confirmed, recovered, and mortality cases and is followed by the forecasts for 3 periods: 0–2 weeks (yellow line), 2 weeks–1 month (black line), and 1–2 months (green line).
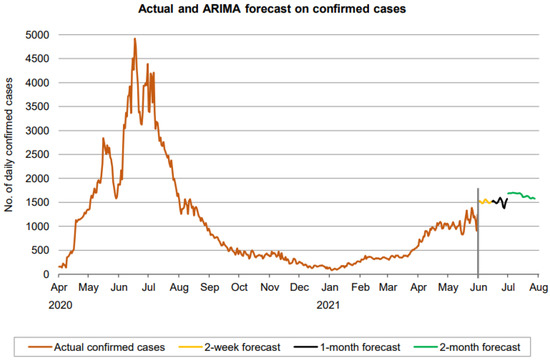
Figure 11.
Prediction over a 60-day forecast for the confirmed cases using the ARIMA model.
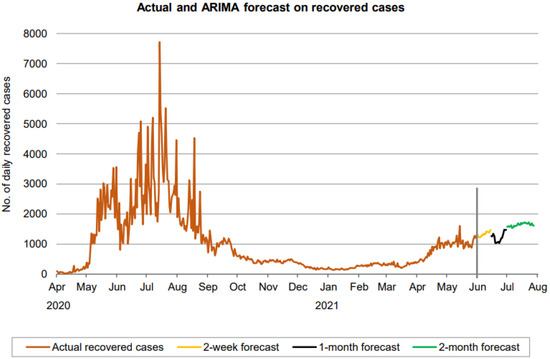
Figure 12.
Prediction over a 60-day forecast for the recovered cases using the ARIMA model.
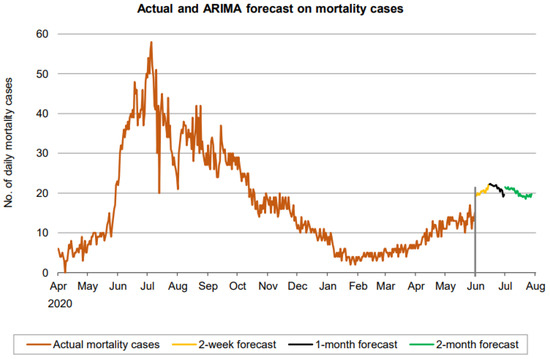
Figure 13.
Prediction over a 60-day forecast for the death cases using the ARIMA model.
Figure 11 indicates that the number of daily new confirmed cases (based on 60-day ahead forecasts) fluctuates approximately between 1400 and 1700. It is seen that the number of daily new confirmed cases maintains some fluctuation without any clear sign of a downtrend over a forecasted period of the first month. From the second month, a downward trend appears to be forming. However, the forecasting period is not large enough for a definitive conclusion about the trend.
Figure 12 indicates that the number of daily new recovered cases (based on 60-day ahead forecasts) resides in the approximate range between 1000 and 1800. The forecast curve shows an increasing trend during the first 2 weeks and then takes a dive at the start of the next period (black part of the curve) before resuming the increasing trend again after. However, the growth starts declining in the final phase of the 60 days.
A forecast on the mortality cases reveals a wavy trend, increasing during the first 2 weeks, then decreasing until the end of the 1-month forecasting and finally showing another wave as shown in Figure 13.
4.4. Selecting the CNN Parameters
We build a CNN model with three convolution layers and two fully linked layers in this model. For the nonlinear transformation, we employ ReLU as the activation function, and two fully linked layers are constructed. We use data from 1 April 2020 to 31 May 2021, to train the CNN model. The model trained for 500 epochs and detected convergence after 300 epochs because the loss does not reduce much when the number of epochs exceeds that threshold.
4.4.1. Building, Training, and Testing the CNN Model
By fitting the training dataset, the CNN method is used to predict the number of new confirmed, recovered, and mortality cases on the test dataset. This section describes the CNN model’s forecasting findings for future COVID-19 cases. The dataset is split into training and testing, and the test dataset’s forecasted and actual values are reported. With the forecasted confirmed, dead, and recovered cases of COVID-19 using the CNN model, good forecasting efficiency and precision are attained. We summarize the different values of the error metrics in Table 3. The MAPE values of the confirmed, death, and recovered cases for the CNN model were found to be 10.03%, 17.62%, and 38.86%, respectively. By further looking at the six error measures of the CNN model, it can be observed that CNN has excellent performance in predicting confirmed cases. In addition, CNN has a very good performance in predicting the death cases, while it has a good performance on the recovered cases. For example, the CNN’s nRMSE and values, for predicting the number of confirmed and death cases, respectively, are 4.74% and 0.95, and 8.48% and 0.90. In the recovered cases, the two metrics are 9.05% and 0.67. The scatter plots that compare the actual and the predicted values of the three cases on the testing sets can be seen in Figure 14, Figure 15 and Figure 16.
Table 3.
Performance evaluation of the test dataset forecasting using the CNN model.
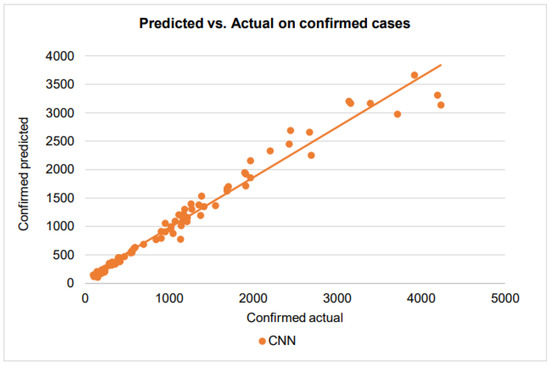
Figure 14.
A scatter plot of the confirmed cases by CNN on the testing dataset.
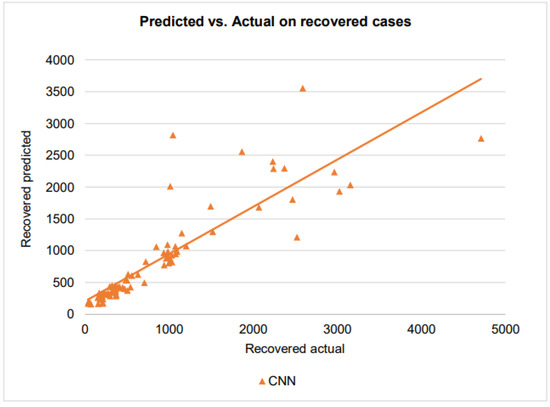
Figure 15.
A scatter plot of the recovered cases by CNN on the testing dataset.
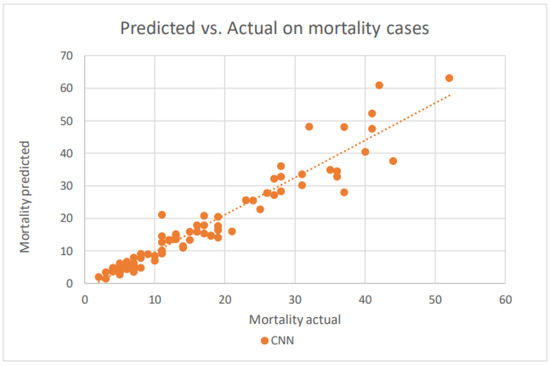
Figure 16.
A scatter plot of the death cases by CNN on the testing dataset.
With the points of the scatterplot closely following the regression line and a very high score of 0.95, CNN has excellent goodness of fit in modeling the confirmed cases. For the recovered cases, when the number of recovered cases varies from 0 to 1000, the CNN has an score of 0.67, showing a good prediction performance. However, the CNN prediction has larger errors when the number of recovered cases exceeds 1000. This is could be due to the difficulties that healthcare providers face in taking care of patients when they receive more patients.
CNN’s prediction in the mortality cases is very good, comparable to that in the confirmed cases. The model shows somewhat superior performance even for the higher number of mortality cases.
4.4.2. Prediction of Future Confirmed, Death, and Recovered Cases
The number of new confirmed, recovered, and death cases is determined by the disease transmission force and the investment in disease prevention resources, according to assumptions (A1)–(A3). The time-series data provide information on COVID-19 disease development and investment resource management. Such information can be used to analyze new confirmed, recovered, and mortality cases that will occur. The CNN model is used to fit COVID-19 cases from 1 April 2020 to 31 May 2021, based on the assumptions and by applying the features set utilizing the current available time-series data. We report a 14-day forecast, 30-day forecast, and 60-day forecast of the COVID-19 pandemic for each of the three cases: confirmed, recovered, and mortality. In Figure 17, Figure 18 and Figure 19, the orange line extending until June 2021 represents the actual daily confirmed, recovered, and mortality cases and is followed by the forecasts for 3 periods: 0–2 weeks (yellow line), 2 weeks–1 month (black line), and 1–2 months (green line).
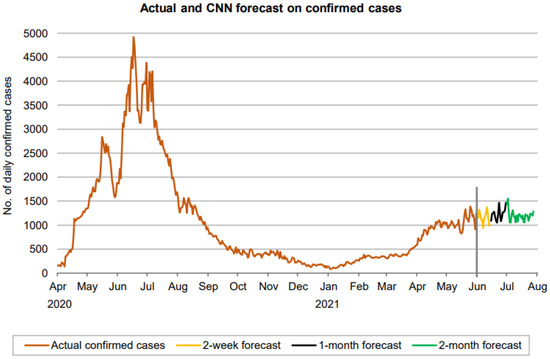
Figure 17.
Prediction over a 60-day forecast for confirmed cases using the CNN model.
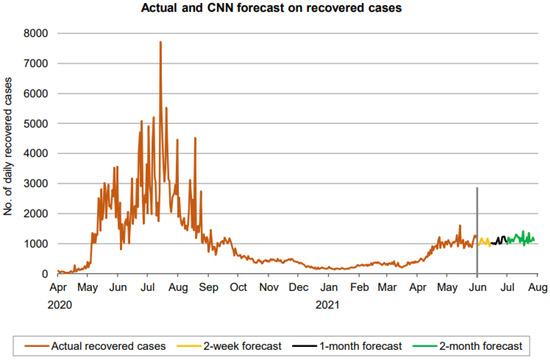
Figure 18.
Prediction over a 60-day forecast for the recovered cases using the CNN model.
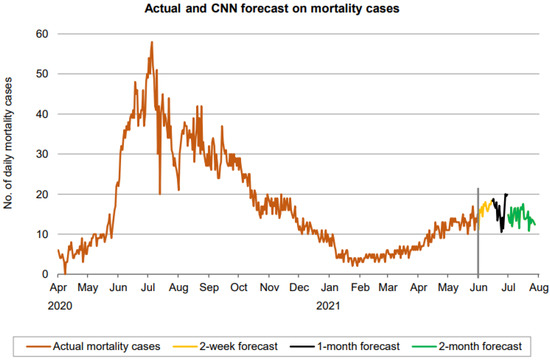
Figure 19.
Prediction over a 60-day forecast for the death cases using the CNN model.
Figure 17 indicates that the number of daily new confirmed cases (based on 60-day ahead forecasts) fluctuates between approximately 900 and 1600, with a near-constant moving average and without a clear sign of any trend, though the fluctuation in the forecasted cases has reduced a bit during the final phase of the forecasted period. Overall, the forecasting period is not large enough for a definitive conclusion about the trend.
Figure 18 indicates that the number of daily new recovered cases (based on 60-day ahead forecasts) resides in the approximate range between 900 and 1300, indicating a lower range of fluctuation than the confirmed cases. There is no clear sign forming any trend in the forecast here as well. A forecast of mortality cases also reveals a fluctuation in the number of cases from 10 and 20. Thus, in all three cases, CNN predicts a fluctuation without a clear trend.
4.5. Comparative Analysis
Table 4 and Figure 20 show that the LSTM model performs better than any of the other models in predicting the confirmed and death cases, with lower RMSE and MAPE values and greater values. In addition, CNN is better at predicting recovered cases than LSTM and ARIMA based on the value. The evaluation measure values show that LSTM is superior to the other models.
Table 4.
Performance evaluation of the three predictive algorithms.
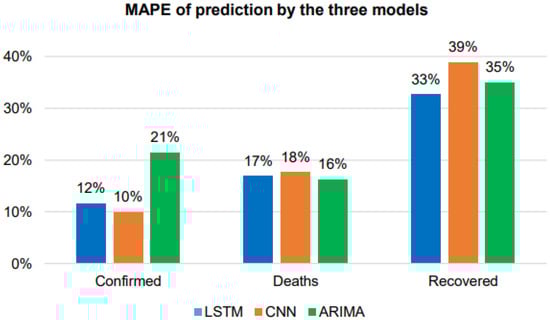
Figure 20.
MAPE comparison of the three models.
5. Conclusions
The goal of this research was to look into the function of deep learning in fighting the epidemic by examining COVID-19 data. The COVID-19 pandemic has posed a major threat to humanity, with irreversible societal consequences. Research is being conducted to anticipate the development or return of the pandemic at any time, and consequently reduce the death toll. Maybe in the future context, accurate COVID-19 prediction using deep learning will gain increasing attention as deep learning approaches are more successful in dealing with non-linear situations. Time-series prediction of COVID-19, in terms of the estimated number of confirmed, death, and recovered cases, is performed in this study utilizing ARIMA, LSTM, and CNN models. Short-term, medium-term, and long-term infected cases are all predicted in the proposed methodology. We used daily data from 1 April 2020 to 31 May 2021 to train and evaluate the models for this study. The models used in this study are data-driven, and we use RMSE, nRMSE, MAE, nMAE, MAPE, and metrics to assess all models’ predictive performances. We aim to evaluate and contrast the abilities of ARIMA, LSTM, and CNN models in interpreting complex time-series trends, and ultimately to forecast new cases for the future period of 14 days, 30 days, and 60 days.
Consequently, the following findings can be drawn:
- The best model to predict the confirmed cases is LSTM, which has better RMSE and values. Still, CNN has a similar comparative performance to LSTM.
- The best model to predict death cases is LSTM, with better RMSE, MAE, MAPE, and values compared to the other two models.
- The best model to predict the recovered cases is CNN, with better RMSE, MAE, MAPE, and values compared to the other two models.
- The most difficult cases to predict are the recovered cases, which have lower error metrics achieved by all algorithms.
- LSTM unexpectedly performed badly when predicting the recovered cases. It has RMSE and values of 641.32 and 0.3134, respectively.
- There is a slight difference between ARIMA and an LSTM algorithm in predicting death cases. ARIMA has MAE and MAPE values of 2.25 and 16.27%, respectively.
- To sum up, LSTM has a better predictive performance for the confirmed and death cases, while CNN has a better performance in predicting the recovered cases.
To sum up, these methods and predicted consequences will aid in the prevention of COVID-19 pandemic infections. Consequently, it is worth mentioning that all generated figures and tables come from our data and analysis.
6. Future Work
The research results can help researchers who have similar interests achieve important extensions to the current findings in the future. Future research recommendations include the following:
- Investigating other advanced deep learning and machine learning algorithms and comparing their performance to the techniques used in this research.
- Building city-wide forecasting models to predict the spread of COVID-19 cases in major cities in Saudi Arabia, such as Riyadh and Mecca.
- Considering other types of feature selection methods to determine the optimal combinations of features to avoid overfitting and underfitting problems, which in turn lead to the generalization of the models.
- Enriching the datasets using feature extrication engineering to find more relevant features that lead to more accurate forecasts.
- Avoiding manual selection of the hyperparameters of the DL algorithms by using advanced optimization techniques to automatically search for their optimal values.
Author Contributions
Conceptualization, A.A.-R.; methodology formulation, M.A.A.-H. and A.A.-R.; Resources and requirements identification, M.A.A.-H. and A.A.-R.; validation, M.A.A.-H. and A.A.-R.; pre-analysis of data, A.A.-R.; data preprocessing and analysis, A.A.-R.; investigation, M.A.A.-H. and A.A.-R.; writing—original draft preparation, M.A.A.-H. and A.A.-R.; writing—review, and editing, A.A.-R. and M.A.A.-H.; visualization A.A.-R.; supervision, M.A.A.-H.; work administration, M.A.A.-H.; funding acquisition, M.A.A.-H. All authors have read and agreed to the published version of the manuscript.
Funding
This research has been funded by the Scientific Research Deanship at Qassim University, Saudi Arabia, under the number (COC-2022-1-1-J-25678) during the academic year 1444 AH/2022 AD.
Institutional Review Board Statement
Not applicable.
Informed Consent Statement
Not applicable.
Data Availability Statement
The dataset can be obtained from the KSA Ministry of Health (https://covid19.moh.gov.sa/) and from the platform of King Abdullah Petroleum Studies and Research Center(https://datasource.kapsarc.org/pages/home/), accesed 20 January 2023.
Acknowledgments
The author(s) gratefully acknowledge Qassim University, represented by the Deanship of Scientific Research, on the financial support for this research under the number (COC-2022-1-1-J-25678) during the academic year 1444 AH/2022 AD.
Conflicts of Interest
The authors declare no conflict of interest.
References
- Kumaravel, S.K.; Subramani, R.K.; Jayaraj Sivakumar, T.K.; Madurai Elavarasan, R.; Manavalanagar Vetrichelvan, A.; Annam, A.; Subramaniam, U. Investigation on the Impacts of COVID-19 Quarantine on Society and Environment: Preventive Measures and Supportive Technologies. 3 Biotech 2020, 10, 393. [Google Scholar] [CrossRef] [PubMed]
- Jiang, X.; Coffee, M.; Bari, A.; Wang, J.; Jiang, X.; Huang, J.; Shi, J.; Dai, J.; Cai, J.; Zhang, T.; et al. Towards an Artificial Intelligence Framework for Data-Driven Prediction of Coronavirus Clinical Severity. Comput. Mater. Contin. 2020, 63, 537–551. [Google Scholar] [CrossRef]
- Lai, C.C.; Shih, T.P.; Ko, W.C.; Tang, H.J.; Hsueh, P.R. Severe Acute Respiratory Syndrome Coronavirus 2 (SARS-CoV-2) and Coronavirus Disease-2019 (COVID-19): The Epidemic and the Challenges. Int. J. Antimicrob. Agents 2020, 55, 105924. [Google Scholar] [CrossRef] [PubMed]
- Li, H.; Liu, S.M.; Yu, X.H.; Tang, S.L.; Tang, C.K. Coronavirus Disease 2019 (COVID-19): Current Status and Future Perspectives. Int. J. Antimicrob. Agents 2020, 55, 105951. [Google Scholar] [CrossRef] [PubMed]
- Kucharski, A.J.; Russell, T.W.; Diamond, C.; Liu, Y.; Edmunds, J.; Funk, S.; Eggo, R.M.; Sun, F.; Jit, M.; Munday, J.D.; et al. Early Dynamics of Transmission and Control of COVID-19: A Mathematical Modelling Study. Lancet Infect. Dis. 2020, 20, 553–558. [Google Scholar] [CrossRef] [PubMed]
- Hellewell, J.; Abbott, S.; Gimma, A.; Bosse, N.I.; Jarvis, C.I.; Russell, T.W.; Munday, J.D.; Kucharski, A.J.; Edmunds, W.J.; Sun, F.; et al. Feasibility of Controlling COVID-19 Outbreaks by Isolation of Cases and Contacts. Lancet Glob. Health 2020, 8, e488–e496. [Google Scholar] [CrossRef]
- Calandra, D.; Favareto, M. Artificial Intelligence to Fight COVID-19 Outbreak Impact: An Overview. Eur. J. Soc. Impact Circ. Econ. 2020, 1, 84–104. [Google Scholar] [CrossRef]
- Chaudhary, L.; Singh, B. Community Detection Using Unsupervised Machine Learning Technique on COVID-19 Dataset. Soc. Netw. Anal. Min. 2021, 11, 28. [Google Scholar] [CrossRef]
- Xu, X.; Jiang, X.; Ma, C.; Du, P.; Li, X.; Lv, S.; Yu, L.; Chen, Y.; Su, J.; Lang, G.; et al. Deep Learning System to Screen Coronavirus Disease 2019 Pneumonia. arXiv 2020, arXiv:2002.09334. [Google Scholar] [CrossRef]
- Huang, L.; Han, R.; Ai, T.; Yu, P.; Kang, H.; Tao, Q.; Xia, L. Serial Quantitative Chest CT Assessment of COVID-19: A Deep Learning Approach. Radiol. Cardiothorac. Imaging 2020, 2, e200075. [Google Scholar] [CrossRef]
- Mei, X.; Lee, H.C.; Diao, K.Y.; Huang, M.; Lin, B.; Liu, C.; Xie, Z.; Ma, Y.; Robson, P.M.; Chung, M.; et al. Artificial Intelligence–Enabled Rapid Diagnosis of Patients with COVID-19. Nat. Med. 2020, 26, 1224–1228. [Google Scholar] [CrossRef]
- Loey, M.; Smarandache, F.; Khalifa, N.E.M. Within the Lack of Chest COVID-19 X-ray Dataset: A Novel Detection Model Based on GAN and Deep. Symmetry 2020, 12, 651. [Google Scholar] [CrossRef]
- Ucar, F.; Korkmaz, D. COVIDiagnosis-Net: Deep Bayes-SqueezeNet Based Diagnosis of the Coronavirus Disease 2019 (COVID-19) from X-ray Images. Med. Hypotheses 2020, 140, 109761. [Google Scholar] [CrossRef] [PubMed]
- Tiwari, S.; Kumar, S.; Guleria, K. Outbreak Trends of Coronavirus Disease-2019 in India: A Prediction. Disaster Med. Public Health Prep. 2020, 14, e33–e38. [Google Scholar] [CrossRef] [PubMed]
- Qiang, X.L.; Xu, P.; Fang, G.; Liu, W.; Kou, Z. Using the Spike Protein Feature to Predict Infection Risk and Monitor the Evolutionary Dynamic of Coronavirus. Infect. Dis. Poverty 2020, 9, 33. [Google Scholar] [CrossRef]
- Ke, Y.Y.; Peng, T.T.; Yeh, T.K.; Huang, W.Z.; Chang, S.E.; Wu, S.H.; Hung, H.C.; Hsu, T.A.; Lee, S.J.; Song, J.S.; et al. Artificial Intelligence Approach Fighting COVID-19 with Repurposing Drugs. Biomed. J. 2020, 43, 355–362. [Google Scholar] [CrossRef]
- Kırbaş, İ.; Sözen, A.; Tuncer, A.D.; Kazancıoğlu, F.Ş. Comparative Analysis and Forecasting of COVID-19 Cases in Various European Countries with ARIMA, NARNN and LSTM Approaches. Chaos Solitons Fractals 2020, 138, 110015. [Google Scholar] [CrossRef]
- Chimmula, V.K.R.; Zhang, L. Time Series Forecasting of COVID-19 Transmission in Canada Using LSTM Networks. Chaos Solitons Fractals 2020, 135, 109864. [Google Scholar] [CrossRef]
- Alzahrani, S.I.; Aljamaan, I.A.; Al-Fakih, E.A. Forecasting the Spread of the COVID-19 Pandemic in Saudi Arabia Using ARIMA Prediction Model under Current Public Health Interventions. J. Infect. Public Health 2020, 13, 914–919. [Google Scholar] [CrossRef]
- Ogundokun, R.O.; Lukman, A.F.; Kibria, G.B.M.; Awotunde, J.B.; Aladeitan, B.B. Predictive Modelling of COVID-19 Confirmed Cases in Nigeria. Infect. Dis. Model. 2020, 5, 543–548. [Google Scholar] [CrossRef]
- Tomar, A.; Gupta, N. Prediction for the Spread of COVID-19 in India and Effectiveness of Preventive Measures. Sci. Total Environ. 2020, 728, 138762. [Google Scholar] [CrossRef] [PubMed]
- Hawas, M. Generated Time-Series Prediction Data of COVID-19’s Daily Infections in Brazil by Using Recurrent Neural Networks. Data Br. 2020, 32, 106175. [Google Scholar] [CrossRef] [PubMed]
- Papastefanopoulos, V.; Linardatos, P.; Kotsiantis, S. COVID-19: A Comparison of Time Series Methods to Forecast Percentage of Active Cases per Population. Appl. Sci. 2020, 10, 3880. [Google Scholar] [CrossRef]
- Car, Z.; Baressi Šegota, S.; Anđelić, N.; Lorencin, I.; Mrzljak, V. Modeling the Spread of COVID-19 Infection Using a Multilayer Perceptron. Comput. Math. Methods Med. 2020, 2020, 5714714. [Google Scholar] [CrossRef]
- Zeroual, A.; Harrou, F.; Dairi, A.; Sun, Y. Deep Learning Methods for Forecasting COVID-19 Time-Series Data: A Comparative Study. Chaos Solitons Fractals 2020, 140, 110121. [Google Scholar] [CrossRef]
- Arora, P.; Kumar, H.; Panigrahi, B.K. Prediction and Analysis of COVID-19 Positive Cases Using Deep Learning Models: A Descriptive Case Study of India. Chaos Solitons Fractals 2020, 139, 110017. [Google Scholar] [CrossRef] [PubMed]
- Hemdan, E.E.D.; Shouman, M.A.; Karar, M.E. COVIDX-Net: A Framework of Deep Learning Classifiers to Diagnose COVID-19 in X-ray Images. arXiv 2020, arXiv:2003.11055. [Google Scholar]
- Barstugan, M.; Ozkaya, U.; Ozturk, S. Coronavirus (COVID-19) Classification Using CT Images by Machine Learning Methods. arXiv 2020, arXiv:2003.09424. [Google Scholar]
- Hu, Z.; Ge, Q.; Li, S.; Jin, L.; Xiong, M. Artificial Intelligence Forecasting of Covid-19 in China. arXiv 2020, arXiv:2002.07112. [Google Scholar] [CrossRef]
- Gozes, O.; Frid, M.; Greenspan, H.; Patrick, D. Rapid AI Development Cycle for the Coronavirus (COVID-19) Pandemic: Initial Results for Automated Detection & Patient Monitoring Using Deep Learning CT Image Analysis. arXiv 2020, arXiv:2003.05037. [Google Scholar]
- Yang, Z.; Zeng, Z.; Wang, K.; Wong, S.S.; Liang, W.; Zanin, M.; Liu, P.; Cao, X.; Gao, Z.; Mai, Z.; et al. Modified SEIR and AI Prediction of the Epidemics Trend of COVID-19 in China under Public Health Interventions. J. Thorac. Dis. 2020, 12, 165–174. [Google Scholar] [CrossRef] [PubMed]
- Sahai, A.K.; Rath, N.; Sood, V.; Singh, M.P. ARIMA Modelling & Forecasting of COVID-19 in Top Five Affected Countries. Diabetes Metab. Syndr. Clin. Res. Rev. 2020, 14, 1419–1427. [Google Scholar] [CrossRef]
- Dehesh, T.; Mardani-Fard, H.A.; Dehesh, P. Forecasting of COVID-19 Confirmed Cases in Different Countries with ARIMA Models. medRxiv 2020. [Google Scholar] [CrossRef]
- Hernandez-Matamoros, A.; Fujita, H.; Hayashi, T.; Perez-Meana, H. Forecasting of COVID19 per Regions Using ARIMA Models and Polynomial Functions. Appl. Soft Comput. J. 2020, 96, 106610. [Google Scholar] [CrossRef]
- Shoeibi, A.; Khodatars, M.; Alizadehsani, R.; Ghassemi, N.; Jafari, M.; Moridian, P.; Khadem, A.; Sadeghi, D.; Hussain, S.; Zare, A.; et al. Automated Detection and Forecasting of COVID-19 Using Deep Learning Techniques: A Review. arXiv 2007, arXiv:2007.10785. [Google Scholar]
- Elsheikh, A.H.; Saba, A.I.; Elaziz, M.A.; Lu, S.; Shanmugan, S.; Muthuramalingam, T.; Kumar, R.; Mosleh, A.O.; Essa, F.A.; Shehabeldeen, T.A. Deep Learning-Based Forecasting Model for COVID-19 Outbreak in Saudi Arabia. Process Saf. Environ. Prot. 2021, 149, 223–233. [Google Scholar] [CrossRef] [PubMed]
- Akdi, Y.; Emre Karamanoğlu, Y.; Ünlü, K.D.; Baş, C. Identifying the Cycles in COVID-19 Infection: The Case of Turkey. J. Appl. Stat. 2022. [Google Scholar] [CrossRef]
- Marzouk, M.; Elshaboury, N.; Abdel-Latif, A.; Azab, S. Deep Learning Model for Forecasting COVID-19 Outbreak in Egypt. Process Saf. Environ. Prot. 2021, 153, 363–375. [Google Scholar] [CrossRef]
- Rajput, N.K.; Grover, B.A.; Rathi, V.K. Word Frequency and Sentiment Analysis of Twitter Messages During Coronavirus Pandemic. arXiv 2020, arXiv:2004.03925. [Google Scholar]
- Bhat, M.; Qadri, M.; Beg, N.-u.-A.; Kundroo, M.; Ahanger, N.; Agarwal, B. Sentiment Analysis of Social Media Response on the COVID-19 Outbreak. Brain. Behav. Immun. 2020, 87, 136–137. [Google Scholar] [CrossRef]
- Pokharel, B.P. Twitter Sentiment Analysis during COVID-19 Outbreak in Nepal. SSRN Electron. J. 2020. [Google Scholar] [CrossRef]
- Manguri, K.H.; Ramadhan, R.N.; Mohammed Amin, P.R. Twitter Sentiment Analysis on Worldwide COVID-19 Outbreaks. Kurdistan J. Appl. Res. 2020, 5, 54–65. [Google Scholar] [CrossRef]
- Medford, R.J.; Saleh, S.N.; Sumarsono, A.; Perl, T.M.; Lehmann, C.U. An “Infodemic”: Leveraging High-Volume Twitter Data to Understand Public Sentiment for the COVID-19 Outbreak. Open Forum Infect. Dis. 2020, 7, ofaa258. [Google Scholar] [CrossRef]
- Mansoor, M.; Gurumurthy, K.; Prasad, V.R.B. Global Sentiment Analysis of COVID-19 Tweets Over Time. arXiv 2020, arXiv:2010.14234. [Google Scholar]
- Garcia, M.B. Sentiment Analysis of Tweets on Coronavirus Disease 2019 (COVID-19) Pandemic from Metro Manila, Philippines. Cybern. Inf. Technol. 2020, 20, 141–155. [Google Scholar] [CrossRef]
- de las Heras-Pedrosa, C.; Sánchez-Núñez, P.; Peláez, J.I. Sentiment Analysis and Emotion Understanding during the COVID-19 Pandemic in Spain and Its Impact on Digital Ecosystems. Int. J. Environ. Res. Public Health 2020, 17, 5542. [Google Scholar] [CrossRef]
- Chandrasekaran, R.; Mehta, V.; Valkunde, T.; Moustakas, E. Topics, Trends, and Sentiments of Tweets about the COVID-19 Pandemic: Temporal Infoveillance Study. J. Med. Internet Res. 2020, 22, e22624. [Google Scholar] [CrossRef] [PubMed]
- Kruspe, A.; Häberle, M.; Kuhn, I.; Zhu, X.X. Cross-Language Sentiment Analysis of European Twitter Messages Duringthe COVID-19 Pandemic. arXiv 2020, arXiv:2008.12172. [Google Scholar]


Disclaimer/Publisher’s Note: The statements, opinions and data contained in all publications are solely those of the individual author(s) and contributor(s) and not of MDPI and/or the editor(s). MDPI and/or the editor(s) disclaim responsibility for any injury to people or property resulting from any ideas, methods, instructions or products referred to in the content. |
© 2023 by the authors. Licensee MDPI, Basel, Switzerland. This article is an open access article distributed under the terms and conditions of the Creative Commons Attribution (CC BY) license (https://creativecommons.org/licenses/by/4.0/).