Abstract
In constructing hydraulic tunnels, construction disturbances and complex geological conditions can induce variations in the surrounding rock parameters. To navigate the complex non-linear interplay between rock material parameters and tunnel displacement during construction, this study proposes a hybrid learning model. It employs particle swarm optimization (PSO) to refine the hyperparameters of the eXtreme Gradient Boosting (XGBoost) technique. Sensitivity analysis and inversion of rock parameters is performed by using orthogonal design and the Sobol method to analyze the sensitivity of environmental and rock material factors. The findings indicate that the tunnel depth, elastic modulus, and Poisson ratio are particularly sensitive parameters. Mechanical parameters of the rock mass, identified through sensitivity analysis, are the focal point of this research and are integrated into a three-dimensional computational model. The resulting tunnel displacement calculations serve as datasets for the inversion of the actual engineering project’s surrounding rock mechanical parameters. These inverted parameters were fed into the FLAC3D software (version 7.0), yielding results that align closely with field measurements, which affirms the PSO-XGBoost model’s validity and precision. The insights garnered from this research offer a substantial reference for determining rock mass parameters in tunnel engineering amidst complex conditions.
1. Introduction
In recent years, water resources allocation projects have been continuously evolving [1]. As these projects involve the construction of tunnels through geological formations, the geological conditions have become increasingly complex [2]. Challenges accompany the operation, wherein the application of numerical simulations has become a pivotal foundation for operational design and support plans [3]. The effectiveness of calculation depends on the accuracy of the selected mechanical parameters [4]. Nevertheless, the inherent complexity of the rock mass, coupled with the intricate environmental conditions, leads to substantial variability in its mechanical properties [5]. Due to the influence of size effects and engineering considerations [6,7], rock mechanical parameters obtained through field or laboratory testing often fail to capture the comprehensive properties of the surrounding rock masses on a large scale [8]. Consequently, the acquisition of more precise rock mechanical parameters has become a pivotal challenge, limiting theoretical analysis and numerical computations in rock engineering.
The variability of rock parameters in subterranean chambers significantly affects their construction safety and stability [9]. Investigating the impact of these parameters on tunnel construction provides a precise foundation for safety evaluations. Sensitivity analysis, a common quantitative method, assesses this impact, and is divided into local and global types [10]. The one-at- A -time (OAT) method is prevalent in local sensitivity analysis, while global sensitivity analysis includes techniques like multiple regression, Morris screening, and the variance-based Sobol method [11]. For models with numerous attributes and when explicit output parameter equations are infeasible, establishing a relationship between these parameters and evaluation criteria is crucial. Machine learning offers an effective solution for forming non-linear mappings, learning input–output relationships from data without prior knowledge, and making adaptive adjustments [12,13,14]. This approach captures the logical connections between data, providing a robust computational method for sensitivity analysis of rock parameters. While there is a focus on sensitivity analysis for slopes, dam foundations, and bridges in geotechnical engineering, research on rock mass parameters during the construction of underground chambers is less common [15]. Studies often use quantitative statistical methods like grey relational analysis, which qualitatively express impacts on output indicators but do not quantify the extent of their influence.
Since the 1970s, the rapid development of inversion methods has offered effective means for addressing the issue of data collection [16,17,18]. In the initial stages of parameter inversion research, a common approach entailed multiple iterations of pure finite element computations to compare the results with monitoring data, thereby ascertaining parameter values [19]. However, in practical engineering applications, the rock mass parameters obtained using this method often deviate significantly from monitoring data in long-term calculations [20,21]. This highlights the need for timeliness in the inversion of parameters. This method lacks a well-defined range for forward model parameters. The limitations of this approach pertain to both accuracy and computational cost [22,23]. As computer technology advances, an increasing number of optimization algorithms and machine learning methods are employed in the field of rock mass parameter inversion [24,25,26]. Optimization algorithms including artificial neural network (ANN), genetic algorithm (GA), and particle swarm optimization (PSO) were employed to seek optimal combinations of rock mass parameters by analyzing observed data [27,28,29], thus resulting in reduced computational costs [30,31,32].
The above studies have explored inverse modeling of rock parameters to some extent, yielding valuable insights. However, they mainly focus on inverting multiple input parameters using a single output parameter. The machine learning algorithms utilized are set with default hyperparameters, without optimization, leading to less predictable results. Moreover, the use of these algorithms is limited, indicating a need for further evaluation of their fitting performance with a wider range of algorithms.
Red-bed soft rock (RBSR) displays poor mechanical properties, and especially terrible deterioration when exposed to water. This susceptibility to disintegration was evaluated using drying–wetting cycles experiments conducted in accordance with ASTM D4373-14 [33]. In accordance with the Chinese standard for assessing the physical and mechanical properties of rock (DZ/T 0276.9-2015) [34], cylindrical specimens of 50 mm diameter and 100 mm (±1 mm) height, and weighing 0.39–0.41 kg, were used. Two representative RBSR kinds, (a) argillaceous sandstone and (b) silty mudstone, were selected for the wetting–drying cycle testing. Figure 1 shows the results of disintegration experiments. Specimens disintegrated after three cycles, and complete disintegration was observed after ten cycles. This evidence confirms the substantial degradation of the parameters of the RBSR mass in tunnels in water infiltration conditions, which is of paramount concern during tunnel operation. Therefore, the establishment of a numerical tunnel modeling framework for the purpose of obtaining parameter samples and subsequently deducing rock mechanics properties has considerable practical utility.
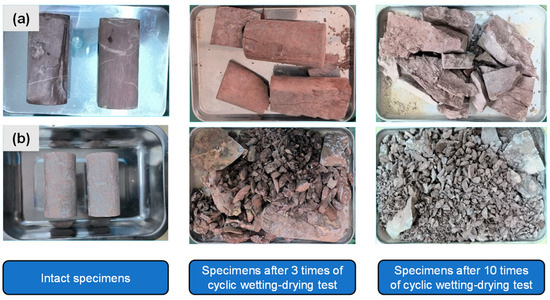
Figure 1.
Cyclic wetting–drying disintegration test of typical RBSR. (a) Argillaceous sandstone; (b) silty mudstone.
This study investigates a red-bed soft rock (RBSR) tunnel section in the Chuxiong segment of the Central Yunnan Water Diversion Project. Geological data form the foundation for determining surrounding rock parameters. A hybrid algorithm model, PSO-XGBoost, was proposed. A finite element model for tunnel operation was established and a Mohr–Coulomb constitutive model was employed. Seven influencing factors, including environmental conditions and rock mass parameters, are selected. Numerical calculations, based on the orthogonal design method, utilize crown displacement, convergence around the tunnel, and the proportion of the plastic zone as output indicators. Global sensitivity analysis, employing the Sobol method, identifies the rock mechanics parameters of elasticity modulus (E), Poisson ratio (μ), cohesion (c), and internal friction angle (φ) for parameter inversion. The Latin Hypercube Sampling (LHS) approach generates 1000 parameter samples for tunnel model simulation using FLAC3D, yielding 1000 datasets for inversion. The results show that the PSO-XGBoost model achieves over 90% accuracy in predicting critical parameters. Verification on five monitoring data cross-sections demonstrates a consistent relative error of less than 15%, affirming the accuracy of the PSO-XGBoost inversion model. This model holds promise for offering valuable insights into the engineering of soft rock tunnels and similar projects, contributing to the field of engineering geology.
2. Methodology
This section introduces the methodology of sensitivity analysis and inversion process in operating the RBSR tunnel model, as shown in Figure 2. The inversion method in this study consisted of four components: (1) the construction of metamodel by the PSO-XGBoost algorithm; (2) the Sobol sensitivity analysis method based on orthogonal experimental results; (3) the establishment of finite element model (FEM) and numerical computations for tunnel operation. The operation included three distinct processes: excavation, primary support, and lining; and (4) the parameter inversion, including metamodel validation, algorithm comparison, and verification of the forward process using inversed parameters.

Figure 2.
The inversion process and methodology of operational tunnel model.
2.1. PSO-XGBoost
2.1.1. Particle Swarm Optimization
The principle of the particle swarm optimization (PSO) method [35] involves configuring a swarm of m particles, each with a position represented as in a D-dimensional space and a corresponding velocity, denoted . Position and velocity are two unique characteristics of each particle. A random function is used for determining a particle’s initial position and velocity. Assuming that velocity and position are independent features of each particle, their positions and velocities are determined using random functions. During each iteration, the particle identifies its best cost solution, termed the local best in comparison to its previous states. Concurrently, the particle swarm collectively identifies the lowest-cost solution among all these local bests within the search space, which is designated as the global best . The speed and position of each particle are changed in accordance with the following equation:
where i = 1, 2, …, m, and i is the position of the particle, d = 1, 2, …, D, m is the particle size, is the dth dimension component of the which is the individual optimal location of the particle j in the hth iteration. is the dth dimension compoent of the , which is the optimal position of all particles in the hth iteration; is the inertia weight coefficient, and are learning factors, and are random numbers in the range [0, 1].
2.1.2. eXtreme Gradient Boosting
Extreme gradient boosting (XGBoost) was proposed by Chen [36], which is an ensemble learning algorithm based on gradient boosting and provides good results for many bioinformatics problems. Moreover, XGBoost is an ensemble method based on gradient-boosted tree, for which the new models could correct the residuals or errors of prior models, thus making the final prediction. XGBoost is a machine learning algorithm based on gradient boosting trees. Its fundamental concept revolves around learning the residuals or errors of the original model, correcting the original model by increasing the number of branches, adjusting the depth of learning, and then combining these corrections to achieve the final regression prediction. The prediction result is the sum of scores predicted by individual trees, and it can be expressed using the following formula:
where corresponds to the prediction value given by the kth tree to the ith sample. represents the variables used in this study.
The purpose of the objective function is to minimize the combination of the loss term and the regularization term for each tree, as defined, for instance, in the classification tree:
where and represent the degrees of regularization, and indicates the number of leaves, and is the vector of values in each leaf.
where denotes the instance set of leaf . represents the variables used in the study.
2.1.3. PSO-XGBoost
In this paper, PSO was chosen for hyperparameter tuning in XGBoost due to its specific advantages over traditional methods like grid search CV and random search CV. PSO is more efficient in navigating high-dimensional space, which is particularly beneficial to the given hyperparameters in the XGBoost model. This method often converges faster than gird or random searches in extensive parameters, which is a critical factor when considering computational cost. Additionally, the collaborative search approach of PSO effectively avoids local minima, which could be a limitation of traditional search methods. The balance between the exploration and exploitation of PSO, coupled with its demonstrated success in similar publication references, made it the preferred choice for our study [37,38]. The XGBoost algorithm is known for its ability to handle non-linear relationships, independence from data feature scaling, and suitability for imbalanced class distributions. However, during computation, different hyperparameter values can yield distinct outcomes. Therefore, the PSO optimization algorithm is employed to optimize five XGBoost hyperparameters: learning rate, number of estimators, maximum depth, minimum child weight, and subsampling rate, aiming to create the best-performing hybrid model [39,40,41]. The optimized hyperparameter values are presented in Table 1. Learning rate governs the step size during each iteration towards the minimum of the loss function. A lower learning rate enhances algorithm stability. The number of estimators determines the quantity of decision trees, and opting for a larger value can improve model accuracy. However, it is important to note that excessively increasing the number of estimators can lead to overfitting. Maximum depth is a parameter used to prevent overfitting, but a too-high value of maximum depth can cause overfitting as well. Minimum depth controls the minimum sum of child node weights. The subsampling rate is employed to specify the fraction of data randomly sampled for constructing the training dataset, which can expedite training and address overfitting issues. A five-fold cross validation was conducted to prevent overfitting when selecting hyperparameters.

Table 1.
Values of the optimized hyperparameters in the XGBoost algorithm.
2.2. Sobol Method
The Sobol method is widely employed in sensitivity analyses, as it can elucidate the individual impacts of each random variable or group of random variables on the system response variance.
The unconditional variance can be decomposed into partial variances accordingly, where and represent the variances of and respectively:
Using these partial variances, the first-order and total Sobol sensitivity indices can be defined on the basis of the total variance:
The first-order index indicates that the fraction of the output variance is reduced on average by fixing within its range. The total sensitivity index, , encompasses the contributions of the first-order index and the comprehensive effects of all higher-order interaction terms. The difference between and can reflect the importance of the interactions of this parameter with other parameters.
2.3. Establishment of the Operational Tunnel Model
This study was conducted in the context of an engineering project pertaining to the downstream portion segment of the No.1 auxiliary tunnel at Liujia Village, situated in the Chuxiong section of the Central Yunnan Water Diversion Project (CYWDP). As is shown in Figure 3a, the CYWDP is a large (I)-type project in China, characterized by its extensive water diversion scope, long tunnel route, and complex geological conditions. Figure 3b shows the surrounding rock of the working face, which is composed of mudstone and exhibits profusion of fractures within the rock mass. The rock mass displays prominent fissures, and the adjacent strata are notably saturated by moisture. In summary, the overall quality of the surrounding rock is deemed suboptimal.
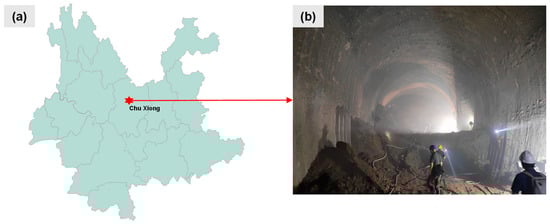
Figure 3.
Location of CYWDP. (a) Location of Chuxiong in Yunnan province; (b) condition of the work face in the RBSR tunnel.
The objective of establishing a finite element model is to clarify the construction process of a tunnel. The FLAC3D program was employed to perform numerical simulation on the tunnel operation. As shown in Figure 4a, the computational model extends in the x and z directions until 10 times the tunnel’s diameter, considering the influence of boundary effects. The tunnel excavation direction, denoted the y-direction, spanned a length of 20 m [42]. The simulation of the tunnel’s surrounding rock and lining was accomplished using zone elements, while cable elements were utilized to represent anchor bolts. In addition, the shell elements were employed to simulate the initial support of shotcrete, as shown in Figure 4b. The analysis is based on geological conditions and the buried depth of the tunnel in the No. 2 branch tunnel of the Liujia Village Tunnel in the Chuxiong Section of the Central Yunnan Water Diversion Project. The surrounding rock near five monitoring sections, including CX22 + 710, was used as the research object to conduct inversion analysis. The depth of this tunnel section is 300 m on average.

Figure 4.
Numerical model in FLAC3D. (a) Dimensions and grid partition of model; (b) primary support and lining; (c) layout of monitoring points.
In terms of constitutive models, the Mohr–Coulomb model was applied to describe the behavior of the rock mass, while a plastic model was employed for both concrete and anchor bolts. The model included a total of 92,003 grids and 17,413 nodes. Based on the practical monitoring locations in the operating tunnel operation, monitoring points were positioned in the corresponding places in the model, as shown in Figure 4c, so that arch crown (A), shoulder (B–C) and waist (D–E) convergence could be recorded.
3. Parameter Sensitivity Analysis Based on Orthogonal Design
3.1. Orthogonal Design of Calculation Scheme
The orthogonal experiment is a methodology based on orthogonality, which involves selecting several representative experiments from a comprehensive set of trials. This approach is used to determine the sensitivity of various factors by analyzing the experimental results. The notation represents an orthogonal array with factors and levels. Here, stands for the number of designed experiments, which is typically much less than the total number of comprehensive experiments denoted by . In the safety and stability analysis of large underground chambers, in addition to the rock’s inherent strength parameters, the presence of groundwater imposes external hydrostatic pressure on the tunnel overburden. Furthermore, the surrounding rock, due to prolonged immersion in groundwater, remains in a fully saturated state. Thus, both environmental factors and rock parameters are considered. The depth of the tunnel and water pressure are chosen as environmental factors. The elastic modulus, Poisson ratio, cohesion, internal friction angle, and saturated density are chosen as rock parameters. Benchmark values for the physical properties of the rock mass are determined based on engineering geological data; the reference mean for the sensitivity analysis of influencing factors is presented in Table 2.
Table 2.
Reference mean for sensitivity analysis of influencing factors.
The variation of influencing factors within a ±20% range is studied. The mean value listed in Table 2 is set as a reference value, as shown in Table 3. It is assumed that these parameters follow a uniform distribution, and the construction process remains constant. This approach significantly enhances model accuracy while reducing model complexity and minimizing the workload associated with data analysis.
Table 3.
Orthogonal computational samples for sensitivity analysis.
3.2. Analysis of Calculation Results
Crown displacement, shoulder displacement, and waist displacement were identified as key tunnel assessment indicators per the actual construction’s monitoring scheme. Maximum principal stress is essential for evaluating potential structural damage, whereas minimum principal stress is crucial for assessing tunnel stability. Both stresses are thus selected as primary assessment indicators. Additionally, the extent of the plastic zone, indicative of rock’s permanent deformation and mechanical properties, is also incorporated into the evaluation criteria.
Figure 5 illustrates variations in response simulation results for monitoring points in the tunnel section under different input parameter conditions. Based on response time–history curves for various conditions, it can be observed that for vertical displacement, significant variations are evident within the ranges of sample numbers 2–9, 18–25, 26–33, and 50–57. This suggests that changes in input sensitivity parameters within these four sample number ranges have a substantial impact on the response of the tunnel. Similarly, for horizontal displacement, pronounced response variations are observed in sample numbers 2–9, 26–33, 42–49, and 50–57, indicating a notable influence of changes in input sensitivity parameters within these four sample number ranges on the response of the tunnel. In the case of maximum and minimum principal stresses, conspicuous response variations are found within the sample number ranges of 2–9, 18–25, 26–33, and 50–57, highlighting the significant impact of changes in input sensitivity parameters within these four sample number ranges on the response of the tunnel.
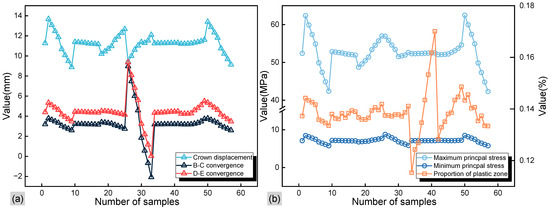
Figure 5.
Calculation results. (a) Crown displacement, B–C convergence, and D–E convergence; (b) maximum principal stress, minimum principal stress, and proportion of plastic zone.
The regression prediction performance of PSO-XGBoost mentioned in Section 2.1.3 and XGBoost in Section 2.1.2 for the five output values in this case study is depicted in Figure 6. It is evident that PSO-XGBoost exhibits a favorable predictive performance for the outputs, demonstrating excellent predictive capabilities. This makes it a suitable foundation for sensitivity analysis. The model verification process employed a common technique, R-squared (), which could be expressed as follows:
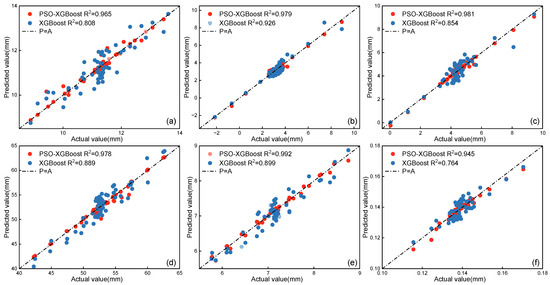
Figure 6.
Regression prediction performance of PSO-XGBoost and XGBoost. (a) Crown displacement; (b) B–C convergence; (c) D–E convergence; (d) maximum principal stress; (e) minimum principal stress; (f) proportion of plastic zone.
3.3. Sensitivity Analysis Results of the Sobol Method
Figure 7 illustrates the first-order sensitivity indices and the global sensitivity indices for the input parameters across six output metrics, using Equations (9) and (10) introduced in Section 2.2, as well as the sum of sensitivities of individual sensitive parameters affecting the parameters in different output responses. It is evident that when using crown displacement, convergence around the tunnel, maximum/minimum principal stress, and the proportion of the plastic zone as output variables for sensitivity analysis, the specific rankings of the seven input factors vary across different output indicators from the perspective of significance analysis.
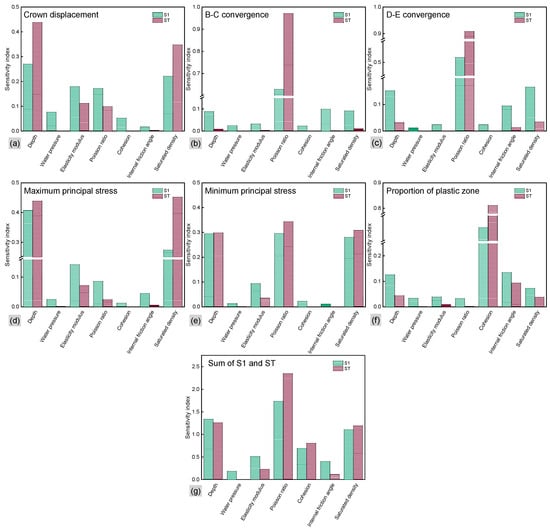
Figure 7.
S1 and ST of seven factors. (a) Crown displacement; (b) B–C convergence; (c) D–E convergence; (d) maximum principal stress; (e) minimum principal stress; (f) proportion of plastic zone; (g) sum of S1 and ST.
For the crown displacement, the four most sensitive factors in descending order are burial depth, saturation density, elastic modulus, and Poisson ratio. In terms of the B–C/D–E convergence, the four factors with the highest sensitivity indices are Poisson ratio, cohesion, internal friction angle, and burial depth. Regarding the maximum/minimum principal stresses, the four most sensitive factors are burial depth, saturation density, elastic modulus, and Poisson ratio. As for the proportion of the plastic zone, the four factors with the highest sensitivity indices are cohesion, internal friction angle, burial depth, and Poisson ratio. From the perspective of factors with minimal influence, various output models consistently exhibit factors of relative insignificance. For instance, external hydrostatic pressure and Poisson ratio have a negligible effect on the evolution of plastic zones, and the internal friction angle has a minimal impact on the settlement of arch crowns.
Comparative analysis of S1 and ST reveals that the interaction among various input parameters exerts differential impacts on distinct factors. In general, burial depth, Poisson ratio, and saturation density significantly influence the response of cavern displacement, which is particularly evident in their impact on tensile and compressive stress within the cavern. In terms of displacement effects, burial depth, elastic modulus, and saturation density primarily affect the cavern’s vertical displacement characteristics, while the Poisson ratio predominantly influences its horizontal displacement traits. Cohesive force is identified as the principal factor affecting the proportion of the plastic zone. The influence patterns of S1 and ST are consistent. These conclusions are consistent with those of previous studies [43]. Specifically, the interplay between factors has the most pronounced effect on the elasticity modulus, Poisson ratio, and internal friction angle. Therefore, selecting the mechanical parameters of rocks for parameter inversion simplifies the inversion analysis process and ensures the accuracy of the results.
4. Inversion and Verification of Mechanical Parameters
4.1. Acquisition of Dataset
In this paper, the results of the sensitivity analysis are employed to understand the impact weight of environmental factors and rock mass parameters on various evaluation indices of the tunnel, as well as the comprehensive impact weight. In the inversion study, the environmental factors of the research tunnel section are determined, and the basis for inversion relies on displacement monitoring data. The mechanical parameters of the rock mass are key in reflecting displacement changes. Therefore, elasticity modulus, Poisson ratio, cohesion, and internal friction angle were selected as the parameters for inversion. Based on the geological data of CX22 section in the RBSR tunnel, the essential mechanical properties of the surrounding rock in the study area were selected. Such a selection of training samples aligned with the specified range of pivotal mechanical properties of the rock surrounding the tunnel (detailed in Table 4). From Table 4, E varies between 0.5 and 5 GPa, while μ varies from 0.27 to 0.35. c, and φ values vary from 0.1 to 0.7 MPa and 22° to 33°, respectively.
Table 4.
Input parameters involved in the inversion of the operational tunnel.
In this study, we employed the Latin Hypercube Sampling (LHS) method to generate a set of 1000 samples within the range of parameters [44,45]. Figure 8 illustrates the distribution of samples, demonstrating a comprehensive coverage within the defined range. Moreover, the average values of the 1000 samples for each parameter were close to the specified range’s mean values (elasticity modulus: 2.743 GPa, Poisson ratio: 0.31, cohesion: 0.4 MPa, and internal friction angle: 27.5°). Consequently, it is evident that the outcomes of this sampling method can serve as a foundation for the establishment of a metamodel.
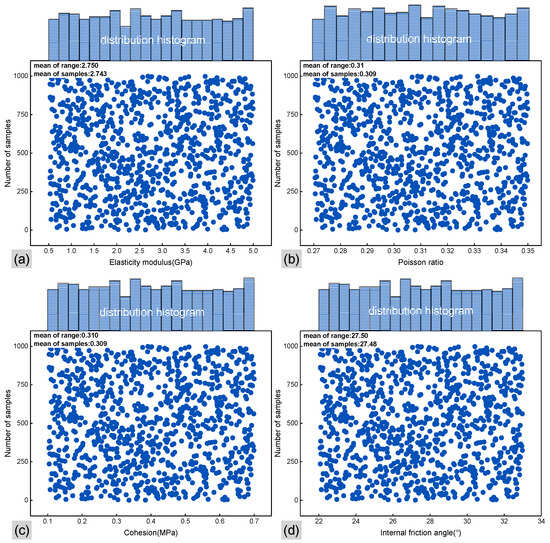
Figure 8.
Scatter plots and distribution histogram of 1000 samples for each parameter using the LHS method. (a) Elasticity modulus; (b) Poisson ratio; (c) cohesion; (d) internal friction angle.
A total of 1000 parameter samples were sequentially put into the finite element model to calculate the displacement of the surrounding rock at five monitoring points. The data were subsequently summarized. Figure 9 shows the results of numerical simulation for 1000 samples. It is evident that the vast majority of results in the output samples fall within the range of 2 to 30 mm.
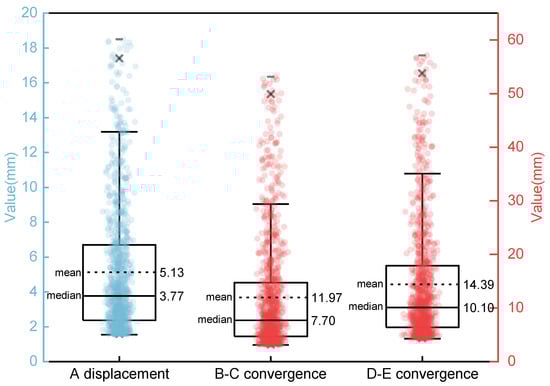
Figure 9.
The crown displacement, B–C convergence, and D–E convergence data generated by the FEM calculation.
4.2. Verification of Inversion Model
The 1000 parameter samples are divided into two groups. Some 800 samples were chosen for training the metamodel, and the remaining 200 samples were reserved for testing and inversion. A comparative evaluation between the XGBoost and PSO-XGBoost inversion results was undertaken. Figure 10 presents the outcomes of both models, highlighting a significant contrast in the performance across four input parameters in the testing set. Equation (11) and mean squared error () were employed to evaluate the outcomes, which could be expressed as follows:

Figure 10.
Predicted performance of inversed parameters in the testing set. (a) elasticity modulus (E); (b) Poisson ratio (μ); (c) cohesion (c); (d) internal friction angle (φ).
Figure 10a reveals that the attained in elasticity modulus (E) amounts to 0.162, with a corresponding value of 0.835. However, an entirely different outcome emerged when employing the XGBoost model for the same inversion task. In this case, the was substantially reduced to a value of merely 0.033, while the value increased significantly to 0.955. The same trends were observed in the inversion results for Poisson ratio (μ), cohesion (c), and internal friction angle (φ), as shown in Figure 10b–d. The values for the XGBoost inversion model were found to be 4.19 × 10⁻⁵, 0.0027, and 0.796, while the corresponding R2 values were 0.806, 0.735, and 0.821 respectively. In contrast, the PSO-XGBoost inversion model exhibited improved performance, with values reduced to 9.67 × 10⁻⁶, 6.61 × 10⁻⁴, and 0.184. Meanwhile, the R2 values significantly enhanced to 0.943, 0.934, and 0.948. Therefore, the results indicate that the PSO-XGBoost model demonstrates superior precision in the parameter inversion of the surrounding rock mass in RBSR tunnel operation.
4.3. Verification of Parameter Inversion
To further access the reliability of PSO-XGBoost inversion model, actual monitoring data from the downstream portion segment of the No.1 auxiliary tunnel at Liujia Village, Chuxiong Section, was employed as the focal point of investigation. The monitoring points, namely CX22 + 630, CX22 + 670, CX22 + 710, CX22 + 750, and CX22 + 790, were selected for inversion. The depth of these five monitoring points is 273 m, 271 m, 27 0m, 272 m, and 273 m, respectively. The results of the inversed parameters are listed in Table 5.
Table 5.
Inversion results of inversed parameters.
Subsequently, we brought the inversed parameters into the FEM calculation to obtain the simulated values when tunnel operation became stable. A comparative analysis was performed between computed results and actual monitoring data. Figure 11 illustrates the error range of the monitoring data variation (15%). Figure 11a indicates an average error of 9.52% between the monitoring data and the computed results in crown displacement. Similarly, discrepancies of 6.28% and 8.68% in B–C convergence and D–E convergence exist, as shown in Figure 11b,c are within the project’s allowable error range [46]. The full results revealed an acceptable error interval, as was specified in the engineering scale. The findings further indicated that the parameter inversion model based on the PSO-XGBoost algorithm demonstrates a commendable level of reliability, and can also serve as a valuable reference for the recognition of surrounding rock mass properties under tunnel operation.

Figure 11.
Results and comparation between computed results and monitoring data. (a) A crown displacement; (b) B–C convergence; (c) D–E convergence.
5. Conclusions and Future Work
The rock mass parameters obtained from either laboratory examinations or on-site investigations prove insufficient in representing the dynamic variations in these parameters under the influence of complex coexistent geological conditions during practical operational phases. It is necessary to propose an effective approach for the inversion of parameters based on the displacement data from monitoring points. In this study, a PSO-XGBoost inversion model was developed to conduct sensitivity analysis and inversion of the surrounding rock parameters of the Chuxiong section in the Central Yunnan Water Diversion project. The findings can be concluded as follows.
- (1)
- The PSO algorithm was employed to optimize the hyperparameters of the XGBoost algorithm for parameter inversion. The outcomes of the inversion process revealed that the PSO-XGBoost model achieved an exceptional accuracy, exceeding 90% in the estimation of parameters.
- (2)
- The employment of the Sobol method for global sensitivity analysis provided deep insights into the influence of various environmental and rock mass parameters on tunnel behavior. The parameter inversion process primarily focuses on rock mechanical parameters, including the elasticity modulus, Poisson ratio, cohesion, and internal friction angle.
- (3)
- The inversion process, informed by a Latin Hypercube Sampling (LHS) approach and 1000 parameter samples integrated into FLAC3D simulations, yielded highly accurate predictions. The confirmation of the PSO-XGBoost model’s precision through cross-sectional monitoring data, with a less than 15% relative error, solidifies its value as a reliable tool in the engineering analysis and construction of soft rock tunnels.
This study focuses on the sensitivity and inversion of rock parameters in tunnel engineering, underscoring the importance of acknowledging variational parameters’ origins and the multifaceted environment impacting hydraulic tunnel operations. It underscores the necessity of assessing the interplay among environmental factors, rock materials, and tunnel safety. Crucially, accurately predicting tunnel operation displacement is vital for effective safety management. In real-world engineering, given complex geological conditions, parameters often exhibit interdependencies rather than being entirely independent. Thus, future research will increasingly prioritize sensitivity analysis and parameter inversion, taking into account their interrelationships.
Author Contributions
Conceptualization, Y.W. and H.W.; methodology, Y.W. and X.G.; validation, H.W.; formal analysis, Y.W.; resources, H.W.; data curation, Y.W. and X.G.; writing—original draft preparation, Y.W. and H.W.; writing—review and editing, Y.W. and H.W.; supervision, H.W. All authors have read and agreed to the published version of the manuscript.
Funding
This research was funded by the Key Science and Technology Special Program of Yunnan Province (grant number: 202102AF080001).
Institutional Review Board Statement
Not applicable.
Informed Consent Statement
Not applicable.
Data Availability Statement
The original contributions presented in the study are included in the article. Further inquiries can be directed to the corresponding author.
Acknowledgments
The authors would like to thank Yunnan Dianzhong Water Diversion Engineering Co., Ltd., Kunming 650000 for providing relevant field monitoring data for the study.
Conflicts of Interest
The authors declare no conflict of interest.
References
- Jia, J. A Technical Review of Hydro-Project Development in China. Engineering 2016, 2, 302–312. [Google Scholar] [CrossRef]
- Özsan, A.; Başarır, H. Support Capacity Estimation of a Diversion Tunnel in Weak Rock. Eng. Geol. 2003, 68, 319–331. [Google Scholar] [CrossRef]
- Shahin, H.; Nakai, T.; Ishii, K.; Iwata, T.; Kuroi, S. Investigation of Influence of Tunneling on Existing Building and Tunnel: Model Tests and Numerical Simulations. Acta Geotech. 2016, 11, 679–692. [Google Scholar] [CrossRef]
- Yang, S.-Q.; Chen, M.; Jing, H.-W.; Chen, K.-F.; Meng, B. A Case Study on Large Deformation Failure Mechanism of Deep Soft Rock Roadway in Xin’An Coal Mine, China. Eng. Geol. 2017, 217, 89–101. [Google Scholar] [CrossRef]
- Zhao, C.; Gong, W.; Li, T.; Juang, C.H.; Tang, H.; Wang, H. Probabilistic Characterization of Subsurface Stratigraphic Configuration with Modified Random Field Approach. Eng. Geol. 2021, 288, 106138. [Google Scholar] [CrossRef]
- Zhang, W.; Zhao, Q.; Huang, R.; Chen, J.; Xue, Y.; Xu, P. Identification of Structural Domains Considering the Size Effect of Rock Mass Discontinuities: A Case Study of an Underground Excavation in Baihetan Dam, China. Tunn. Undergr. Space Technol. 2016, 51, 75–83. [Google Scholar] [CrossRef]
- Li, H.; Chen, W.; Tan, X.; Tan, X. Back Analysis of Geomechanical Parameters for Rock Mass under Complex Geological Conditions Using a Novel Algorithm. Tunn. Undergr. Space Technol. 2023, 136, 105099. [Google Scholar] [CrossRef]
- Wang, X.; Zhao, Y.; Lin, X. Determination of Mechanical Parameters for Jointed Rock Masses. J. Rock Mech. Geotech. Eng. 2011, 3, 398–406. [Google Scholar]
- Liu, J.; Qi, T.; Wu, Z. Analysis of Ground Movement Due to Metro Station Driven with Enlarging Shield Tunnels under Building and Its Parameter Sensitivity Analysis. Tunn. Undergr. Space Technol. 2012, 28, 287–296. [Google Scholar] [CrossRef]
- Ma, C.; Li, X.; Wang, S. A Global Sensitivity Analysis of Soil Parameters Associated with Backscattering Using the Advanced Integral Equation Model. IEEE Trans. Geosci. Remote Sens. 2015, 53, 5613–5623. [Google Scholar] [CrossRef]
- Brown, S.; Beck, J.; Mahgerefteh, H.; Fraga, E.S. Global Sensitivity Analysis of the Impact of Impurities on CO2 Pipeline Failure. Reliab. Eng. Syst. Saf. 2013, 115, 43–54. [Google Scholar] [CrossRef]
- Liu, W.; Ding, L. Global Sensitivity Analysis of Influential Parameters for Excavation Stability of Metro Tunnel. Autom. Constr. 2020, 113, 103080. [Google Scholar] [CrossRef]
- Vezzaro, L.; Mikkelsen, P.S. Application of Global Sensitivity Analysis and Uncertainty Quantification in Dynamic Modelling of Micropollutants in Stormwater Runoff. Environ. Modell. Softw. 2012, 27–28, 40–51. [Google Scholar] [CrossRef]
- Kim, H.-M.; Park, D.; Ryu, D.-W.; Song, W.-K. Parametric Sensitivity Analysis of Ground Uplift above Pressurized Underground Rock Caverns. Eng. Geol. 2012, 135–136, 60–65. [Google Scholar] [CrossRef]
- Gevrey, M.; Dimopoulos, I.; Lek, S. Two-Way Interaction of Input Variables in the Sensitivity Analysis of Neural Network Models. Ecol. Model. 2006, 195, 43–50. [Google Scholar] [CrossRef]
- Zhang, P. A Novel Feature Selection Method Based on Global Sensitivity Analysis with Application in Machine Learning-Based Prediction Model. Appl. Soft Comput. 2019, 85, 105859. [Google Scholar] [CrossRef]
- Gioda, G.; Maier, G. Direct Search Solution of an Inverse Problem in Elastoplasticity: Identification of Cohesion, Friction Angle Andin Situ Stress by Pressure Tunnel Tests. Int. J. Numer. Meth. Eng. 1980, 15, 1823–1848. [Google Scholar] [CrossRef]
- Sakurai, S. Back Analysis of Measured Displacements of Tunnels. Rock Mech. Rock Eng. 1983, 16, 173–180. [Google Scholar] [CrossRef]
- Song, Z.; Yang, Z.; Huo, R.; Zhang, Y. Inversion Analysis Method for Tunnel and Underground Space Engineering: A Short Review. Appl. Sci. 2023, 13, 5454. [Google Scholar] [CrossRef]
- Li, C.; Hou, S.; Liu, Y.; Qin, P.; Jin, F.; Yang, Q. Analysis on the Crown Convergence Deformation of Surrounding Rock for Double-Shield TBM Tunnel Based on Advance Borehole Monitoring and Inversion Analysis. Tunn. Undergr. Space Technol. 2020, 103, 103513. [Google Scholar] [CrossRef]
- Zhang, Q.; Li, R.; Yuan, H.; Zhong, H. Vertical Displacement Measurement of Tunnel Structures Based on Long-Gauge Fiber Bragg Grating Strain Sensing. Appl. Sci. 2023, 13, 11496. [Google Scholar] [CrossRef]
- Tan, Y.; Chen, B.; Liu, Z. Study on Large Deformation Characteristics and Secondary Lining Supporting Time of Tunnels in Carbonaceous Schist Stratum under High Geo-Stress. Sustainability 2023, 15, 14278. [Google Scholar] [CrossRef]
- Tyrer, J.; Paraskevopoulou, C.; Shah, R.; Miller, R.; Kavvadas, M. Tunnelling with Full-Face Shielded Machines: A 3D Numerical Analysis of an Earth Pressure Balance (EPB) Excavation Sequence Using the Finite Element Method (FEM). Geosciences 2023, 13, 244. [Google Scholar] [CrossRef]
- Liu, B.; Shao, C.; Xu, W. Influenced Zone of Deep Excavation on Adjacent Tunnel Displacement and Control Effect of Ground Improvement in Soft Soil. Appl. Sci. 2022, 12, 9047. [Google Scholar] [CrossRef]
- Zheng, D.; Cheng, L.; Bao, T.; Lv, B. Integrated Parameter Inversion Analysis Method of a CFRD Based on Multi-Output Support Vector Machines and the Clonal Selection Algorithm. Comput. Geotech. 2013, 47, 68–77. [Google Scholar] [CrossRef]
- Jiang, S.; Wei, B.; Zhang, W.; Jiang, X.; Huang, J. Probabilistic back analysis of spatially varying soil properties and reliability updating of slopes with multiple sources of test data. Rock Soil Mech. 2018, 39, 1491–1499. [Google Scholar] [CrossRef]
- Xu, X.; Zhang, G.; Huang, W.; Chen, S.; Yan, L.; Xu, W. Engineering Safety Evaluation of the High Rock Slope of a Hydropower Project: A Case Study of 684 m-High Slope Related to Lianghekou Hydropower Project at Yalong River. Appl. Sci. 2023, 13, 1729. [Google Scholar] [CrossRef]
- Gao, W.; Chen, D.; Dai, S.; Wang, X. Back Analysis for Mechanical Parameters of Surrounding Rock for Underground Roadways Based on New Neural Network. Eng. Comput. 2018, 34, 25–36. [Google Scholar] [CrossRef]
- Goh, A.T.C.; Zhang, Y.; Zhang, R.; Zhang, W.; Xiao, Y. Evaluating Stability of Underground Entry-Type Excavations Using Multivariate Adaptive Regression Splines and Logistic Regression. Tunn. Undergr. Space Technol. 2017, 70, 148–154. [Google Scholar] [CrossRef]
- Zhuang, D.Y.; Ma, K.; Tang, C.A.; Liang, Z.Z.; Wang, K.K.; Wang, Z.W. Mechanical Parameter Inversion in Tunnel Engineering Using Support Vector Regression Optimized by Multi-Strategy Artificial Fish Swarm Algorithm. Tunn. Undergr. Space Technol. 2019, 83, 425–436. [Google Scholar] [CrossRef]
- Sun, P.; Bao, T.; Gu, C.; Jiang, M.; Wang, T.; Shi, Z. Parameter Sensitivity and Inversion Analysis of a Concrete Faced Rock-Fill Dam Based on HS-BPNN Algorithm. Sci. China Technol. Sci. 2016, 59, 1442–1451. [Google Scholar] [CrossRef]
- Zhan, T.; Guo, X.; Jiang, T.; Jiang, A. Intelligent Feedback Analysis of Fluid–Solid Coupling of Surrounding Rock of Tunnel in Water-Rich Areas. Appl. Sci. 2023, 13, 1479. [Google Scholar] [CrossRef]
- ASTM D4373-14; Standard Test Method for Rapid Determination of Carbonate Content of Soils. ASTM International: West Conshohocken, PA, USA, 2014.
- DZ/T 0276.9-2015; Regulation for Testing the Physical and Mechanical Properties of Rock-Part 9: Test for Determining the Slake Durability of Rock. China Standard Press: Beijing, China, 2015.
- Kennedy, J.; Eberhart, R. Particle Swarm Optimization. In Proceedings of the ICNN’95—International Conference on Neural Networks, Perth, WA, Australia, 27 November–1 December 1995; IEEE: Perth, WA, Australia, 1995; Volume 4, pp. 1942–1948. [Google Scholar] [CrossRef]
- Chen, T.; Guestrin, C. XGBoost: A Scalable Tree Boosting System. In Proceedings of the 22nd ACM SIGKDD International Conference on Knowledge Discovery and Data Mining, San Francisco, CA, USA, 13–17 August 2016; ACM: San Francisco, CA, USA, 2016; pp. 785–794. [Google Scholar] [CrossRef]
- Jiang, Y.; Wang, W.; Zou, L.; Cao, Y. Regional Landslide Susceptibility Assessment Based on Improved Semi-Supervised Clustering and Deep Learning. Acta Geotech. 2023. [Google Scholar] [CrossRef]
- Zhang, L.; Wu, X.; Zhu, H.; AbouRizk, S.M. Performing Global Uncertainty and Sensitivity Analysis from Given Data in Tunnel Construction. J. Comput. Civ. Eng. 2017, 31, 04017065. [Google Scholar] [CrossRef]
- Cao, J.; Gao, J.; Nikafshan Rad, H.; Mohammed, A.S.; Hasanipanah, M.; Zhou, J. A Novel Systematic and Evolved Approach Based on XGBoost-Firefly Algorithm to Predict Young’s Modulus and Unconfined Compressive Strength of Rock. Eng. Comput. 2022, 38 (Suppl. S5), 3829–3845. [Google Scholar] [CrossRef]
- Li, Z.; Gong, W.; Zhang, L.; Wang, L. Multi-Objective Probabilistic Back Analysis for Selecting the Optimal Updating Strategy Based on Multi-Source Observations. Comput. Geotech. 2022, 151, 104959. [Google Scholar] [CrossRef]
- Zhou, J.; Qiu, Y.; Zhu, S.; Armaghani, D.J.; Khandelwal, M.; Mohamad, E.T. Estimation of the TBM Advance Rate under Hard Rock Conditions Using XGBoost and Bayesian Optimization. Undergr. Space 2021, 6, 506–515. [Google Scholar] [CrossRef]
- Sun, J.; Wu, S.; Wang, H.; Wang, T.; Geng, X.; Zhang, Y. Inversion of Surrounding Rock Mechanical Parameters in a Soft Rock Tunnel Based on a Hybrid Model EO-LightGBM. Rock Mech. Rock Eng. 2023, 56, 691–707. [Google Scholar] [CrossRef]
- Zhang, Y.; Su, G.; Liu, B.; Li, T. A Novel Displacement Back Analysis Method Considering the Displacement Loss for Underground Rock Mass Engineering. Tunn. Undergr. Space Technol. 2020, 95, 103141. [Google Scholar] [CrossRef]
- McKay, M.D.; Beckman, R.J.; Conover, W.J. Comparison of Three Methods for Selecting Values of Input Variables in the Analysis of Output from a Computer Code. Technometrics 1979, 21, 239–245. [Google Scholar] [CrossRef]
- Fang, Y.; Su, Y. On the Use of the Global Sensitivity Analysis in the Reliability-Based Design: Insights from a Tunnel Support Case. Comput. Geotech. 2020, 117, 103280. [Google Scholar] [CrossRef]
- Liu, W.; Wu, X.; Zhang, L.; Wang, Y.; Teng, J. Sensitivity Analysis of Structural Health Risk in Operational Tunnels. Autom. Constr. 2018, 94, 135–153. [Google Scholar] [CrossRef]
Disclaimer/Publisher’s Note: The statements, opinions and data contained in all publications are solely those of the individual author(s) and contributor(s) and not of MDPI and/or the editor(s). MDPI and/or the editor(s) disclaim responsibility for any injury to people or property resulting from any ideas, methods, instructions or products referred to in the content. |
© 2023 by the authors. Licensee MDPI, Basel, Switzerland. This article is an open access article distributed under the terms and conditions of the Creative Commons Attribution (CC BY) license (https://creativecommons.org/licenses/by/4.0/).