
Seismic Capacity of R/C Buildings Retrofitted with a V-Bracing System Equipped with a Novel Laterally Layered Friction Damper


Abstract
1. Introduction
- They increase the weight of a building. Thus, buildings with weak foundations, such as R/C buildings with non-seismic details, may require foundation reinforcement.
- Securing a workspace is difficult during seismic retrofitting, and the utilization of space is limited.
- In the case of the steel plate reinforcement method (one of the most commonly used methods), the weight of the steel plate makes transport and pressing work difficult. In particular, when steel plate pressing is applied to a damaged structure, it is impossible to confirm whether the adhesion between the parent material and the steel plate is sufficient. In some cases, heavy steel plates hang from the parent material, causing further problems.
- Accurate construction is required.
- Preparation is required for rough surface work.
- The reinforcement effect varies depending on the fiber direction (i.e., the anisotropy problem).
- Securing a workspace is difficult when construction is performed in a narrow space.
- Expensive materials.
- Applying ductile reinforcement to non-seismic detailed buildings with insufficient shear strength is inefficient.
2. Proposal and Overview of LLFD V-Bracing System
2.1. Problems with Conventional Friction Damper Seismic Retrofitting Methods
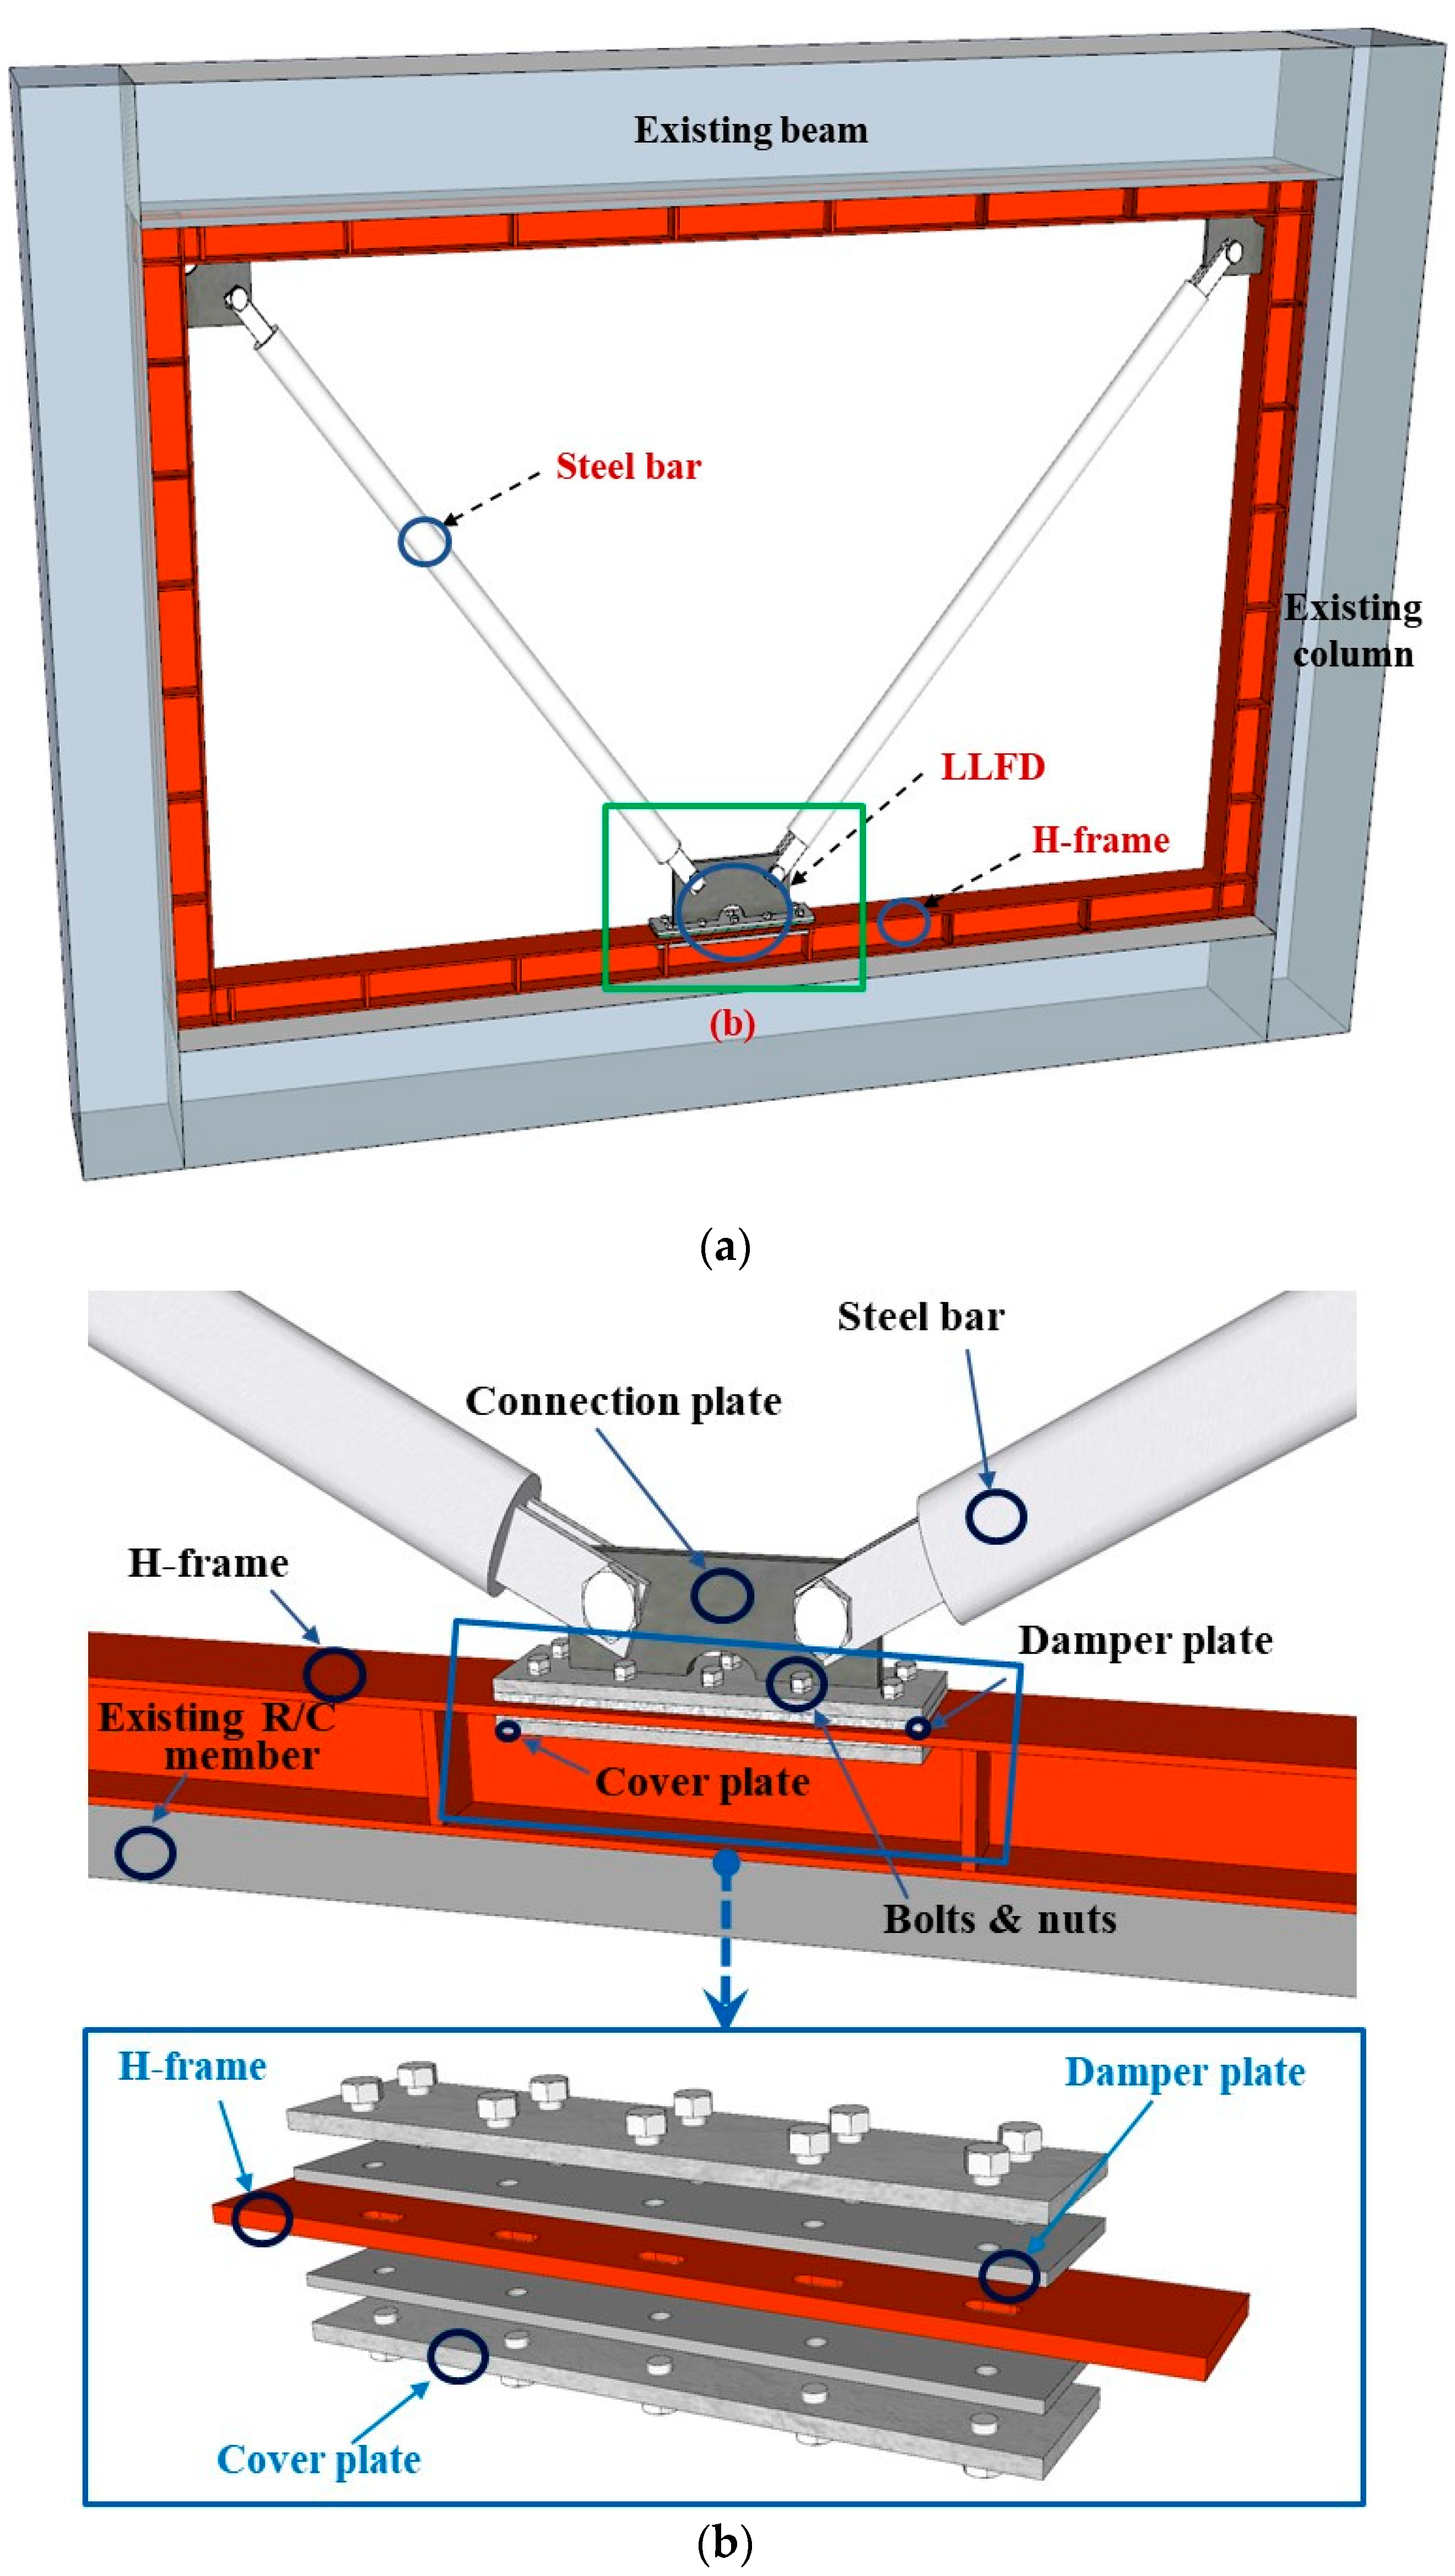
2.2. Components of the LLFD Method
3. Material Test and Results for LLFD
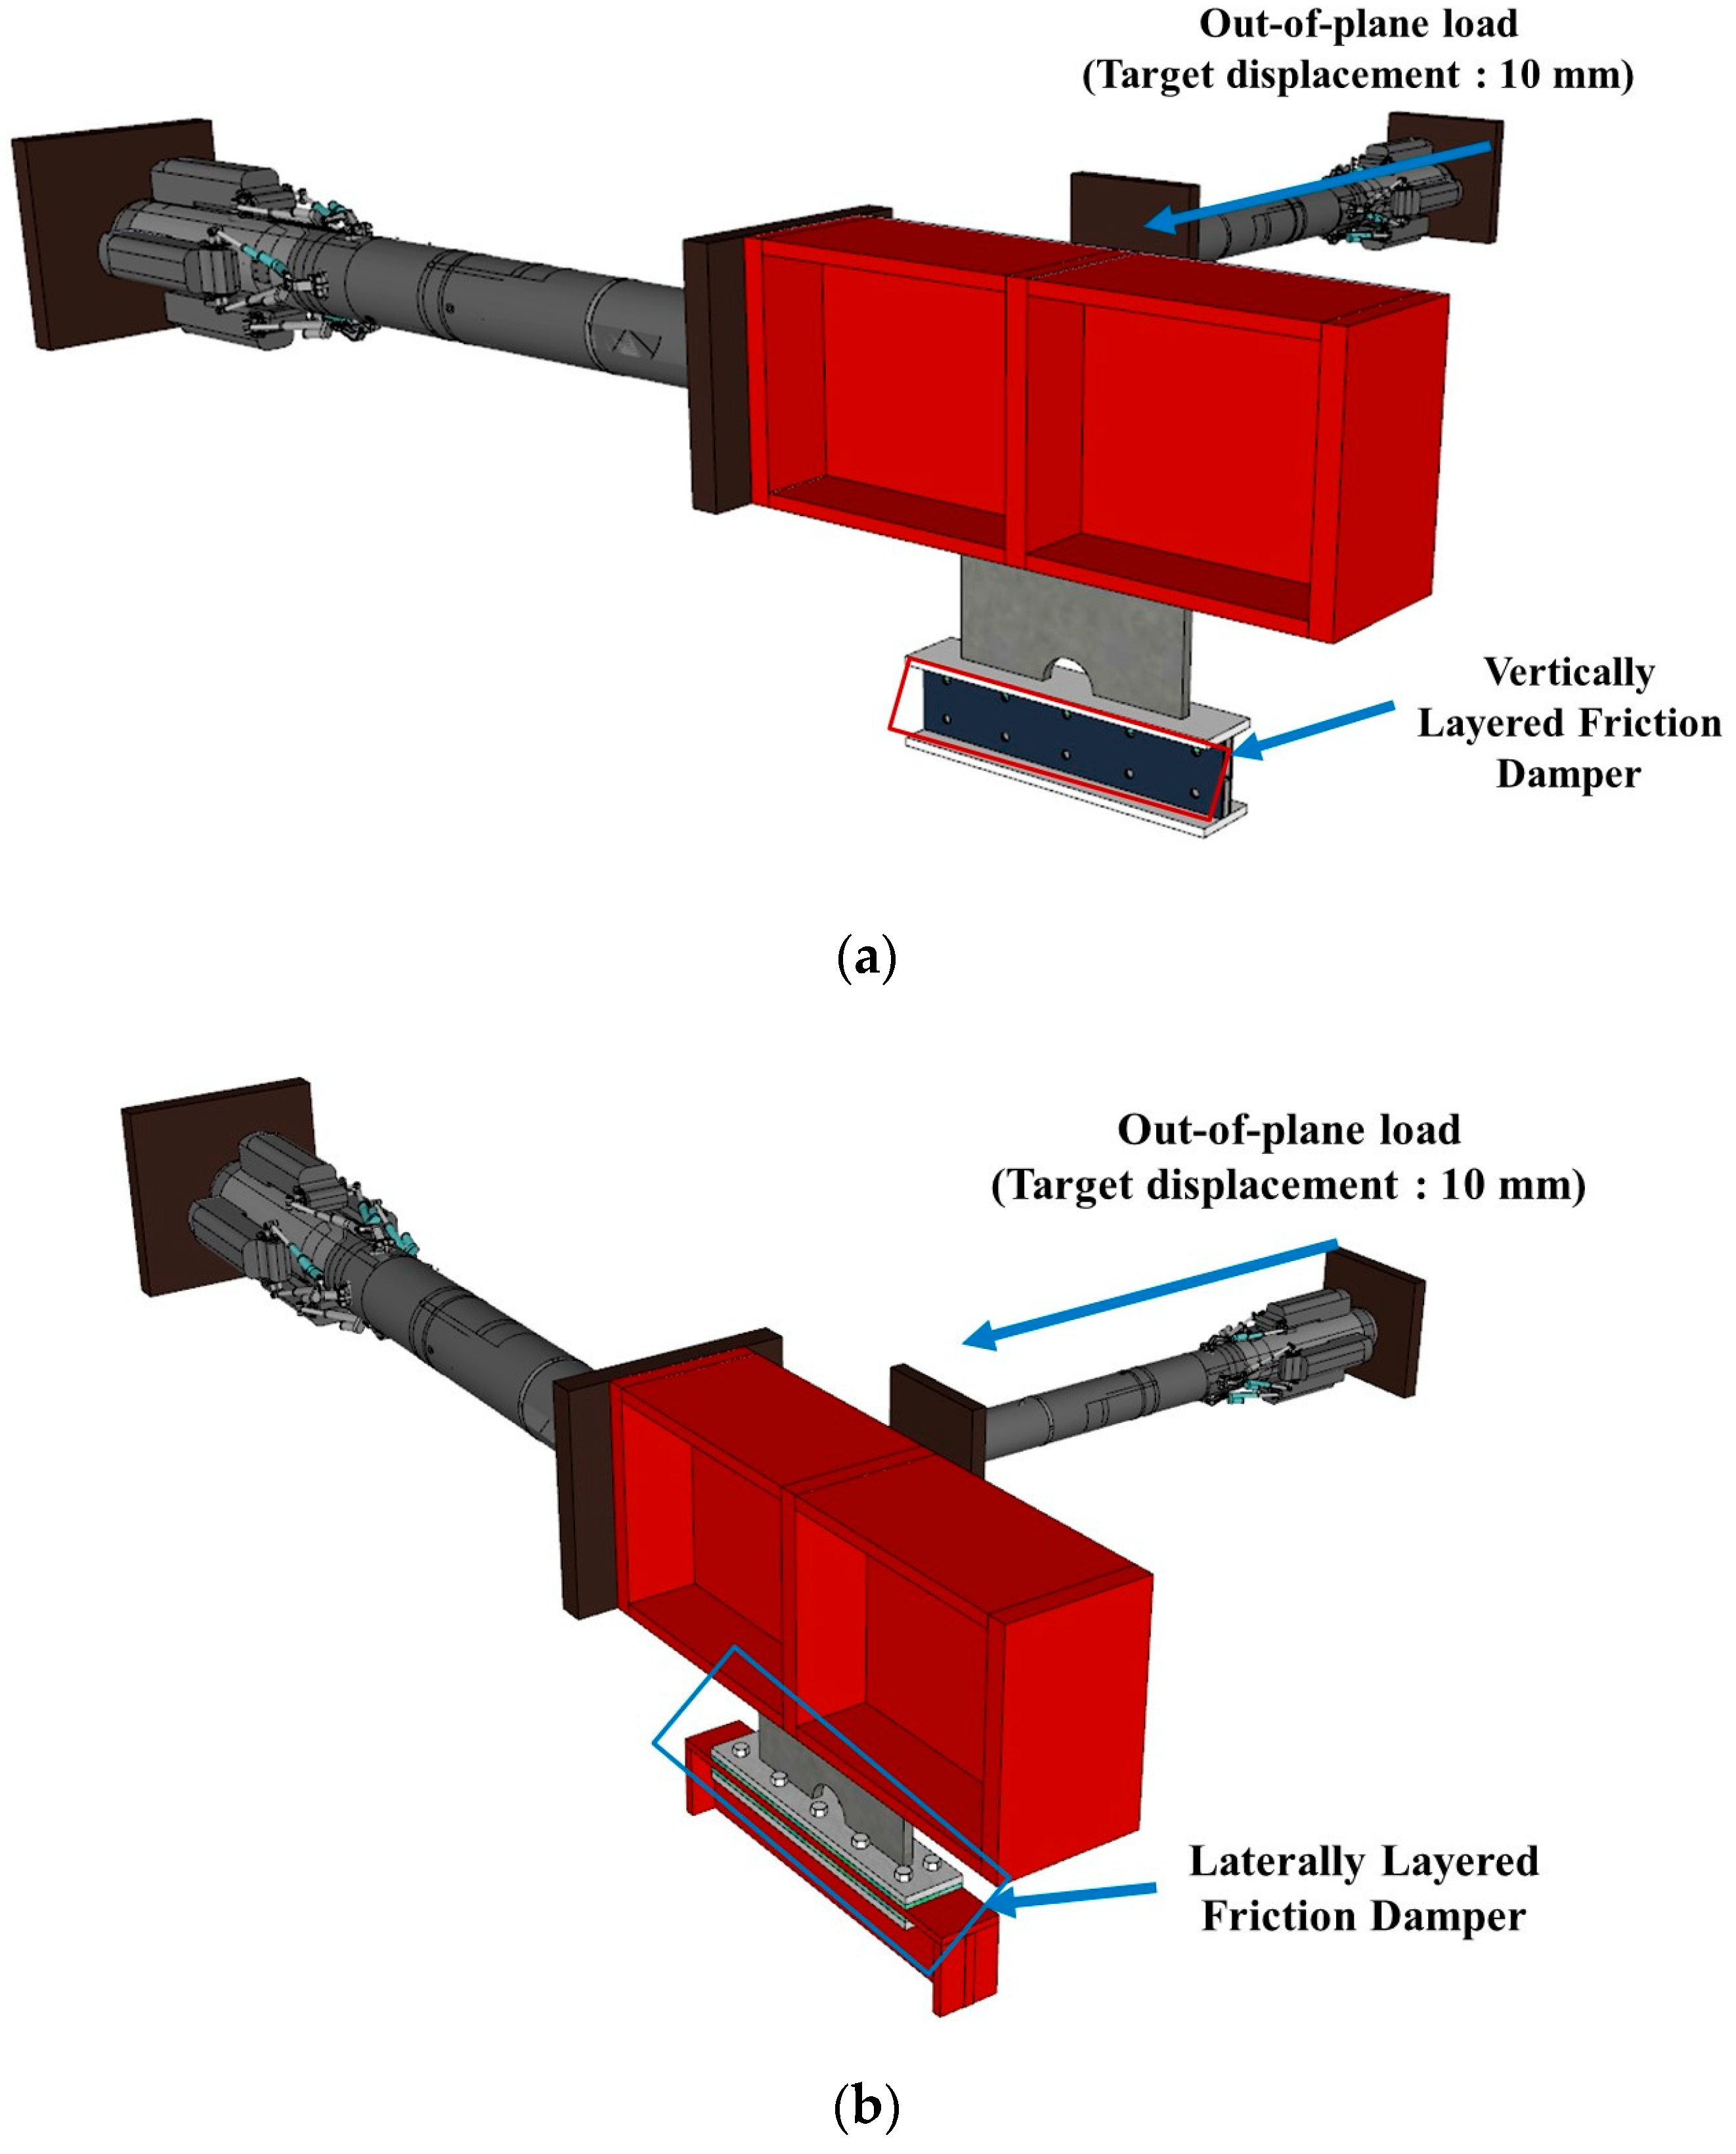
3.1. LLFD Material Test Plan
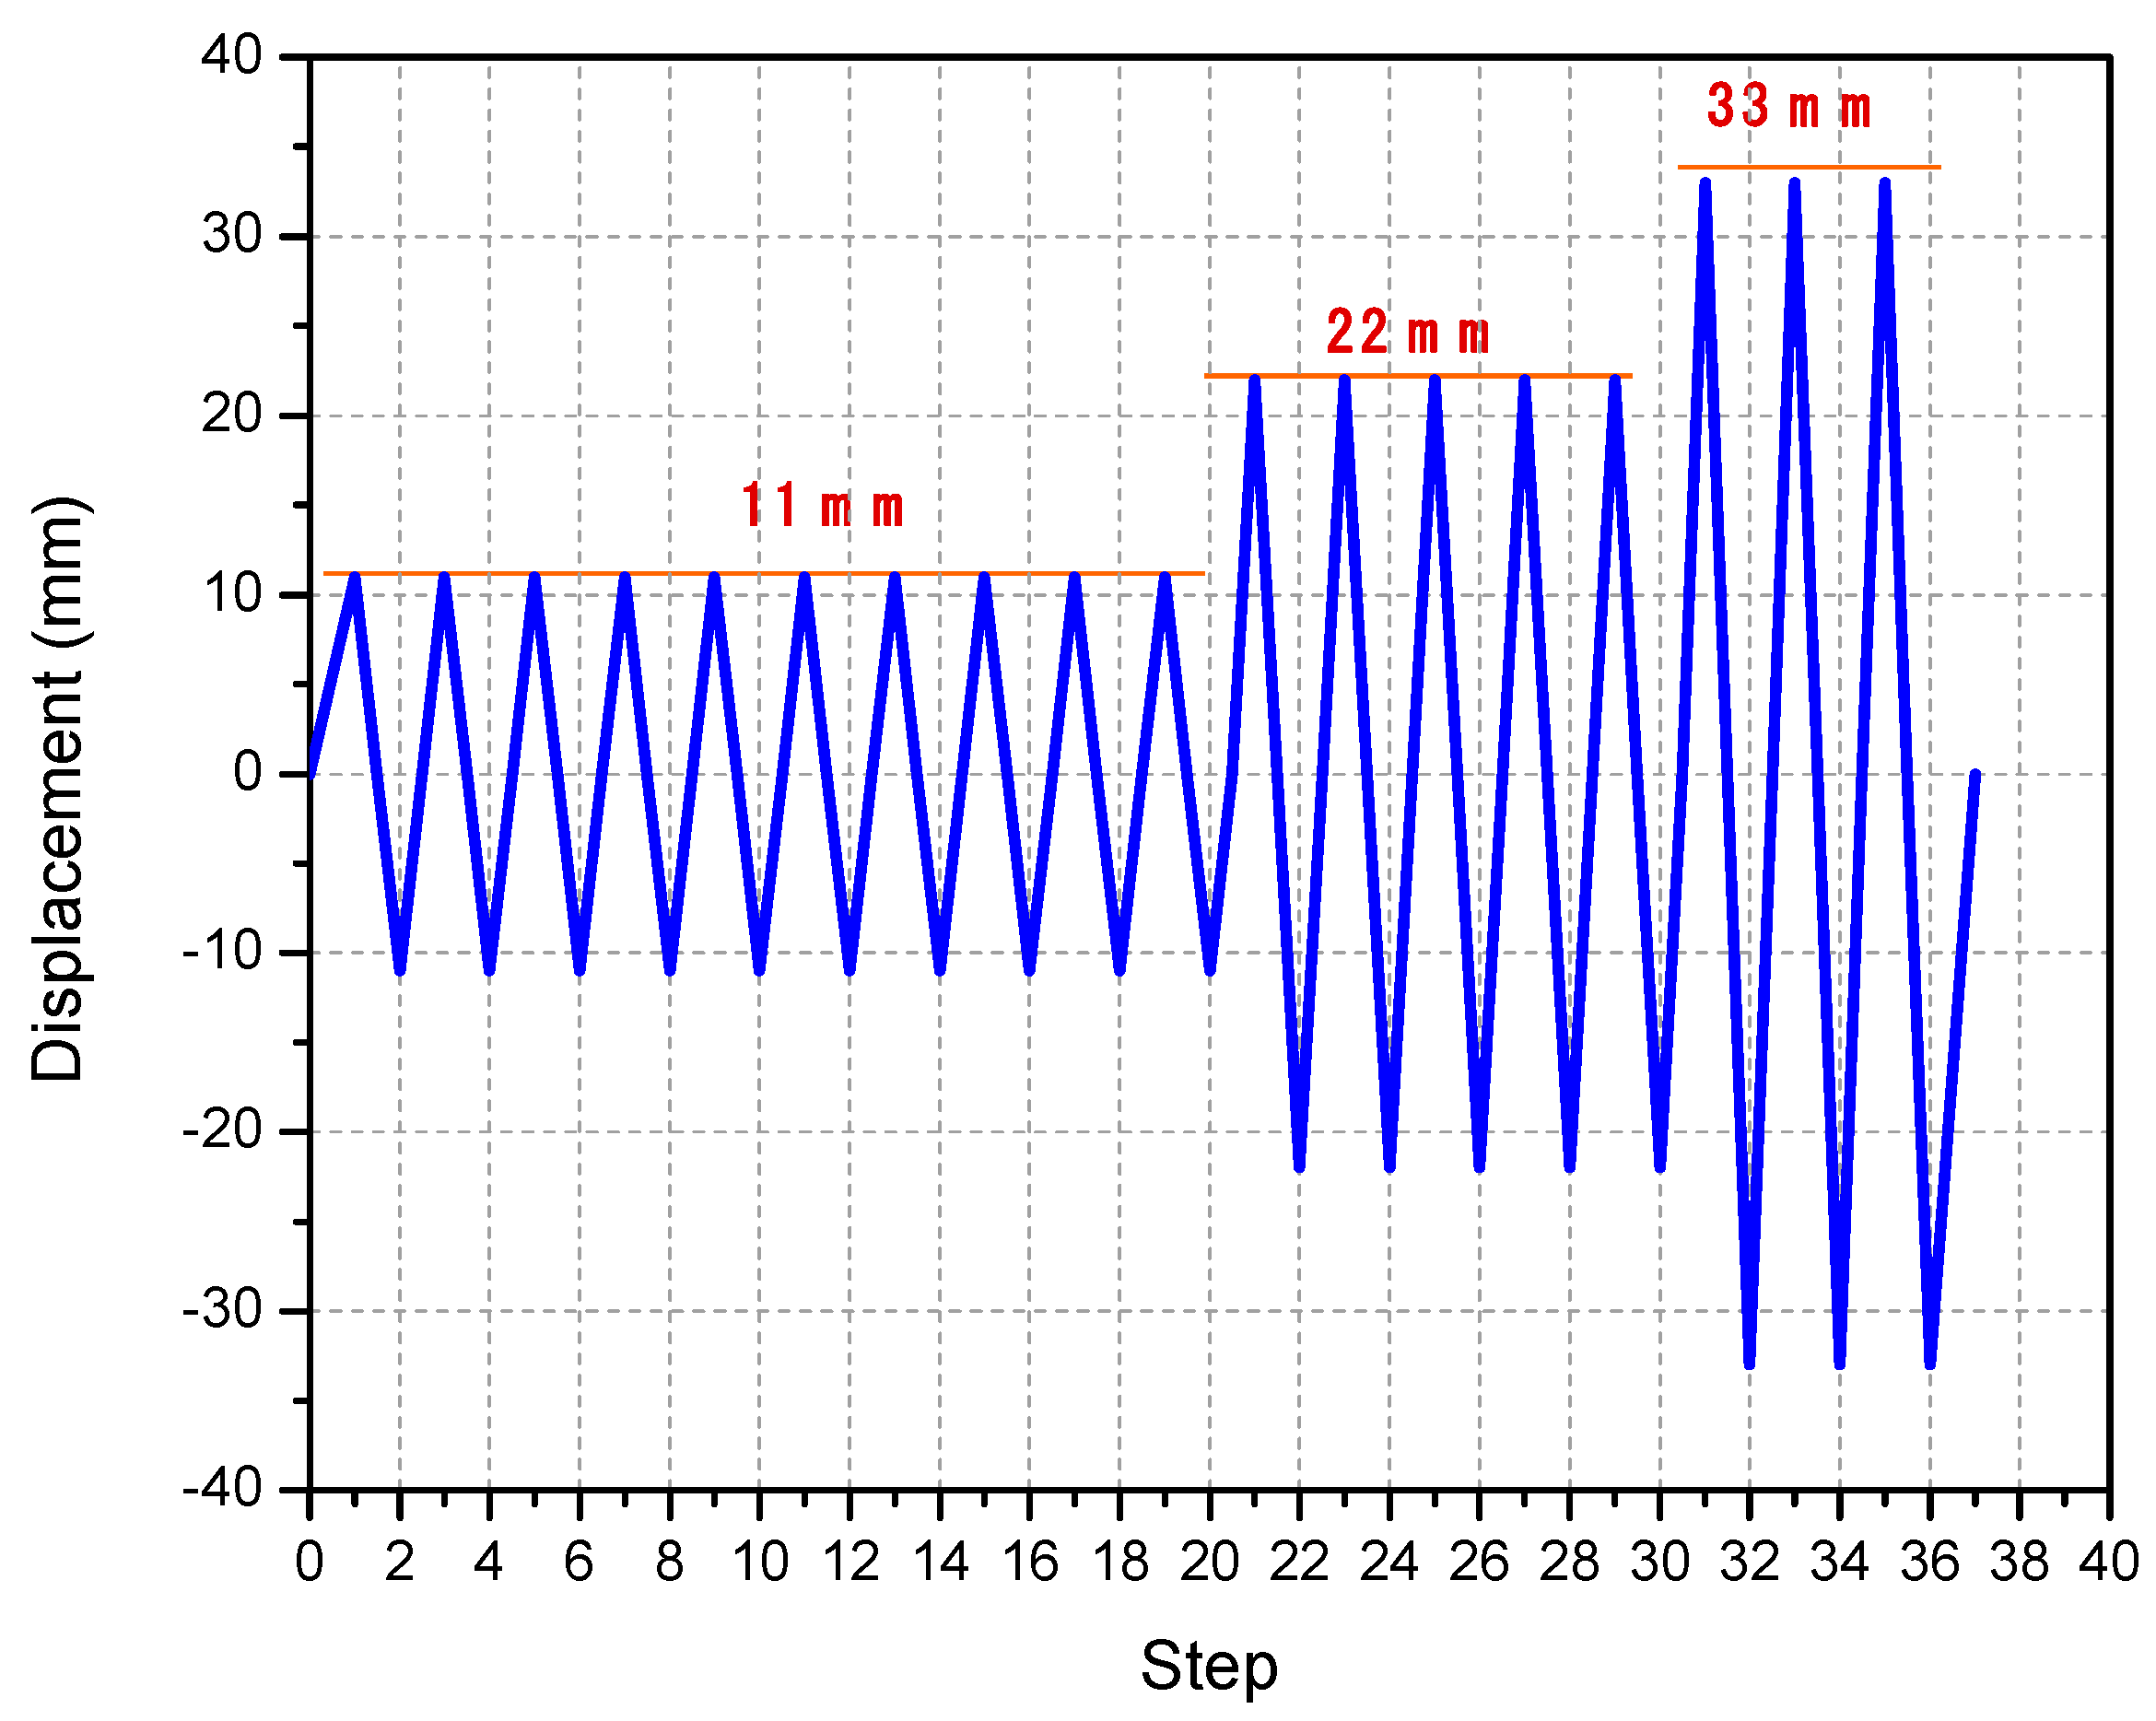
3.2. LLFD Material Test Loading and Measurement Methods
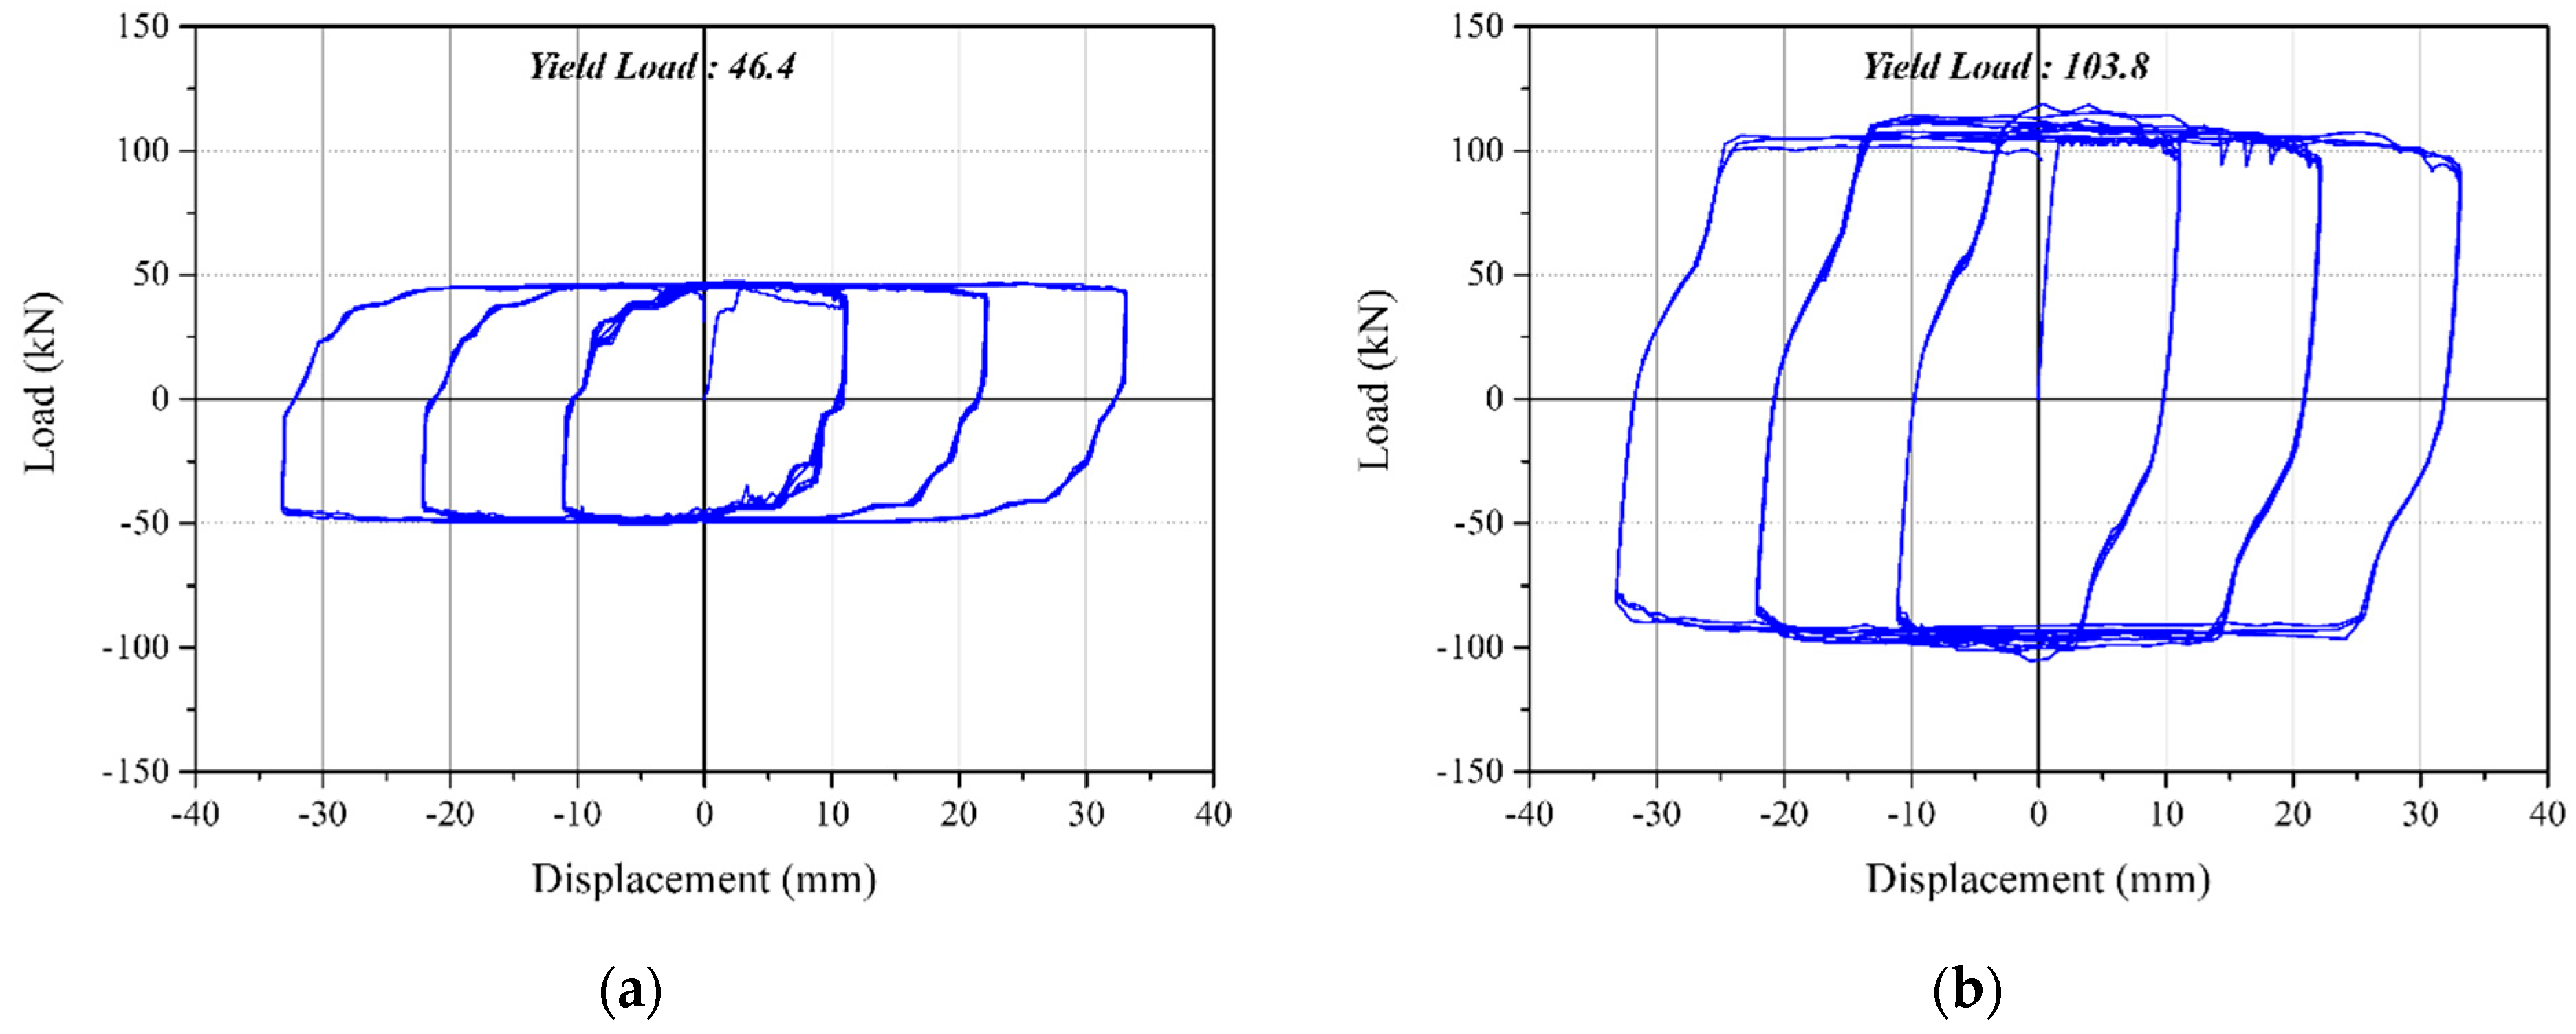
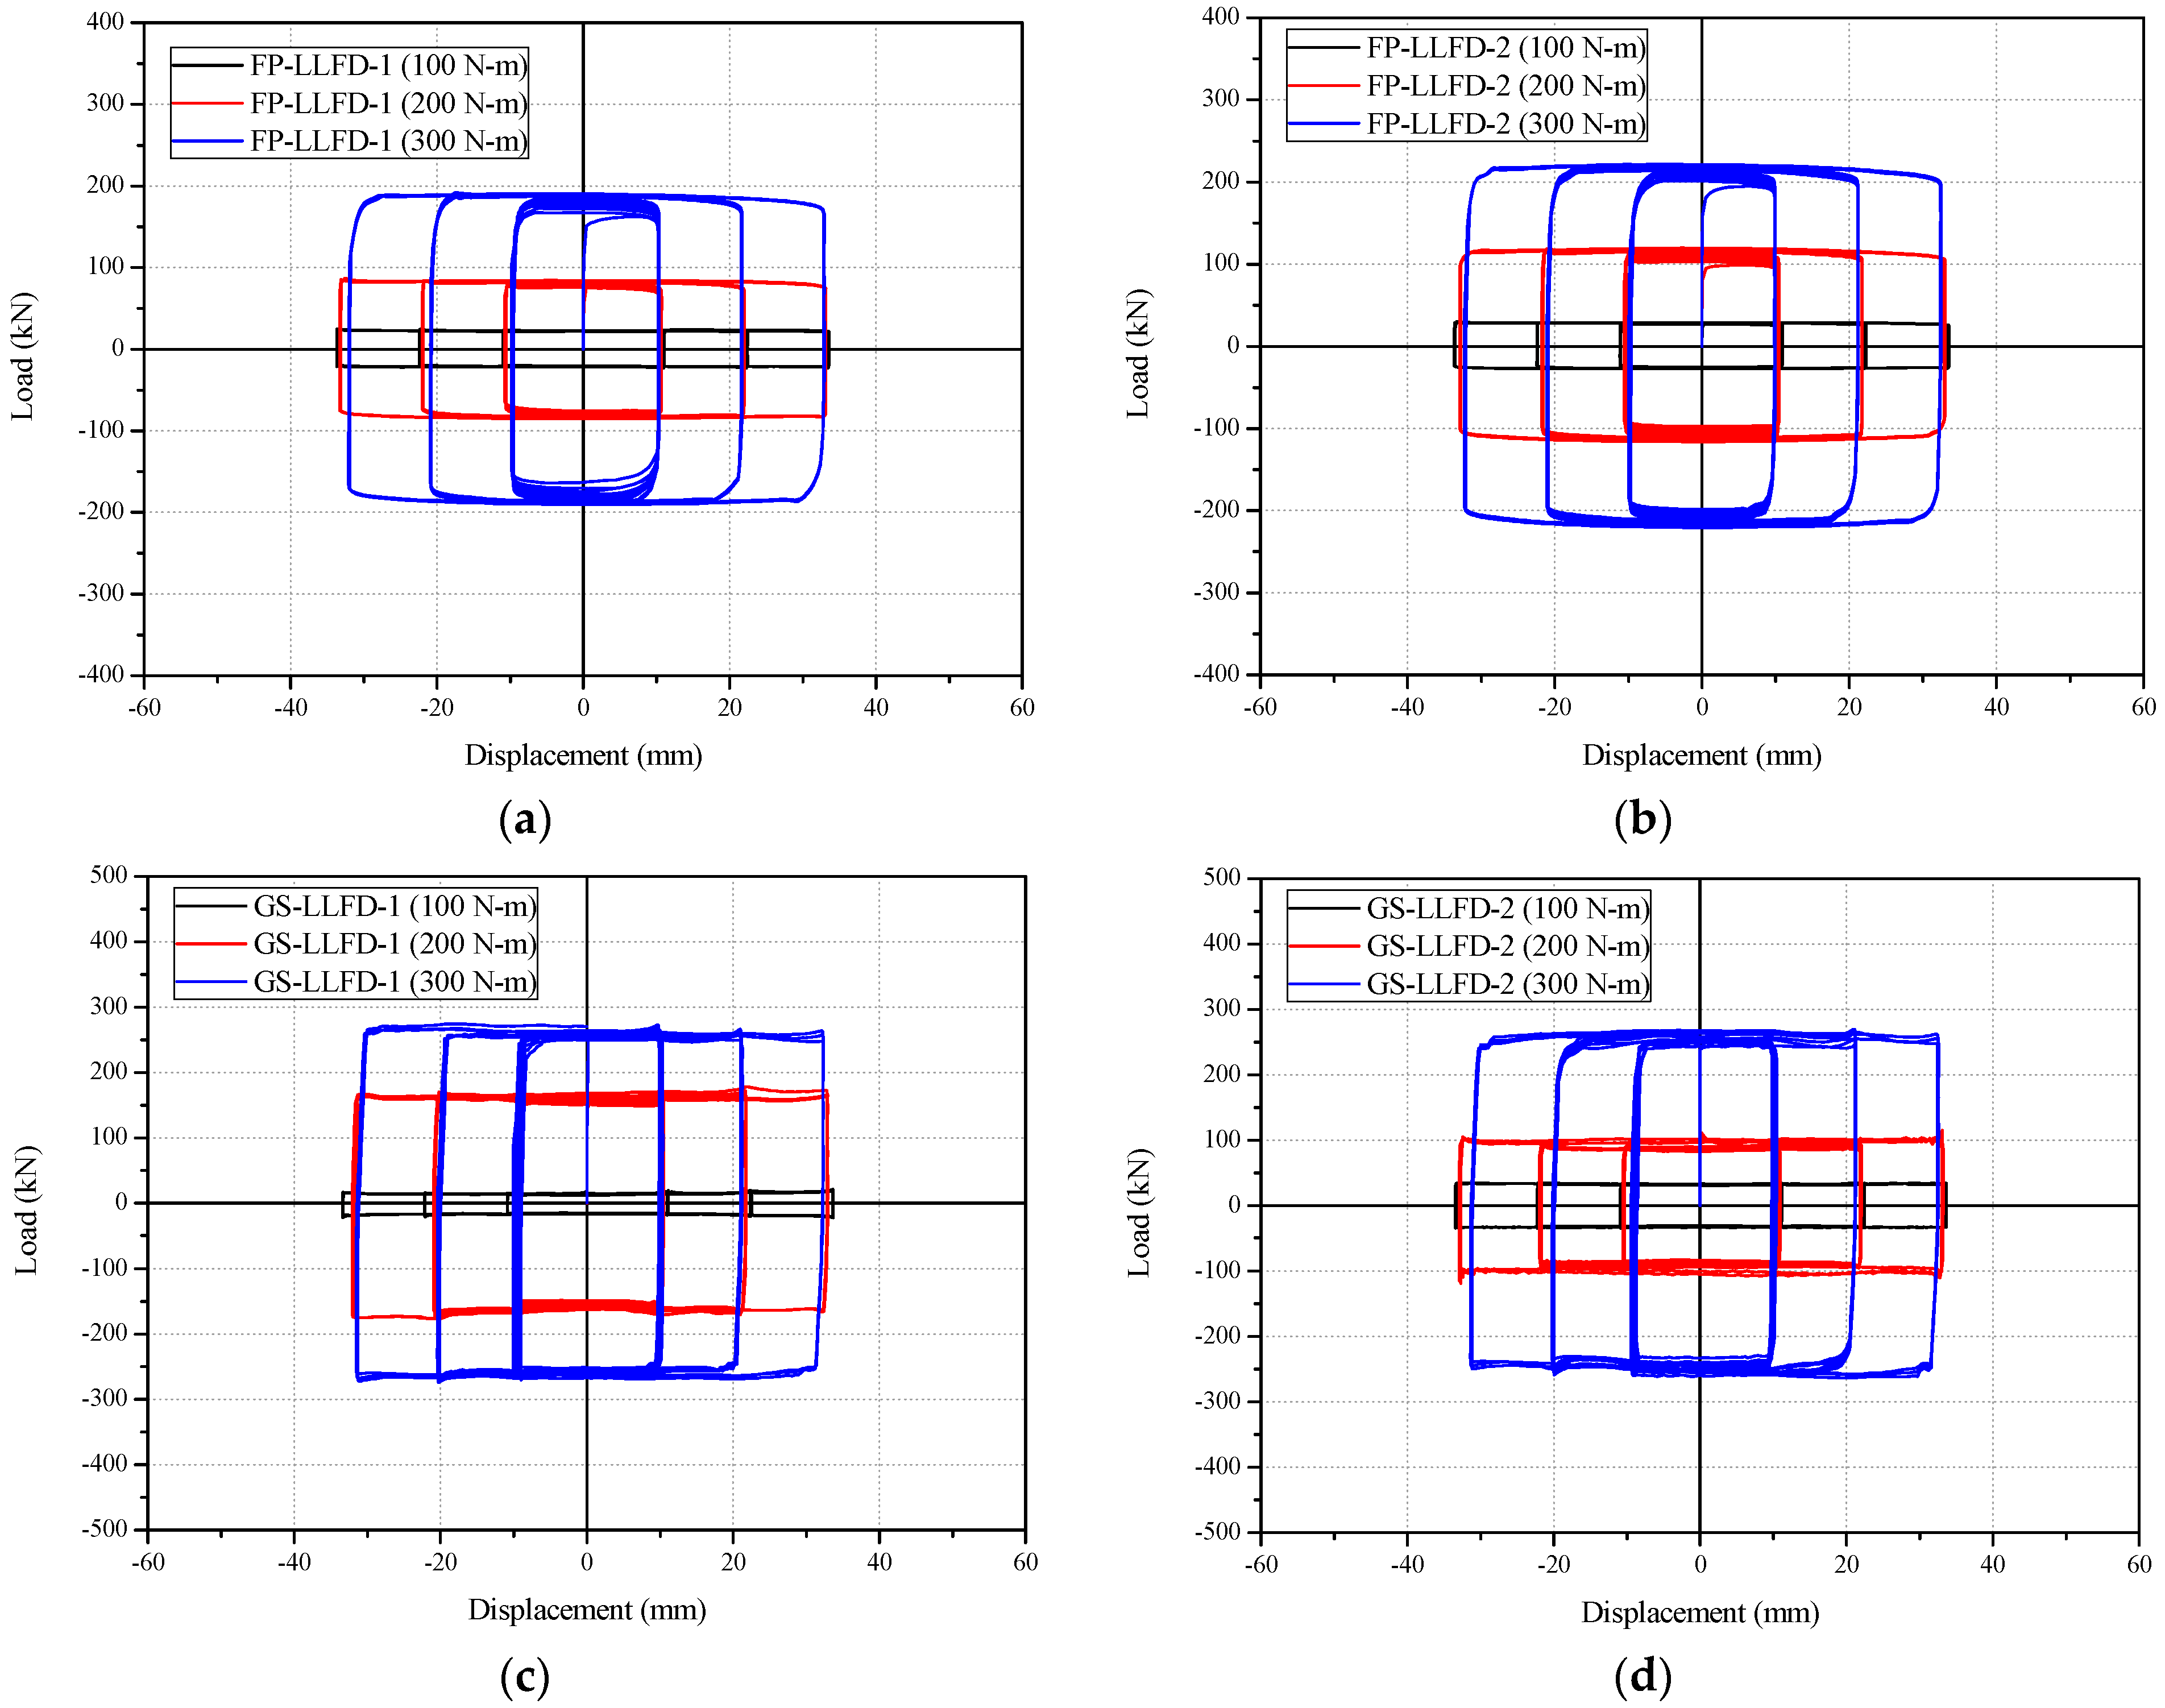
3.3. LLFD Material Test Results and Analysis
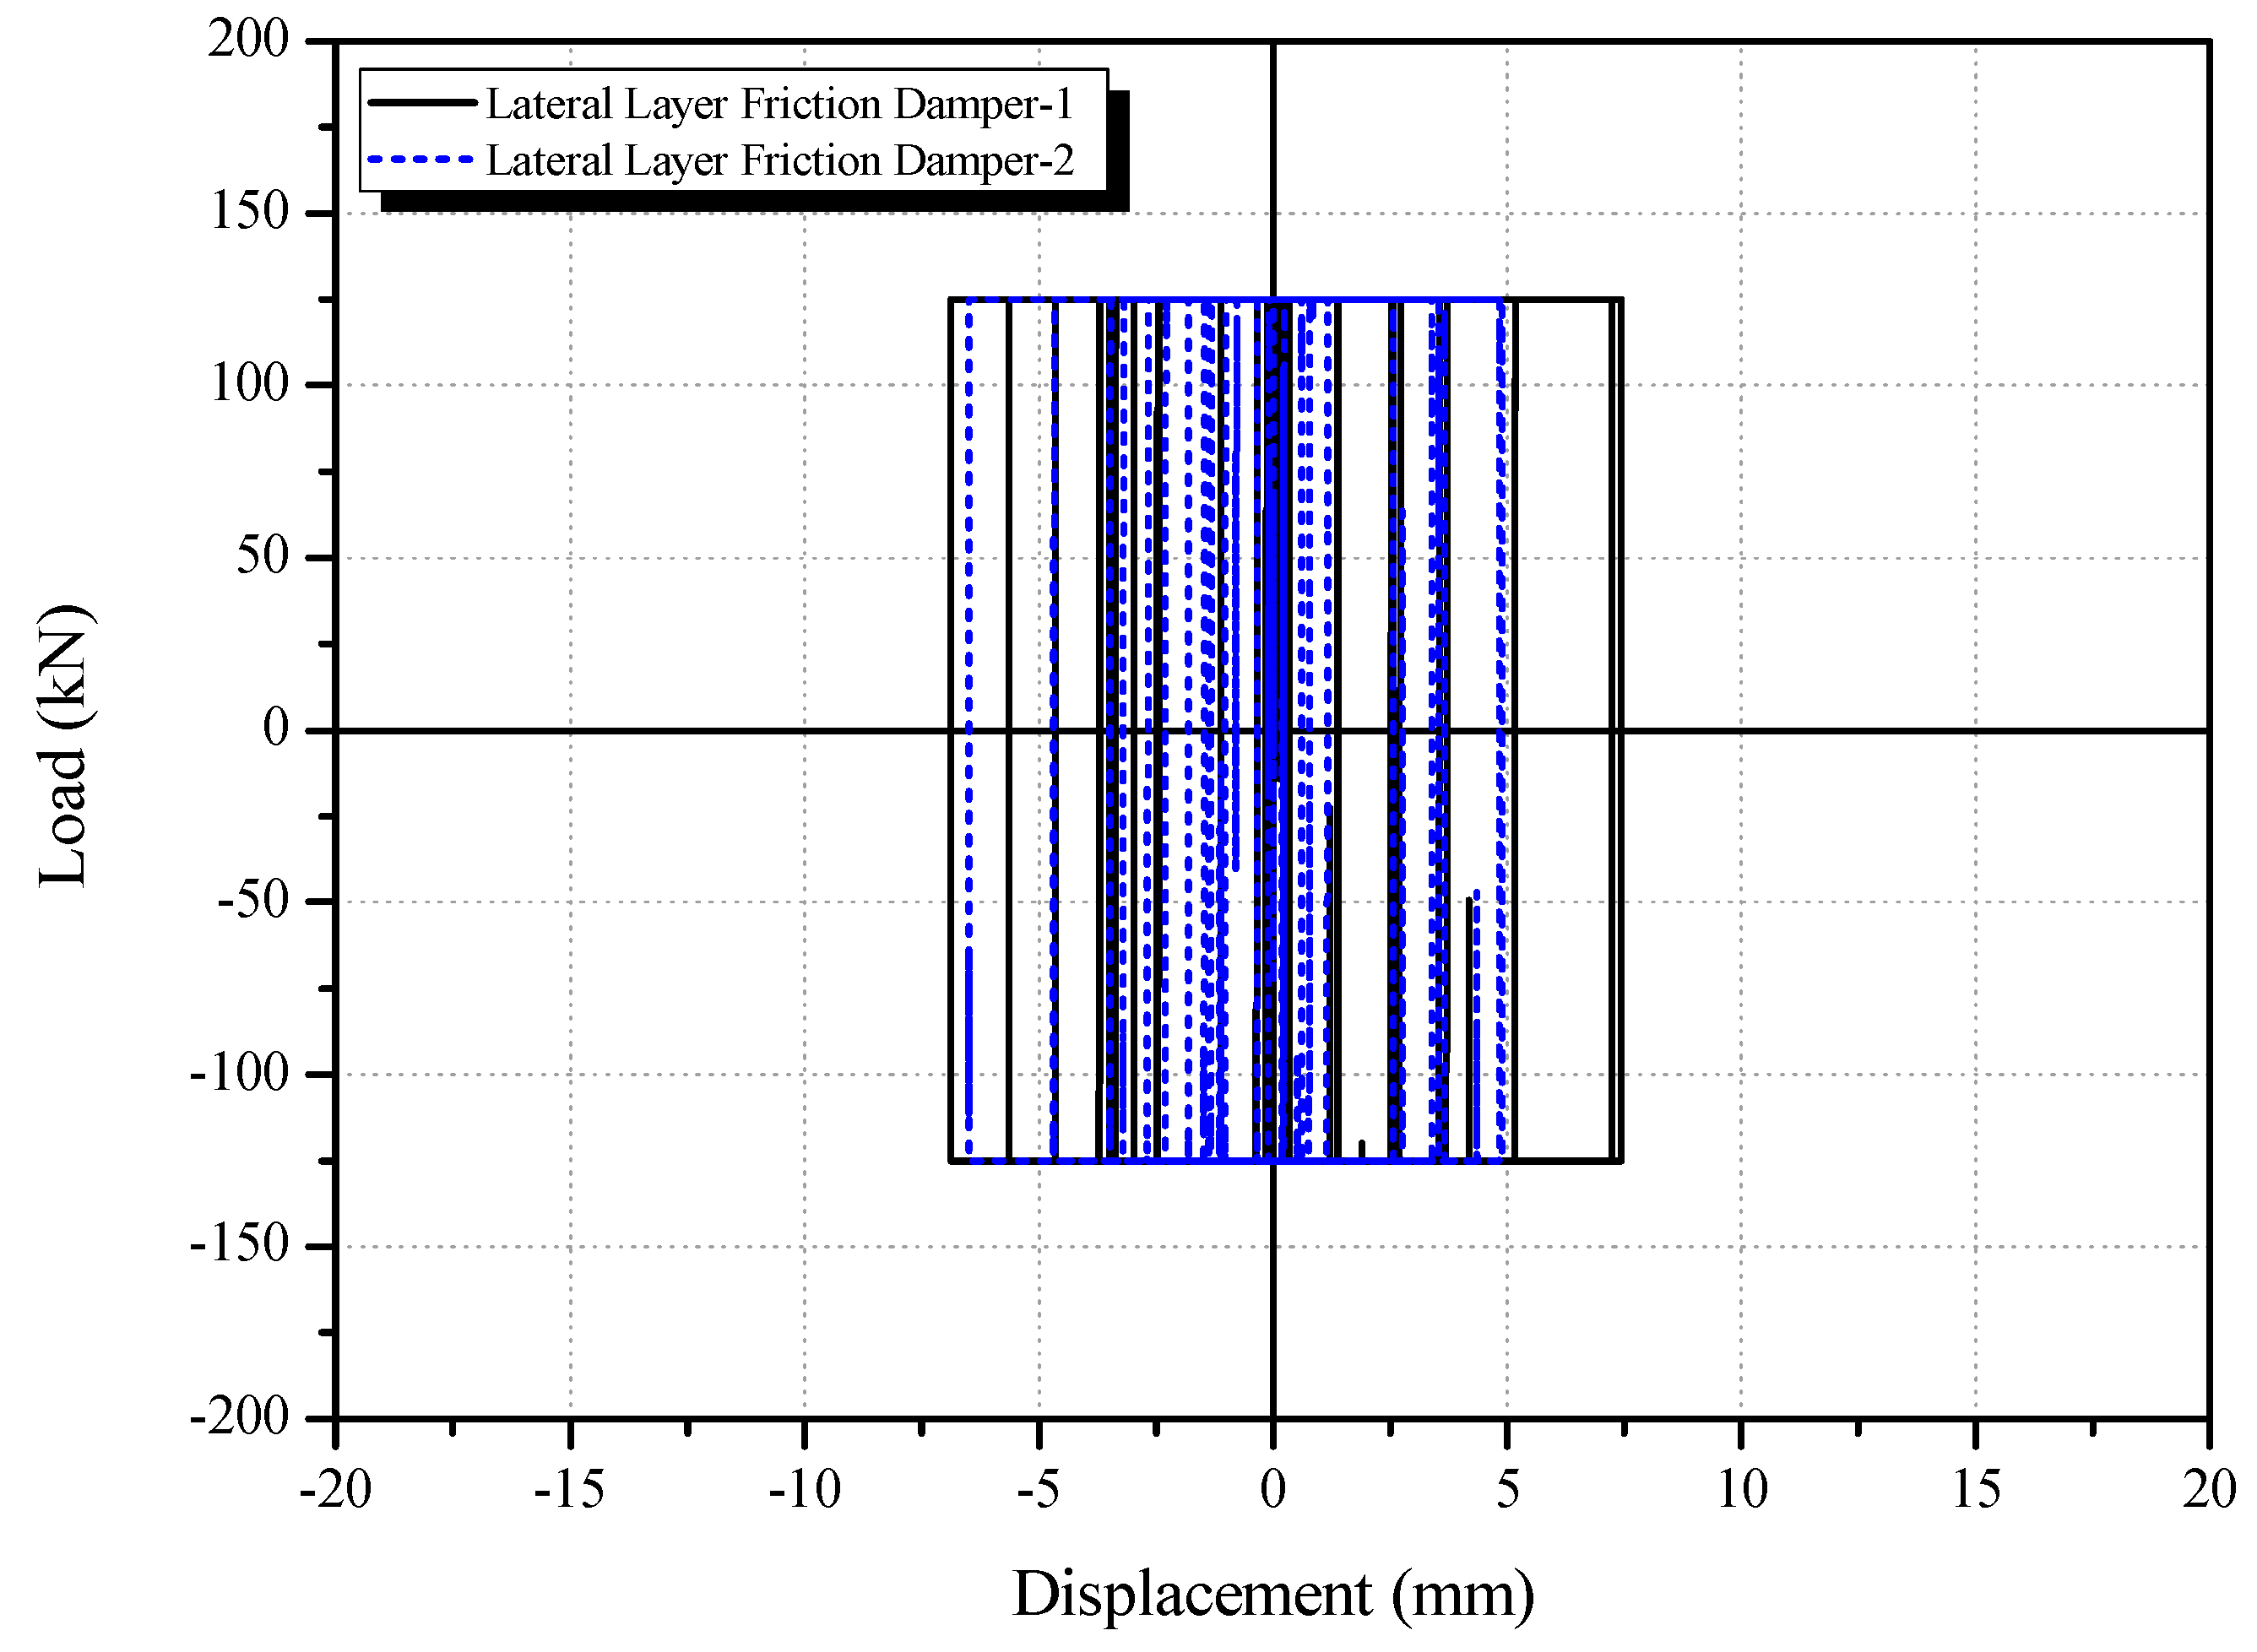
3.3.1. Comparison and Analysis of Load–Displacement Curves
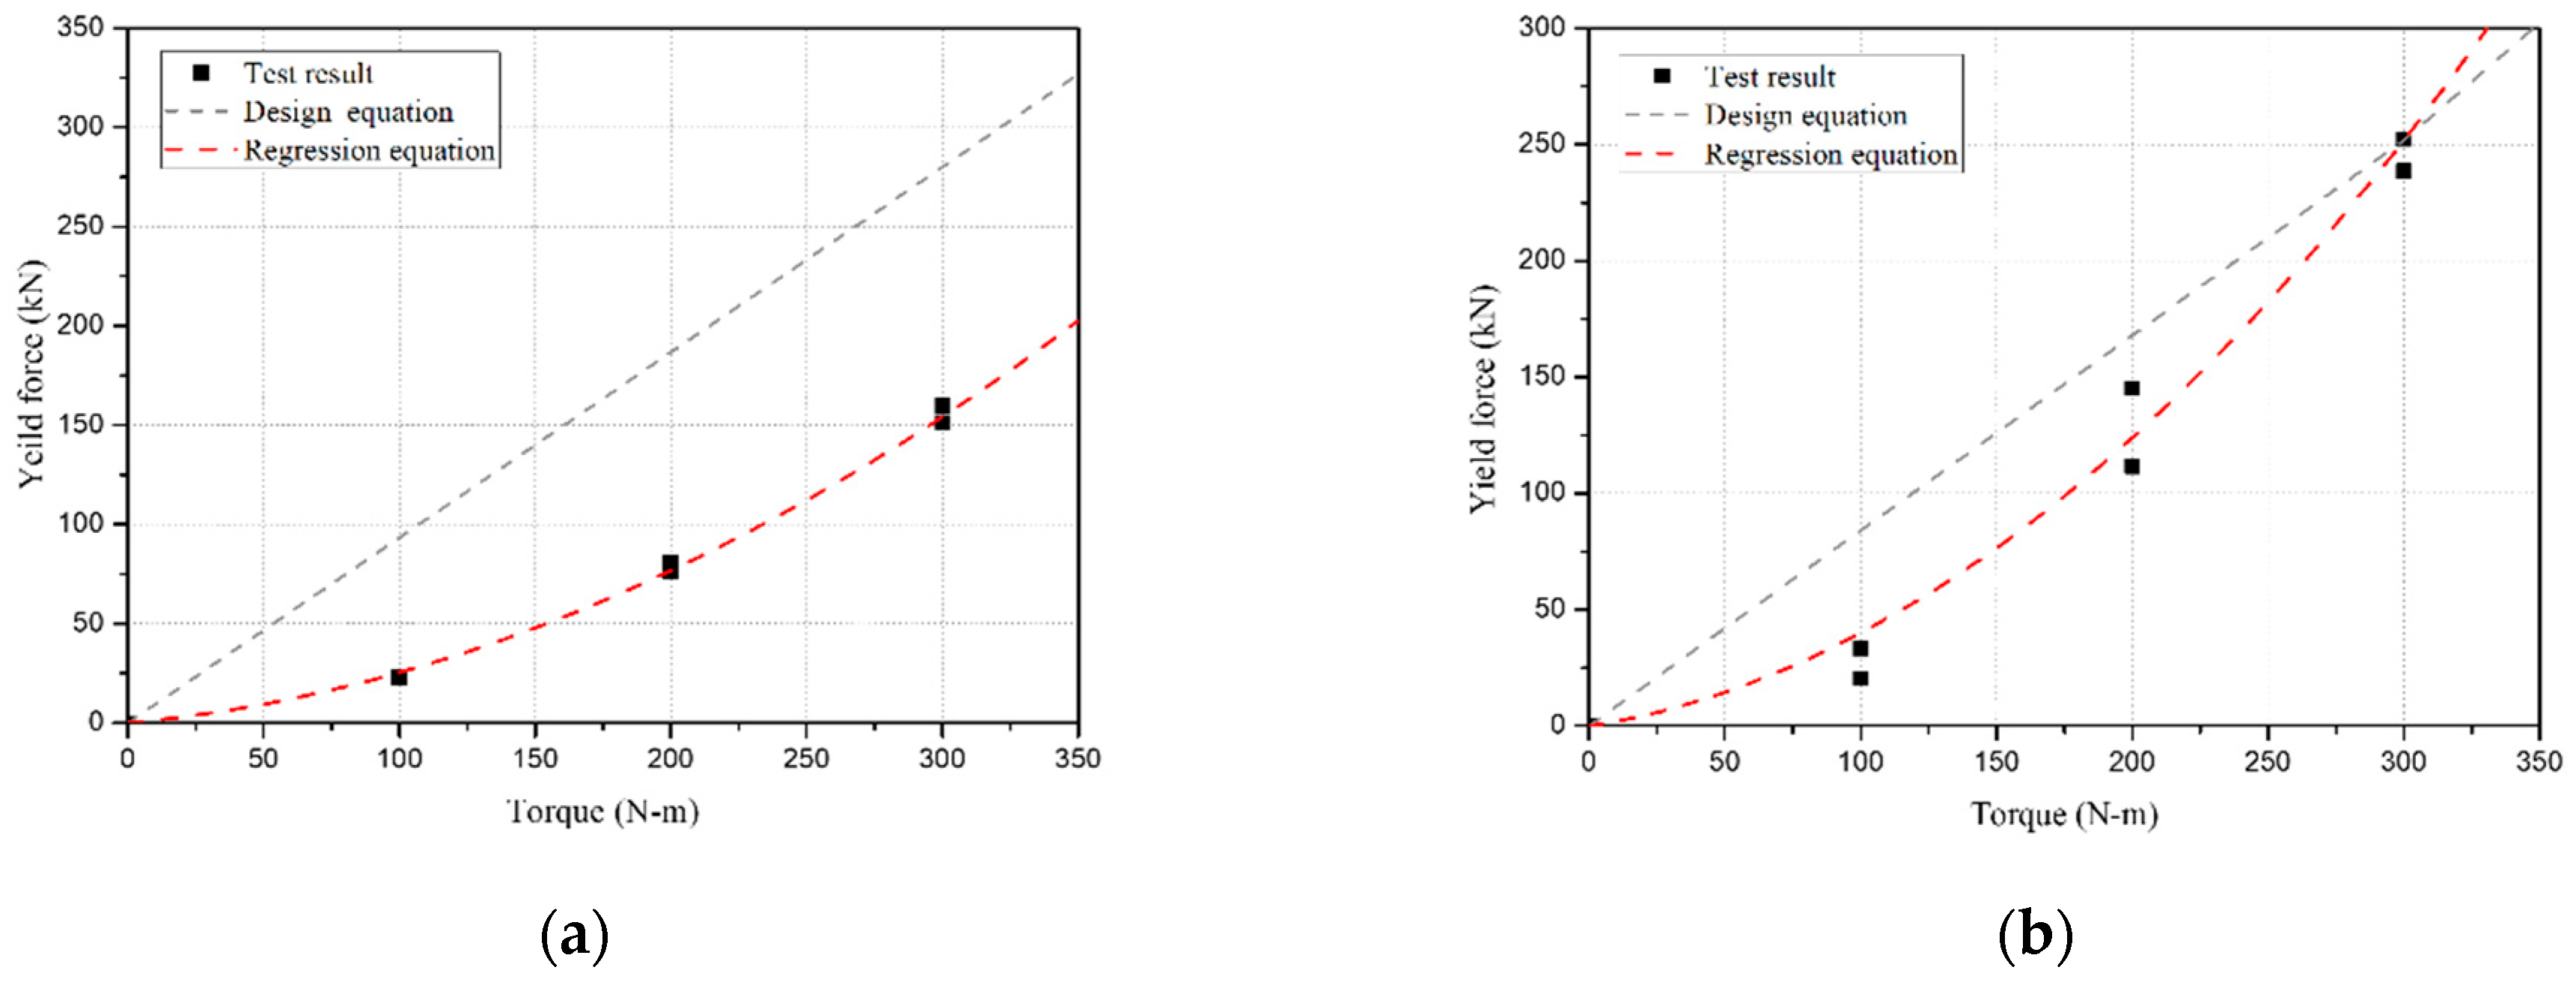
3.3.2. Performance Compatibility Conditions of LLFD
4. Pseudo-Dynamic Test Overview and Result Analysis
4.1. Overview of the Existing Seismic Test Method
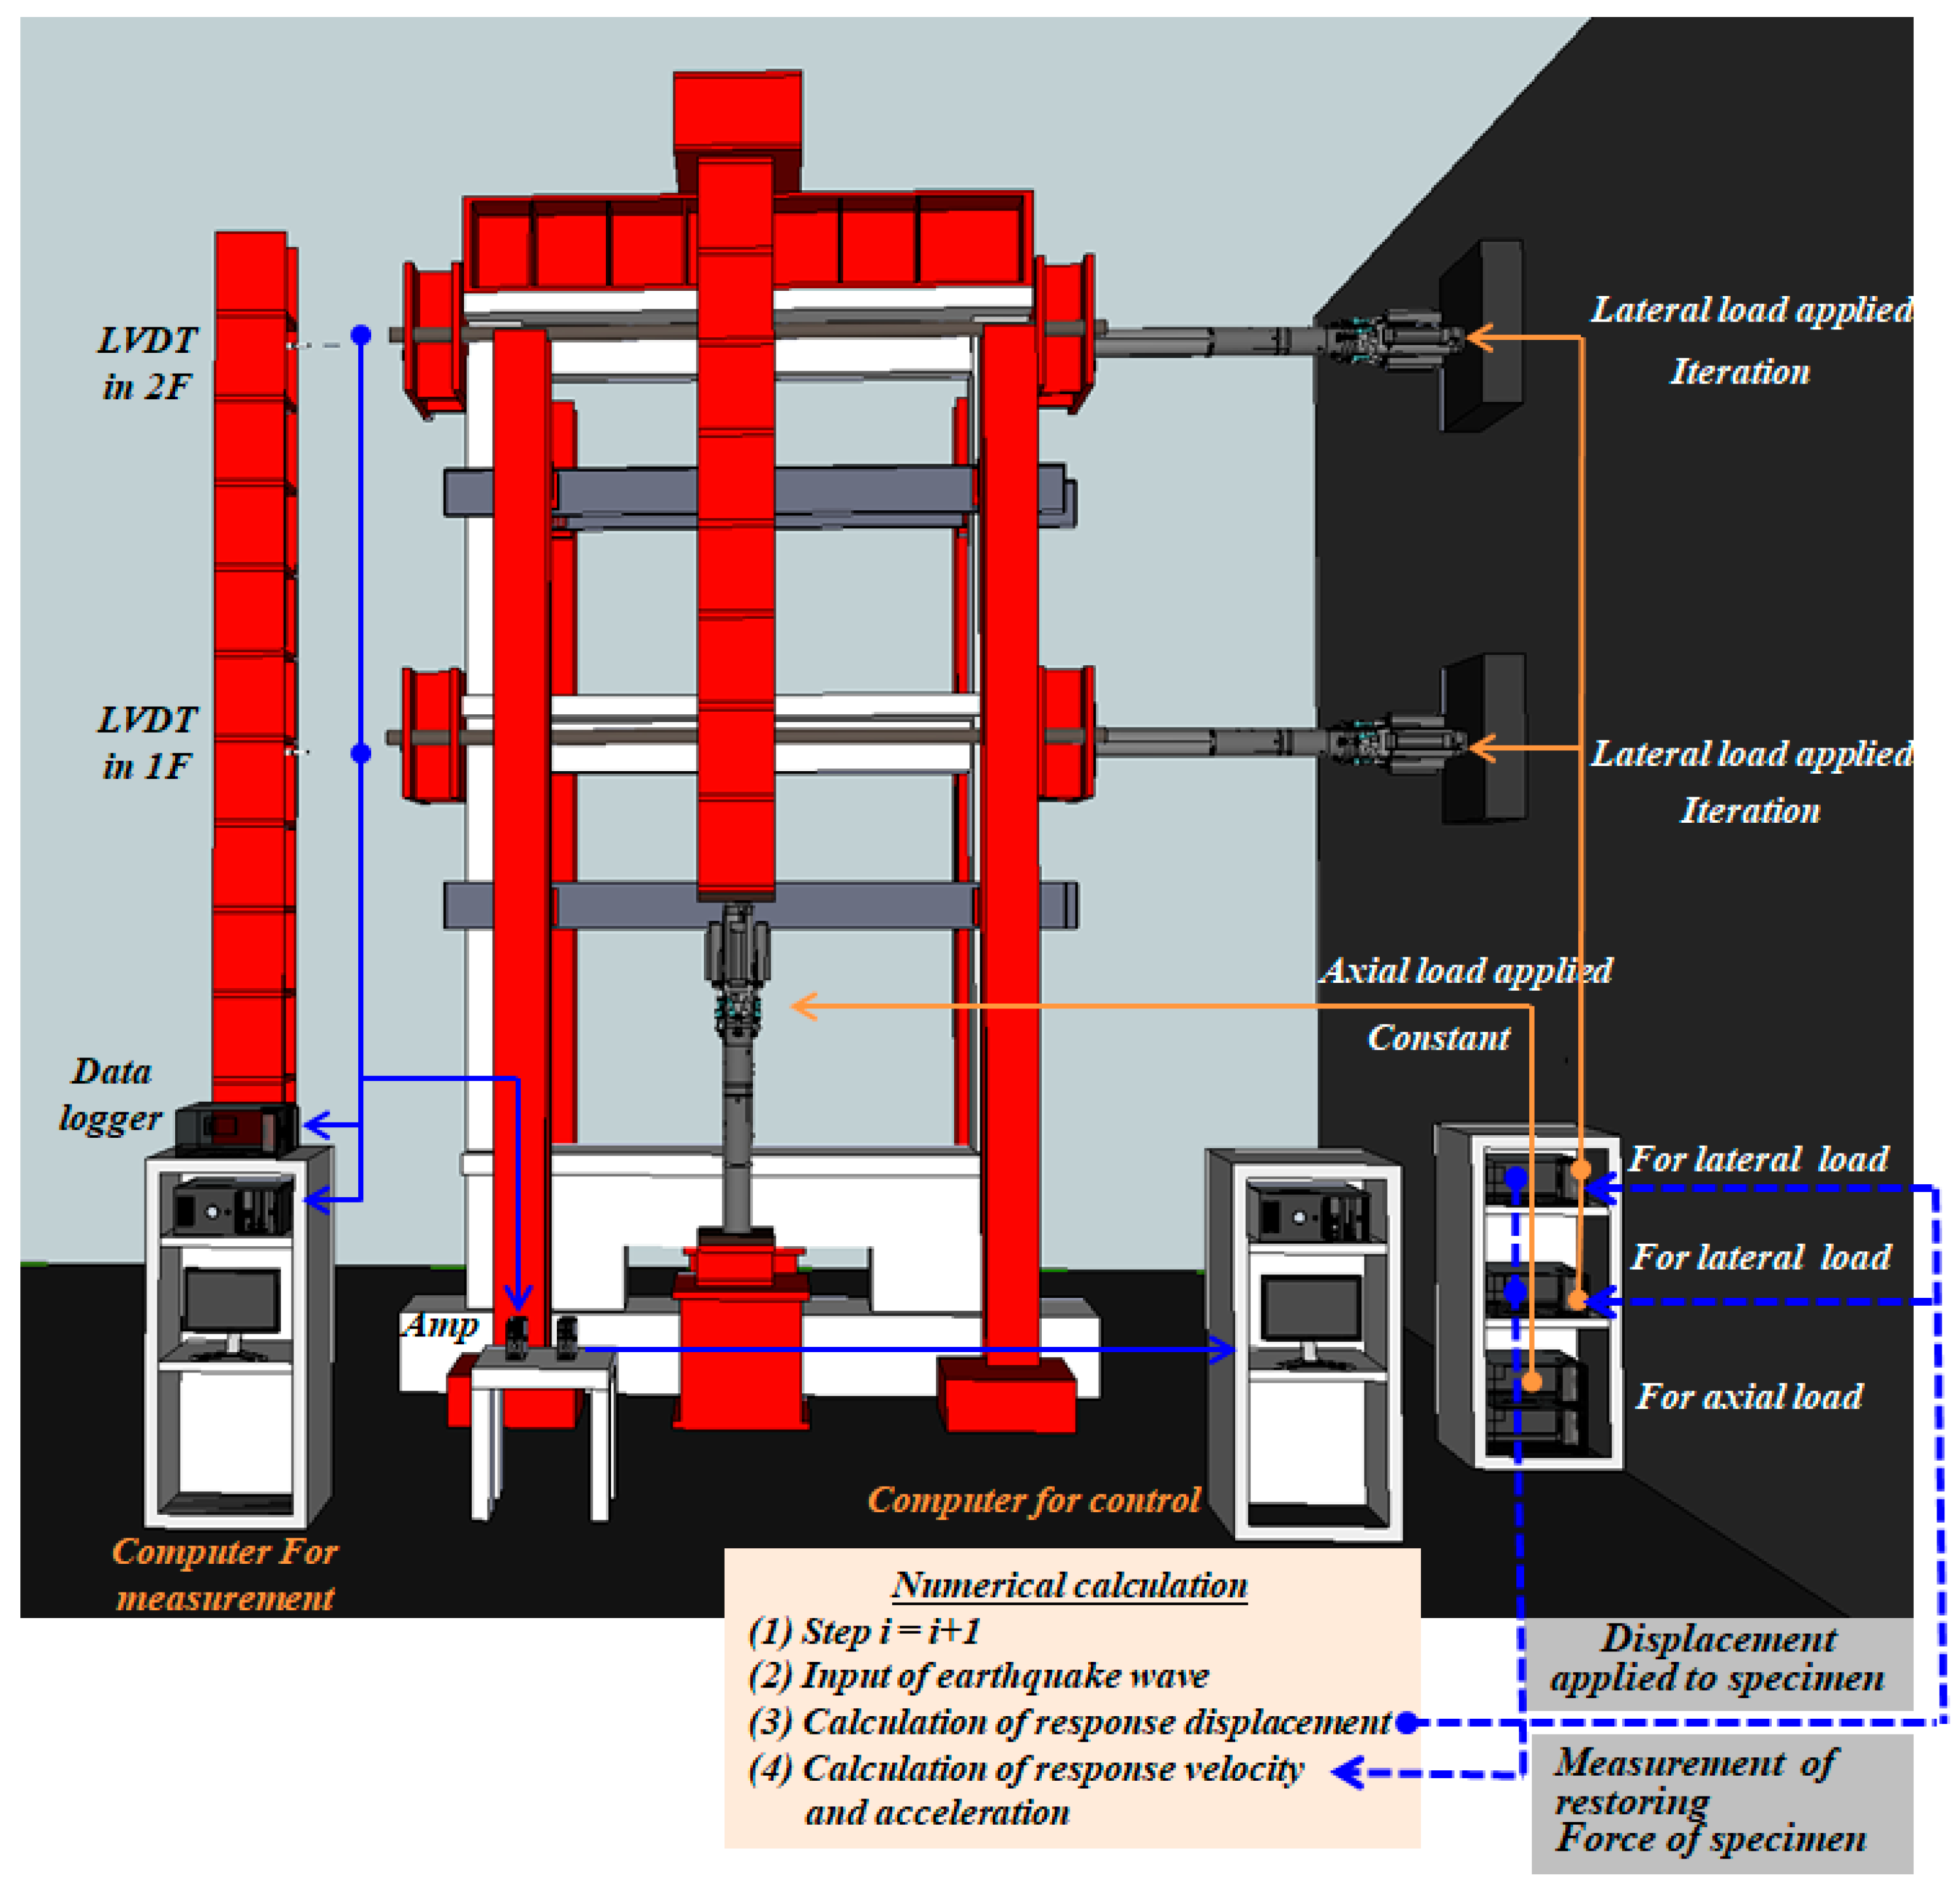
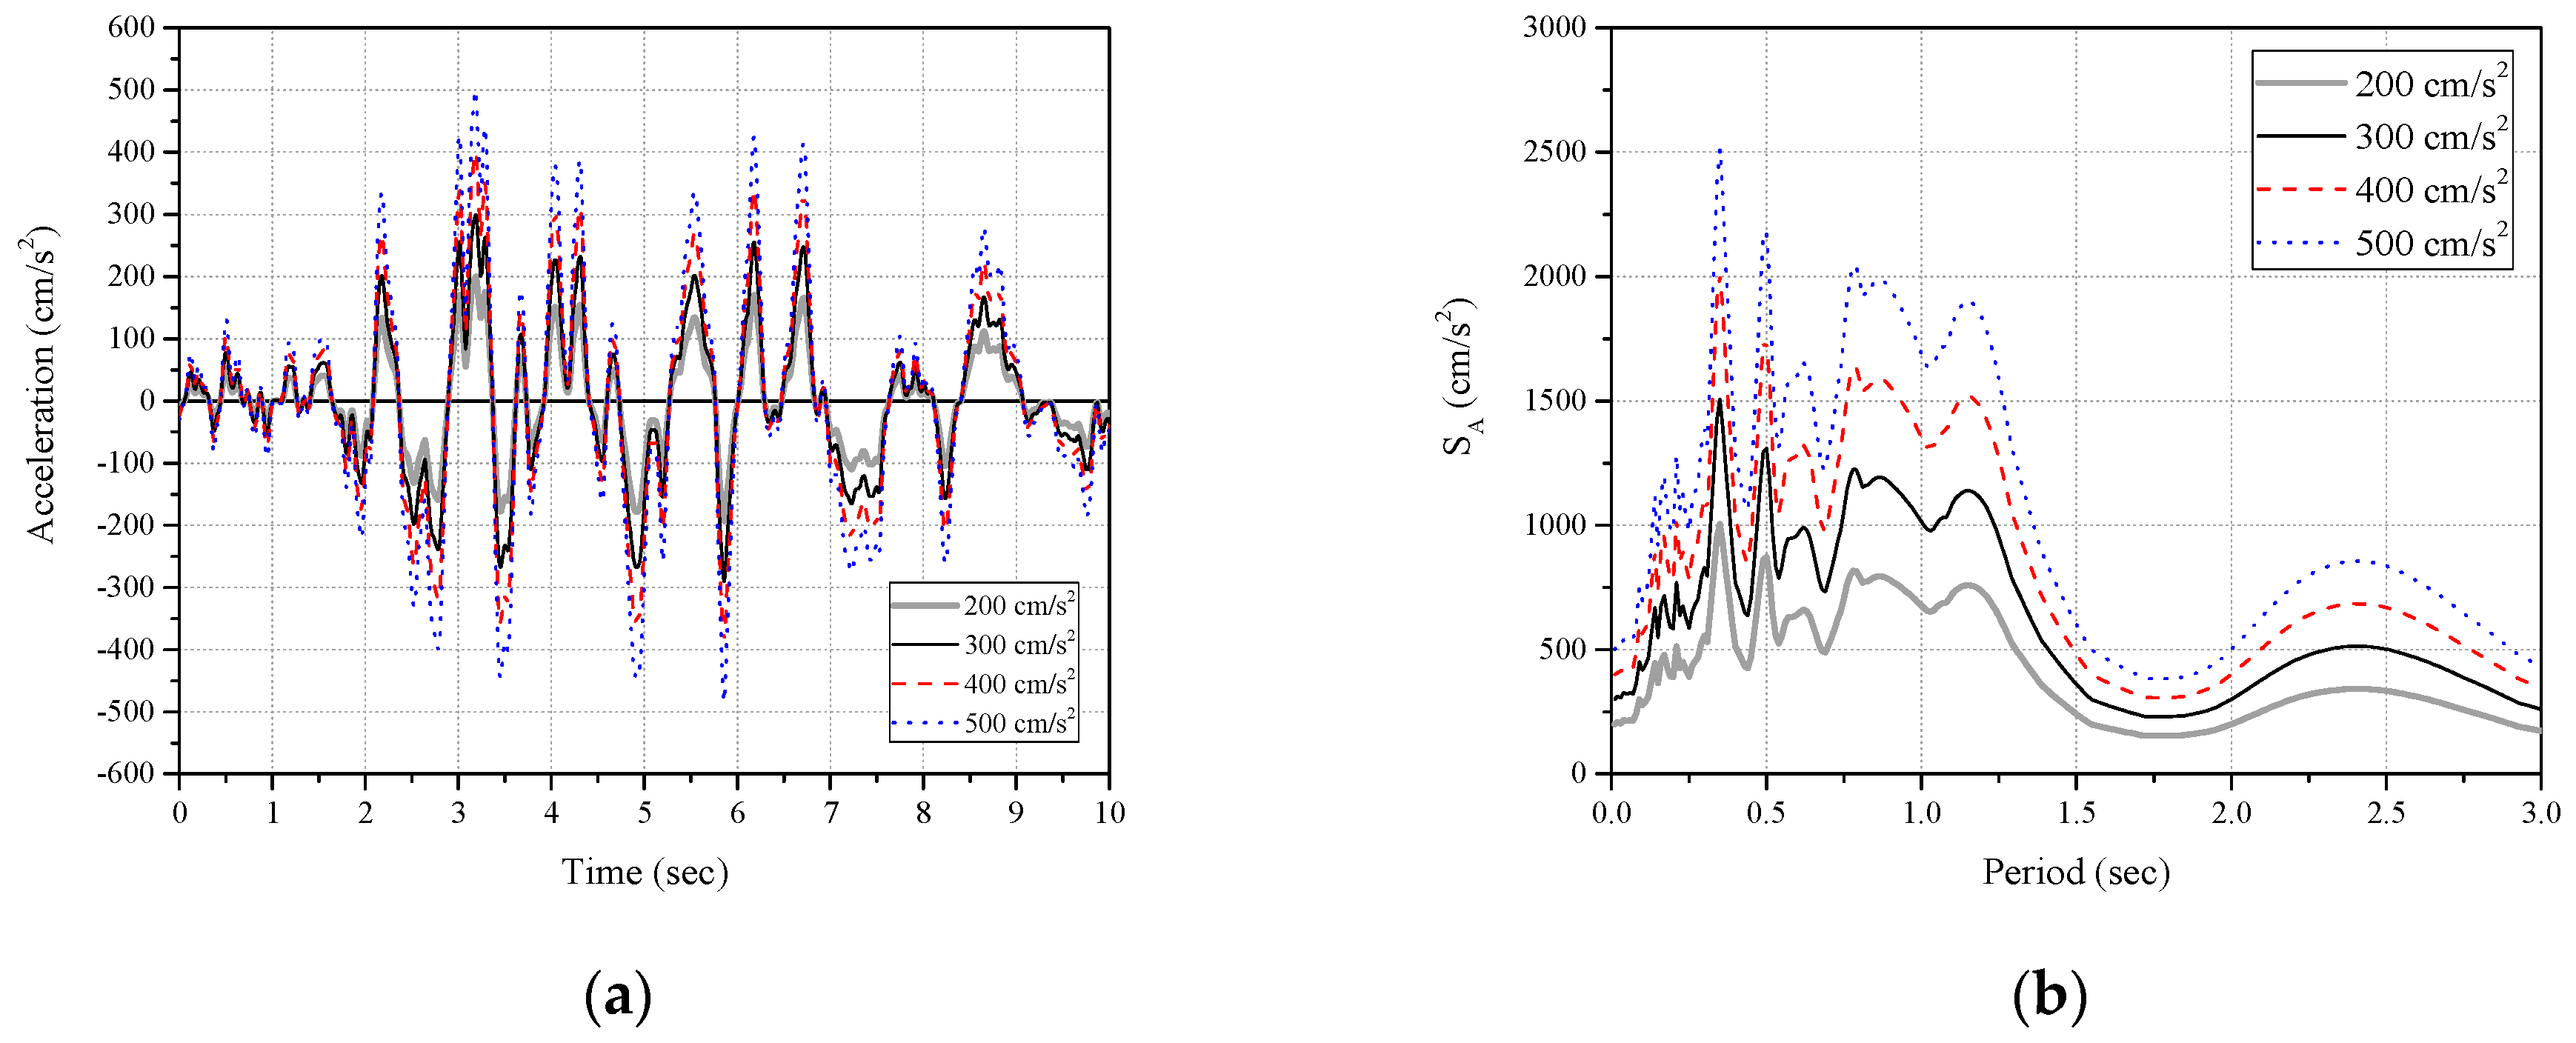
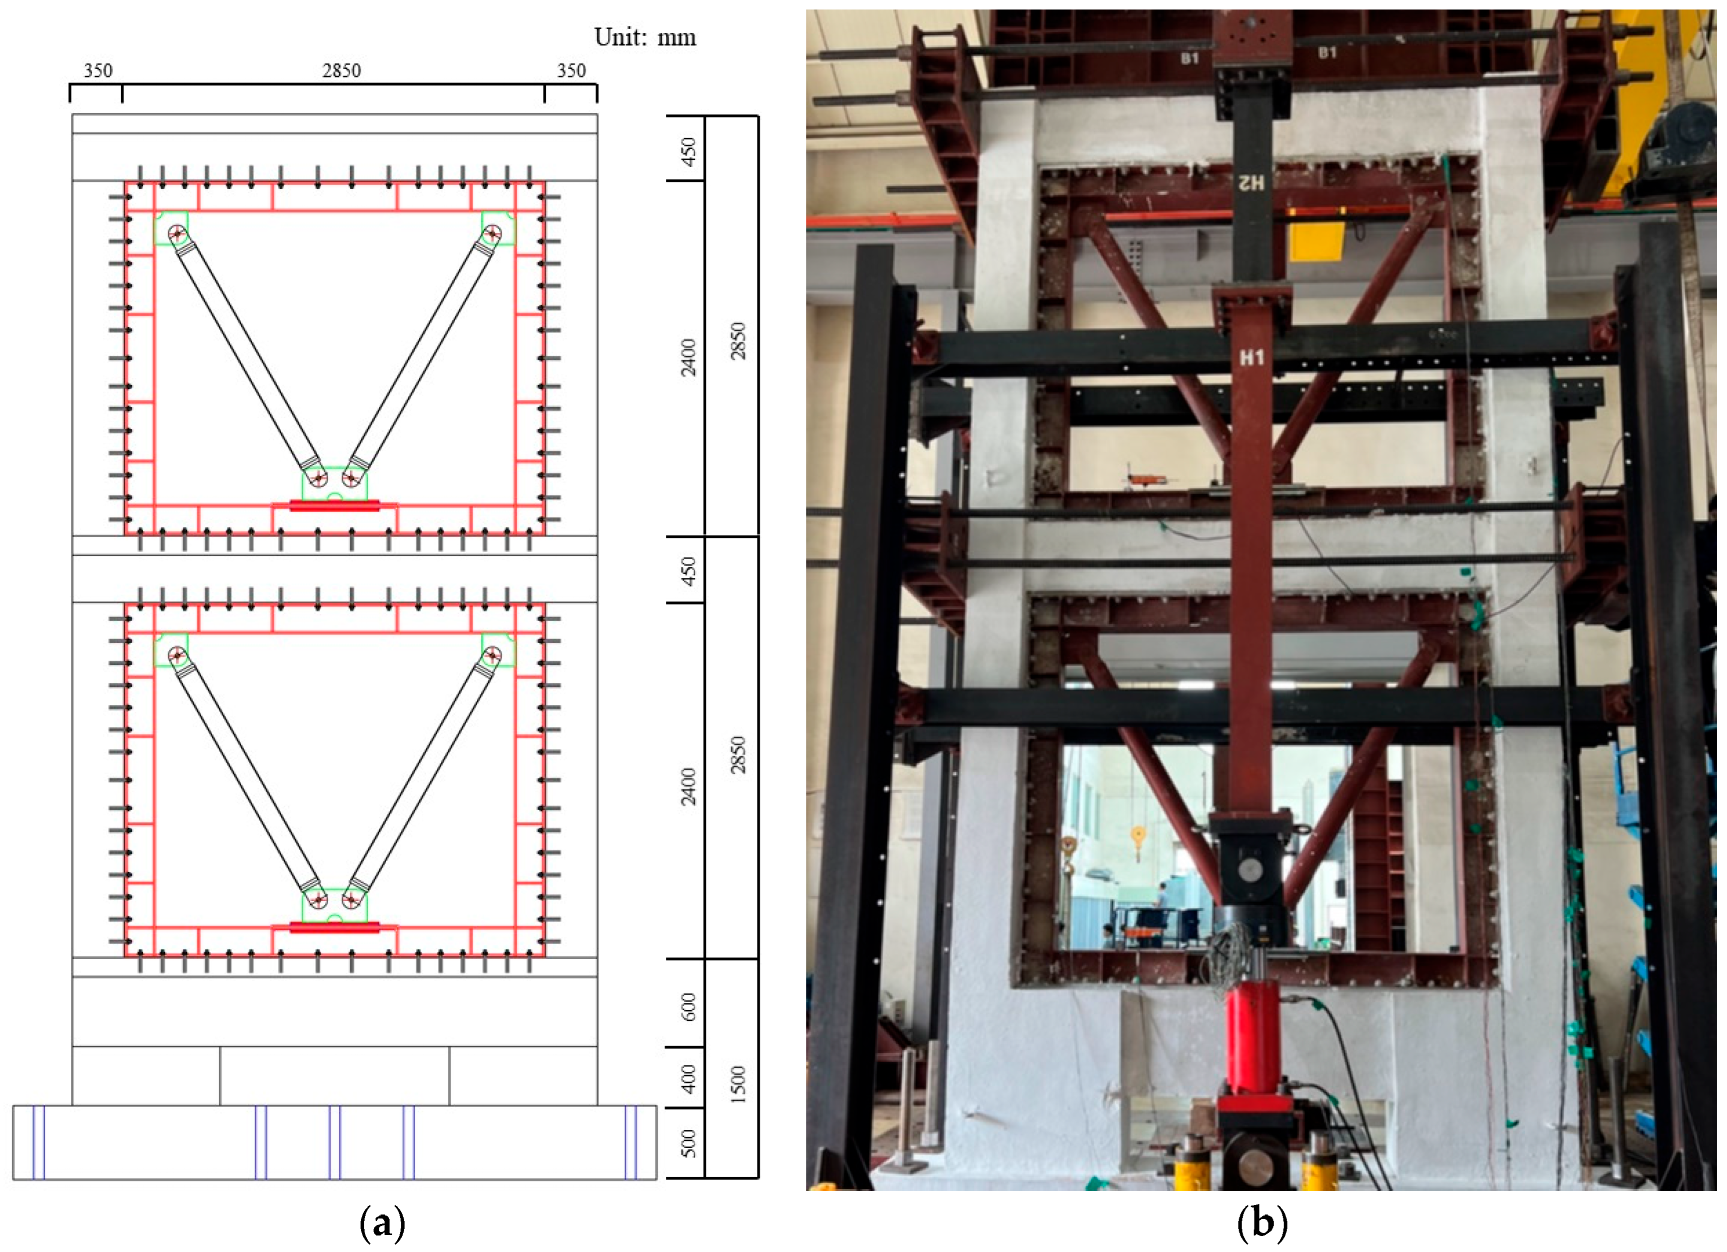
4.2. Pseudo-Dynamic Test System and Method
4.3. Materials Used and Their Characteristics
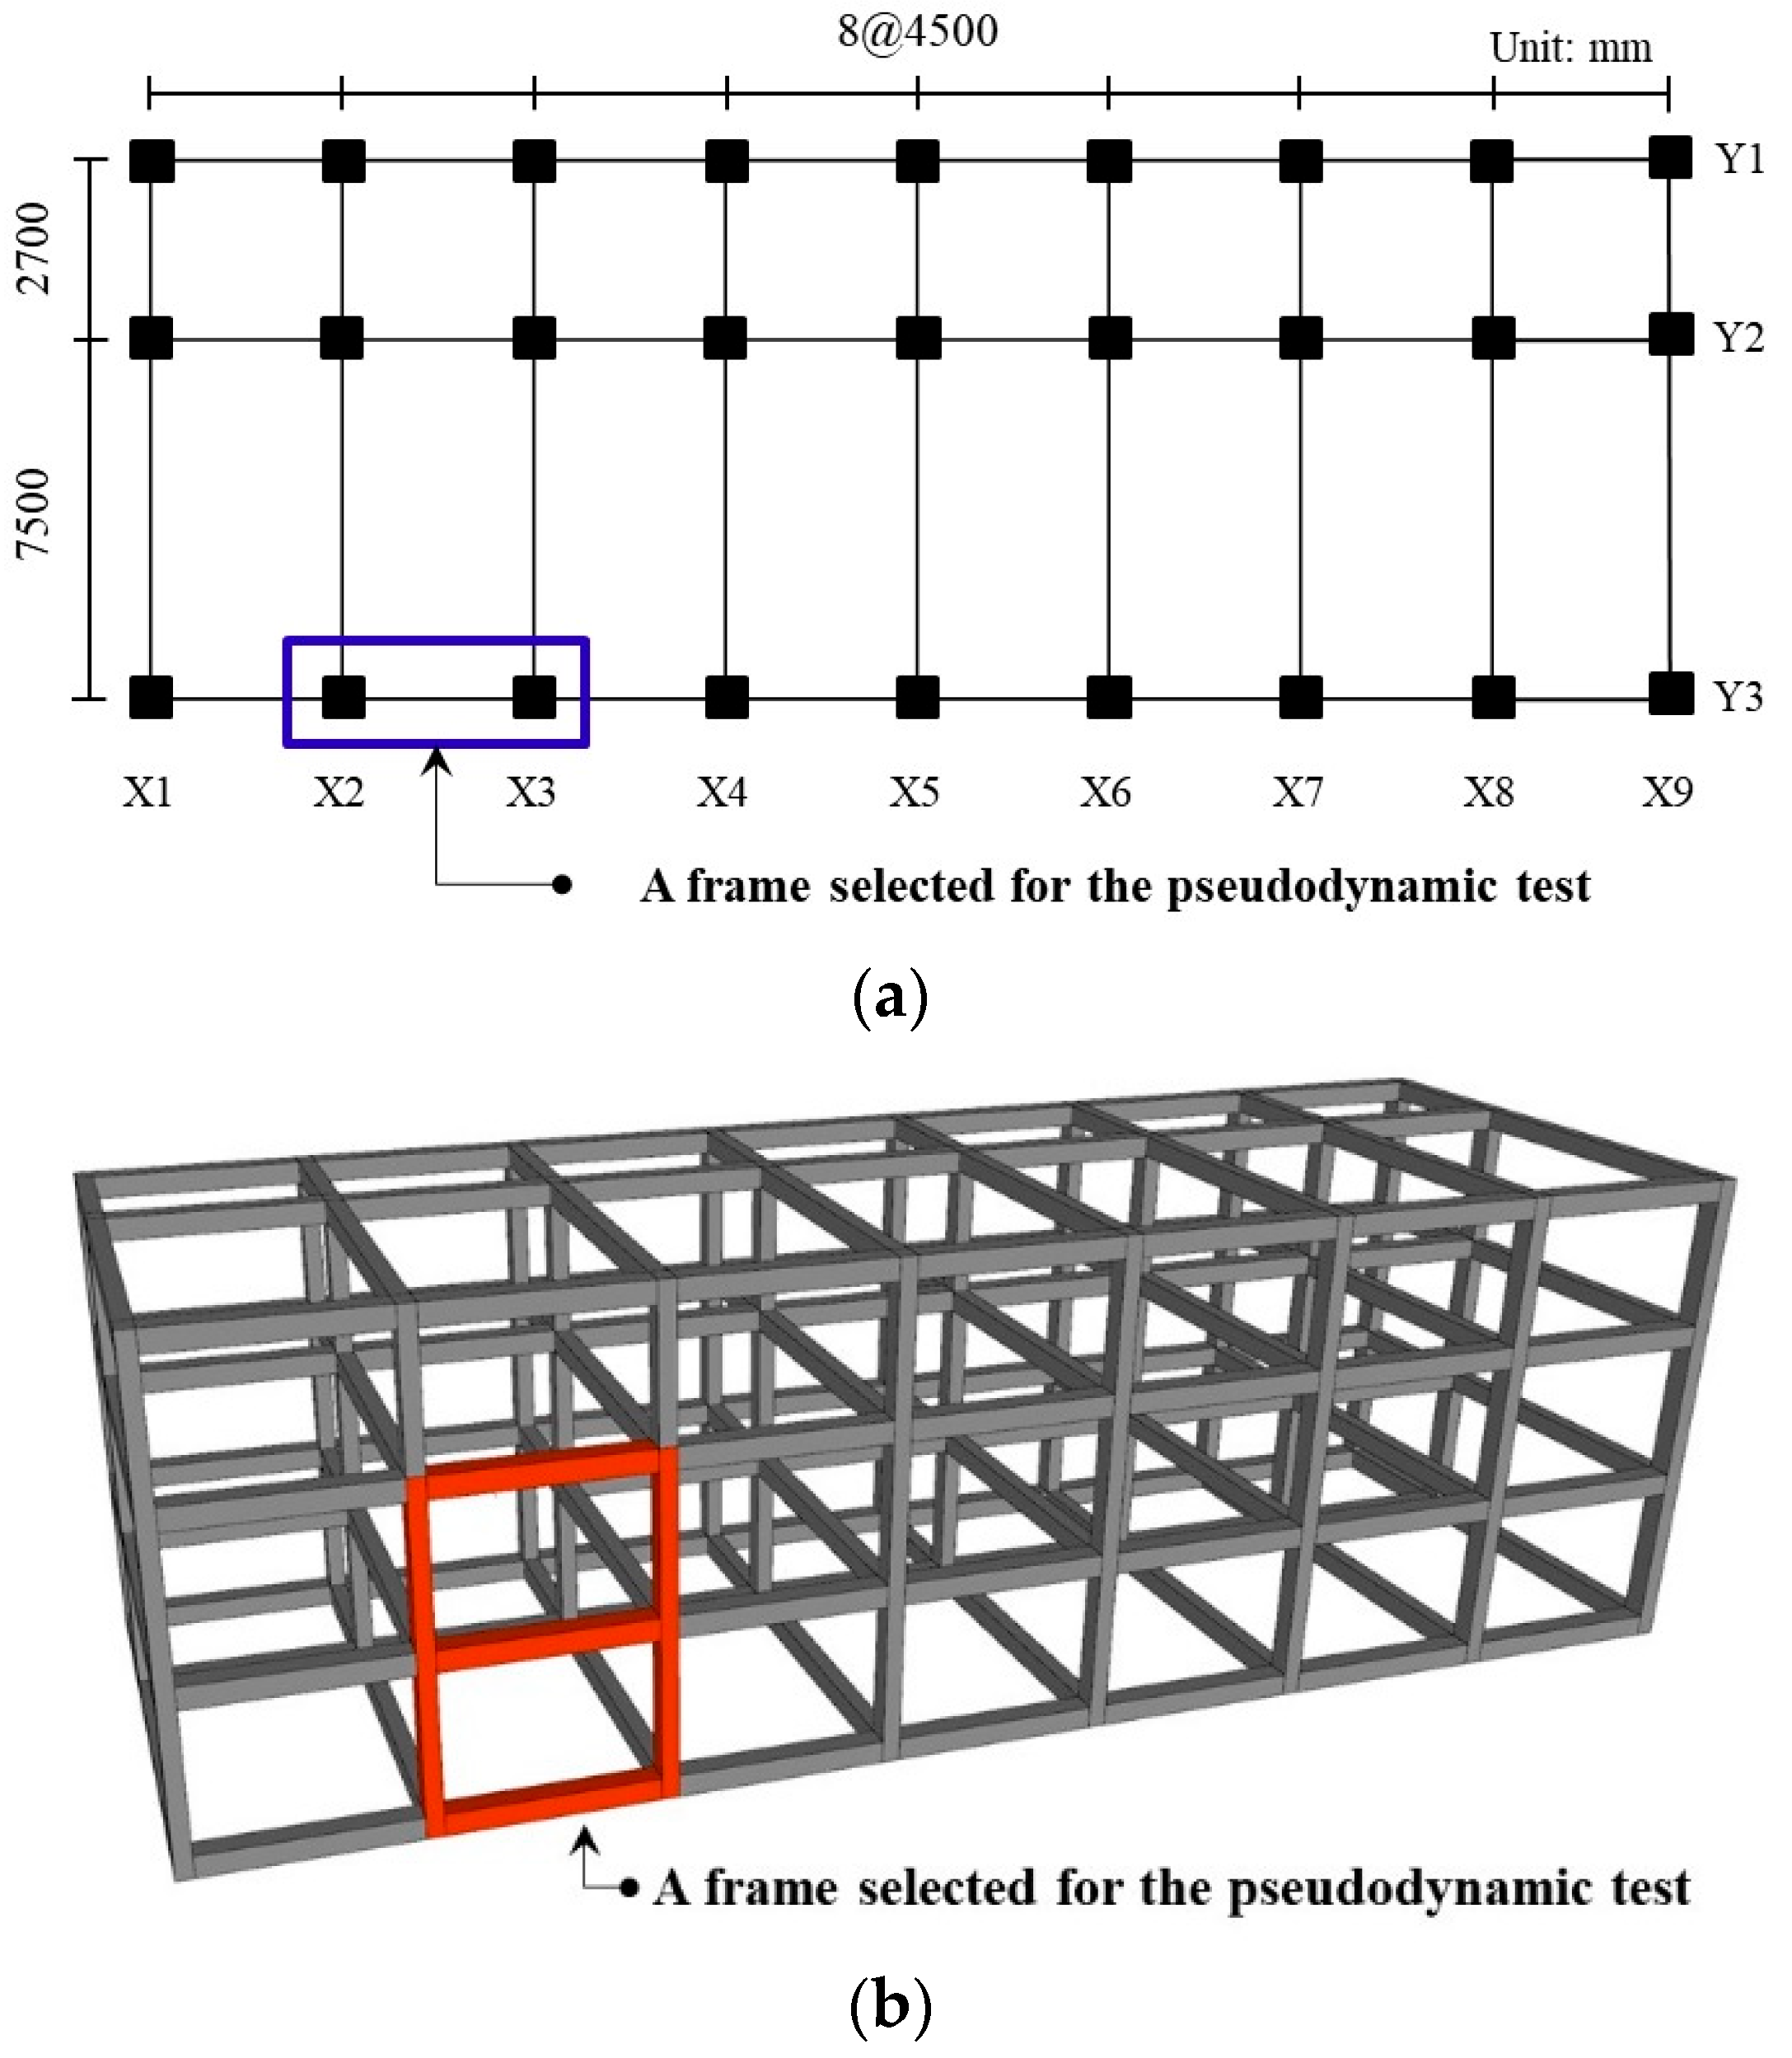
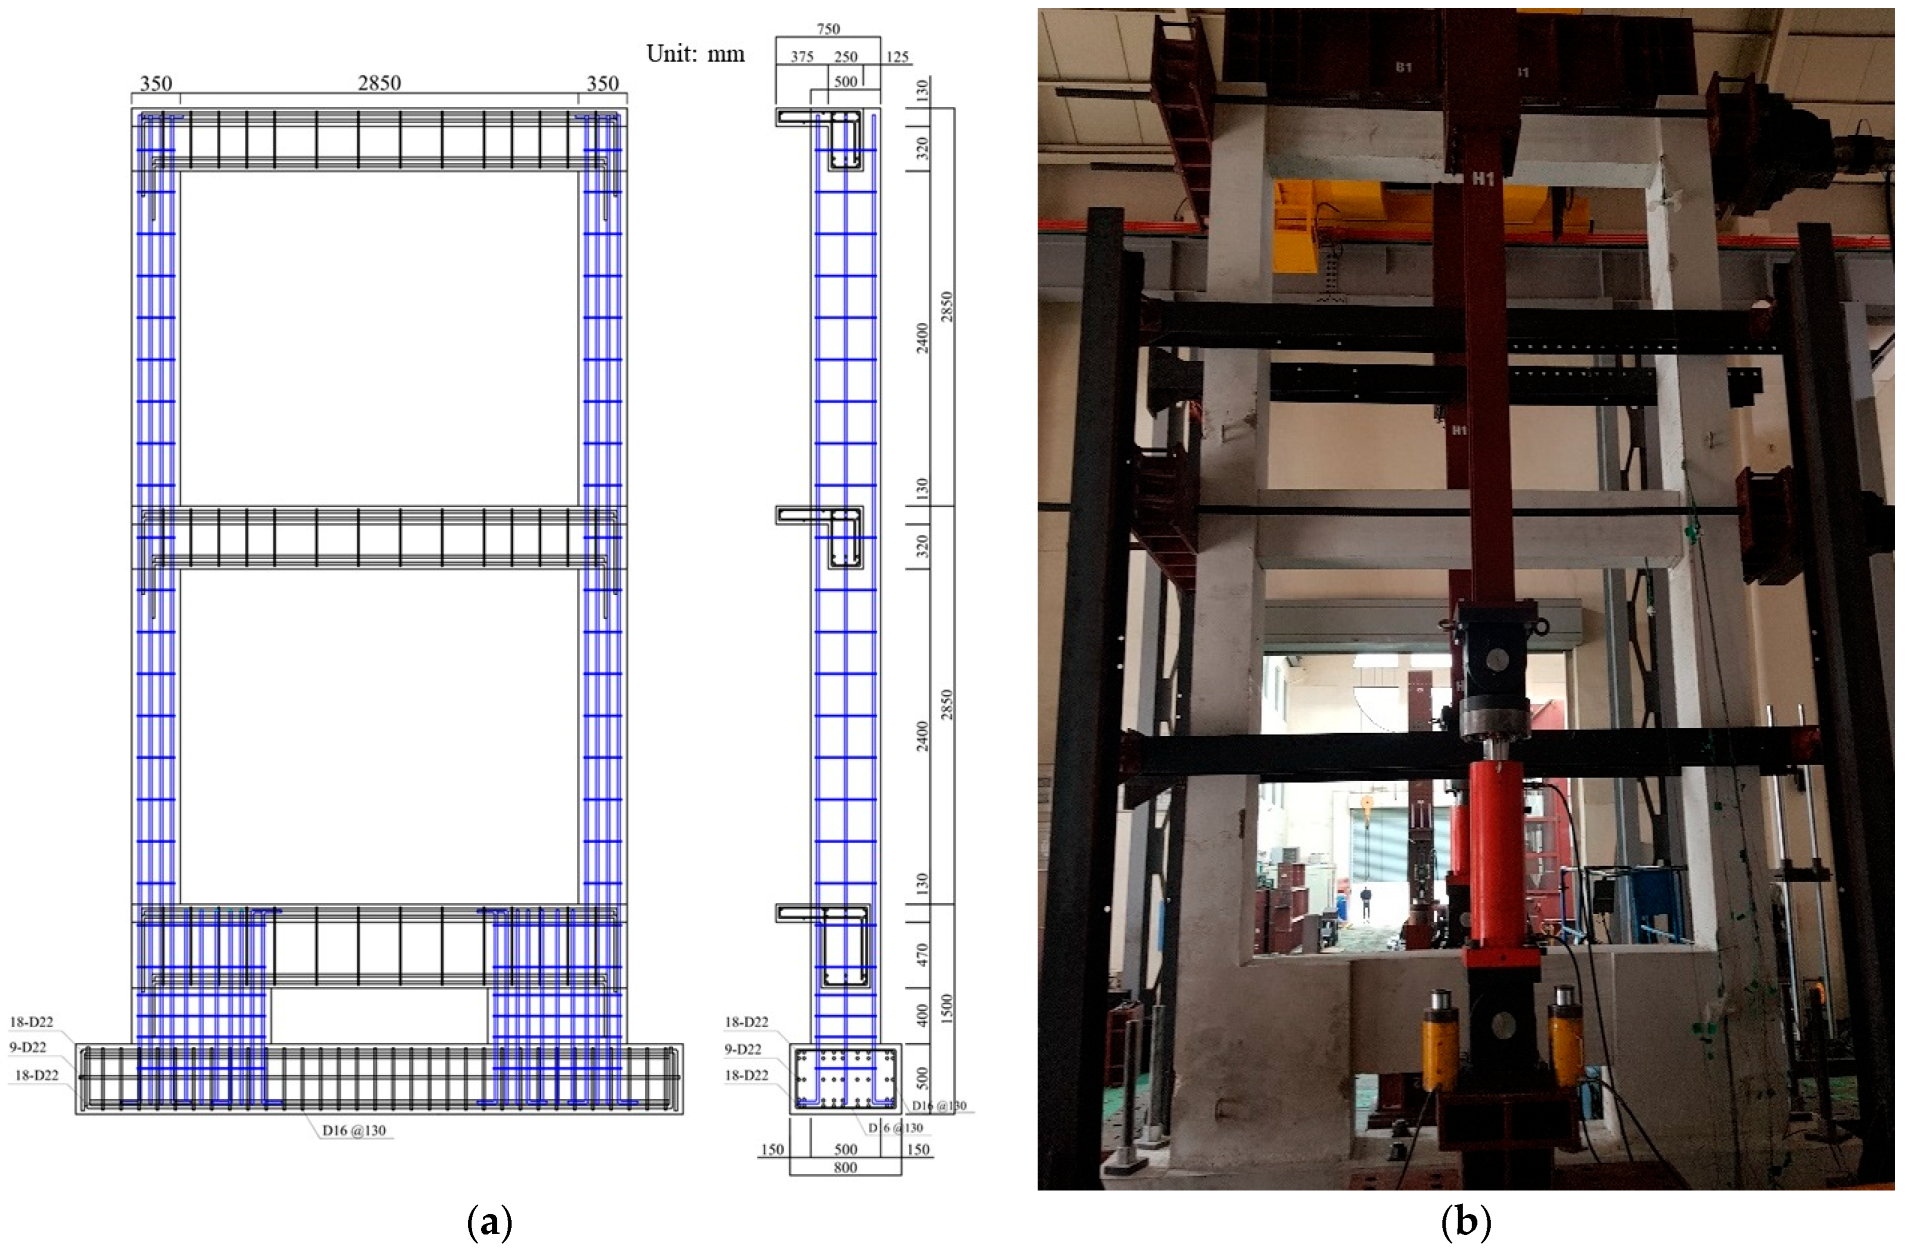
4.4. Specimen Preparation and Variables
4.5. Experiment Results and Analysis
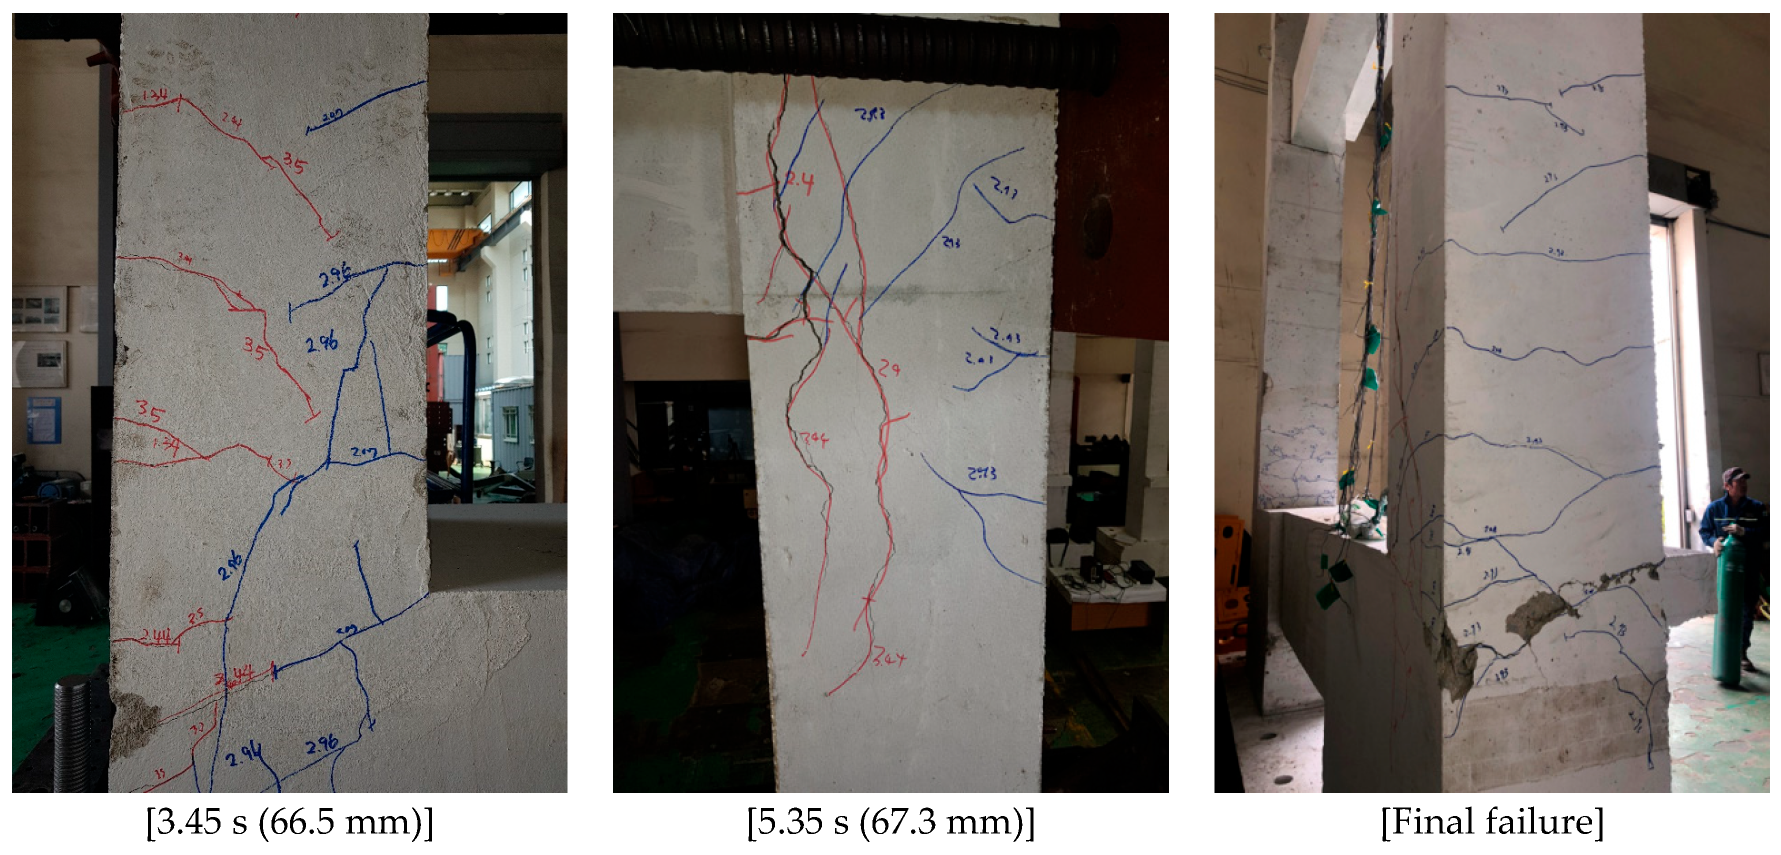
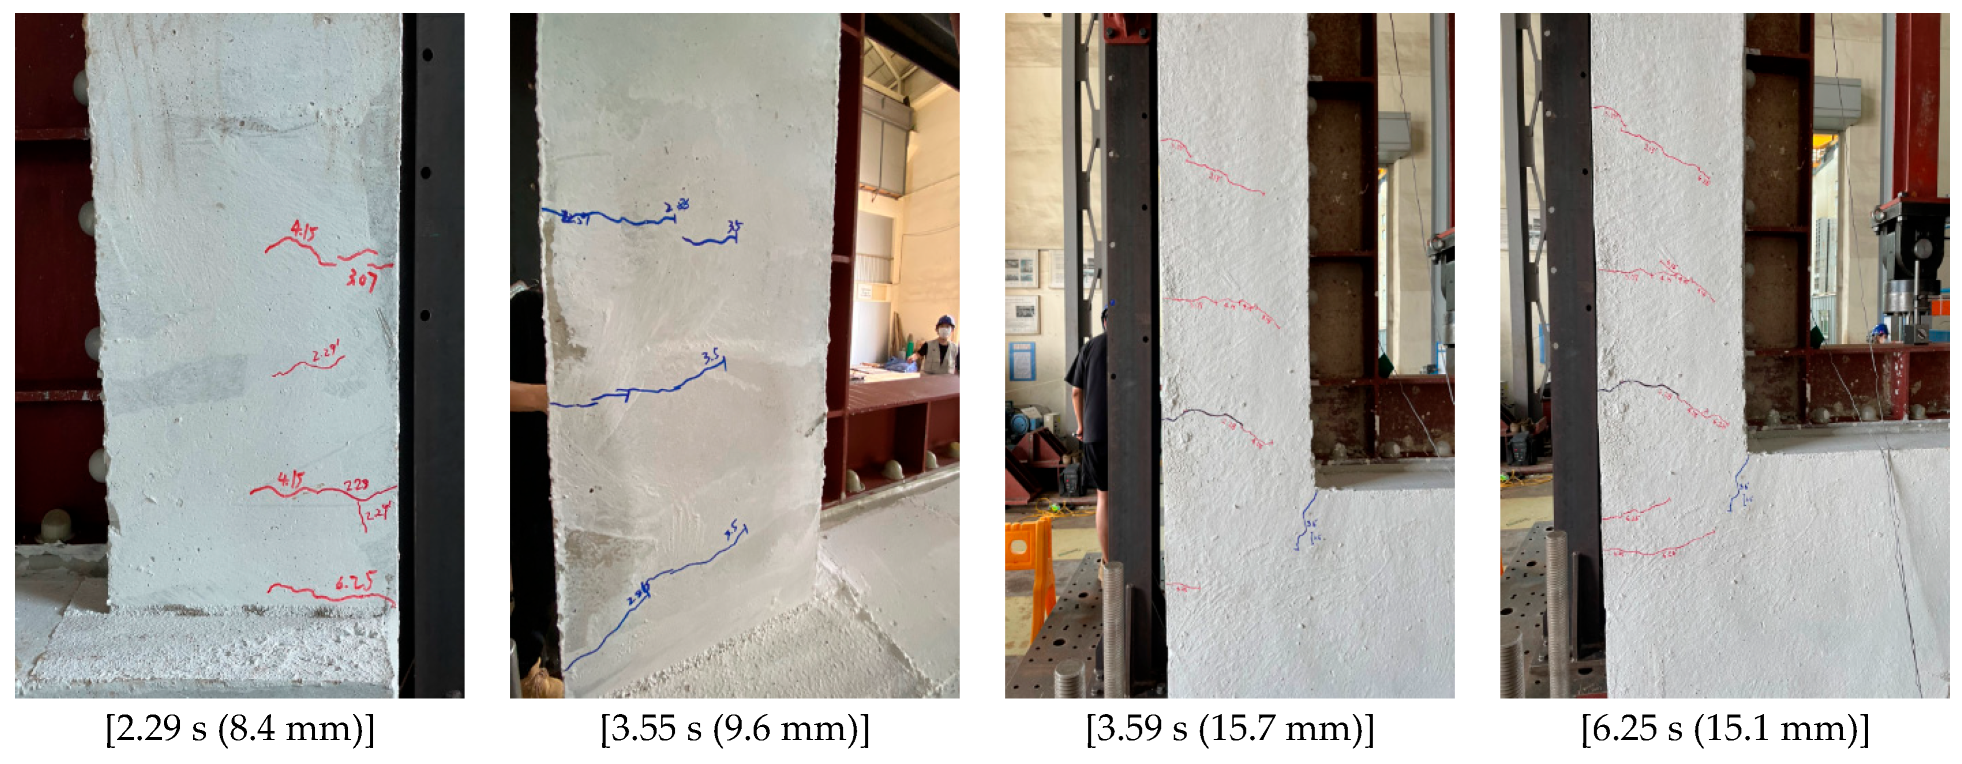
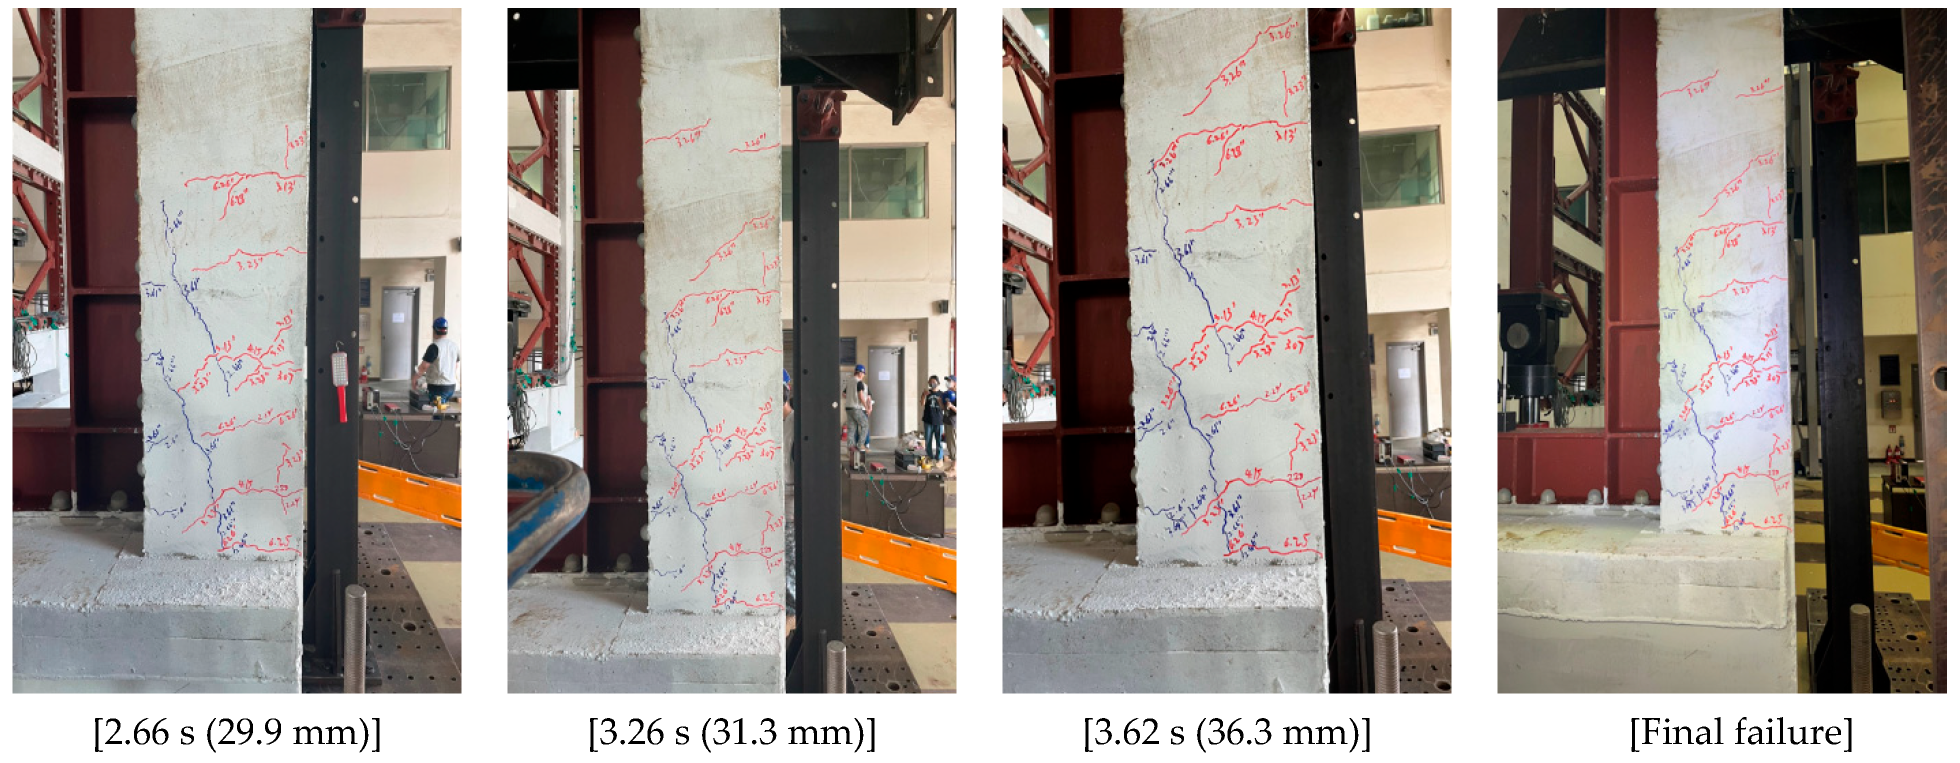
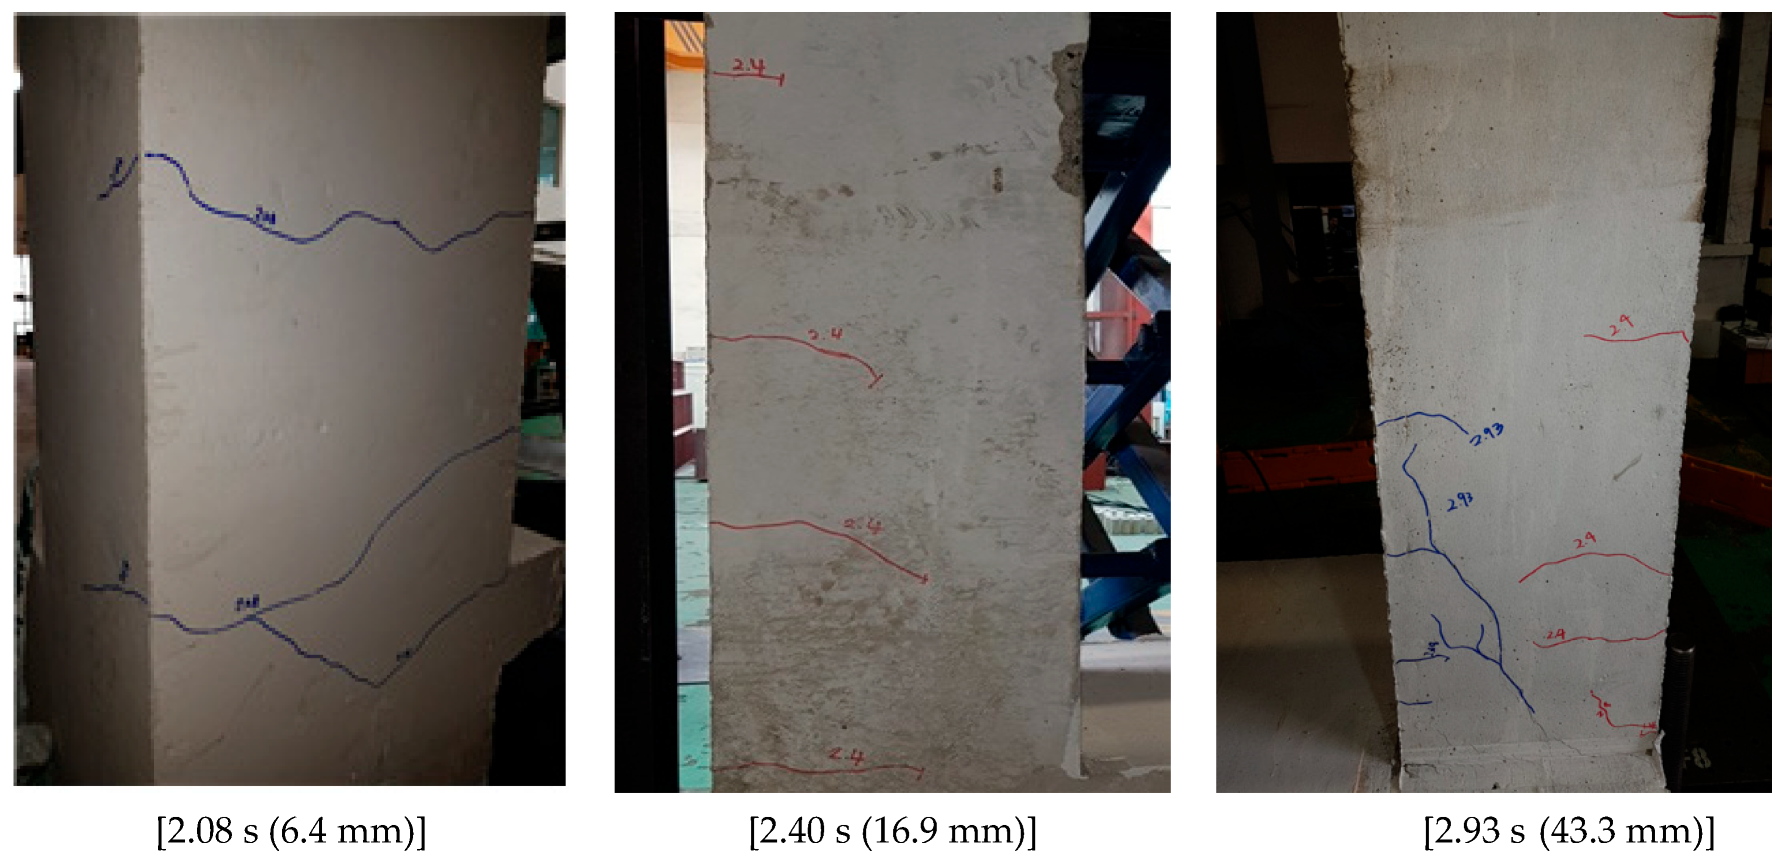
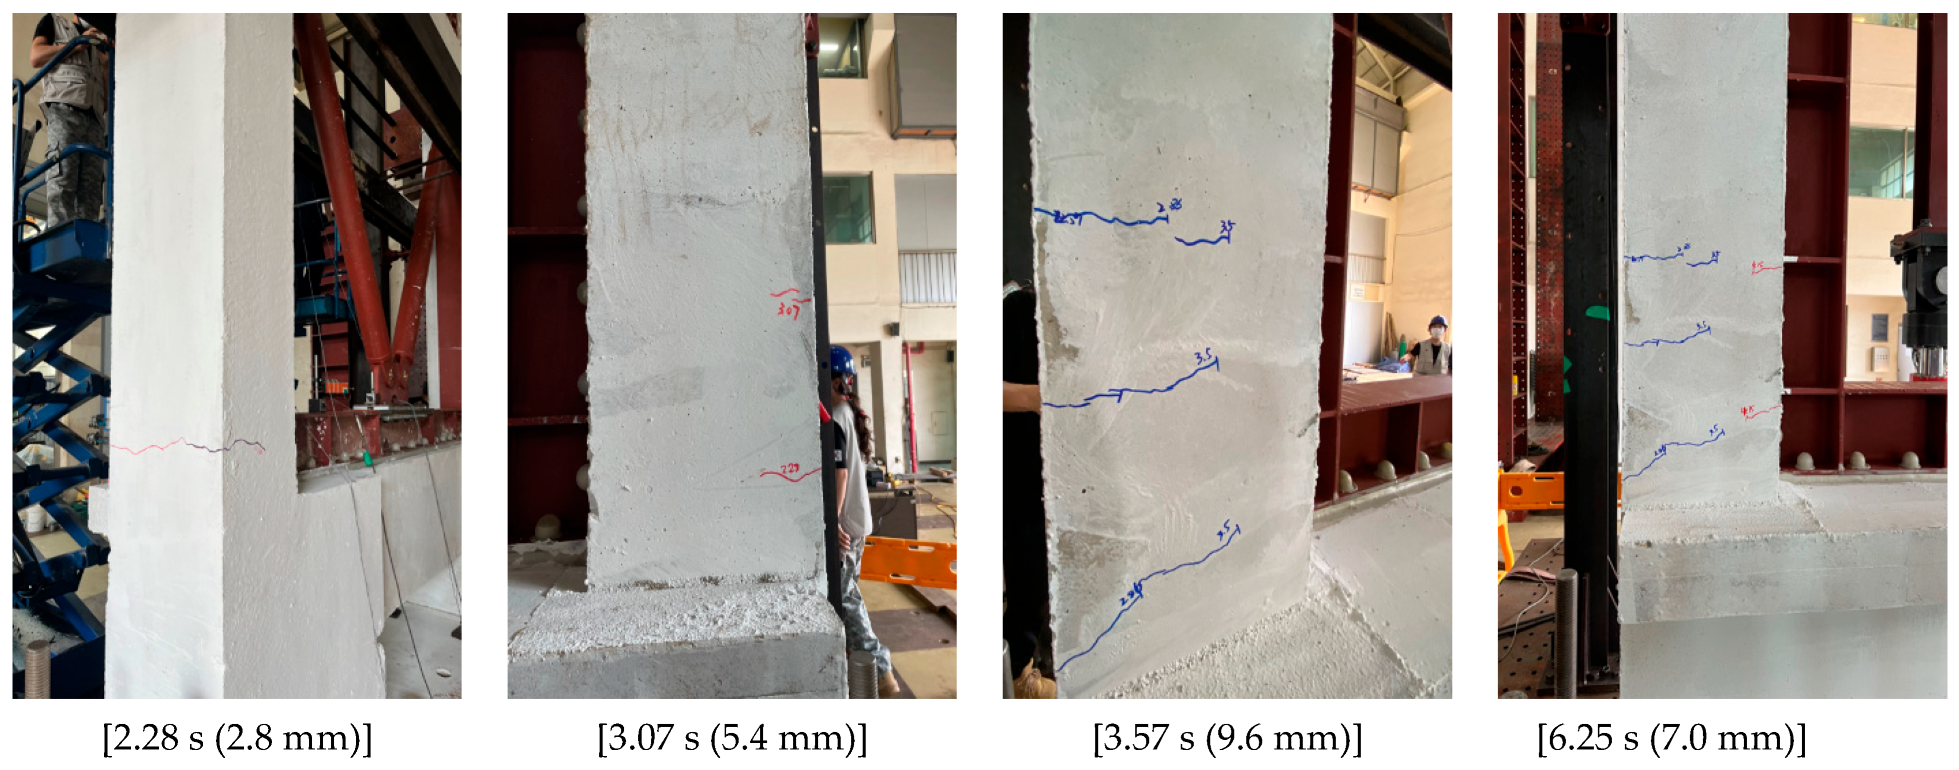
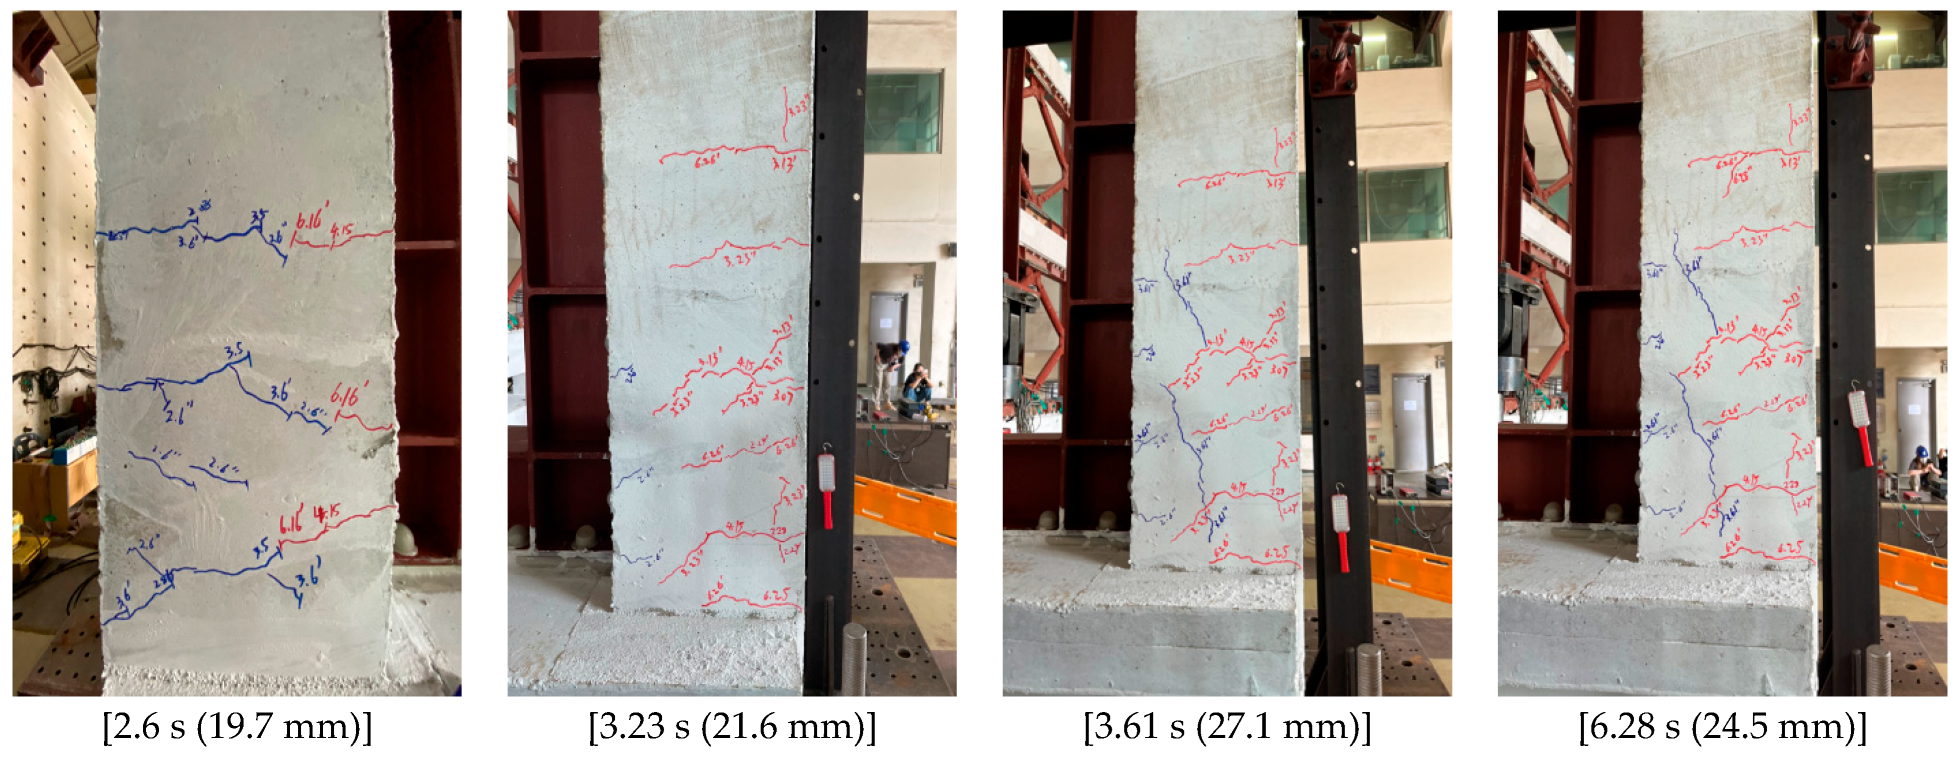
4.5.1. Crack and Failure Geometry
- (1)
- PD-RC
- (2)
- PD-LLFD-V
4.5.2. Maximum Seismic Response Load and Displacement
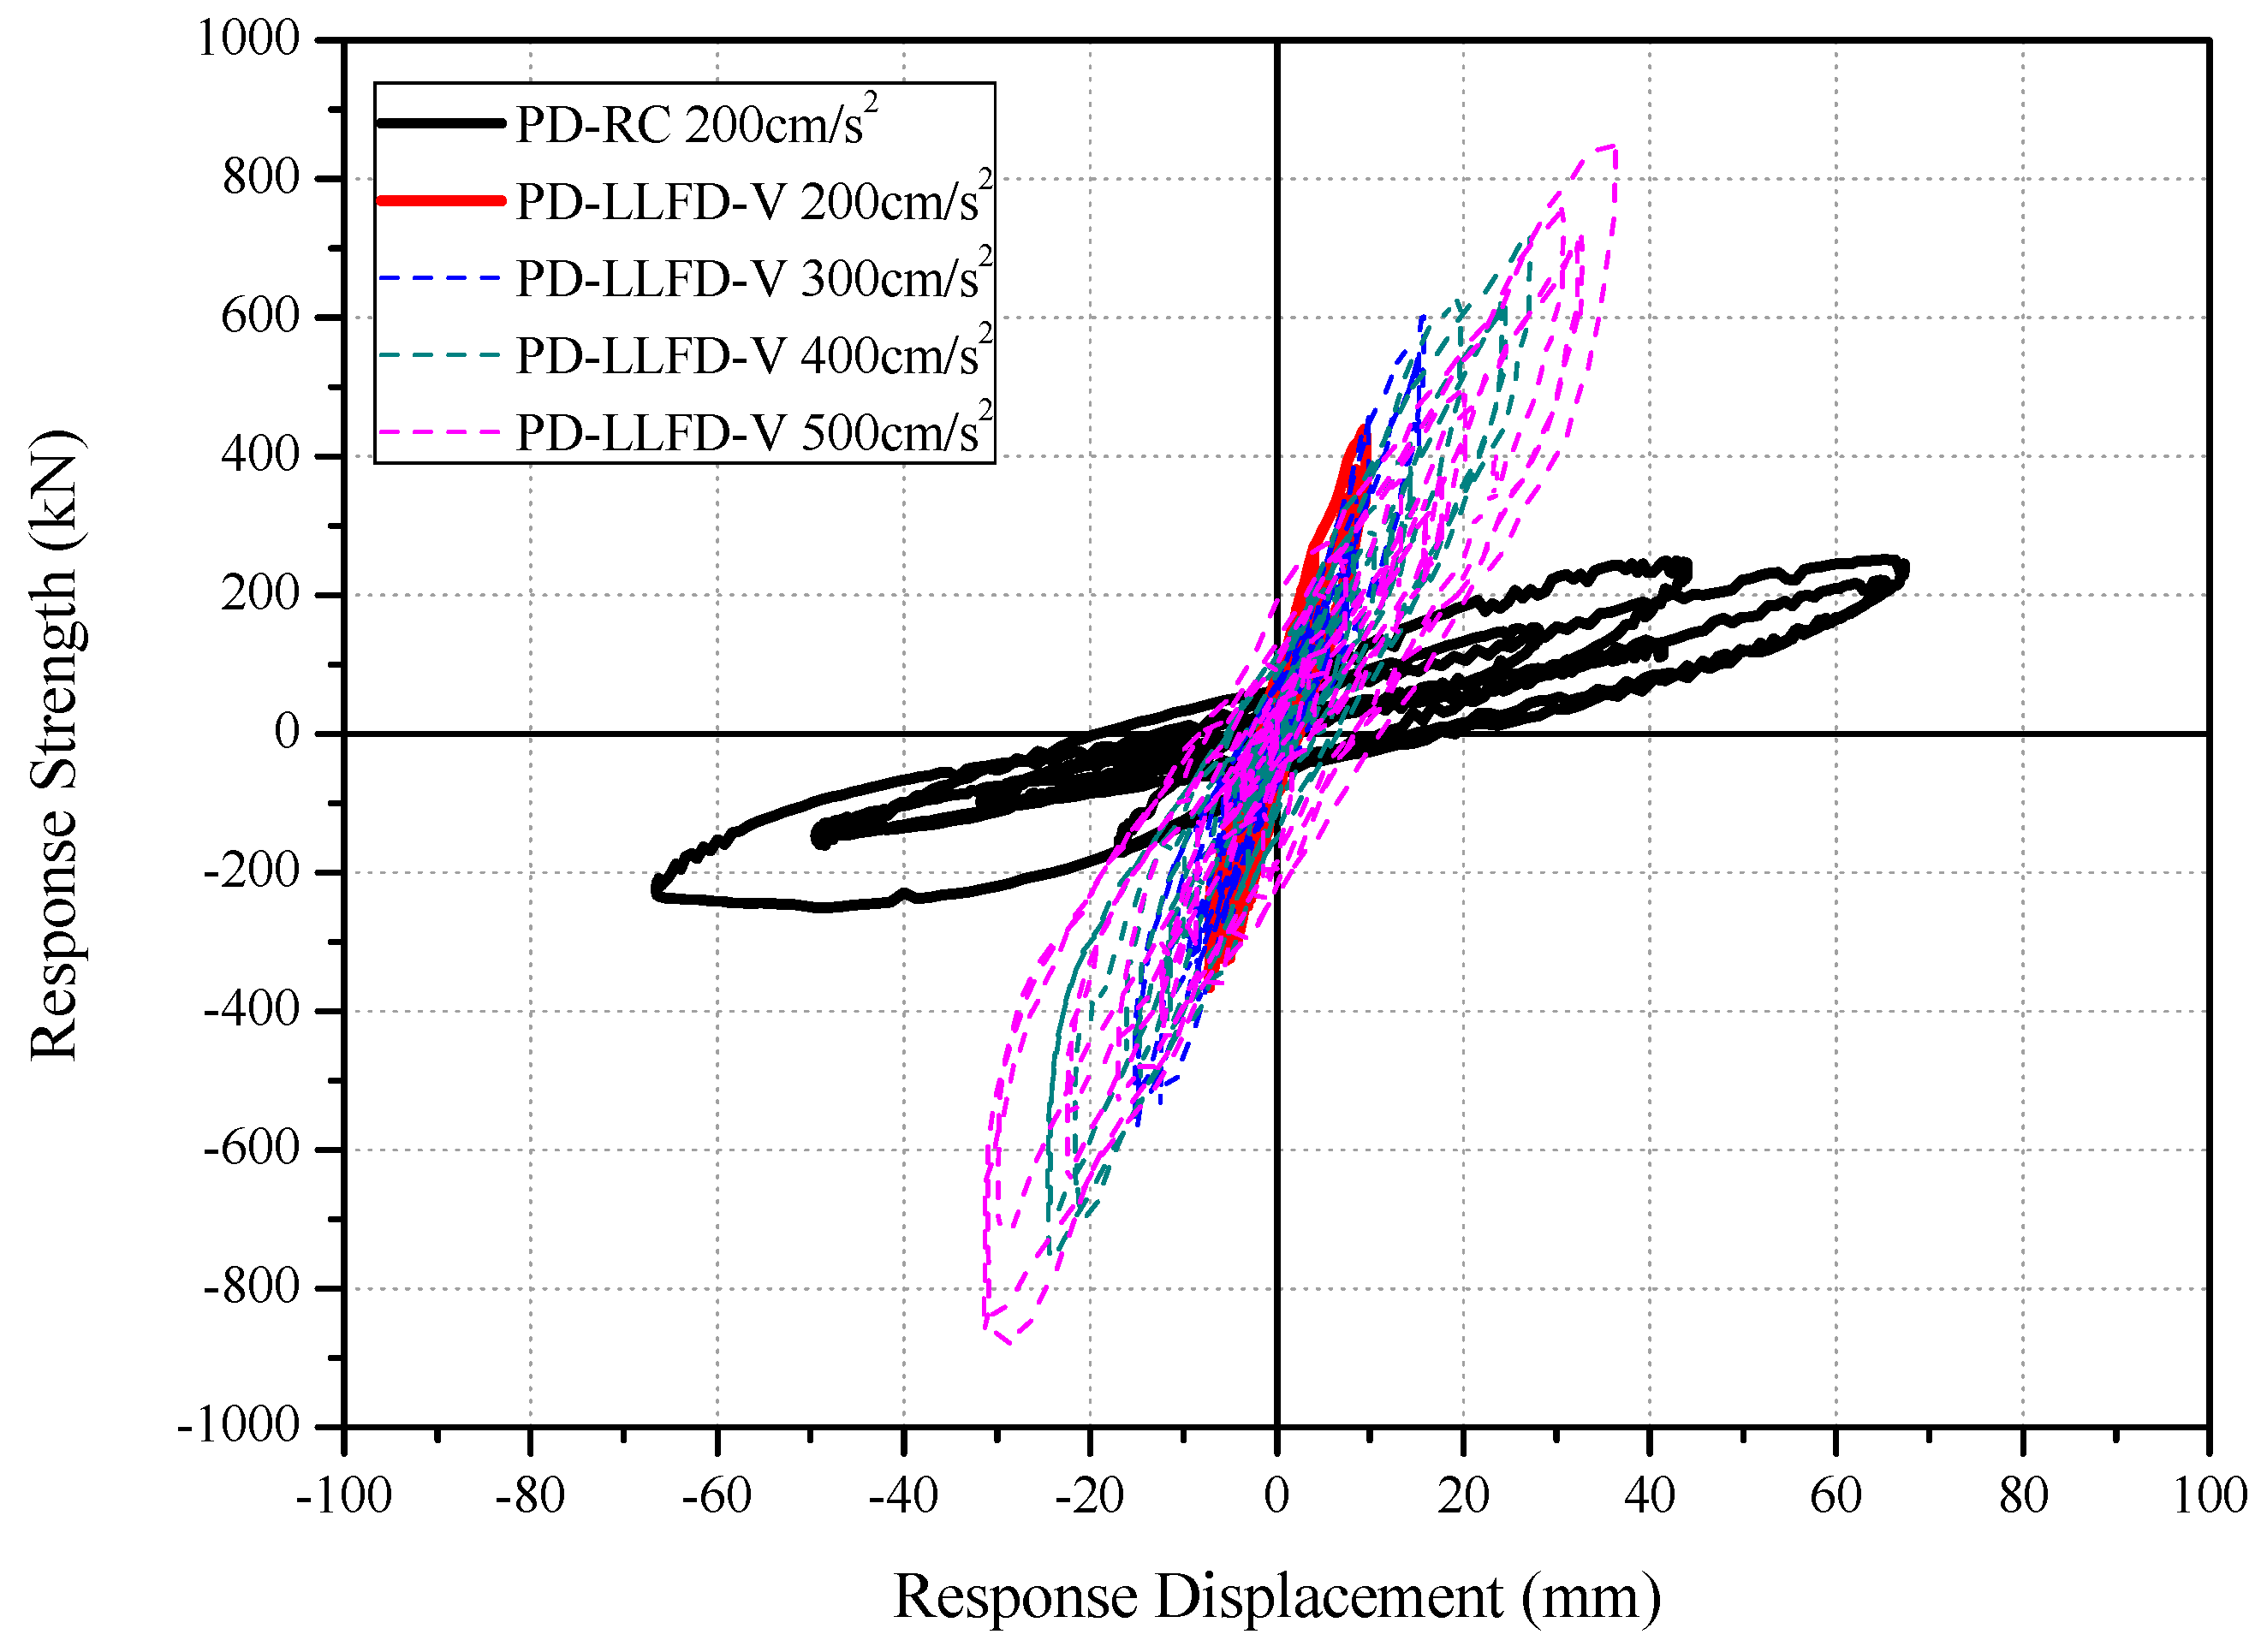
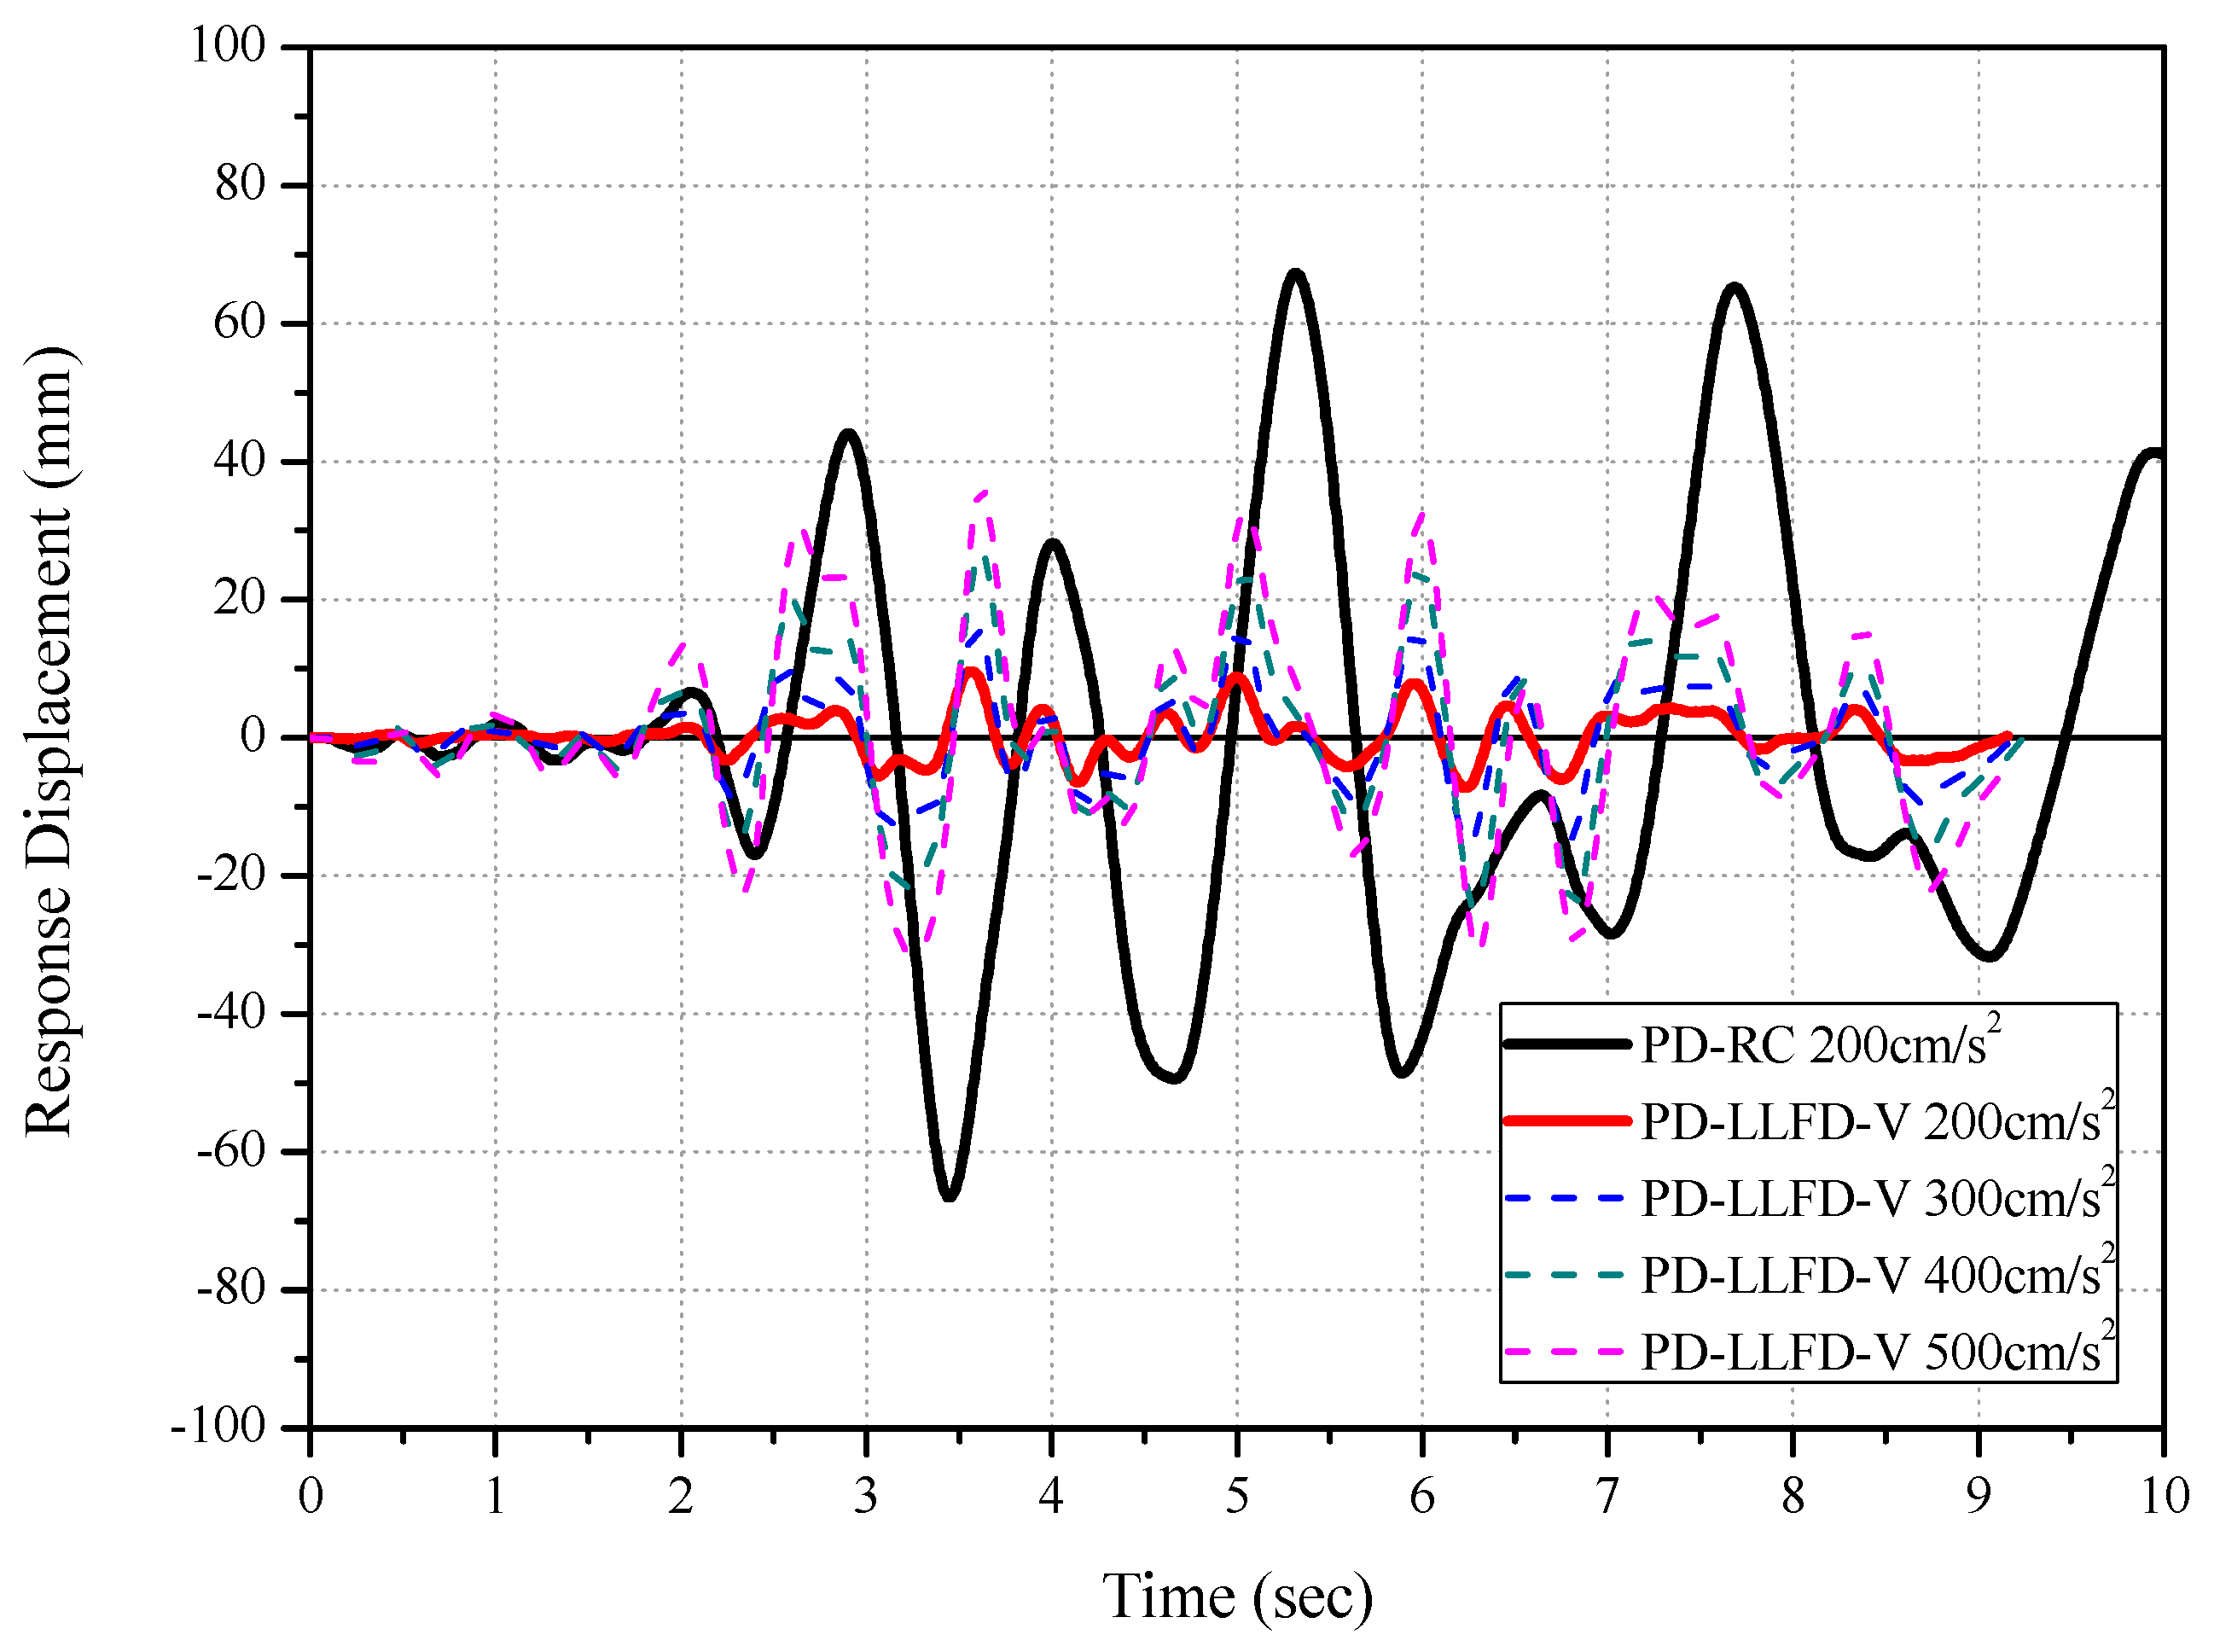
4.5.3. Analysis of the Load–Displacement and Displacement–Time History Results
5. Comparison of the Pseudo-Dynamic Test and Non-Linear Dynamic Analysis Results
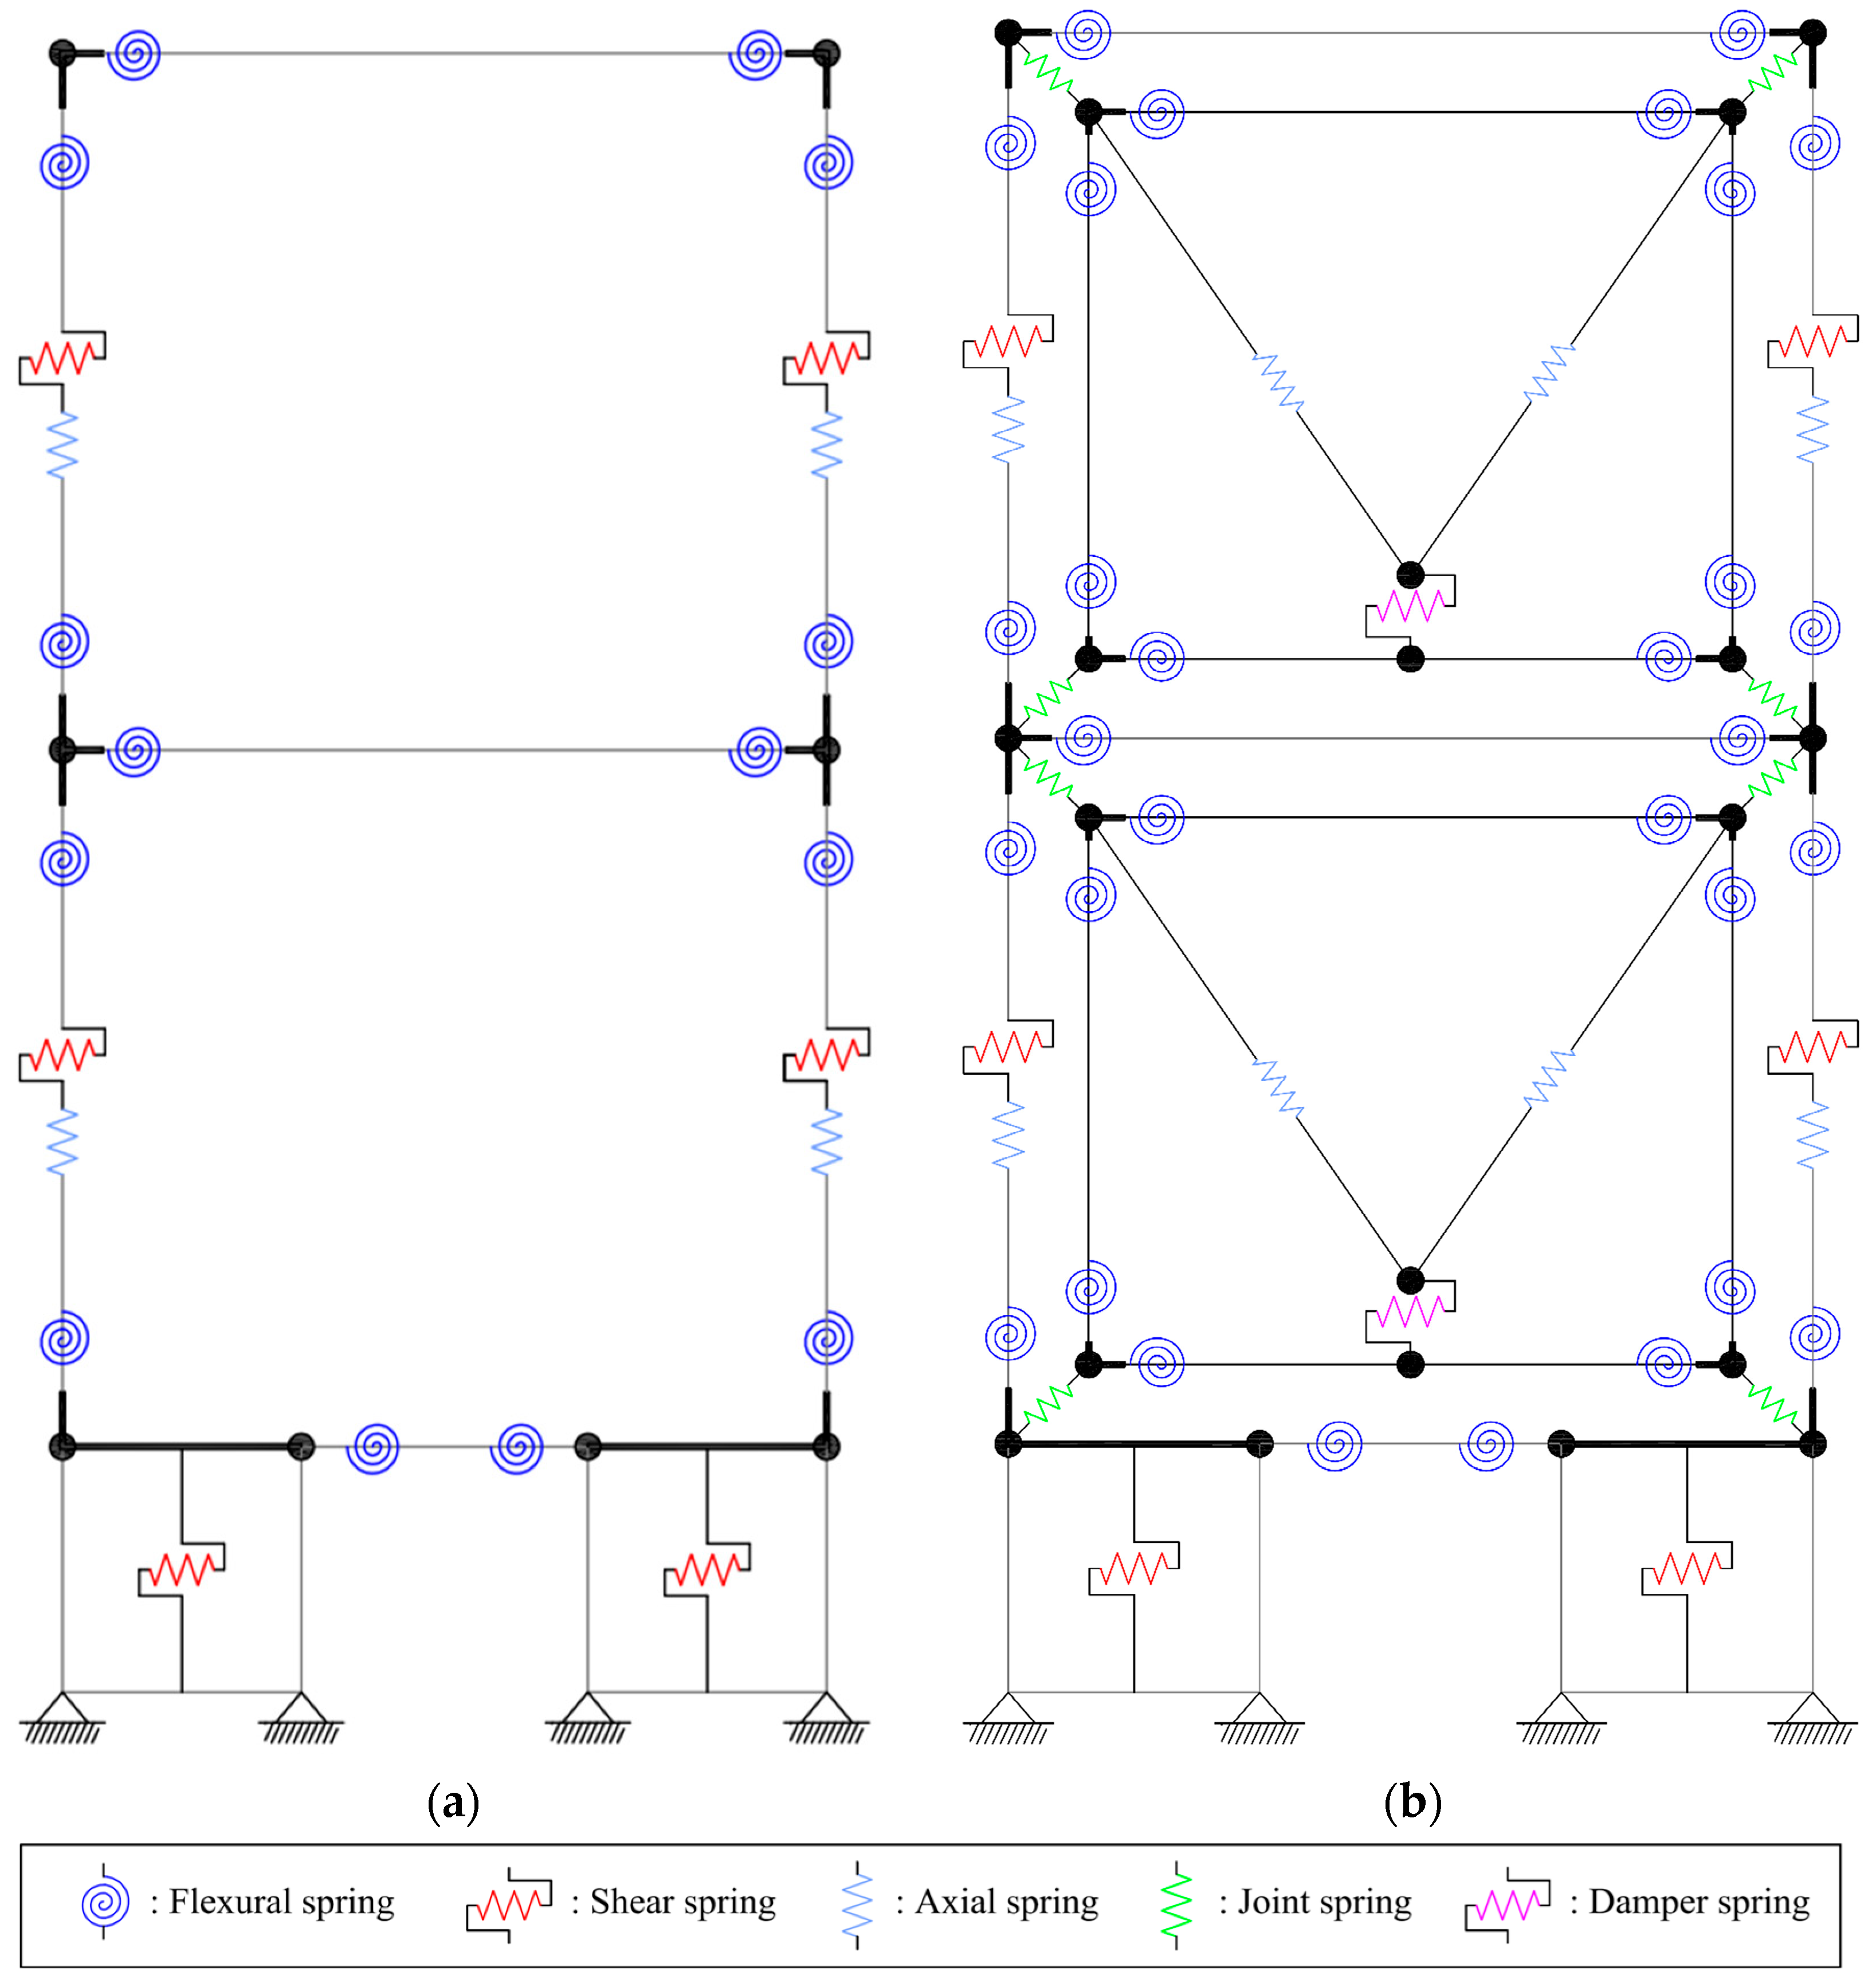
5.1. Non-Linear Dynamic Analysis Overview
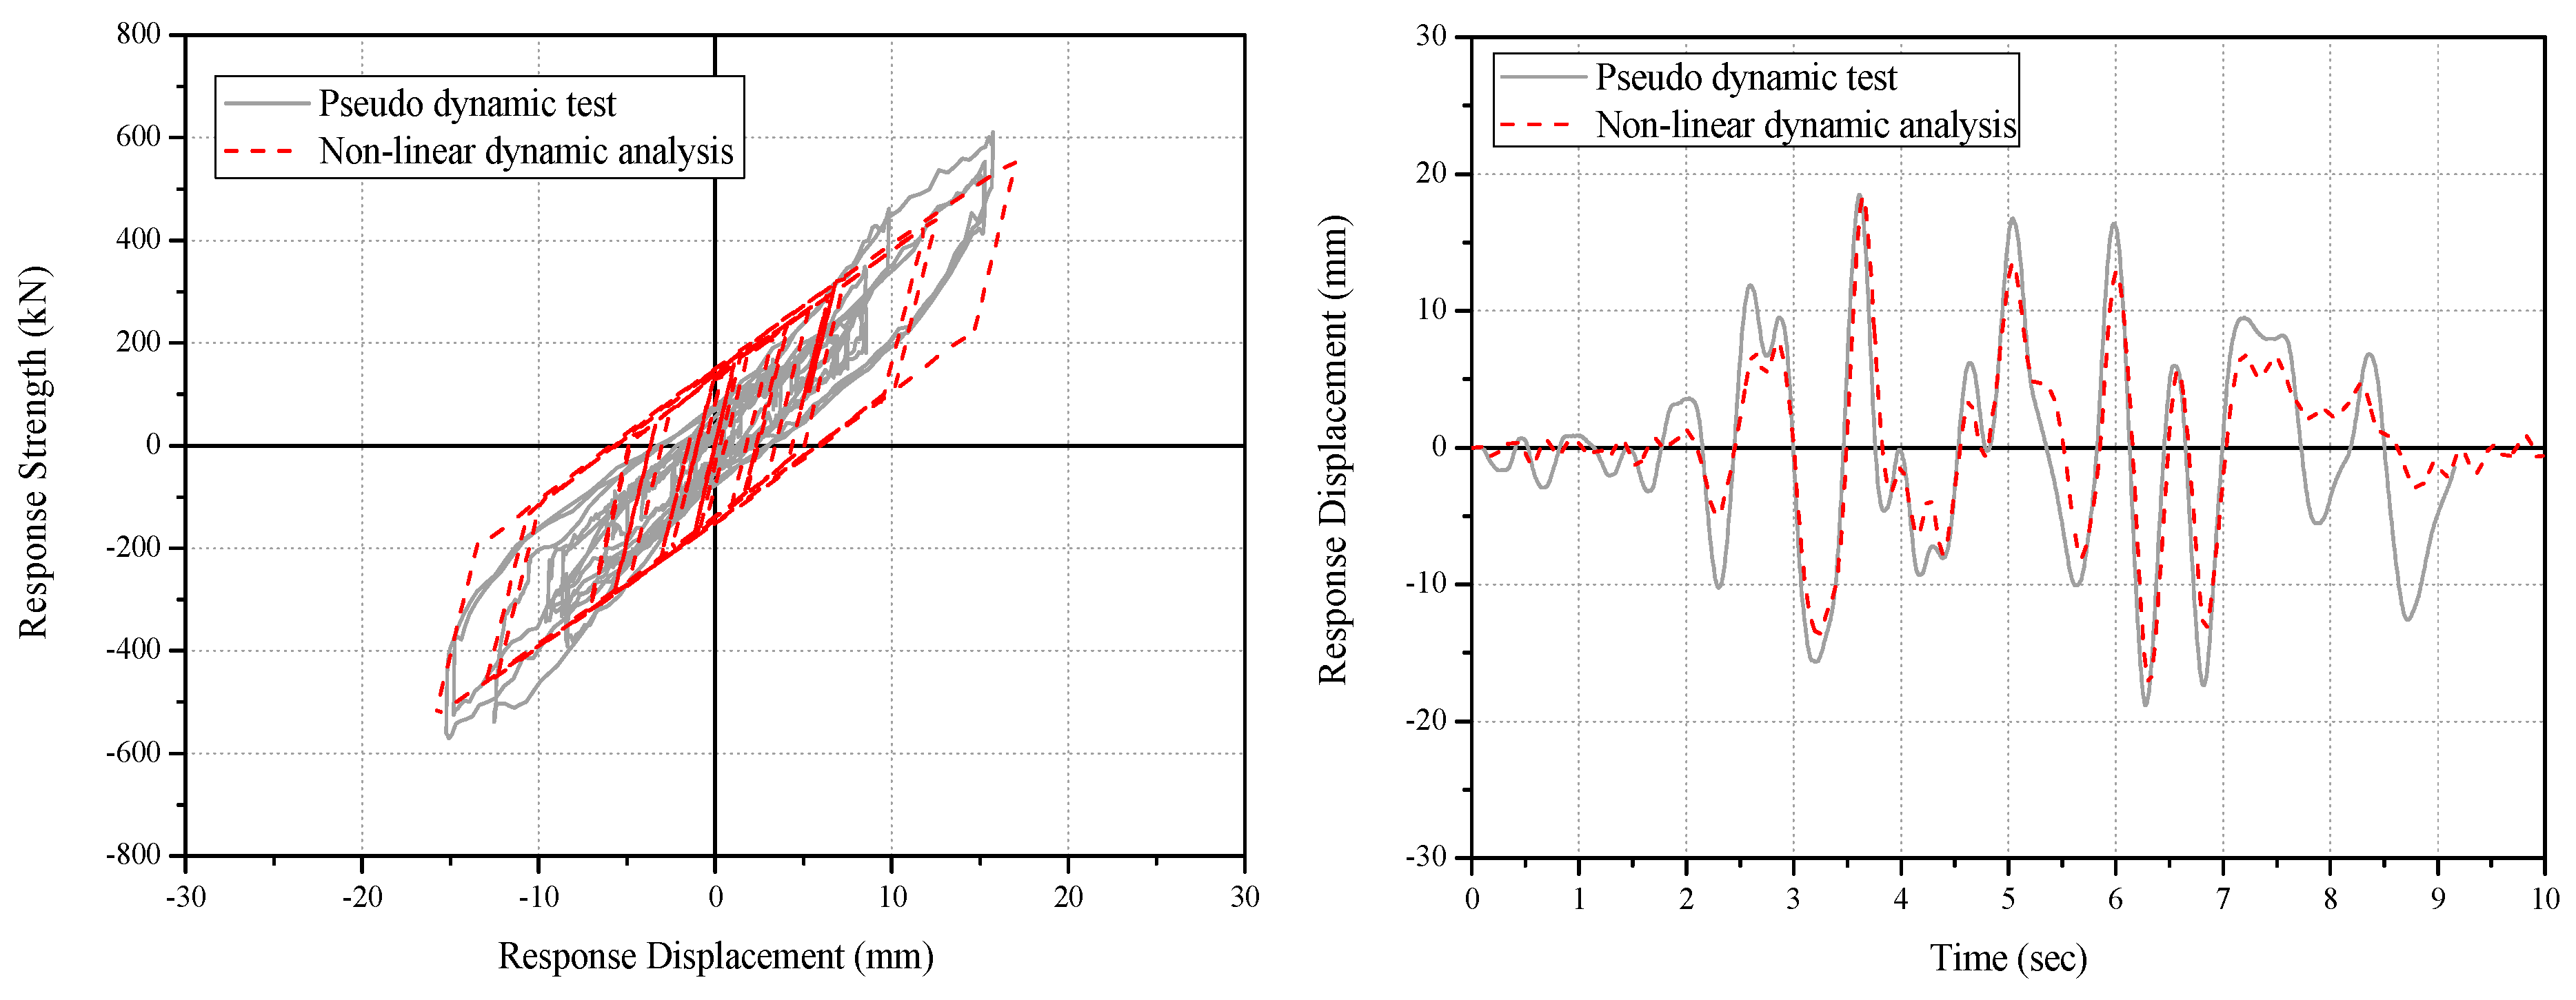
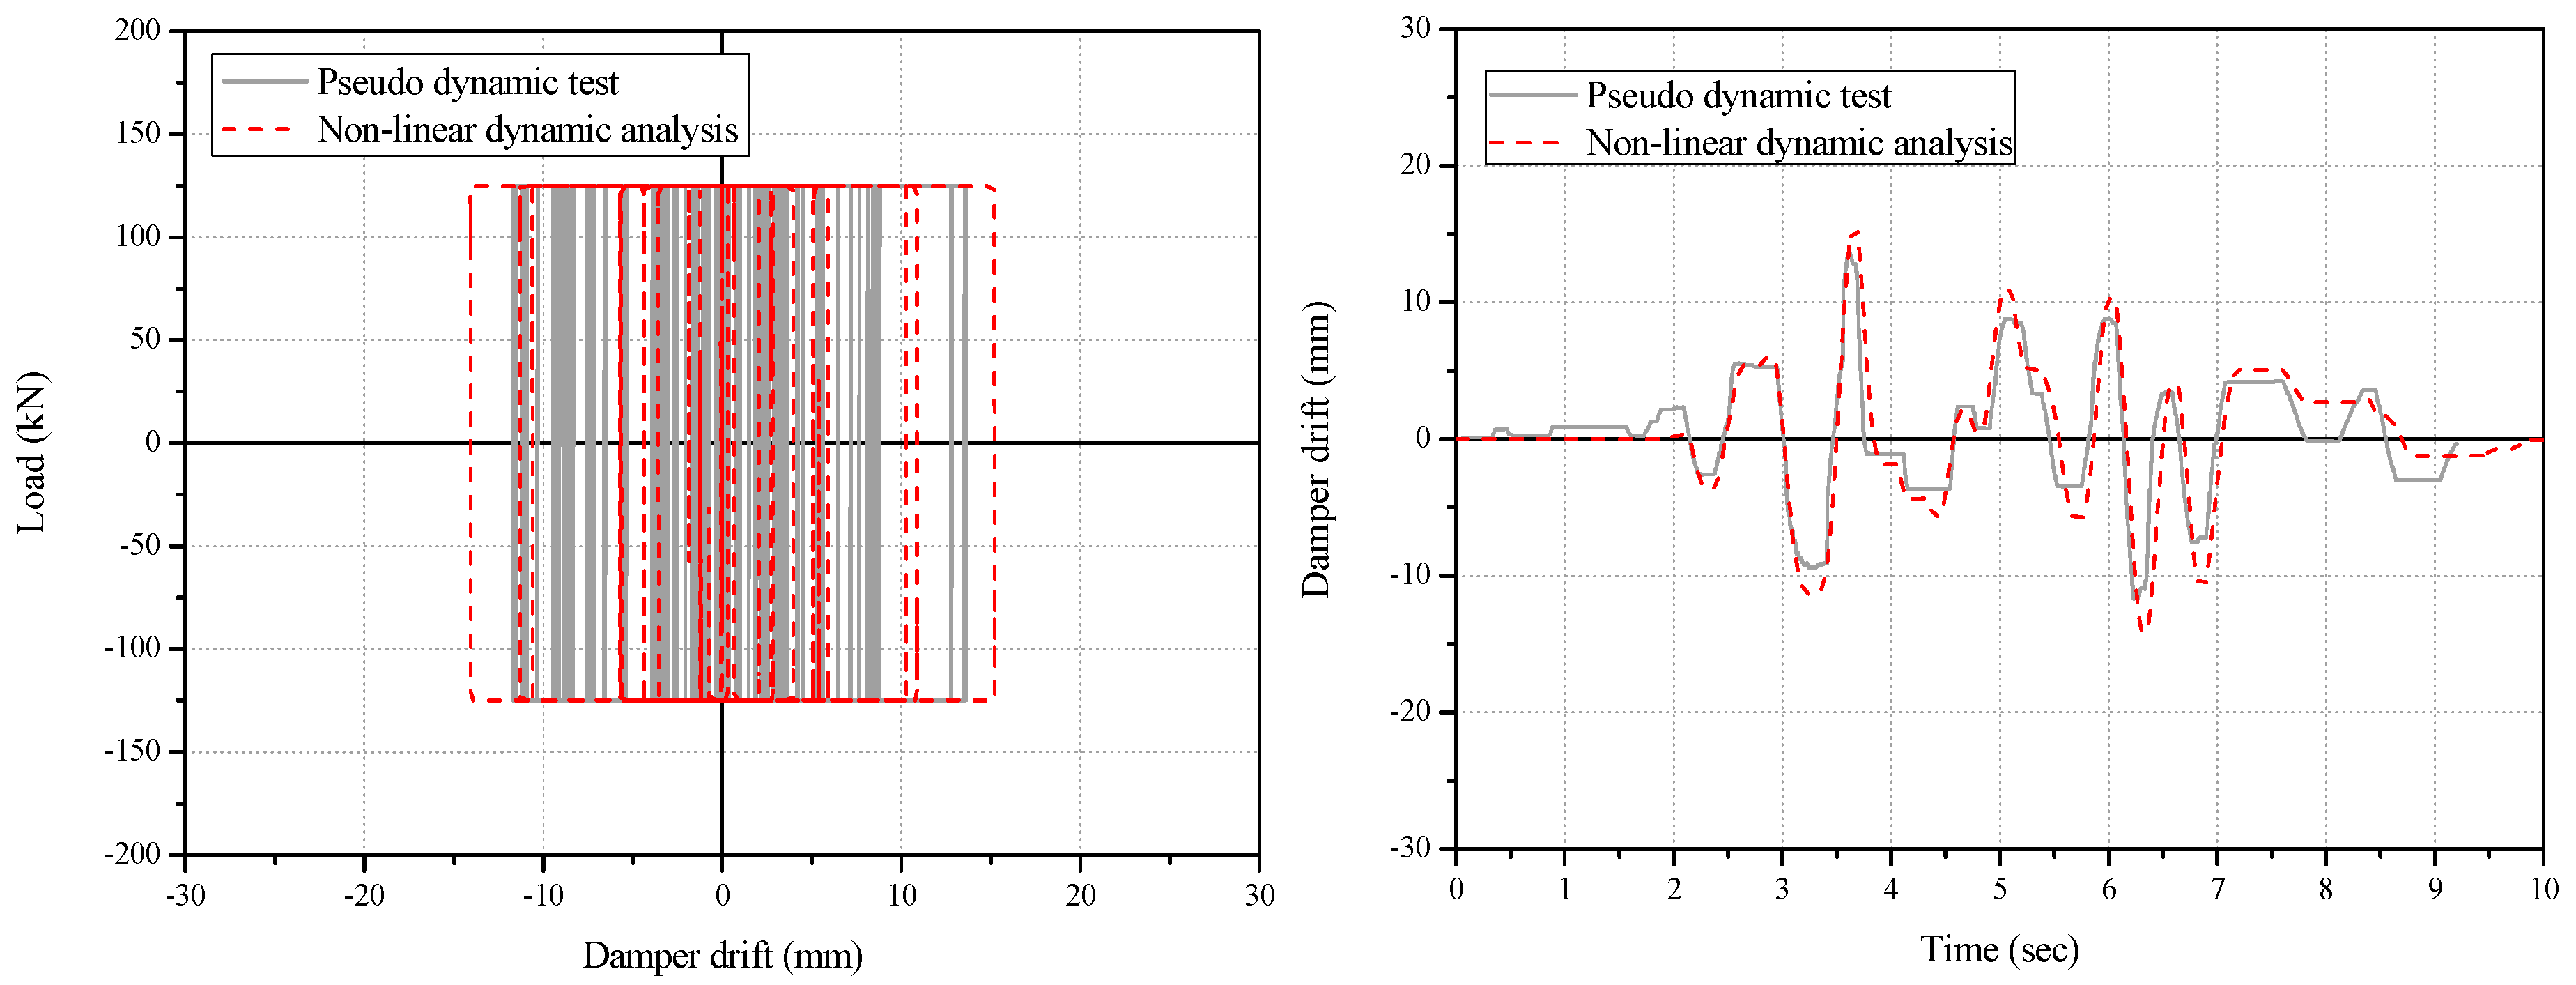
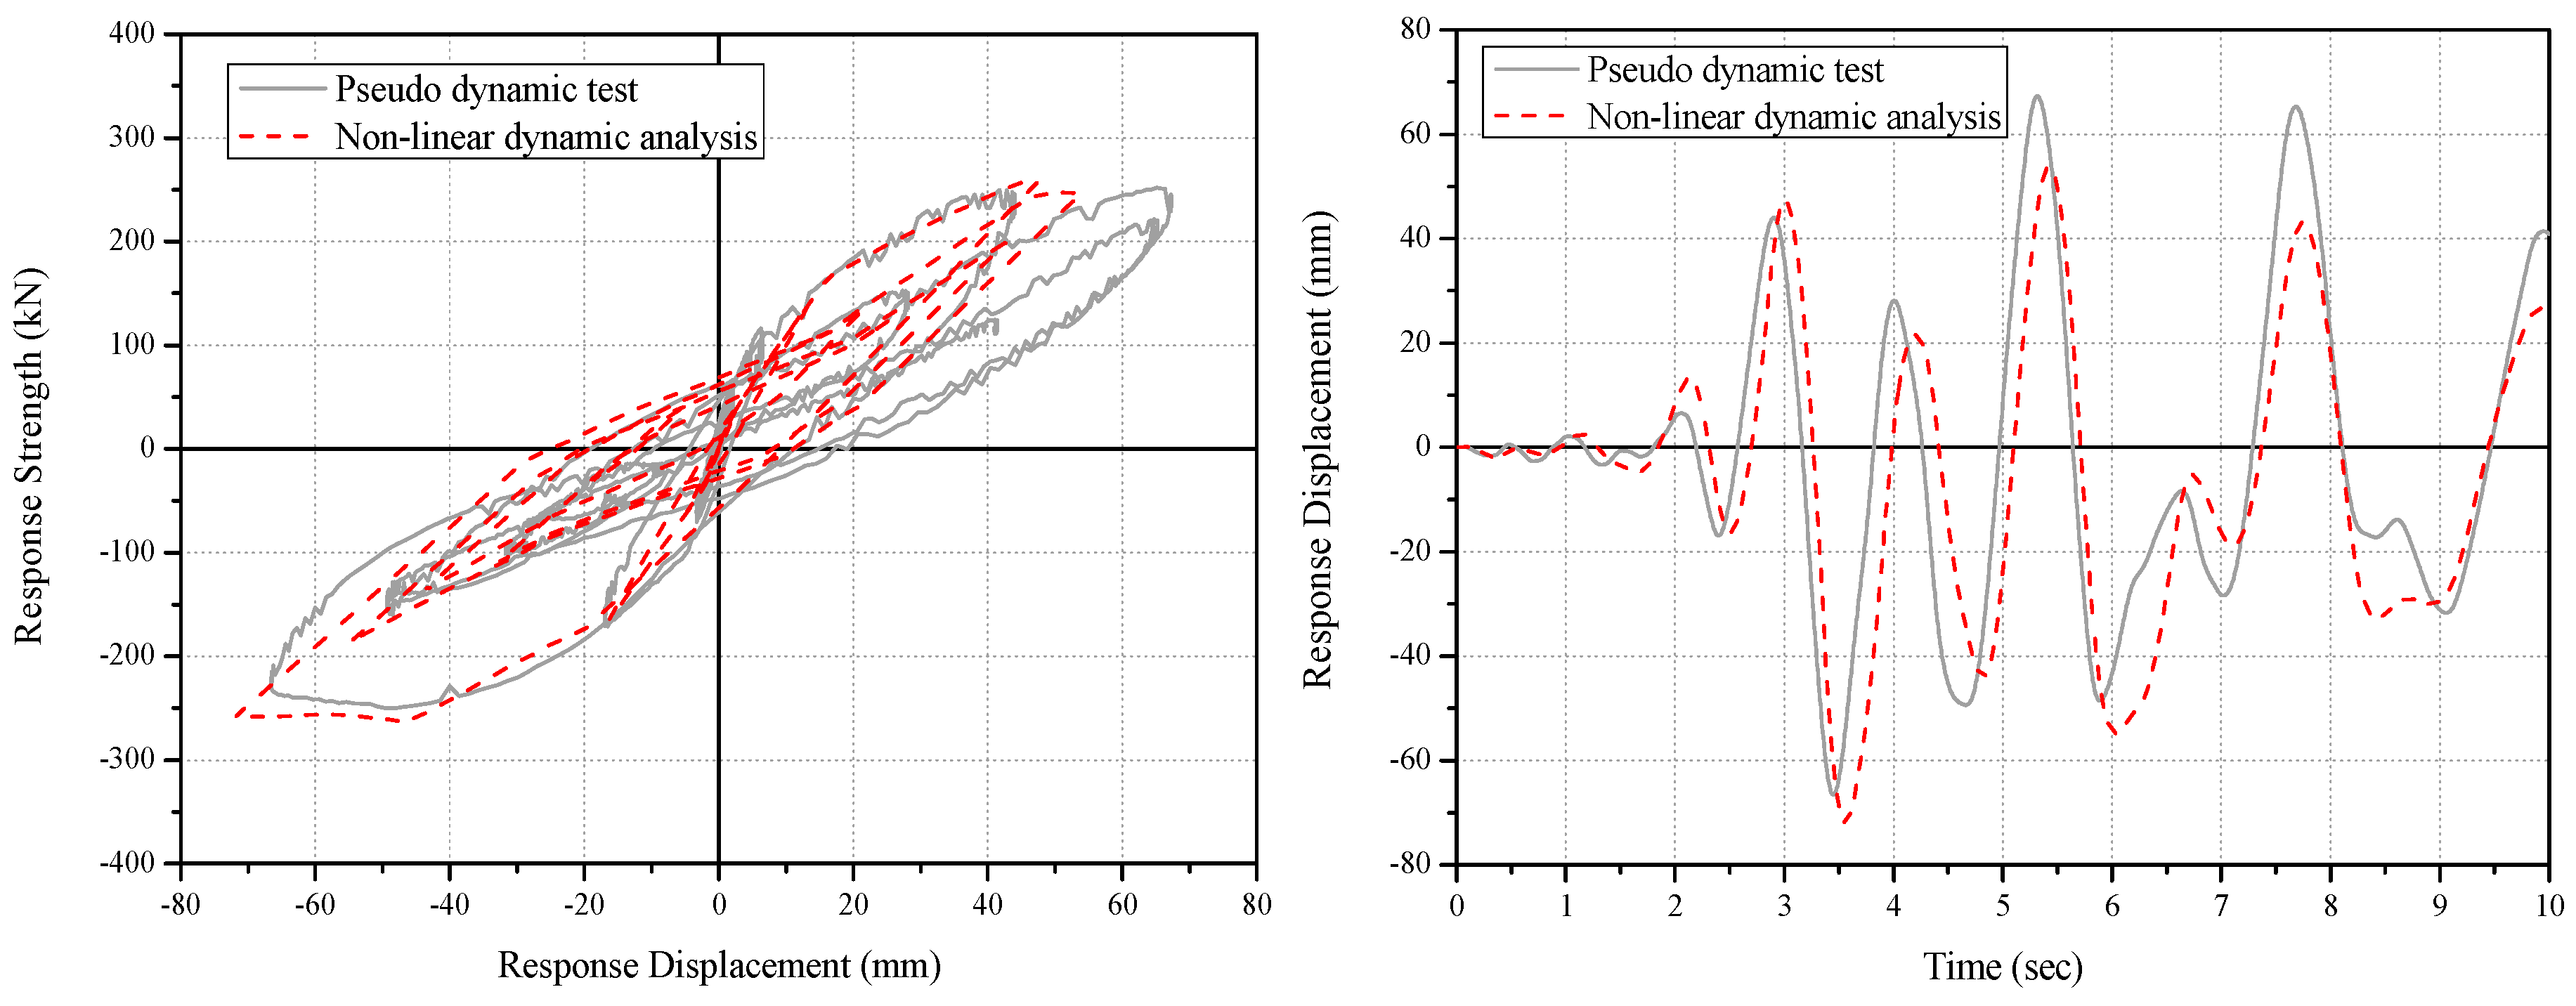
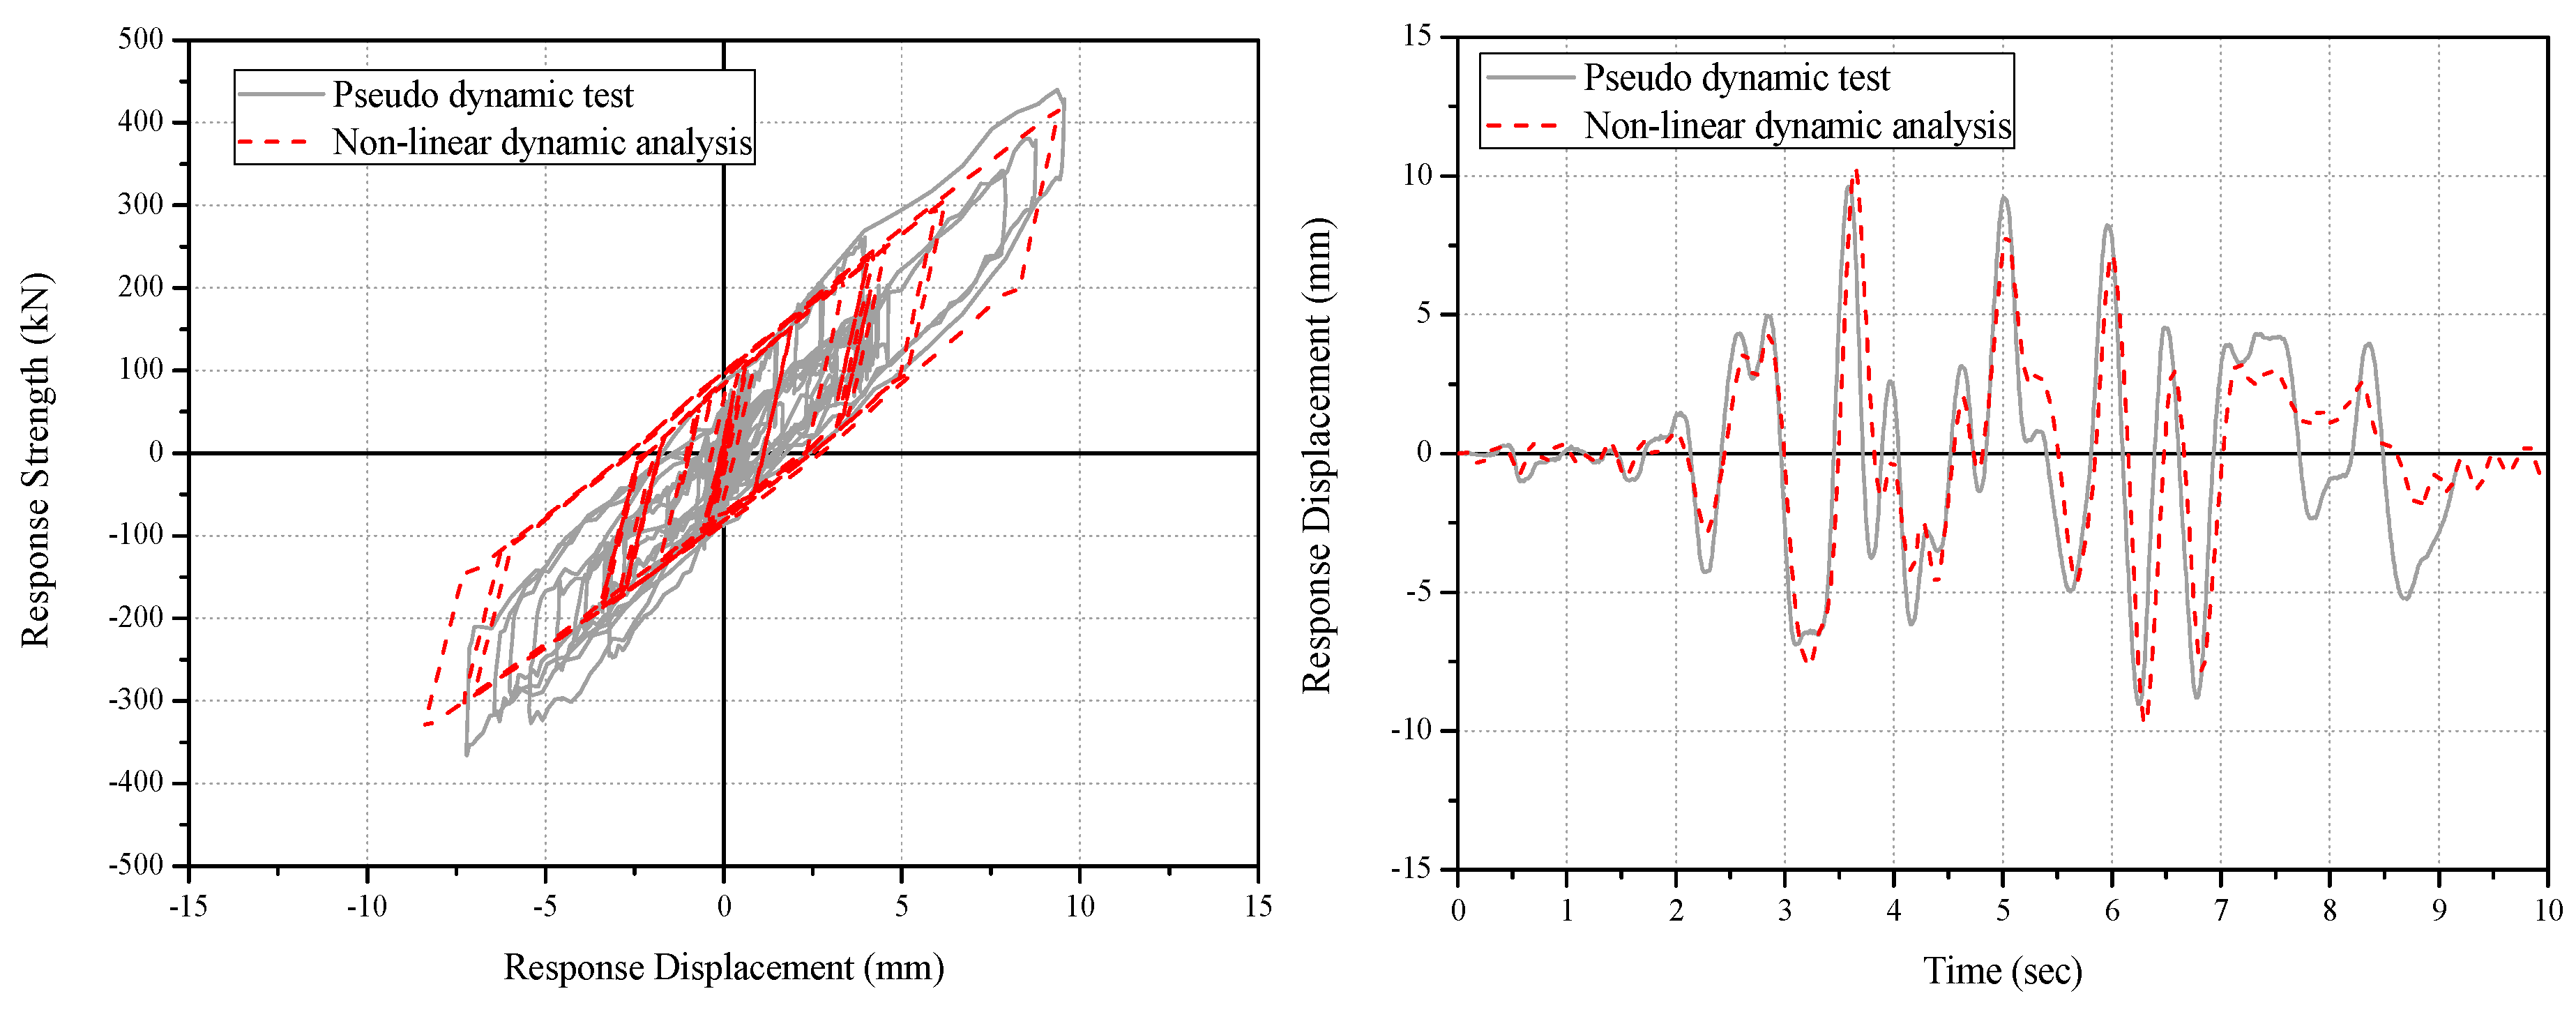
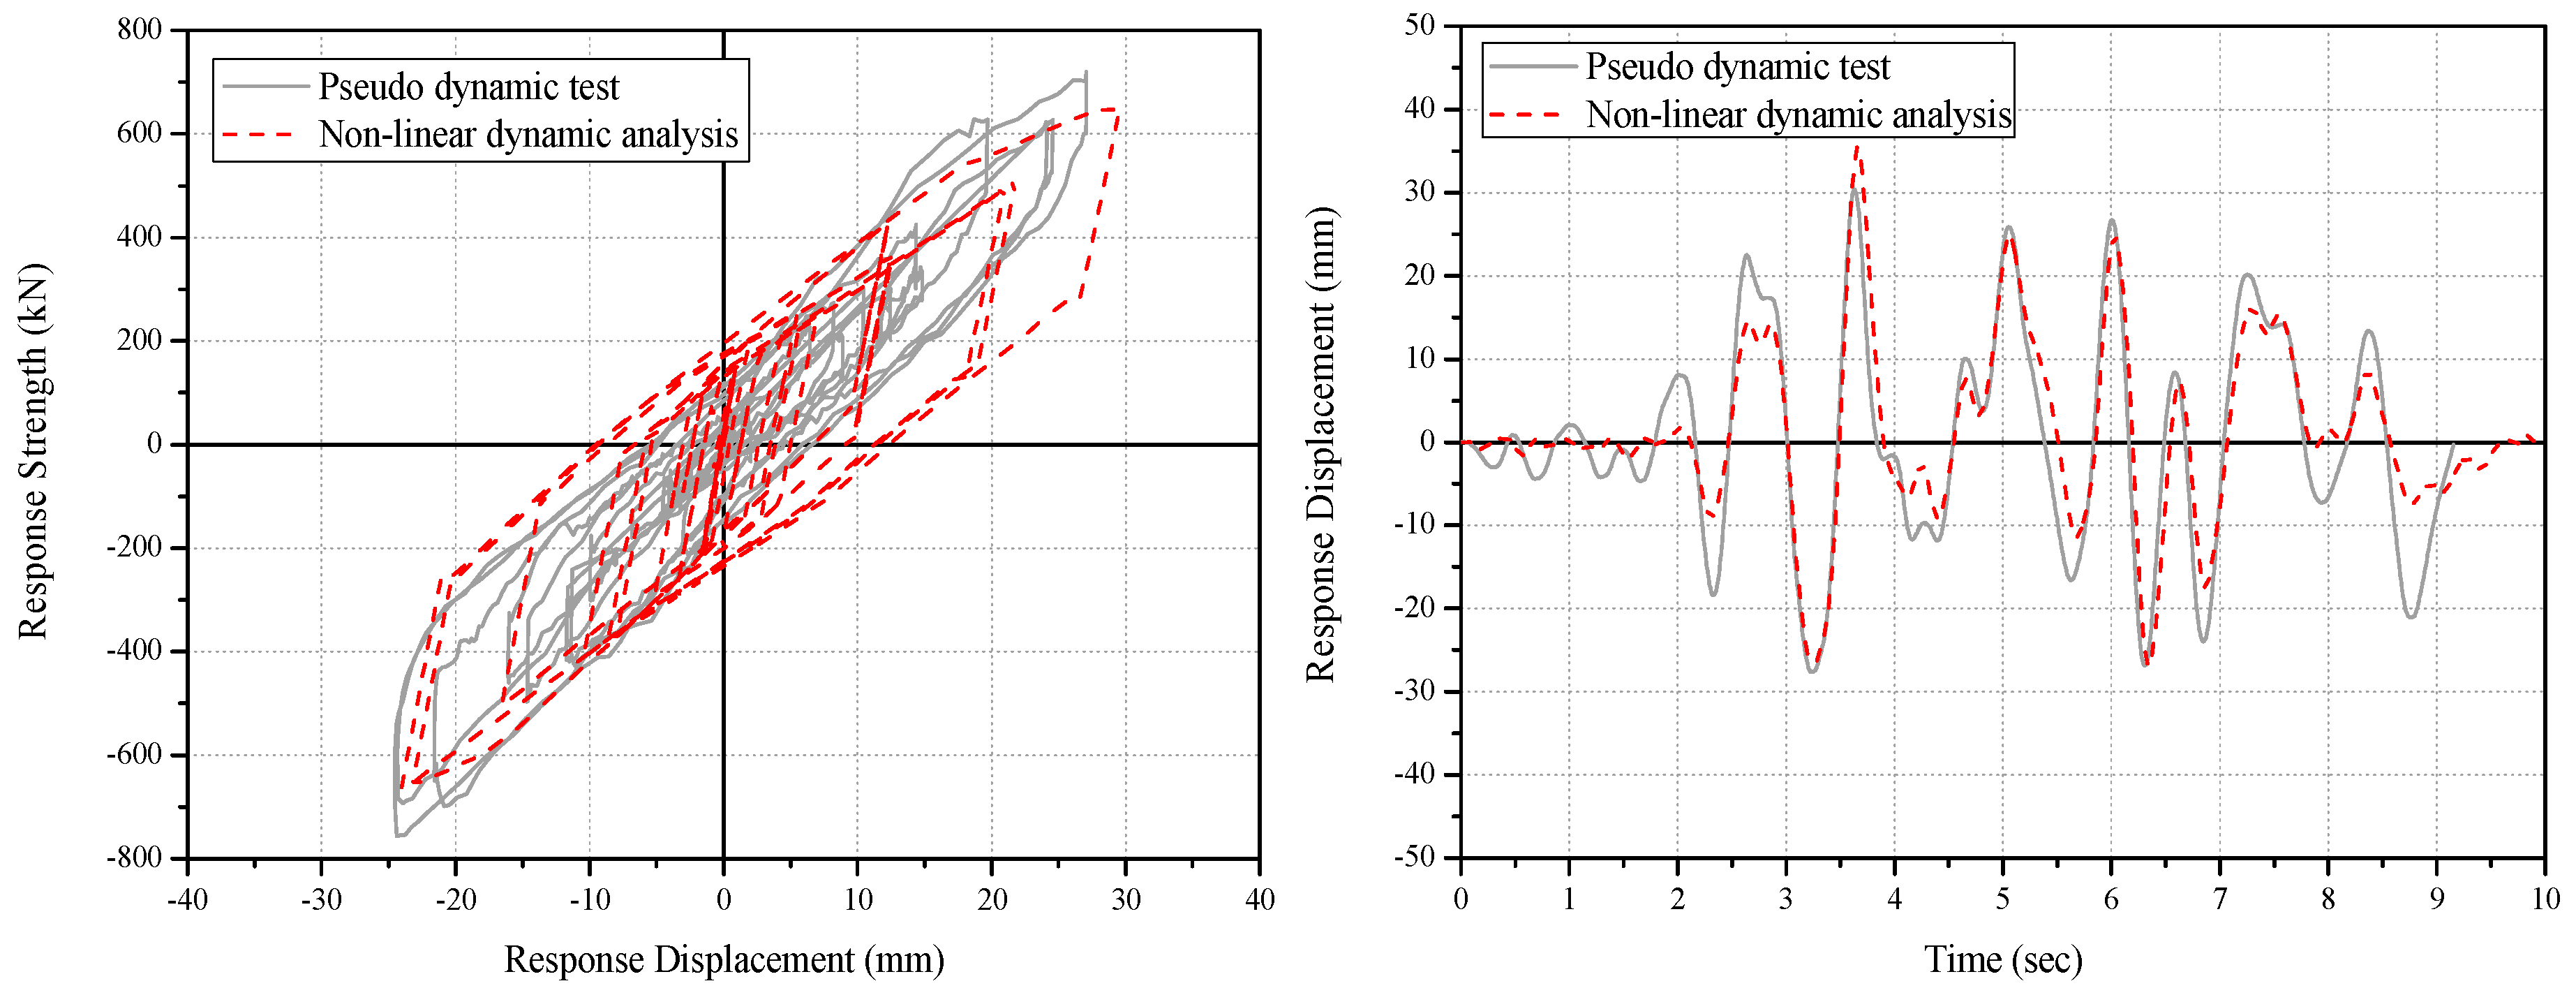
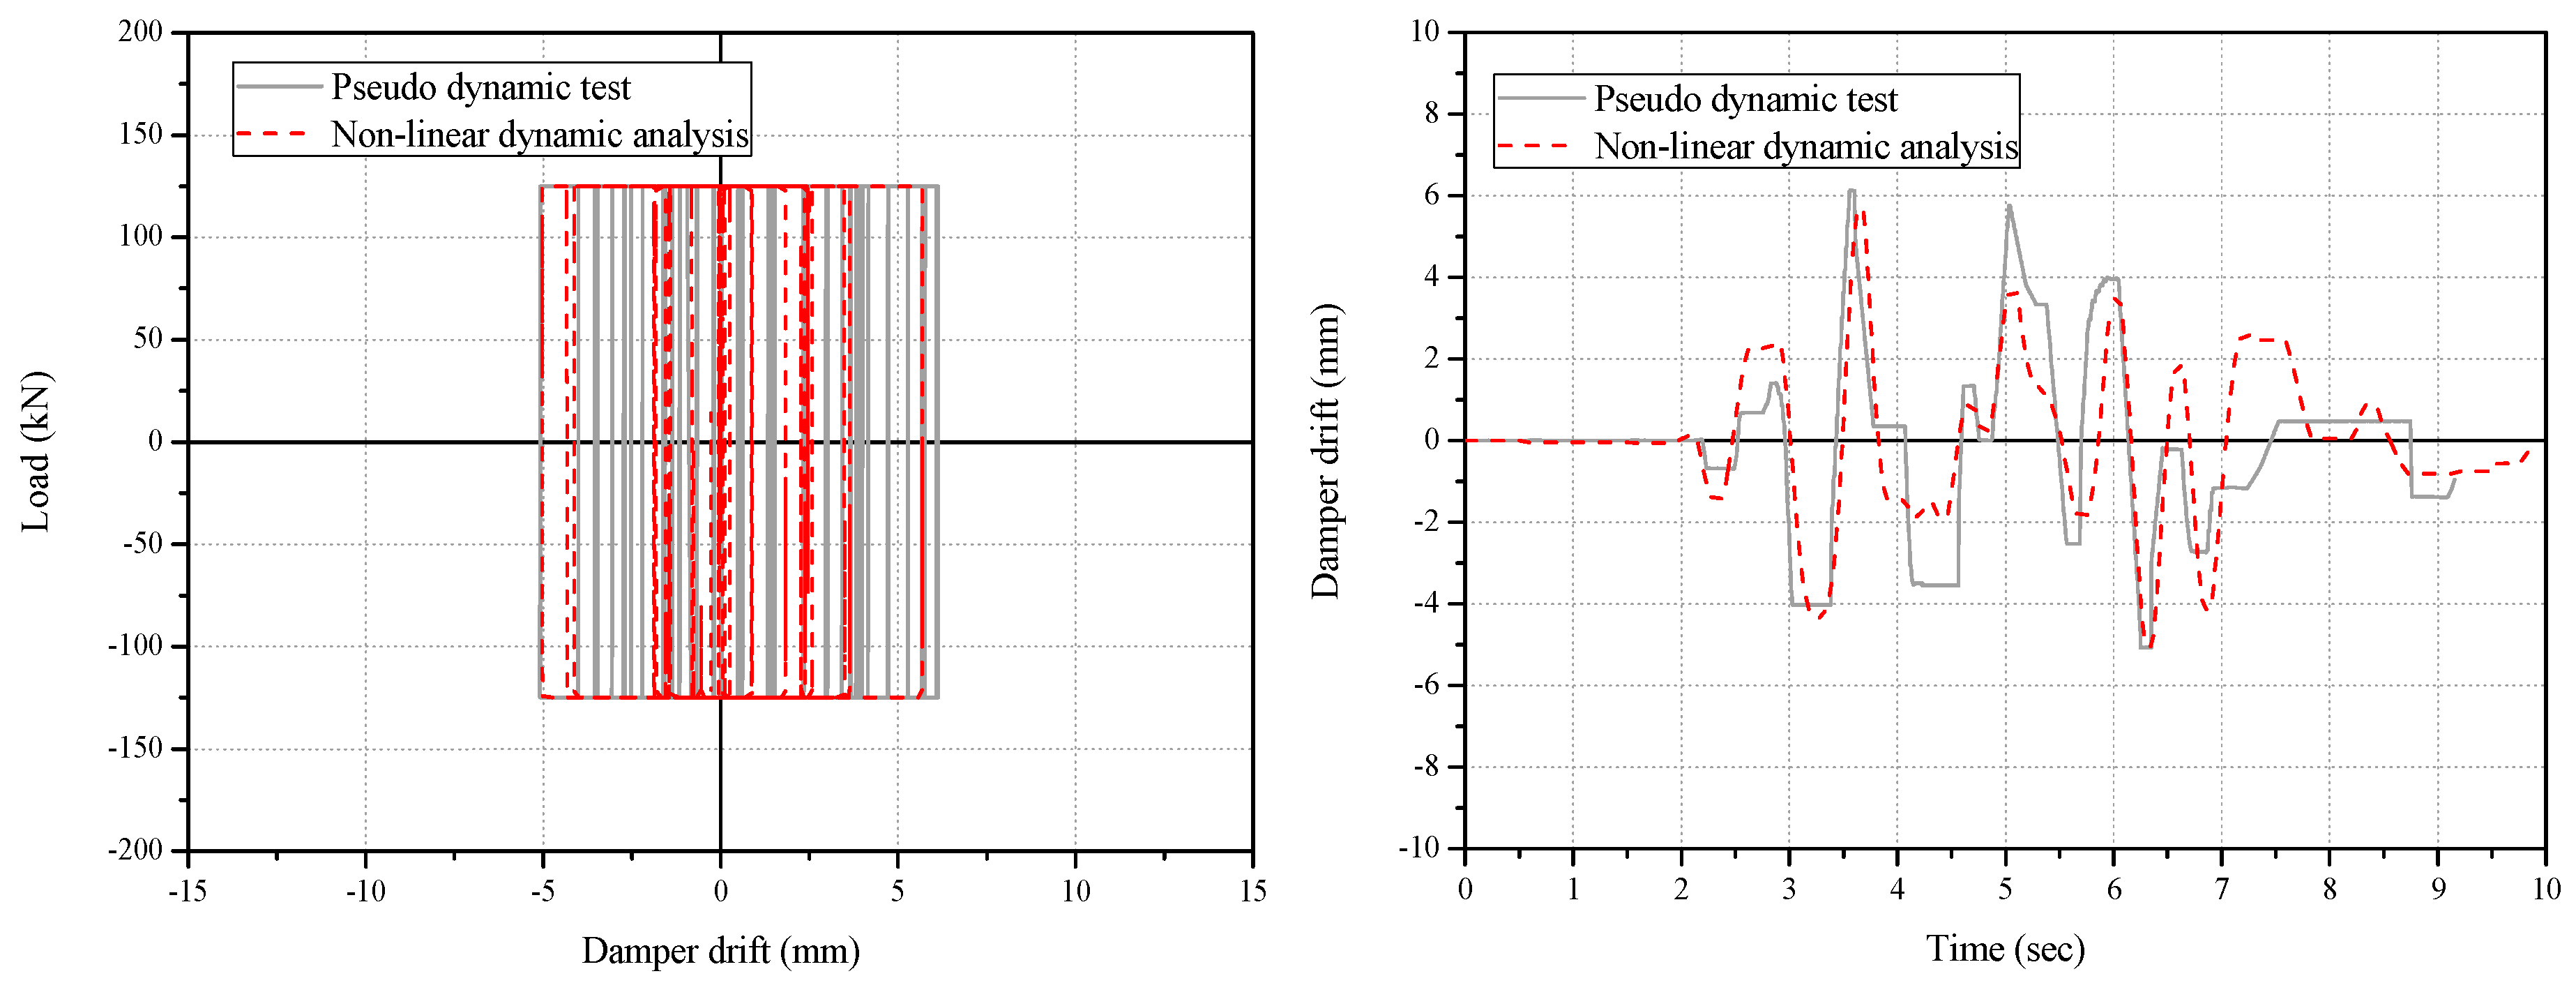
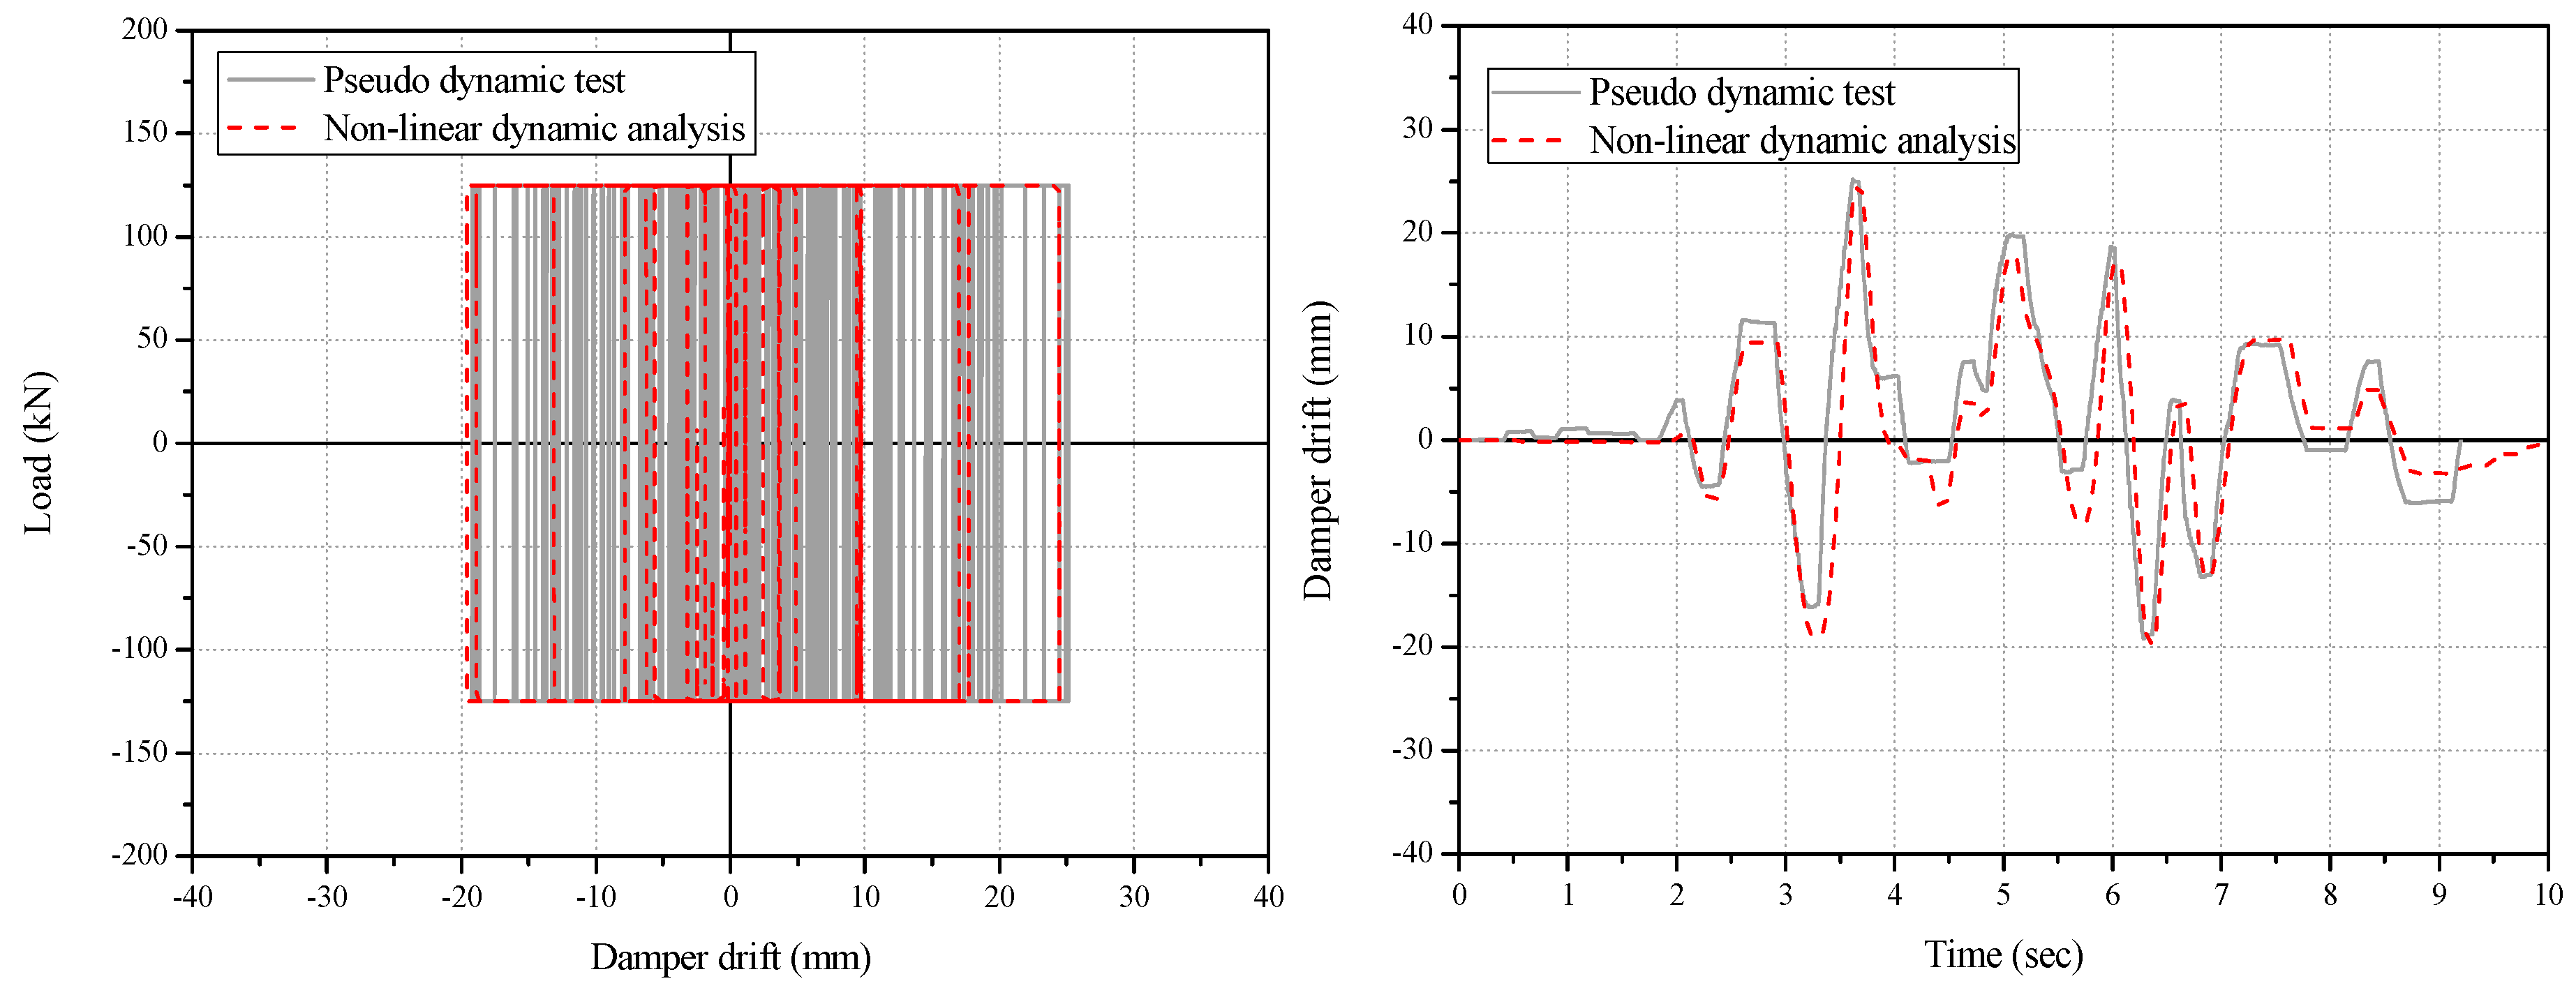
5.2. Comparison of the Non-Linear Dynamic Analysis and Pseudo-Dynamic Test Results
6. Evaluation of Seismic Retrofitting and Seismic Performance of R/C Building Retrofitted with LLFD V-Bracing System
6.1. Non-Linear Dynamic Analysis Overview
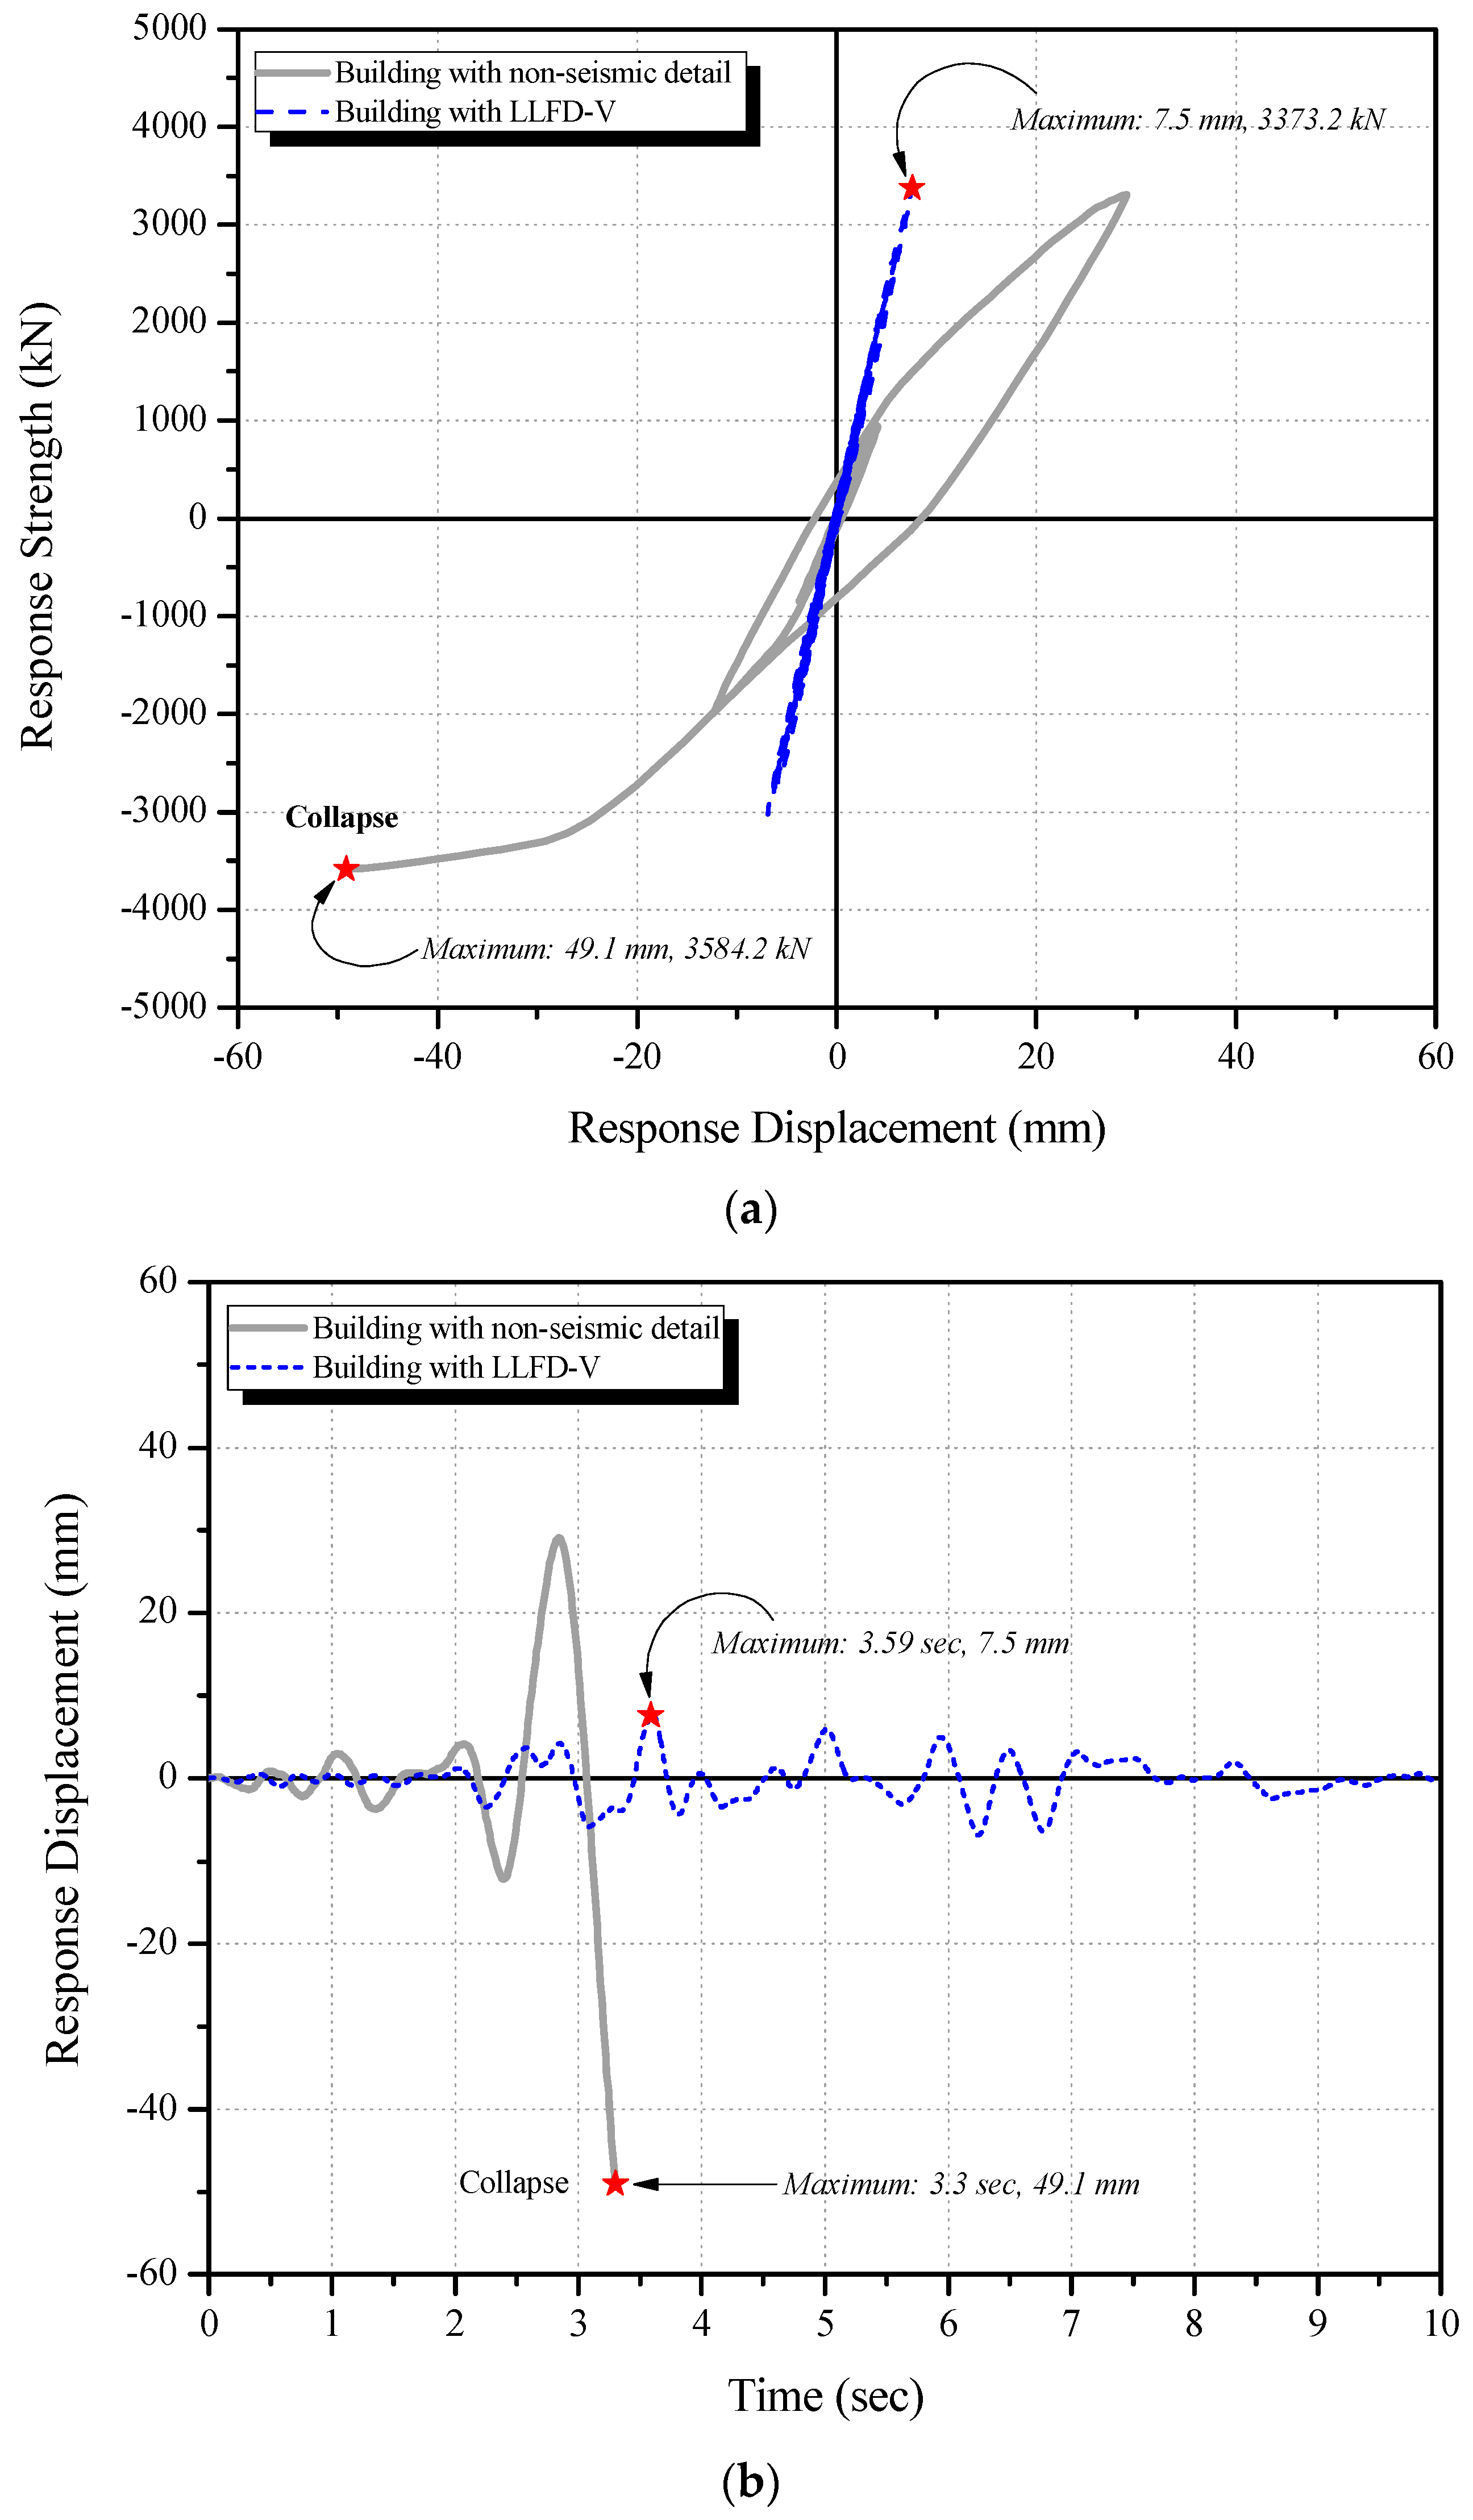
6.2. Non-Linear Dynamic Analysis Results before and after Seismic Retrofitting
7. Conclusions
- When the pseudo-dynamic test was conducted at a DBE scale of 200 cm/s2, the two-story R/C frame specimen without reinforcement showed shear failure; however, light seismic damage was expected for the frame specimen retrofitted with the LLFD V-bracing system. When a MCE scale of 300 cm/s2 was assumed, insignificant seismic damage was also expected. Under 400 and 500 cm/s2—assumed for large earthquakes—moderate seismic damage corresponding to the life safety level was also expected. Compared to the non-reinforced frame that showed the shear failure mode, the failure mode changed from shear failure to bending failure for the specimen retrofitted with the developed LLFD V-bracing system, confirming that the system had an excellent seismic energy dissipation capacity.
- Compared to the reference specimen, the LLFD method increased the seismic response strength by approximately 1.74 times under the input ground motion of 200 cm/s2, 2.42 times under 300 cm/s2, 3.00 times under 400 cm/s2, and 3.51 times under 500 cm/s2. The LLFD method also increased the displacement response ratio by approximately 0.14 times for 200 cm/s2, 0.23 times for 300 cm/s2, 0.40 times for 400 cm/s2, and 0.54 times for 500 cm/s2 compared to the reference specimen. The seismic response displacement for the same seismic load (200 cm/s2) was suppressed by approximately 86%, confirming that the proposed LLFD method has an excellent seismic energy absorption capacity.
- Based on the LLFD member test and pseudo-dynamic test results, the restoring force characteristics of the beams, columns, and reinforcement (LLFD) were proposed for the non-linear dynamic analysis of a two-story frame specimen retrofitted with the LLFD method. Based on the proposed restoring force characteristics, a non-linear dynamic analysis was conducted on the pseudo-dynamic test specimens, with the results obtained compared with the pseudo-dynamic test results. The results were found to be similar, with average differences in the seismic response load and displacement values of less than 10%, indicating that the seismic retrofitting effect of the novel V-bracing system could be effectively evaluated using the non-linear dynamic analysis based on the non-linear analysis model and method constructed in this study.
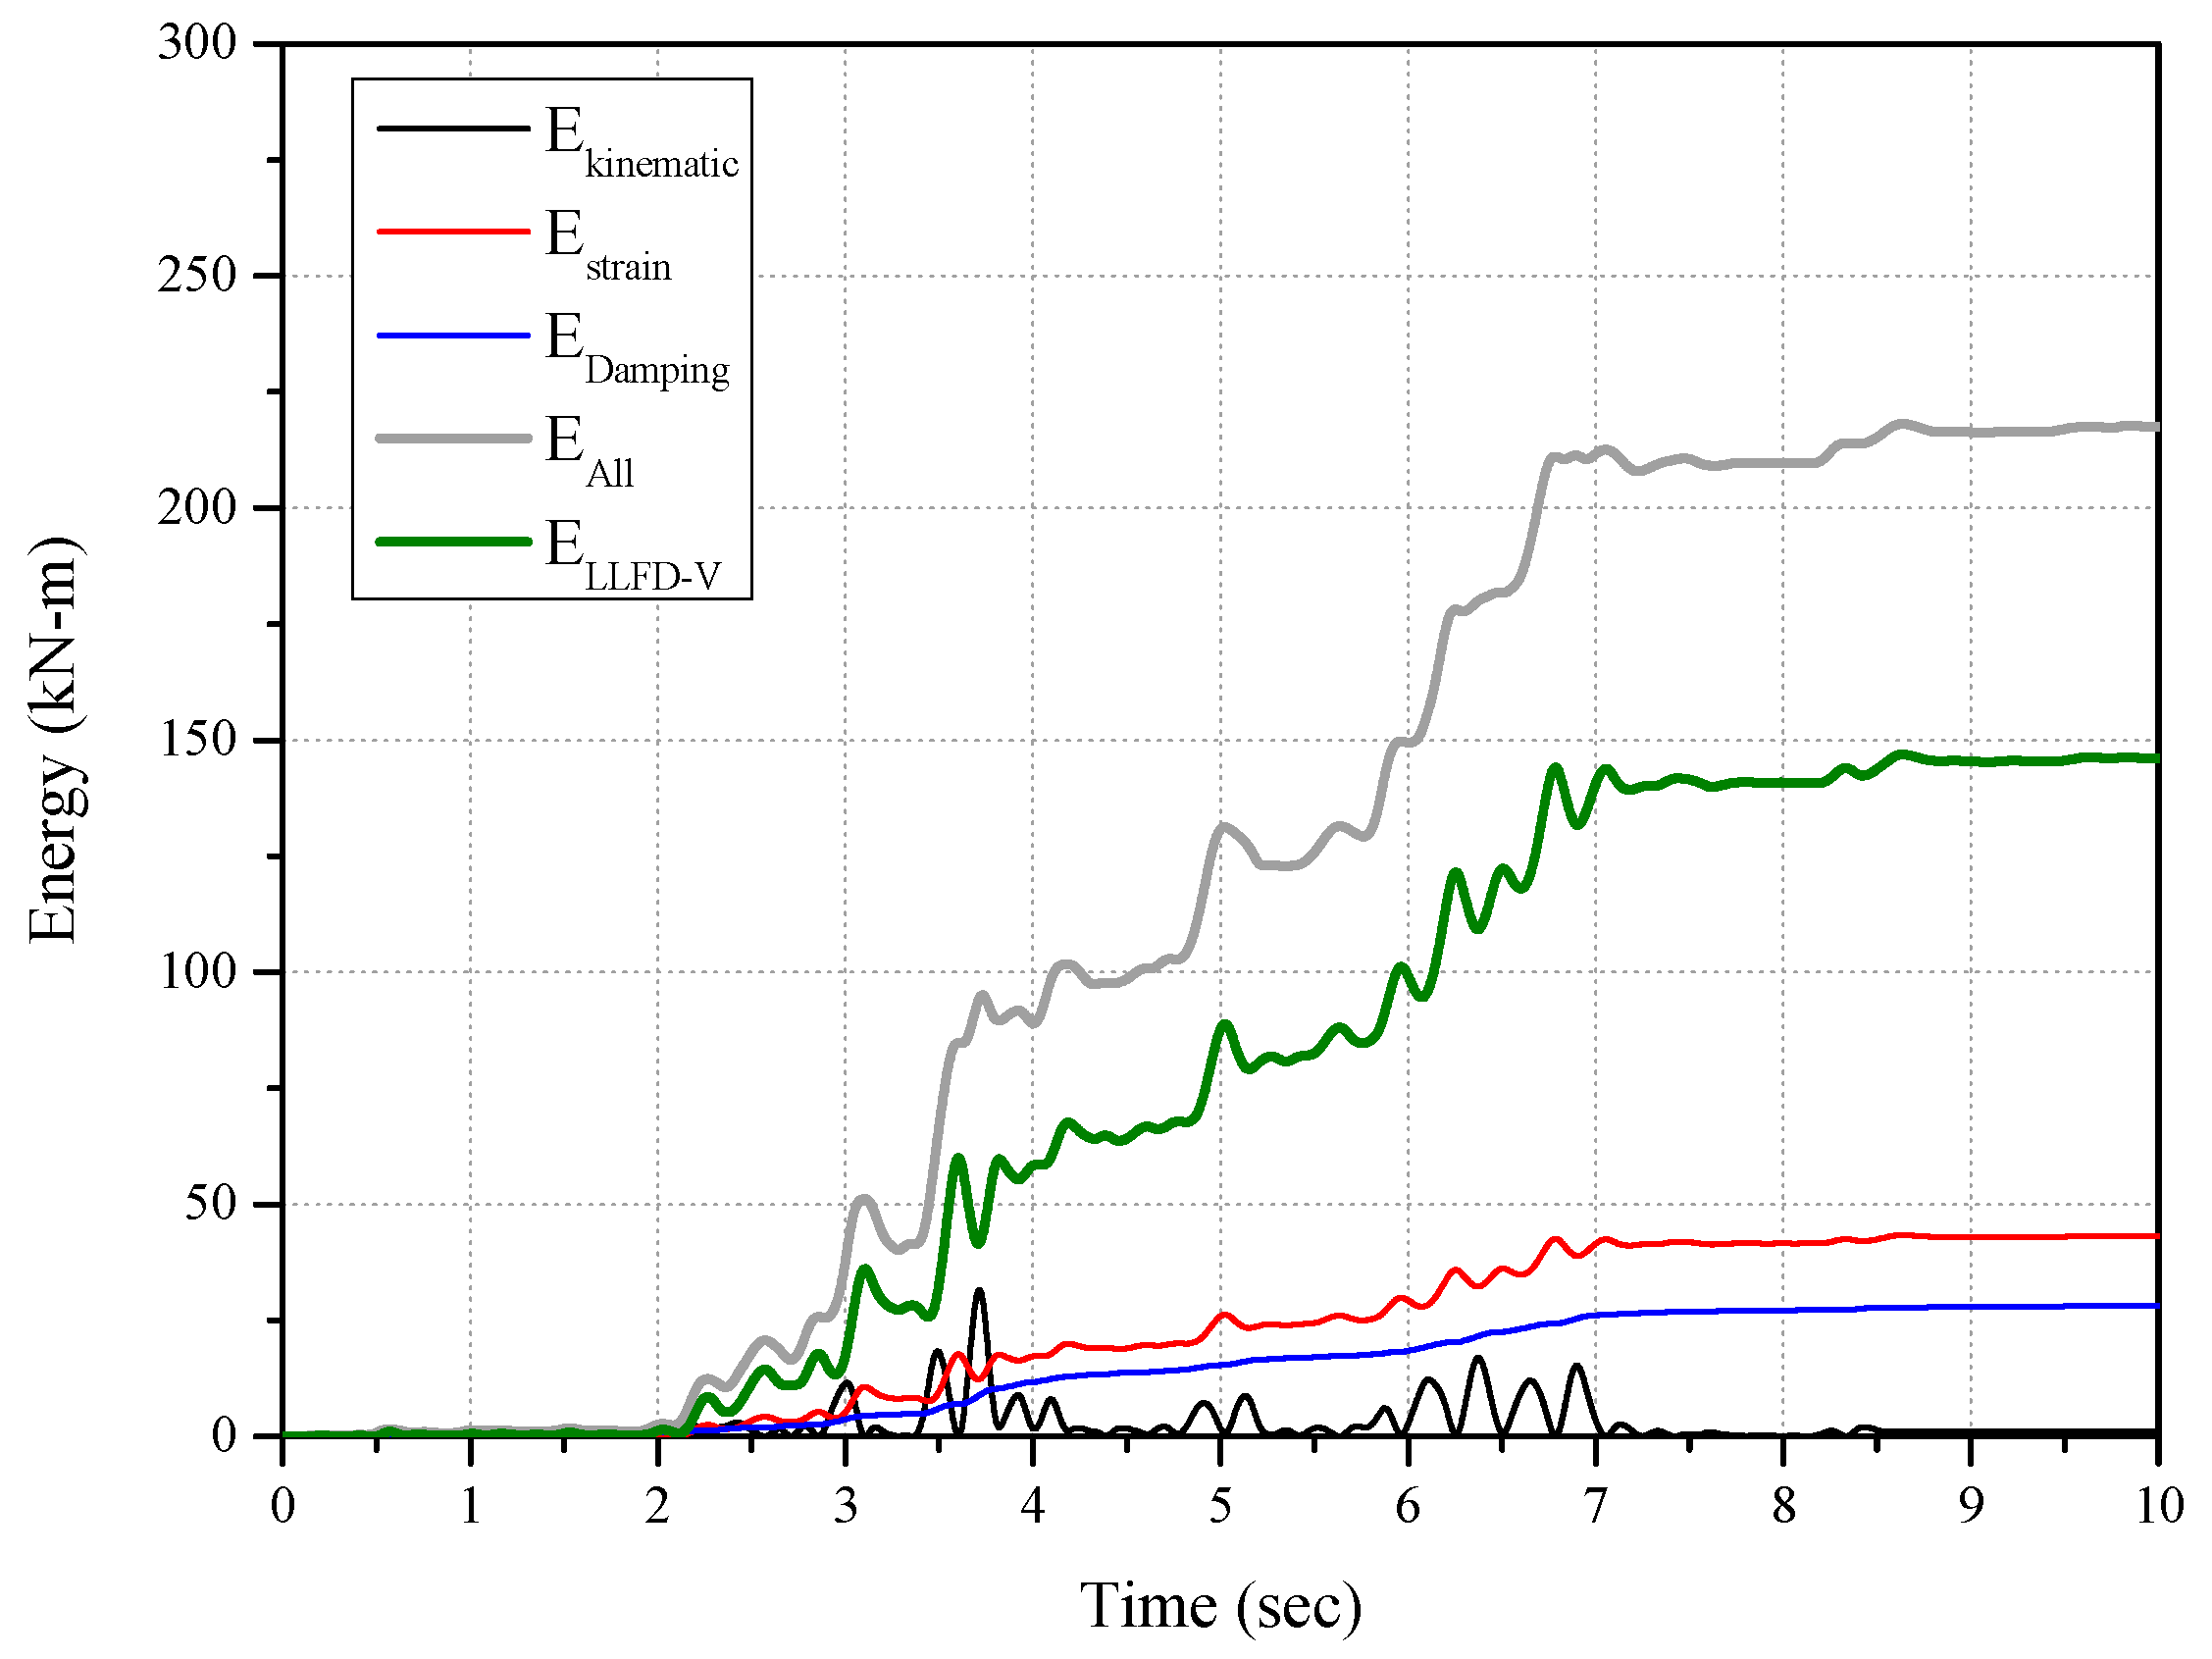
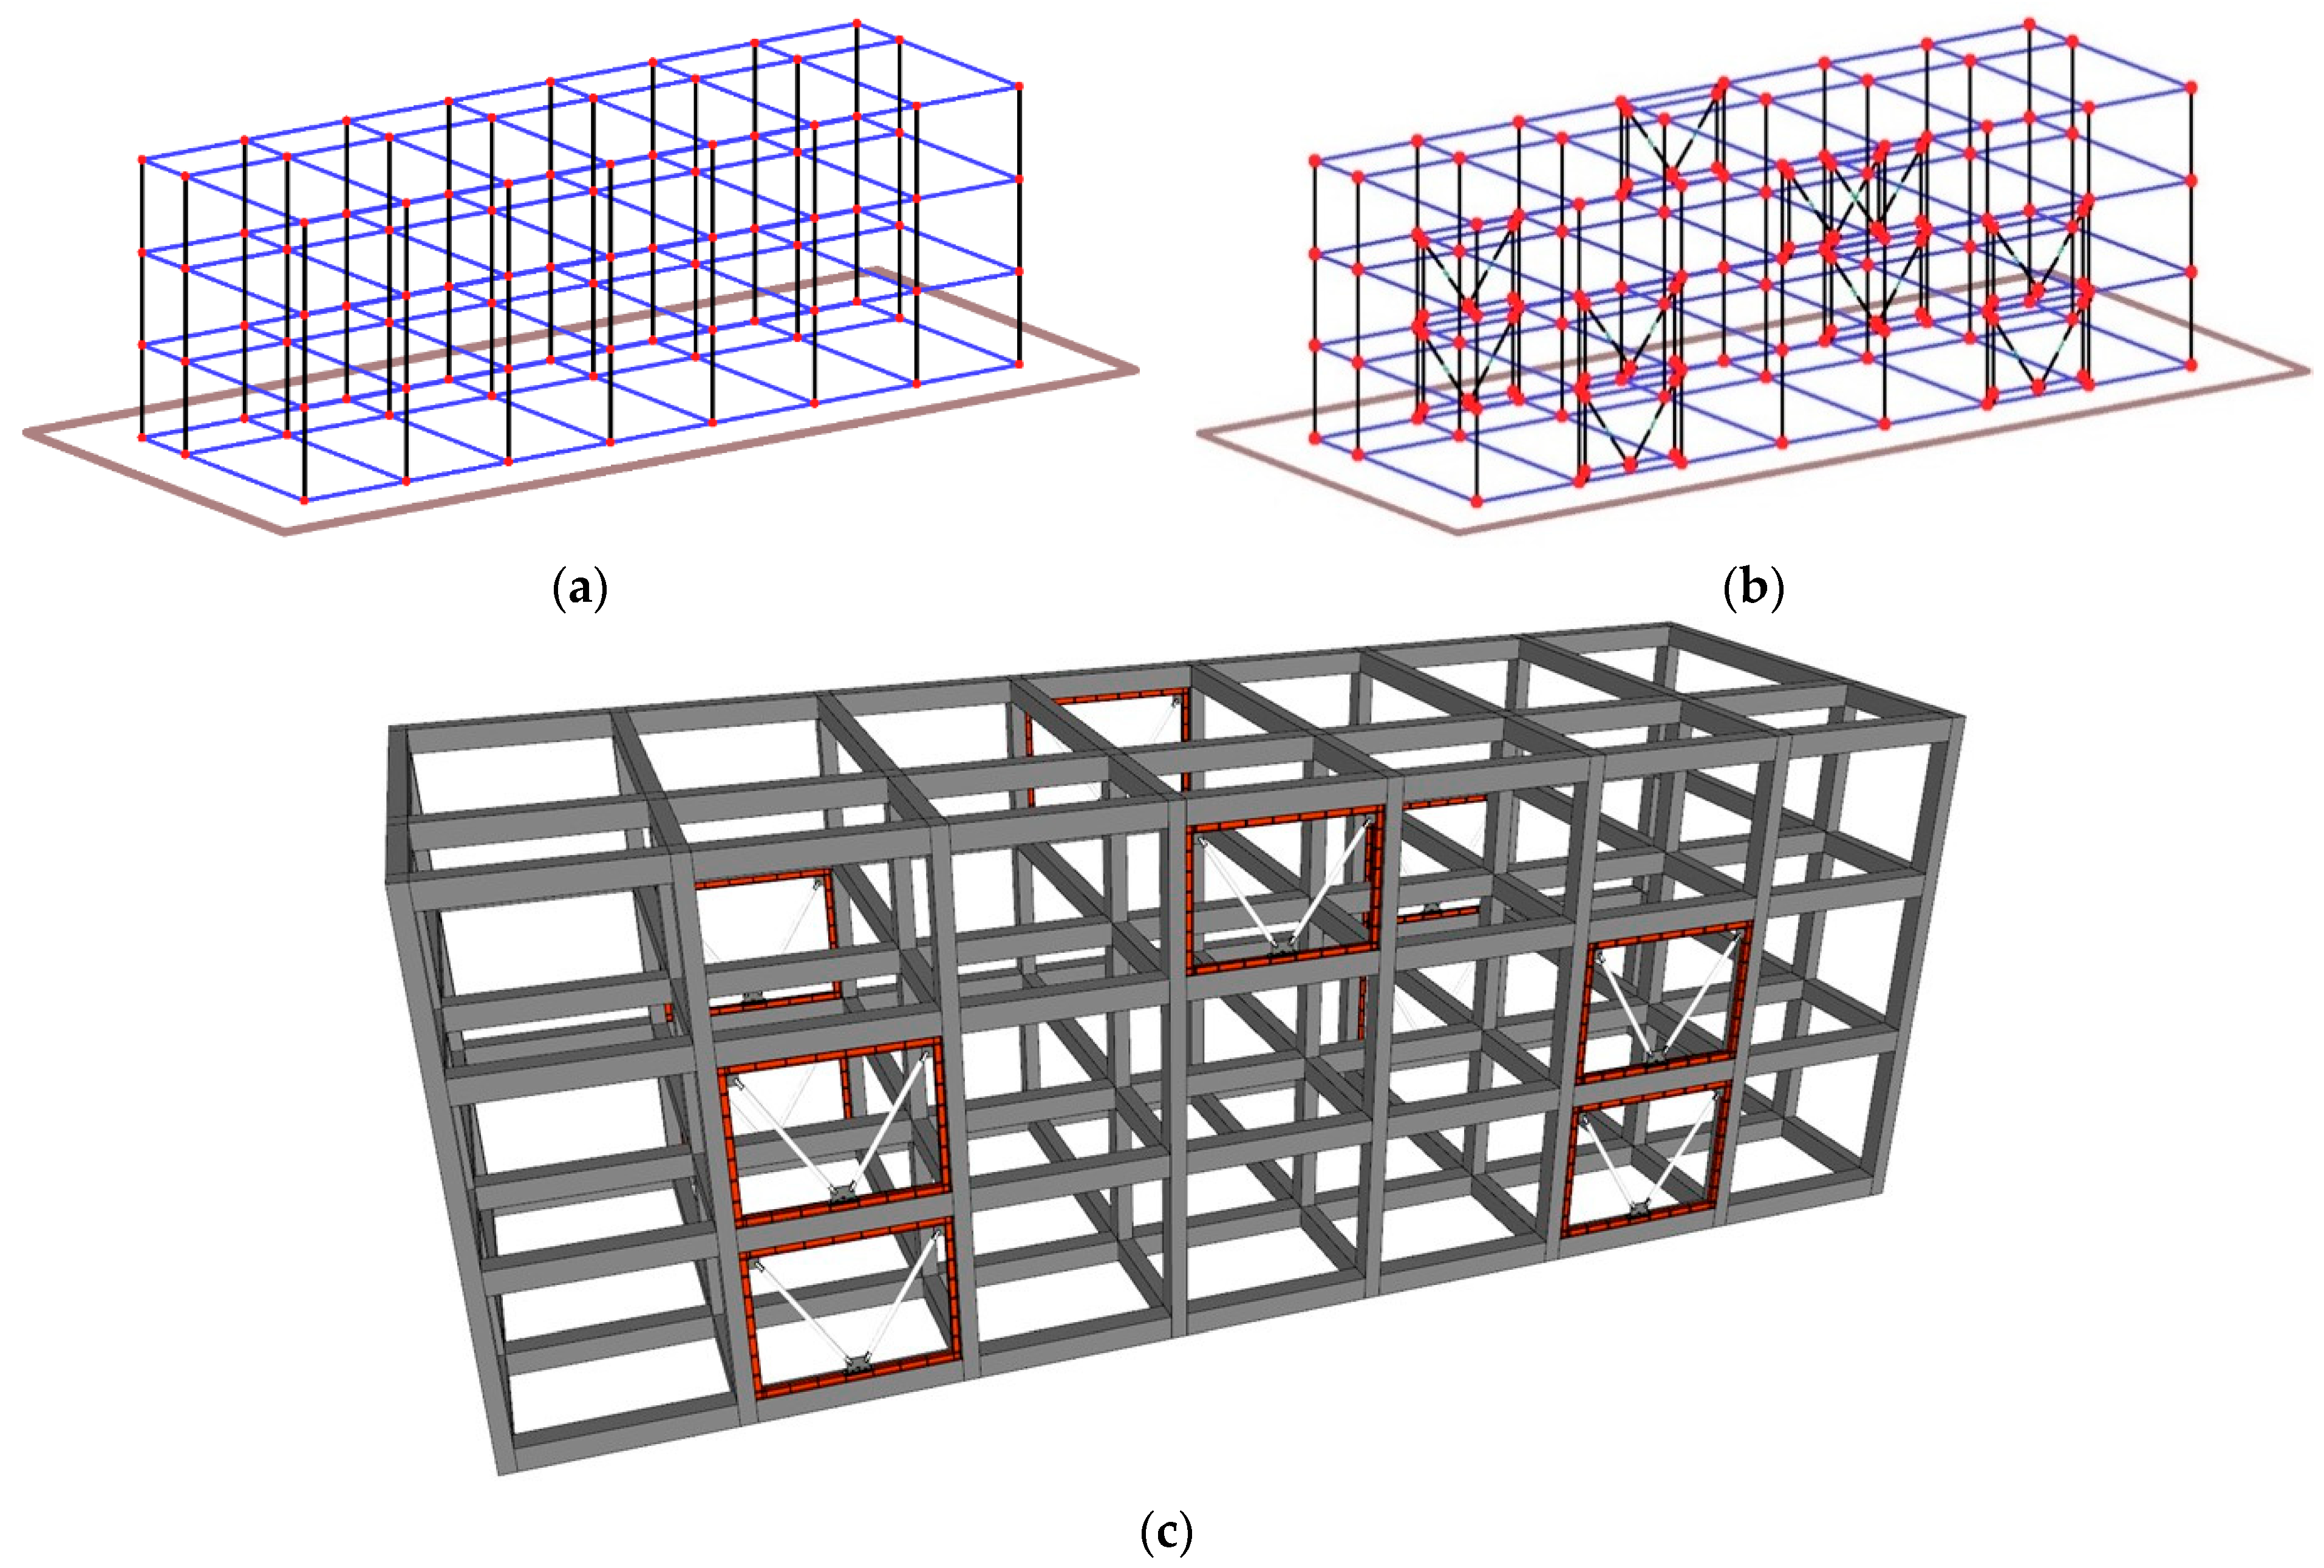
- For evaluating the commercialization potential of the LLFD V-bracing system, a non-linear dynamic analysis was conducted on the existing R/C building with non-seismic details retrofitted with the system, with the seismic retrofitting effect before and after seismic retrofitting examined. The R/C building with non-seismic details showed shear failure under a DBE seismic scale of 200 cm/s2, with insignificant seismic damage anticipated for the R/C building retrofitted with the system because approximately 67% of the total seismic energy acting on the building was shared through the excellent energy dissipation capacity of the LLFD. These results indicated that the developed LLFD V-bracing system is a new seismic retrofitting method that could be commercialized.
- To commercialize the technology, it is necessary to propose an external joining method that allows the building to be used even during the construction of the LLFD V-bracing system. Therefore, as a recommendation for future research, it is necessary to verify the reliability of the model through detail, experimental verification, and nonlinear dynamic analysis for external coupling applications.
Author Contributions
Funding
Institutional Review Board Statement
Informed Consent Statement
Data Availability Statement
Conflicts of Interest
Correction Statement
References
- AIK (Architectural Institute of Korea). Site Inspection and Damage Investigation of Buildings by Earthquakes in Gyoungju and Pohang; AIK: Seoul, Repblic of Korea, 2018. (In Korean) [Google Scholar]
- KMA (Korea Meteorological Administration), Korea. 2023. Available online: https://www.kma.go.kr/eng/index.jsp (accessed on 24 September 2023).
- Federal Emergency Management Agency (FEMA) 356. Prestandard and Commentary for Seismic Rehabilitation of Buildings; Federal Emergency Management Agency (FEMA): Washington, DC, USA, 2000; 500p. [Google Scholar]
- Japan Building Disaster Prevention Association (JBDPA). Guideline for Seismic Strengthening of Existing Reinforced Concrete Buildings; Japan Building Disaster Prevention Association (JBDPA): Tokyo, Japan, 2017; 450p. [Google Scholar]
- Seismic Strengthening Research Group (SSRG). Seismic Strengthening of RC Buildings; Ohmsha Press: Tokyo, Japan, 2008; 230p. [Google Scholar]
- Pankaj, M.; Singh, S.B. Out-of-plane response of ECC-strengthened masonry walls. J. Struct. Integr. Maint. 2020, 5, 18–30. [Google Scholar]
- Corey, T.G. Multi-performance retrofits to commercial buildings in seismic zones. J. Struct. Integr. Maint. 2017, 2, 133–142. [Google Scholar]
- Alahi, F.N.; Vatandoost, M. Single diagonal precast prestressed concrete bracing for strengthening existing concrete frames. Int. J. Adv. Struct. Eng. 2018, 10, 339–347. [Google Scholar] [CrossRef]
- Cho, C.G.; Cheong, S.H.; Moon, H.J.; Kim, H.Y.; Lee, K.S. Experimental Study on Seismic Capacity of Reinforced Concrete Composite Columns Based on a High-ductile Fiber Cementitious Composite. Int. J. Concr. Struct. Mater. 2019, 13, 16. [Google Scholar] [CrossRef]
- Kurosawa, R.; Sakata, H.; Qu, Z.; Suyama, T. Cyclic loading tests on RC moment frames retrofitted by PC frames with mild press joints through RC slabs for connection. Eng. Struct. 2019, 197, 109440. [Google Scholar] [CrossRef]
- Cao, X.Y.; Feng, D.C.; Wu, G. Seismic performance upgrade of RC frame buildings using precast bolt-connected steel-plate reinforced concrete frame-braces. Eng. Struct. 2019, 195, 382–399. [Google Scholar] [CrossRef]
- Cao, X.Y.; Wu, G.; Ju, J.W.W. Seismic performance improvement of existing RCFs using external PT-PBSPC frame sub-structures: Experimental verification and numerical investigation. J. Build. Eng. 2022, 46, 103649. [Google Scholar] [CrossRef]
- Lee, H.J.; Lee, H.B.; Park, H.G.; Lee, J.K. Cyclic Lateral Load Test for RC Moment Frames Retrofitted with External Steel Frames. J. Struct. Eng. 2023, 149, 04023028. [Google Scholar] [CrossRef]
- Lee, K.S. Experimental Study on Sprayed FRP System for Strengthening Reinforced Concrete Beams. J. Adv. Concr. Technol. 2012, 10, 219–230. [Google Scholar] [CrossRef]
- Lee, K.S.; Lee, B.Y.; Seo, S.Y. A Seismic Strengthening Technique for Reinforced Concrete Columns Using Sprayed FRP. Polymers 2016, 8, 107. [Google Scholar] [CrossRef]
- Ozbakkaloglu, T.; Saatcioglu, M. Tensile behavior of FRP anchors in concrete. Journal of Composites for Construction 2009, 12, 82–92. [Google Scholar] [CrossRef]
- Ju, M.K.; Sim, J.S.; Kwon, H.W.; Lee, K.S. Non-compression cross-bracing system using carbon fiber anchors for seismic strengthening of RC structures. Mag. Concr. Res. 2013, 66, 159–174. [Google Scholar] [CrossRef]
- Belarbi, A.; Acun, B. FRP Systems in Shear Strengthening of Reinforced Concrete Structures. Procedia Eng. 2013, 57, 2–8. [Google Scholar] [CrossRef]
- Lee, K.S. An Experimental Study on Hybrid Noncompression CF Bracing and GF Sheet Wrapping Reinforcement Method to Restore Damaged RC Structures. Shock. Vib. 2015, 2015, 202751. [Google Scholar] [CrossRef]
- ASCE 7-10; Minimum Design Loads for Buildings and Other Structures. ASCE American Society of Civil Engineers: Reston, VA, USA, 2010.
- ASCE/SEI 7-22; Minimum Design Loads and Associated Criteria for Buildings and Other Structures. ASCE American Society of Civil Engineers: Reston, VA, USA, 2022.
- Japan Building Disaster Prevention Association (JBDPA). Guideline for Seismic Strengthening by Seismic Control and Base Isolation Systems of Existing Reinforced Concrete Buildings; Japan Building Disaster Prevention Association (JBDPA): Tokyo, Japan, 2010; 129p. [Google Scholar]
- KDS 41; Korean Design Standard 41. Architectural Institute of Korea: Seoul, Republic of Korea, 2019. (In Korean)
- Zhang, Y.; Zhu, S. Seismic response control of building structures with superelastic shape memory alloy wire dampers. J. Eng. Mech. 2008, 134, 240–251. [Google Scholar] [CrossRef]
- De Matteis, G.; Formisano, A.; Mazzolani, F.M. An innovative methodology for seismic retrofitting of existing RC buildings by metal shear panels. Earthq. Eng. Struct. Dyn. 2009, 38, 61–78. [Google Scholar] [CrossRef]
- Vemuri. Conducted Research on a Link That Acts as a Sacrificial Fuse by Dissipating Seismic Energy among the Key Components of EBF. 2015. Available online: https://link.springer.com/chapter/10.1007/978-81-322-2190-6_46 (accessed on 1 November 2023).
- Shi, F.; Ozbulut, O.E.; Zhou, Y. Influence of shape memory alloy brace design parameters on seismic performance of self-centering steel frame buildings. Struct. Control Health Monit. 2020, 27, e2462. [Google Scholar] [CrossRef]
- Yao, Z.; Wang, W.; Zhu, Y. Experimental evaluation and numerical simulation of low-yield-point steel shear panel dampers. Eng. Struct. 2021, 245, 112860. [Google Scholar] [CrossRef]
- Ferraioli, M.; Biagio, L.; Angelo, L.; Frattolillo, C.; de Matteis, G. Seismic retrofit of a steel-reinforced concrete hospital building using continuous energy-dissipative steel columns. Steel Compos. Struct. 2023, 47, 467–488. [Google Scholar]
- Mualla, I.H.; Belev, B. Performance of steel frames with a new friction damper device under earthquake excitation. Eng. Struct. 2002, 24, 365–371. [Google Scholar] [CrossRef]
- Monir, H.S.; Zeynali, K. A modified friction damper for diagonal bracing of structures. J. Constr. Steel Res. 2013, 87, 17–30. [Google Scholar] [CrossRef]
- Ghorbani, H.R.; Rofooei, F.R. A novel double slip loads friction damper to control the seismic response of structures. Eng. Struct. 2020, 225, 111273. [Google Scholar] [CrossRef]
- Veismoradi, S.; Yousef-beik, S.M.M.; Zarnani, P.; Quenneville, P. Development and parametric study of a new self-centering rotational friction damper. Eng. Struct. 2021, 235, 112097. [Google Scholar] [CrossRef]
- Qiu, C.; Liu, J.; Du, X. Cyclic behavior of SMA slip friction damper. Eng. Struct. 2022, 250, 113407. [Google Scholar] [CrossRef]
- Kulak, G.L.; Fisher, J.W.; Struik, J.H. Guide to Design Criteria for Bolted and Riveted Joints Second Edition; American Institute of Steel Construction: Chicago, IL, USA, 2014. [Google Scholar]
- Takanashi, K.; Udagawa, K.; Tanaka, H. Pseudo-dynamic tests on a 2-storey steel frame by a computer-load test apparatus hybrid system. In Proceedings of the 7th World Conference on Earthquake Engineering, Istanbul, Turkey, 8–13 September 1980; Volume 7, pp. 225–232. [Google Scholar]
- Ozcelik, R.; Binici Bari, Ş.; Kurç, O. Pseudo dynamic testing of an RC frame retrofitted with chevron braces. J. Earthq. Eng. 2012, 16, 515–539. [Google Scholar] [CrossRef]
- Di Benedetto, S.; Francavilla, A.B.; Latour, M.; Cavallaro, G.F.; Piluso, V.; Rizzano, G. Pseudo-dynamic testing of a full-scale two-storey steel building with RBS connections. Eng. Struct. 2020, 212, 110494. [Google Scholar] [CrossRef]
- Del Vecchio, C.; Di Ludovico, M.; Verderame, G.M.; Prota, A. Pseudo-dynamic tests on full-scale two storeys RC frames with different infill-to-structure connections. Eng. Struct. 2022, 266, 114608. [Google Scholar] [CrossRef]
- Molitierno, C.; Del Vecchio, C.; Di Ludovico, M.; Prota, A. Pseudodynamic Tests and Numerical Modelling for Damage Analysis of Infilled RC Frames. J. Earthq. Eng. 2023, 287, 4549–4574. [Google Scholar] [CrossRef]
- Tokyo Soki Kenkyujo Company (2020) Tokyo, Japan. Available online: https://www.tml.jp/e/ (accessed on 24 September 2023).
- MTS. Pseudodynamic Testing for 793 Controllers; MTS Systems Corporation: Eden Prairie, MI, USA, 2002. [Google Scholar]
- Hilber, H.M.; Hughes, T.J.; Taylor, R.L. Improved numerical dissipation for time integration algorithms in structural dynamics. Earthq. Eng. Struct. Dyn. 1977, 5, 283–292. [Google Scholar] [CrossRef]
- Lee, K.S. Seismic capacity requirements for low-rise reinforced concrete buildings controlled by both shear and flexure. J. Adv. Concr. Technol. 2010, 8, 75–91. [Google Scholar] [CrossRef]
- KS B 0801; Test Pieces for Tension Test for Metallic Materials. Korean Industrial Standards: Seoul, Republic of Korea, 2017. (In Korean)
- KS B 0802; Method of Tensile Test for Metallic Materials. Korean Standards Association: Seoul, Republic of Korea, 2018. (In Korean)
- Lee, K.S.; Wi, J.D.; Kim, Y.I.; Lee, H.H. Seismic safety evaluation of Korean R/C school buildings built in the 1980s. J. Korean Inst. Struct. Maint. Insp. 2009, 13, 149–159. (In Korean) [Google Scholar]
- JBDPA (Japan Building Disaster Prevention Association). Standard for Damage Level Classification; JBDPA: Tokyo, Japan, 2015. [Google Scholar]
- Maeda, M.; Nakano, Y.; Lee, K.S. Postearthquake damage evaluation for RC buildings based on residual seismic capacity. In Proceedings of the 13th World Conference on Earthquake Engineering, Vancouver, BC, Canada, 1–6 August 2004. [Google Scholar]
- Japan Building Disaster Prevention Association (JBDPA). Japanese Standard for Seismic Evaluation of Existing Reinforced Concrete Buildings; Japan Building Disaster Prevention Association (JBDPA): Tokyo, Japan, 2017; 550p. [Google Scholar]
- AIJ (Architectural Institute of Japan). Standard for Structural Calculation of Reinforced Concrete Structures; AIJ: Tokyo, Japan, 2010. [Google Scholar]
- Li, K.N. Canny (Version C11): A 3-Dimensional Nonlinear Dynamic Structural Analysis Computer Program, User Manual; CANNY Structural Analysis: Vancouver, BC, Canada, 2009. [Google Scholar]
- Lee, K.S.; Jung, J.S. A Seismic Capacity of R/C Building Damaged by the 2016 Gyeongju Earthquake Based on the Non-linear Dynamic Analysis. J. Korea Inst. Struct. Maint. Insp. 2018, 22, 137–146. [Google Scholar]
- Matsumoto, Y.; Kitajima, K.; Nakanishi, M.; Adachi, H. A Study on Seismic Retrofit Design of Exiting R/C Buildings by means of Friction Damper. Proc. Jpn. Concr. Inst. 1999, 21, 391–396. (In Japanese) [Google Scholar]
- Yokouchi, H.; Kitajima, K.; Nakanishi, M.; Adachi, H.; Aoyama, H. Experimental Study on Retrofit Effect of an Existing R/C School Building Retrofitted with Energy Dissipation Devices. J. Struct. Constr. Eng. 2005, 70, 145–152. (In Japanese) [Google Scholar] [CrossRef] [PubMed]
- Jung, J.S.; Lee, K.S. A Methodology for Evaluating Seismic Capacity and Seismic Risk Assessment of Reinforced Concrete Buildings in Korea. J. Asian Archit. Build. Eng. 2020, 19, 103–122. [Google Scholar] [CrossRef]
- Park, R. Ductility evaluation form laboratory and analytical testing. In Proceedings of the 9th World Conference on Earthquake Engineering in Japan, Tokyo, Japan, 2–9 August 1988; Volume VIII, pp. 605–616. [Google Scholar]


| Year | City and Region | Magnitude (M) |
|---|---|---|
| 1978 | Hongseong, Chungcheongnam-do | 4.9 |
| 1994 | Sinan, Jeollanam-do | 4.9 |
| 2003 | Baengnyeong Island, Incheon | 5.0 |
| 2004 | Uljin, Gyeongsangbuk-do | 5.2 |
| 2013 | Sinan, Jeollanam-do | 4.9 |
| 2013 | Baengnyeong Island, Incheon | 4.9 |
| 2014 | Taean, Chungcheongnam-do | 5.1 |
| 2016 | Gyeongju, Gyeongsangbuk-do | 5.8 |
| 2017 | Pohang, Gyeongsangbuk-do | 5.4 |
| 2019 | Miryang, Gyeongsangnam-do | 3.5 |
| 2021 | Sinan, Jeollanam-do | 3.7 |
| 2022 | Goesan, Chungcheongbuk-do | 4.1 |
| Specimens | Number of Shear Surface () | Number of Bolt () | Diameter of Bolt () | Torque () | Clamp Force of Bolted Joint () | Design Strength of Friction Joints () |
|---|---|---|---|---|---|---|
| VLFD | 2 | 8 | 16 | 150 | 62.5 | 126.0 |
| LLFD | 2 | 8 | 16 | 150 | 62.53 | 126.0 |
| Specimens | Number of Shear Surface () | Number of Bolt () | Diameter of Bolt () | Torque () | Clamp Force of Bolted Joint () | Design Strength of Friction Joints () |
|---|---|---|---|---|---|---|
| FP-LLFD-1 FP-LLFD-2 | 2 | 8 | 16 | 100 | 41.6 | 93.3 |
| 200 | 83.3 | 186.6 | ||||
| 300 | 125 | 280.0 | ||||
| GS-LLFD-1 GS-LLFD-2 | 2 | 8 | 16 | 100 | 41.6 | 84.0 |
| 200 | 83.3 | 168.0 | ||||
| 300 | 125 | 252.0 |
| Specimens | Torque () | Yield State | Maximum Strength | ||
|---|---|---|---|---|---|
| (mm) | Strength (kN) | Positive (kN) | Negative (kN) | ||
| FP-LLFD-1 | 100 | 0.11 | 22.6 | 24.7 | 23.0 |
| 200 | 0.41 | 76.1 | 86.8 | 85.0 | |
| 300 | 0.41 | 151.0 | 192.0 | 190.3 | |
| FP-LLFD-2 | 100 | 0.04 | 23.4 | 29.8 | 27.0 |
| 200 | 0.11 | 81.2 | 119.6 | 116.0 | |
| 300 | 0.08 | 159.8 | 221.8 | 220.7 | |
| GS-LLFD-1 | 100 | 0.04 | 20.2 | 21.3 | 22.6 |
| 200 | 0.08 | 145.0 | 177.7 | 176.3 | |
| 300 | 0.18 | 252.2 | 274.2 | 273.8 | |
| GS-LLFD-2 | 100 | 0.36 | 33.2 | 34.8 | 34.9 |
| 200 | 0.17 | 111.7 | 114.9 | 118.0 | |
| 300 | 0.39 | 238.7 | 269.7 | 263.4 | |
| Criterion | Performance Requirements |
|---|---|
| 1 | During cyclic loading for a certain number of cycles, both the maximum load () and the minimum load () measured at the zero-displacement point are required to be within 15% of the average () of all measured loads. |
| 2 | During cyclic loading for a certain number of cycles, the loads measured in each direction at the maximum device displacement are required to be within 15% of the average of all measured loads. |
| 3 | During cyclic loading for a certain number of cycles, the area of the hysteresis loop measured by RCom the damper () is required to be within 15% of the average of all measured hysteresis loop areas (). |
| Classification | Performance Suitability Conditions | ||||
|---|---|---|---|---|---|
| Condition 1 | Cycle | 1 | 2 | 3 | Average |
| Vd,max (kN) | 190.3 | 190.3 | 184.5 | 188.4 | |
| Vd,min (kN) | −188.7 | −189 | −190 | −189.2 | |
| (Vd,max − Vave)/Vave | 1.01 | 1.01 | −2.07 | - | |
| (Vd,min − Vave)/Vave | −0.26 | −0.11 | 0.42 | - | |
| Result | Conforming | Conforming | Conforming | - | |
| Condition 2 | Cycle | 1 | 2 | 3 | Average |
| Vd,max (kN) | 171.3 | 170.5 | 169.4 | 170.4 | |
| Vd,min (kN) | −173.6 | −173.1 | −173.5 | −173.4 | |
| (Vd,max − Vave)/Vave | 0.53 | 0.06 | −0.59 | - | |
| (Vd,min − Vave)/Vave | 0.12 | −0.17 | 0.06 | - | |
| Result | Conforming | Conforming | Conforming | - | |
| Condition 3 | Cycle | 1 | 2 | 3 | Average |
| Ed (kN·mm) | 23.4 | 22.8 | 23.2 | 23.1 | |
| (Ed − Ed,ave)/Ed,ave | 1.3 | −1.3 | 0.43 | - | |
| Result | Conforming | Conforming | Conforming | - | |
| Classification | Performance Suitability Conditions | ||||
|---|---|---|---|---|---|
| Condition 1 | Cycle | 1 | 2 | 3 | Average |
| Vd,max (kN) | 220.4 | 221.5 | 218.6 | 220.2 | |
| Vd,min (kN) | −219.3 | −220.3 | −220.6 | −220.1 | |
| (Vd,max − Vave)/Vave | 0.09 | 0.59 | −0.73 | - | |
| (Vd,min − Vave)/Vave | −0.36 | 0.09 | 0.23 | - | |
| Result | Conforming | Conforming | Conforming | - | |
| Condition 2 | Cycle | 1 | 2 | 3 | Average |
| Vd,max (kN) | 196.3 | 199.1 | 199.2 | 198.2 | |
| Vd,min (kN) | −192.9 | −199.3 | −200.3 | −197.5 | |
| (Vd,max − Vave)/Vave | −0.96 | 0.45 | 0.5 | - | |
| (Vd,min − Vave)/Vave | −2.33 | 0.91 | 1.42 | - | |
| Result | Conforming | Conforming | Conforming | - | |
| Condition 3 | Cycle | 1 | 2 | 3 | Average |
| Ed (kN·mm) | 27.4 | 27.8 | 27.2 | 27.5 | |
| (Ed − Ed,ave)/Ed,ave | −0.36 | 1.09 | −1.09 | - | |
| Result | Conforming | Conforming | Conforming | - | |
| Classification | Performance Suitability Conditions | ||||
|---|---|---|---|---|---|
| Condition 1 | Cycle | 1 | 2 | 3 | Average |
| Vd,max (kN) | 259.7 | 259 | 260.8 | 259.8 | |
| Vd,min (kN) | −262.7 | −261.3 | −267 | −263.7 | |
| (Vd,max − Vave)/Vave | −0.04 | −0.31 | 0.38 | - | |
| (Vd,min − Vave)/Vave | −0.38 | −0.91 | 1.25 | - | |
| Result | Conforming | Conforming | Conforming | - | |
| Condition 2 | Cycle | 1 | 2 | 3 | Average |
| Vd,max (kN) | 247.8 | 256.4 | 263.6 | 255.9 | |
| Vd,min (kN) | −258.7 | −266 | −271.9 | −265.5 | |
| (Vd,max − Vave)/Vave | −3.17 | 0.2 | 3.01 | - | |
| (Vd,min − Vave)/Vave | −2.56 | 0.19 | 2.41 | - | |
| Result | Conforming | Conforming | Conforming | - | |
| Condition 3 | Cycle | 1 | 2 | 3 | Average |
| Ed (kN·mm) | 27.4 | 27.8 | 27.2 | 27.5 | |
| (Ed − Ed,ave)/Ed,ave | −0.36 | 1.09 | −1.09 | - | |
| Result | Conforming | Conforming | Conforming | - | |
| Classification | Performance Suitability Conditions | ||||
|---|---|---|---|---|---|
| Condition 1 | Cycle | 1 | 2 | 3 | Average |
| Vd,max (kN) | 262.8 | 267.9 | 267.7 | 266.1 | |
| Vd,min (kN) | −252.4 | −253 | −254 | −253.1 | |
| (Vd,max − Vave)/Vave | −1.24 | 0.68 | 0.6 | - | |
| (Vd,min − Vave)/Vave | −0.28 | −0.04 | 0.36 | - | |
| Result | Conforming | Conforming | Conforming | - | |
| Condition 2 | Cycle | 1 | 2 | 3 | Average |
| Vd,max (kN) | 246.6 | 255.1 | 260.4 | 254 | |
| Vd,min (kN) | −238.1 | −244.7 | −249 | −243.9 | |
| (Vd,max − Vave)/Vave | −2.91 | 0.43 | 2.52 | - | |
| (Vd,min − Vave)/Vave | −2.38 | 0.33 | 2.09 | - | |
| Result | Conforming | Conforming | Conforming | - | |
| Condition 3 | Cycle | 1 | 2 | 3 | Average |
| Ed (kN·mm) | 32.1 | 32 | 32.2 | 32.1 | |
| (Ed − Ed,ave)/Ed,ave | 0 | −0.31 | 0.31 | - | |
| Result | Conforming | Conforming | Conforming | - | |
| Specimens | Test Methods | Strengthening Types | Earthquake Levels (cm/s2) | |
|---|---|---|---|---|
| PD-RC | Pseudo-dynamic | Non | 200 | |
| PD-LLFD-V | Pseudo-dynamic | LLFD-V typed seismic control system | 200/300/400/500 | |
| Notation | PD | RC LLFD-V | PD: Pseudo-dynamic test RC: R/C Frame without strengthening LLFD-V: R/C Frame strengthened using the LLFD V-typed seismic control system | |
| Specimen | Earthquake Wave | Input Ground Acceleration [cm/s2] | Maximum Load Vu [kN] | Maximum Displacement δu [mm] | Degree of Damage * (Failure Mode) |
|---|---|---|---|---|---|
| PD-RC | Hachinohe (EW) | 200 | 251.4 | 67.3 | Collapse (shear failure) |
| PD-LLFD-V | Hachinohe (EW) | 200 | 439.7 | 9.6 | Light (flexural crack) |
| 300 | 610.9 | 15.7 | Small (flexural crack) | ||
| 400 | 756.6 | 27.1 | Medium (flexural shear failure) | ||
| 500 | 883.6 | 36.3 | Medium (flexural shear failure) |
| Specimen | Earthquake Wave | Input Ground Acceleration [cm/s2] | Seismic Response Load | Seismic Response Displacement | ||
|---|---|---|---|---|---|---|
| Maximum Load Vu [kN] | Maximum Strength Ratio Rs *1 | Maximum Displacement δu [mm] | Displacement Ratio Rd *2 | |||
| PD-RC | Hachinohe (EW) | 200 | 251.4 | 1.00 (251.4/251.4) | 67.3 | 1.00 (67.3/67.3) |
| PD-LLFD-V | Hachinohe (EW) | 200 | 439.7 | 1.74 (439.7/251.4) | 9.6 | 0.14 (9.6/67.3) |
| 300 | 610.9 | 2.42 (610.9/251.4) | 15.7 | 0.23 (15.7/67.3) | ||
| 400 | 756.6 | 3.00 (756.6/251.4) | 27.1 | 0.40 (27.1/67.3) | ||
| 500 | 883.6 | 3.51 (883.6/251.4) | 36.3 | 0.54 (36.3/67.3) | ||
| Member | T0 (kN·m) | δd,y [mm] | [kN] | [kN/mm] |
|---|---|---|---|---|
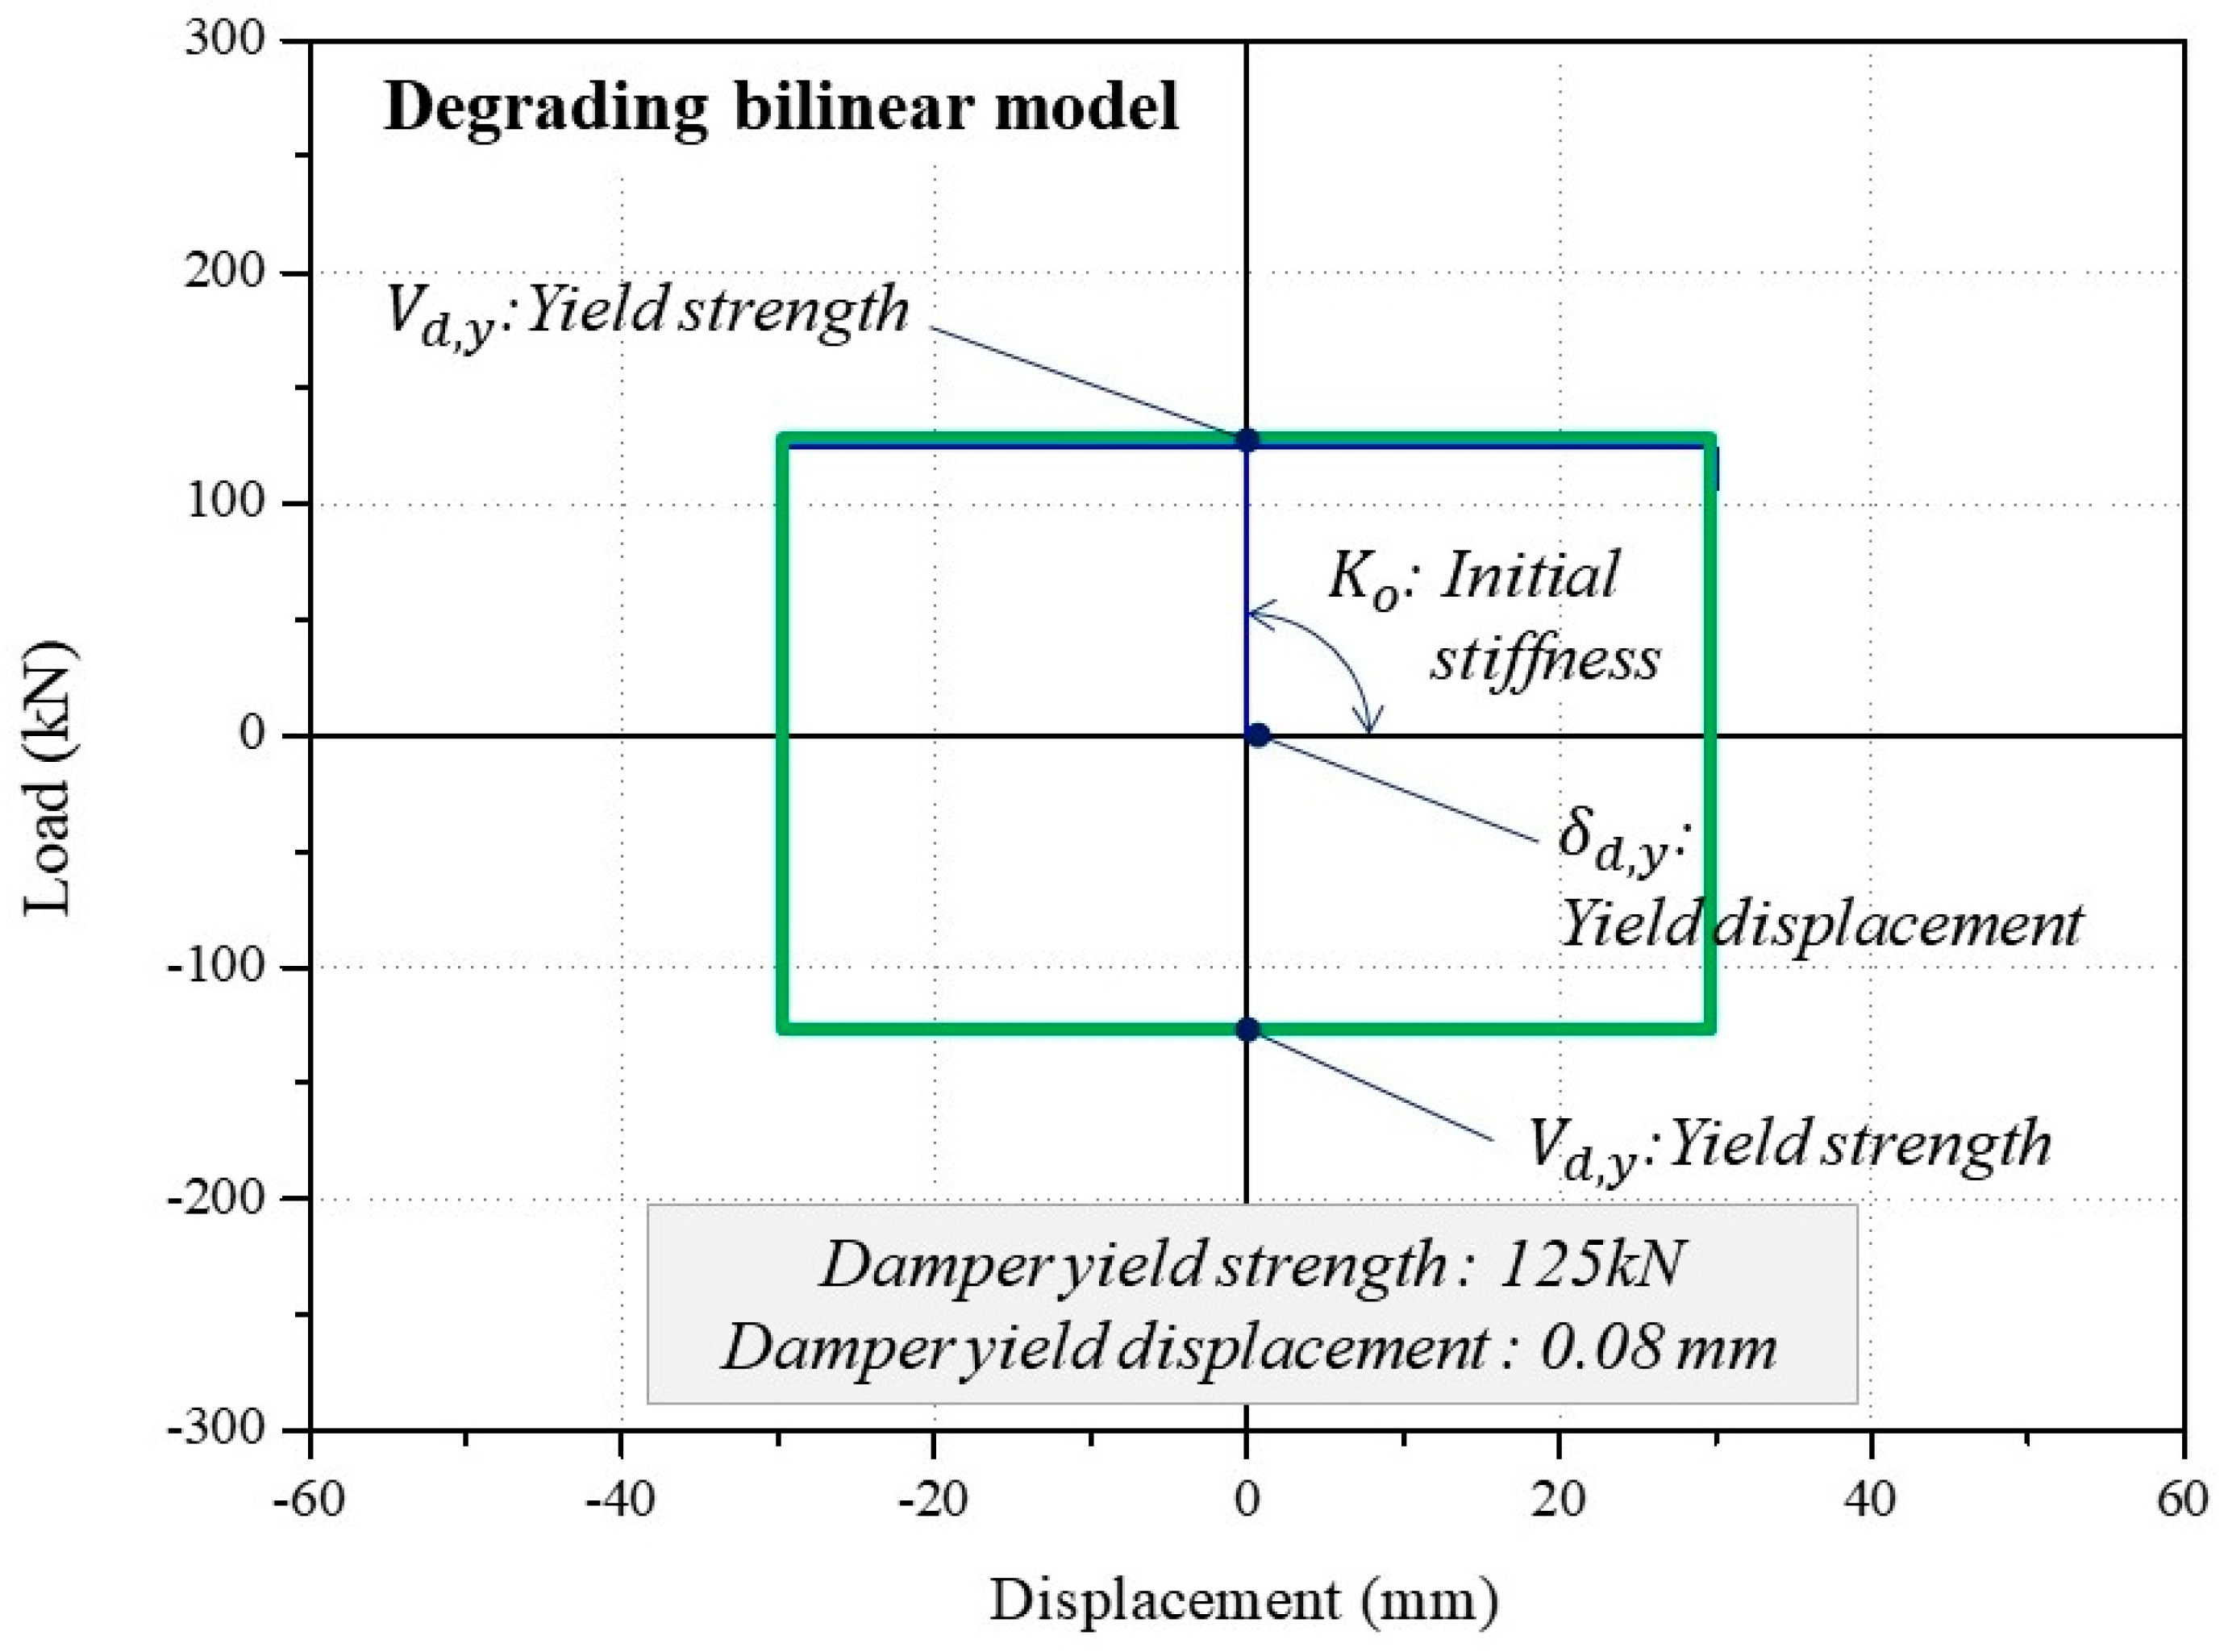
| LLFD | 200 | 0.08 | 125 | 15,625 |
| Member | Restoring Force Model | Model Name | |
|---|---|---|---|
| Beam | Flexural spring | CP3 | Cross-peak trilinear model |
| Shear spring | OO3 | Trilinear origin-oriented | |
| Column | Flexural spring | CA7 | CANNY sophisticated trilinear hysteresis model |
| Shear spring | OO3 | Trilinear origin-oriented | |
| Axial spring | AS1 | Axial stiffness model | |
| Wall | Shear spring | OO3 | Trilinear origin-oriented |
| Anchor bolt | Shear spring | EL2 | Bilinear elastic model |
| LLFD | Damper spring | PP | Perfect Plastic model |
| Steel frame | Flexural spring | BL2 | Degrading bilinear model |
| Shear spring | EL2 | Bilinear elastic model | |
| Specimen | Input Ground Acceleration [cm/s2] | Method | Maximum Displacement [mm] | Maximum Displacement Deviation Ratio [Analysis/Test] | Maximum Load [kN] | Maximum Load Deviation Ratio [Analysis/Test] |
|---|---|---|---|---|---|---|
| PD-RC | 200 | PDT | 67.3 | 1.07 | 251.4 | 1.05 |
| NDA | 71.9 | 263.1 | ||||
| PD-LLFD-V | 200 | PDT | 9.5 | 0.99 | 439.6 | 0.95 |
| NDA | 9.4 | 416.5 | ||||
| 300 | PDT | 15.7 | 1.08 | 610.9 | 0.91 | |
| NDA | 17.0 | 553.0 | ||||
| 400 | PDT | 27.1 | 1.09 | 756.6 | 0.88 | |
| NDA | 29.5 | 662.6 |
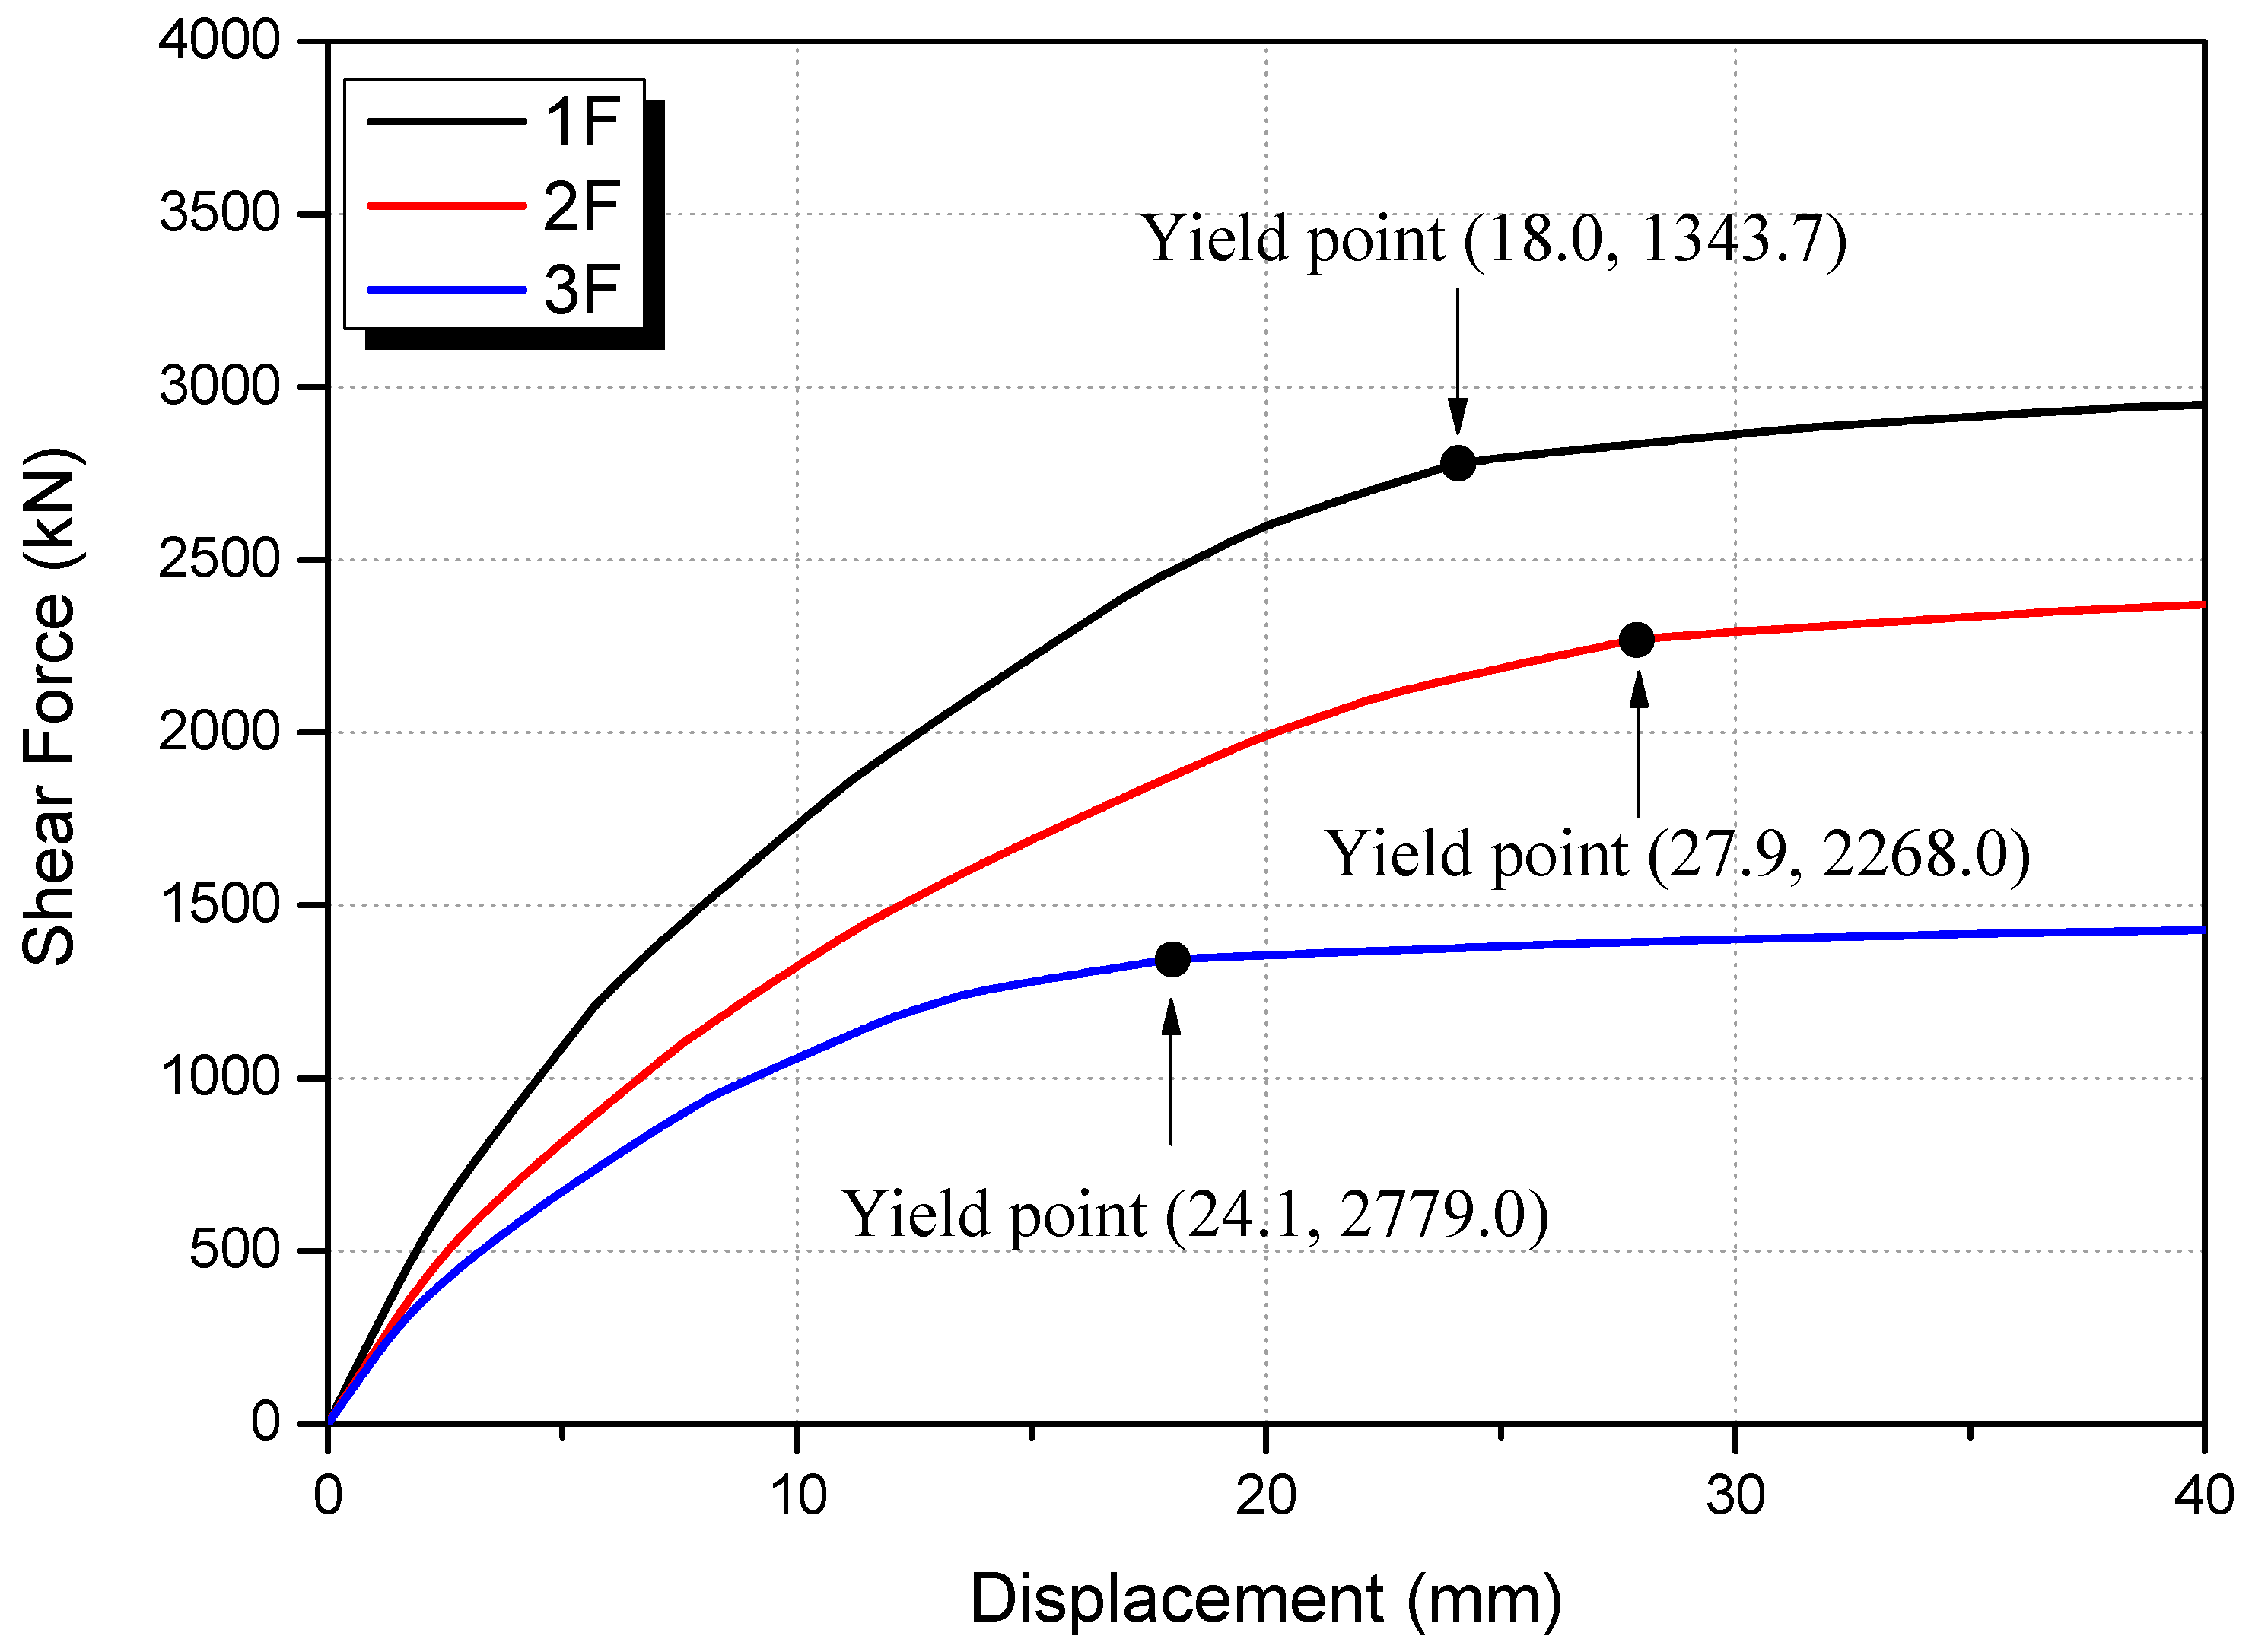
| Floor | Floor Height [mm] | Floor Weight W [kN] | Yield Displacement δy [mm] | Yield Strength Vy [kN] | Failure Mode | Basic Seismic Capacity Index Eo |
|---|---|---|---|---|---|---|
| 1 | 3300 | 1133.4 | 24.1 | 2779.0 | Shear failure | 0.24 |
| 2 | 3300 | 7556 | 27.9 | 2268.0 | Shear failure | 0.23 |
| 3 | 3300 | 3778 | 18.0 | 1343.7 | Shear failure | 0.23 |
| Floor | Yield Displacement of Damper [mm] | Yield Strength of Damper [kN] | Accumulated Deformation Factor | Targeted Performance | Required Damper Strength | Number of Required Dampers [EA] | Number of Applied Dampers [EA] |
|---|---|---|---|---|---|---|---|
| 1 | 0.08 | 125 | 10 | 0.52 | 500.1 | 4.01 | 4 |
| 2 | 0.52 | 418.6 | 3.36 | 4 | |||
| 3 | 0.52 | 256.1 | 2.06 | 2 |
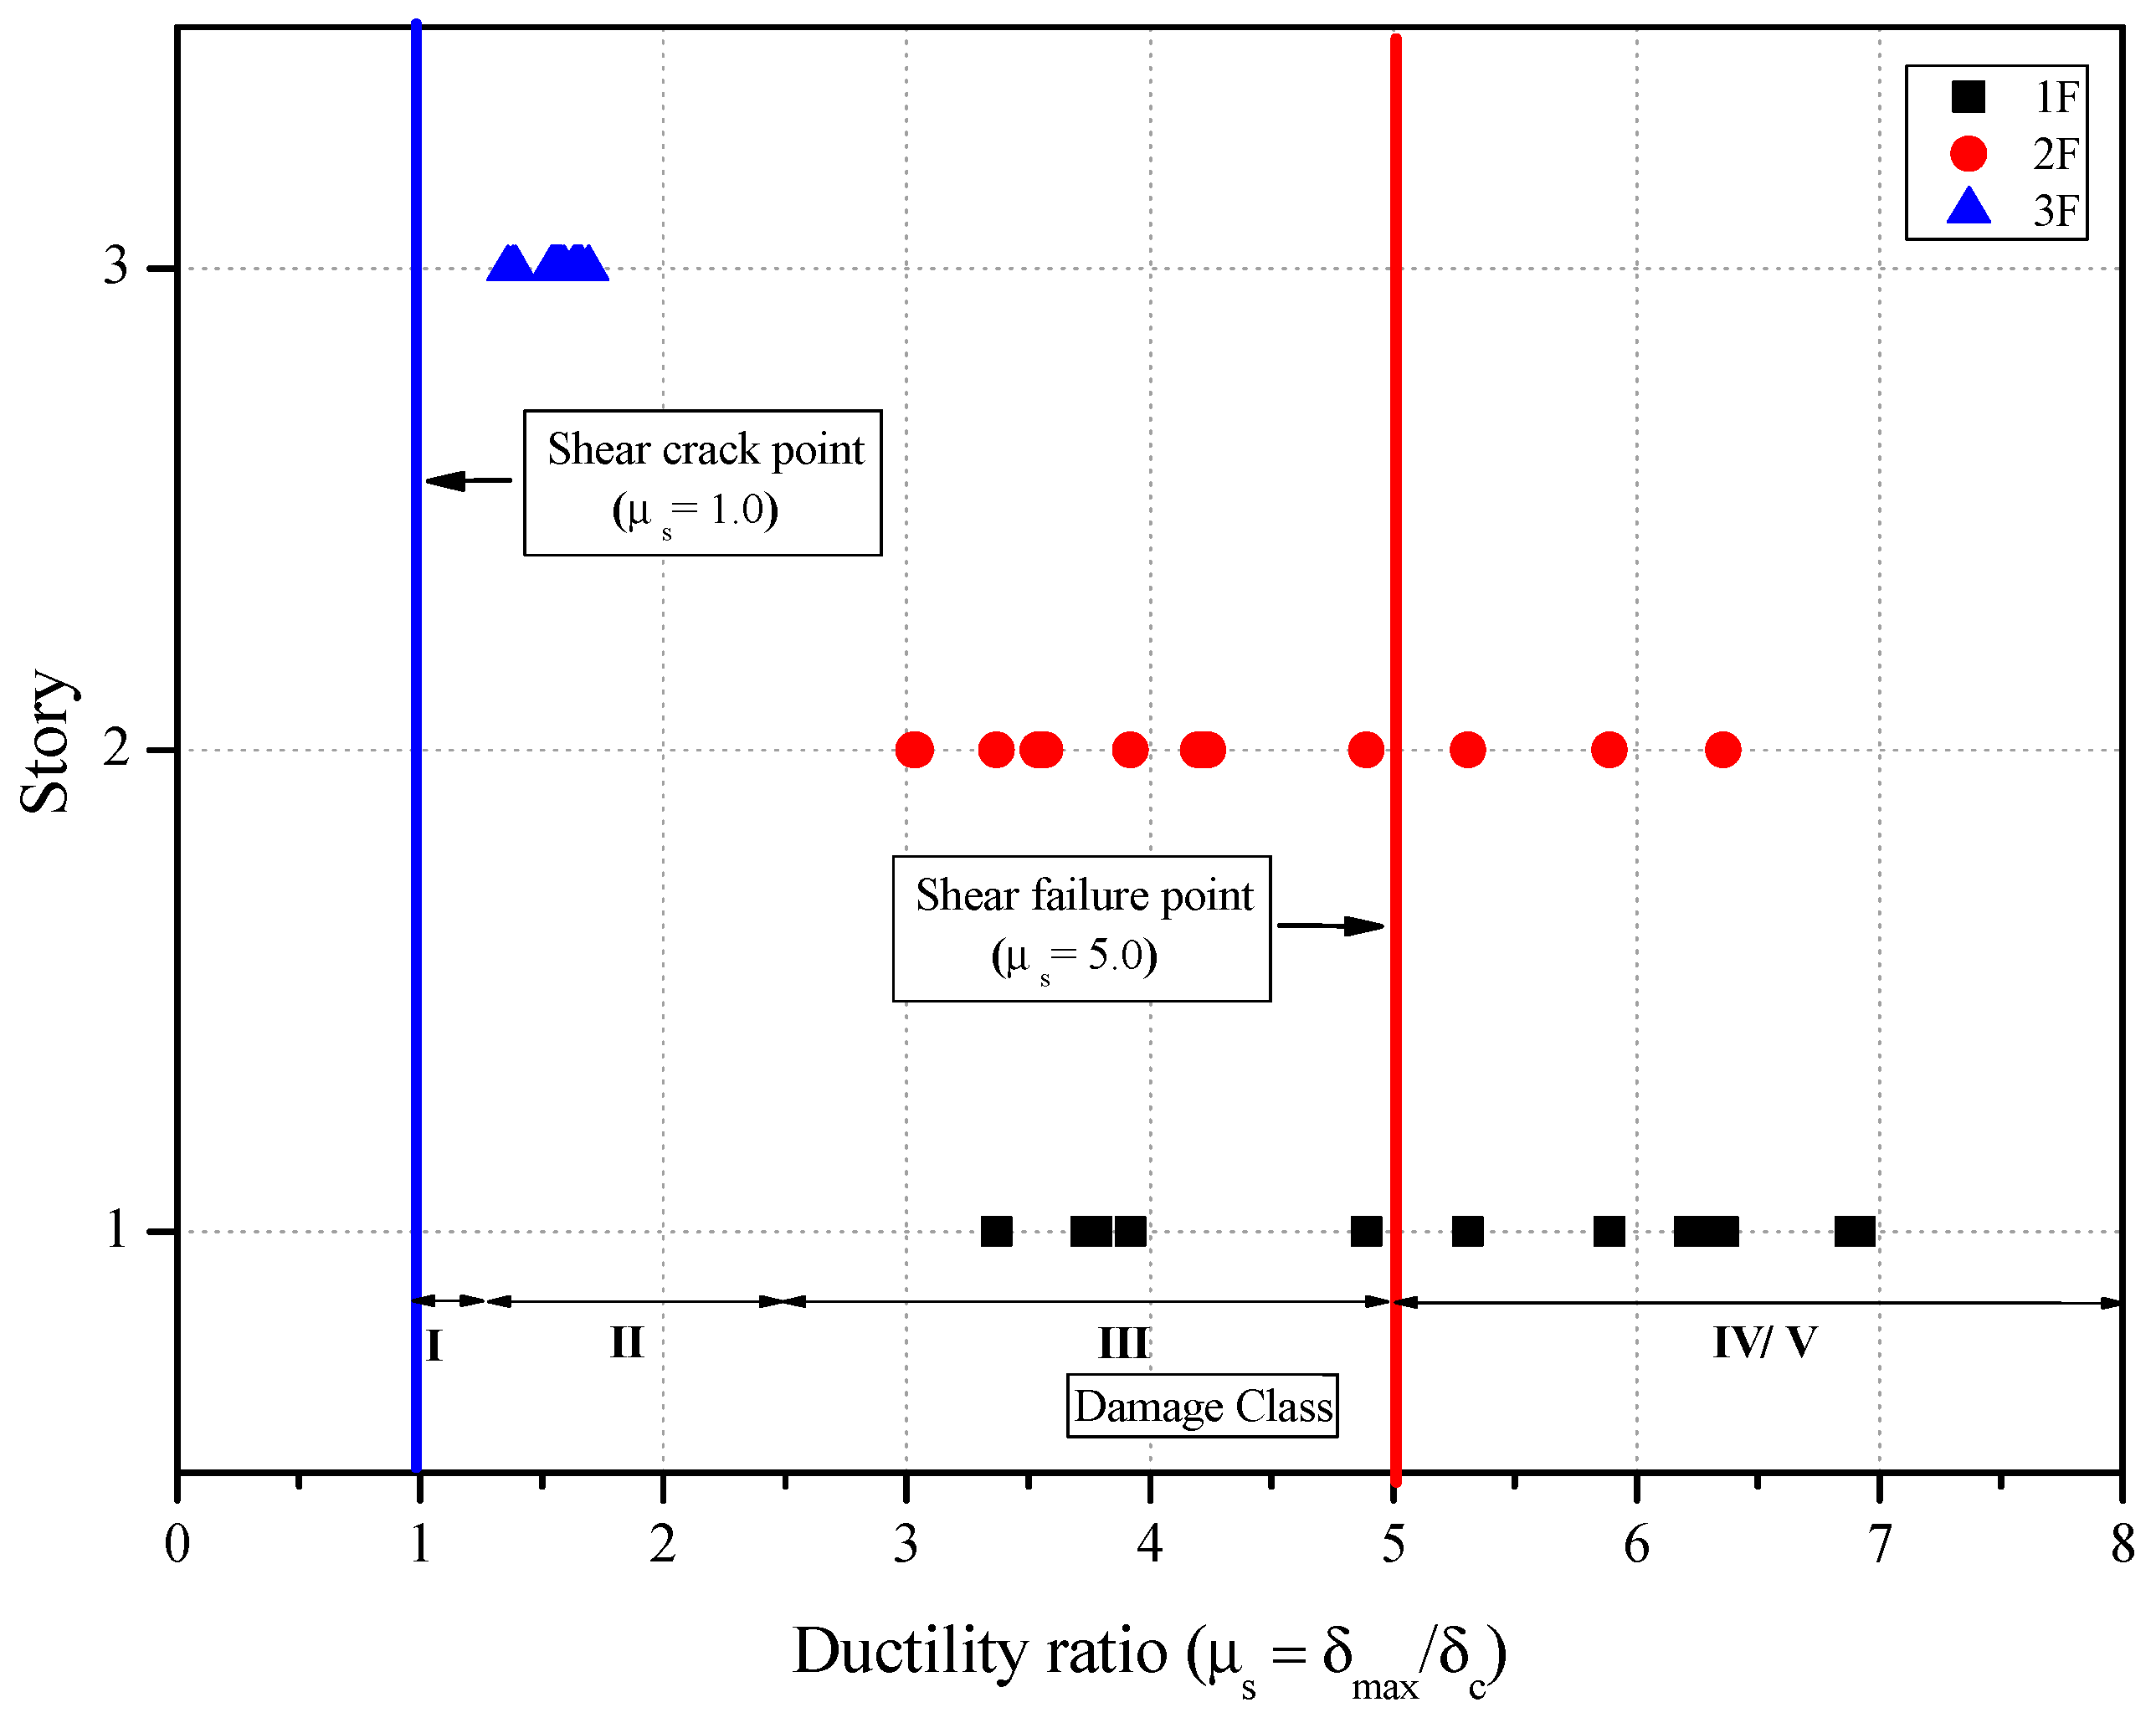
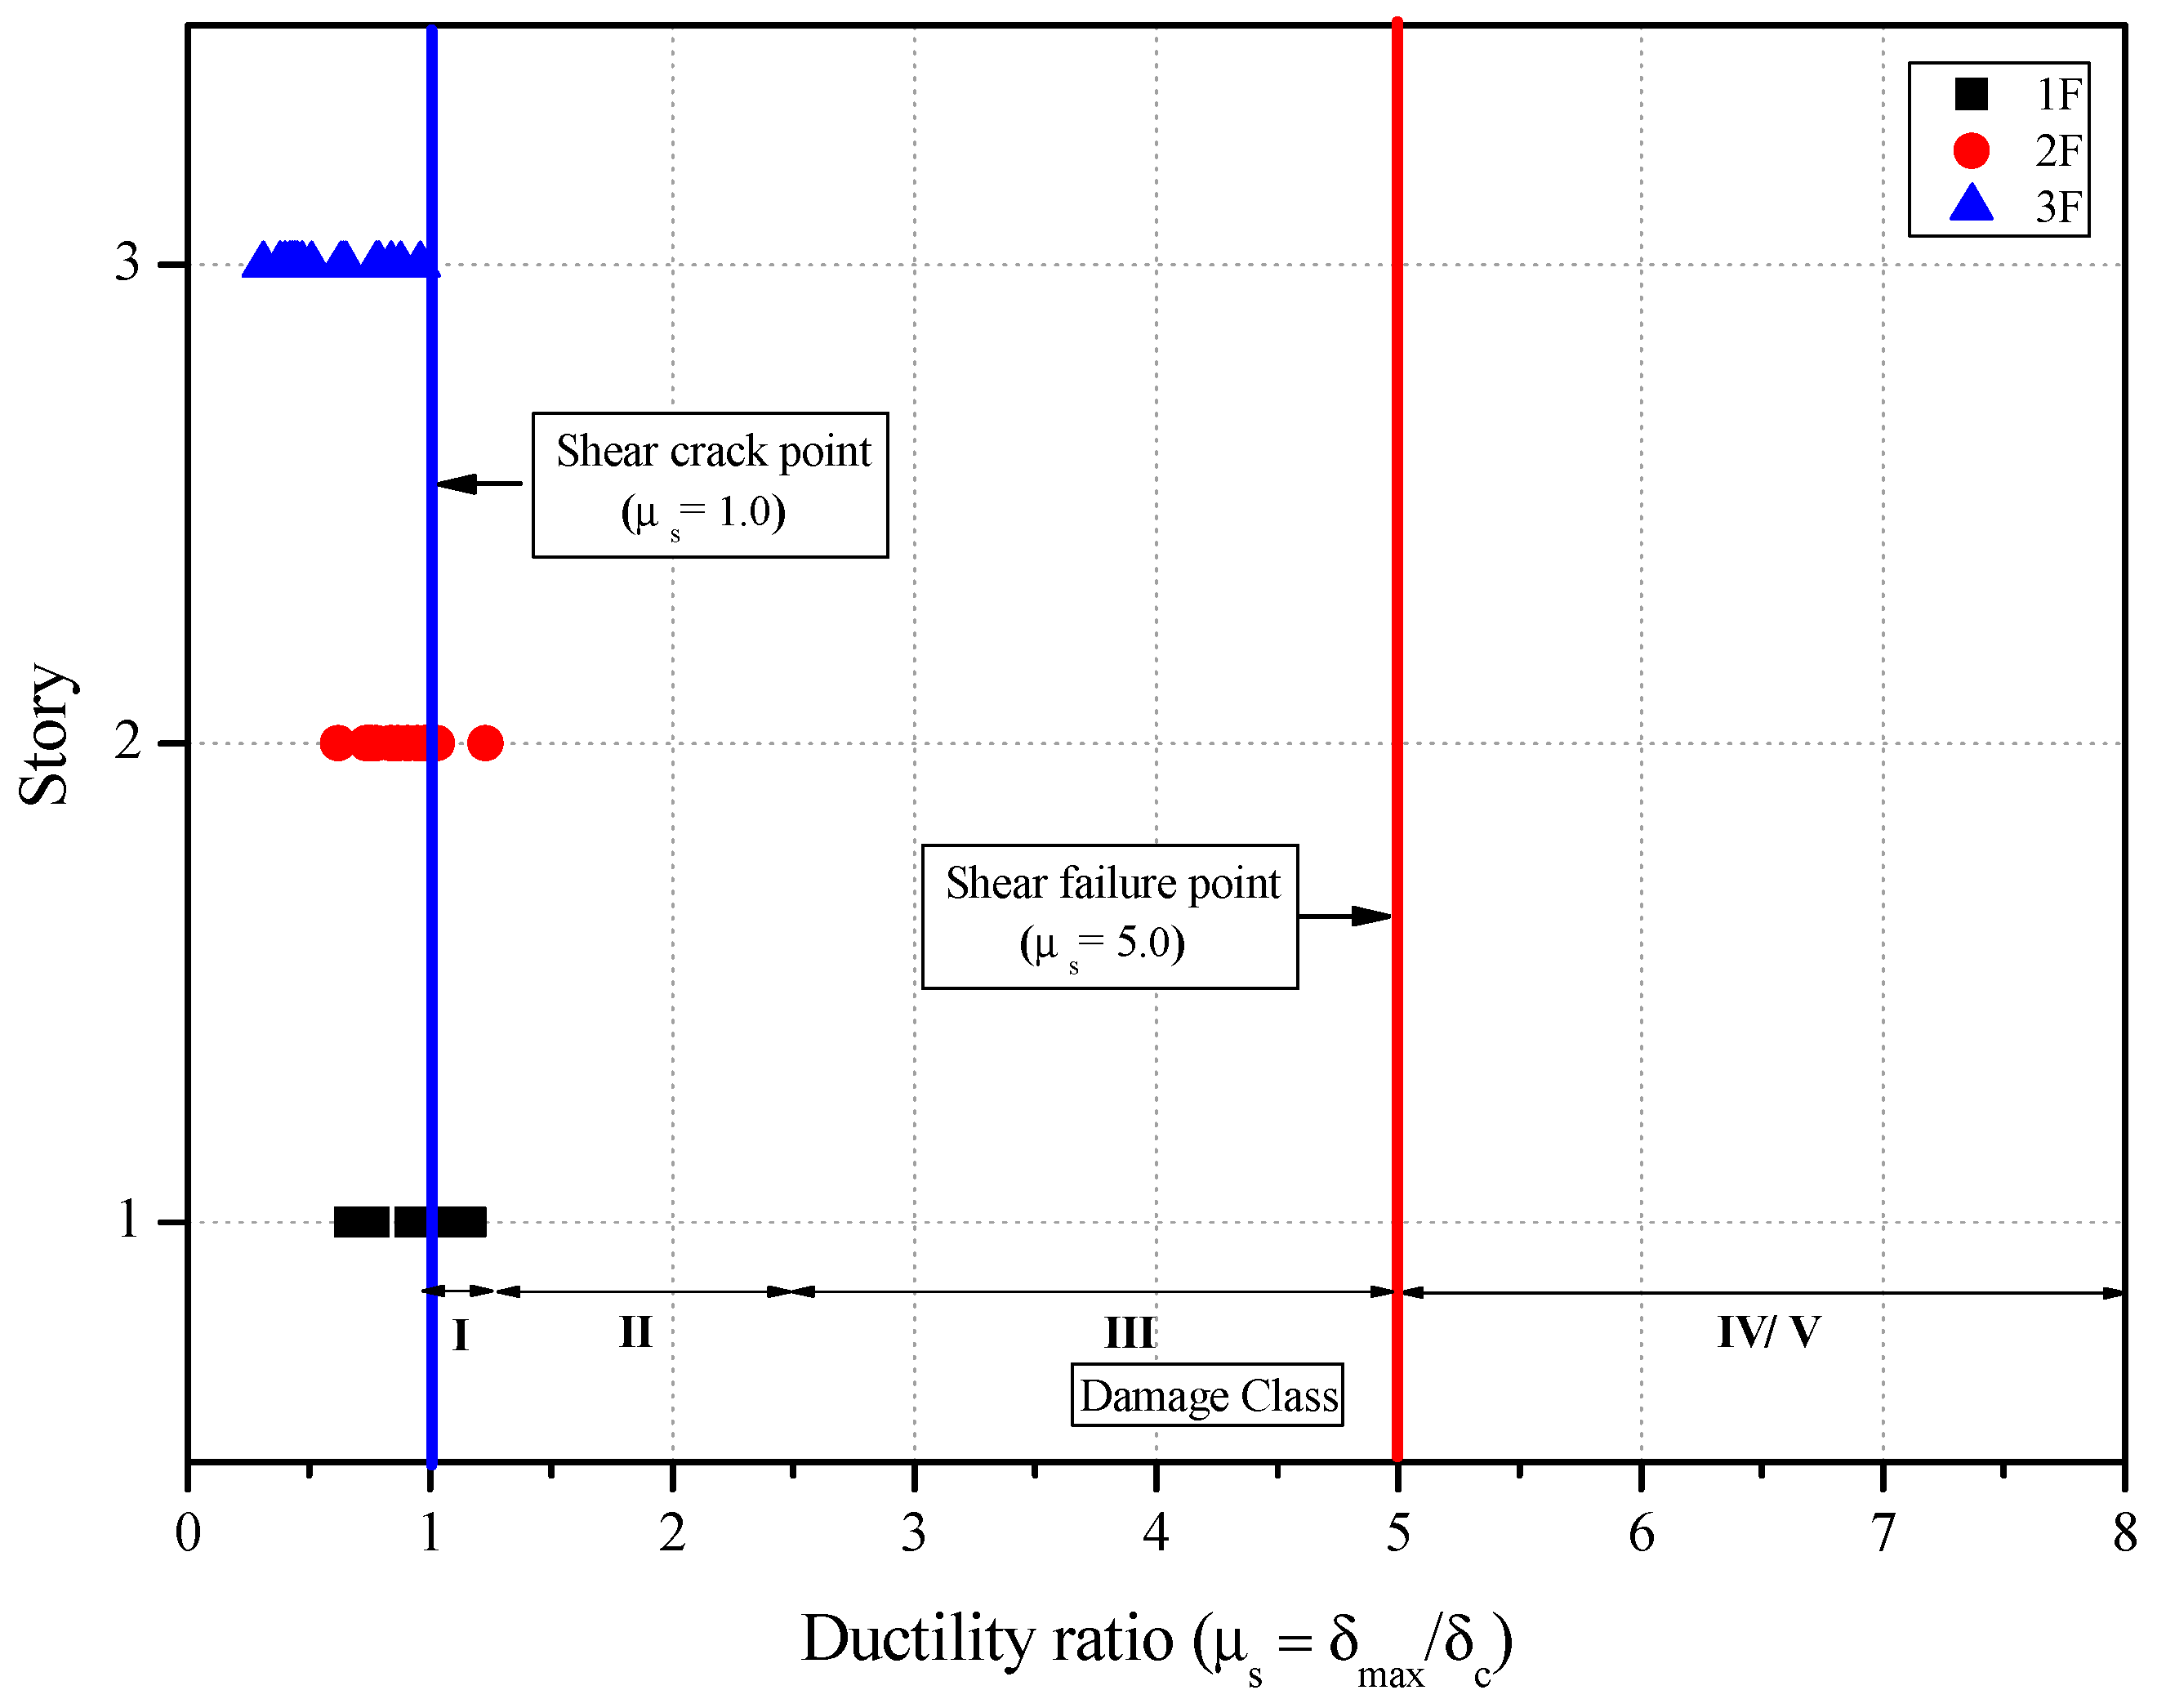
| Building | Floor | Maximum Response Strength [kN] | Maximum Response Displacement and Displacement Ratio [mm] | Failure Mode | Degree of Damage * |
|---|---|---|---|---|---|
| Non-strengthened | 1 | 3584.2 | 49.1 | Shear failure | Collapse |
| 2 | 2651.9 | 38.2 | Shear failure | Large | |
| 3 | 1411.3 | 22.6 | Shear crack | Small | |
| NBSD-strengthened | 1 | 3373.2 | 7.5 [0.15] | Flexural and Shear crack | Light |
| 2 | 3200.8 | 8.9 [0.23] | Flexural and Shear crack | Light | |
| 3 | 1739.4 | 8.1 [0.36] | Flexural and Shear crack | Light |
| Building | Kinetic Energy [kN·m] | Plastic Deformation Energy [kN·m] | Damping Energy [kN·m] | Total Energy [kN·m] | Plastic Deformation Energy of LLFD System [kN·m] | LLFD System Contribution (%) |
|---|---|---|---|---|---|---|
| NBSD-strengthened | 1.06 | 43.1 | 28.1 | 217.4 | 146.0 | 67.1 |
Disclaimer/Publisher’s Note: The statements, opinions and data contained in all publications are solely those of the individual author(s) and contributor(s) and not of MDPI and/or the editor(s). MDPI and/or the editor(s) disclaim responsibility for any injury to people or property resulting from any ideas, methods, instructions or products referred to in the content. |
© 2023 by the authors. Licensee MDPI, Basel, Switzerland. This article is an open access article distributed under the terms and conditions of the Creative Commons Attribution (CC BY) license (https://creativecommons.org/licenses/by/4.0/).
Share and Cite
Lee, B.-G.; Kim, J.-Y.; Jung, J.-S.; Lee, K.-S. Seismic Capacity of R/C Buildings Retrofitted with a V-Bracing System Equipped with a Novel Laterally Layered Friction Damper. Appl. Sci. 2023, 13, 13205. https://doi.org/10.3390/app132413205
Lee B-G, Kim J-Y, Jung J-S, Lee K-S. Seismic Capacity of R/C Buildings Retrofitted with a V-Bracing System Equipped with a Novel Laterally Layered Friction Damper. Applied Sciences. 2023; 13(24):13205. https://doi.org/10.3390/app132413205
Chicago/Turabian StyleLee, Bok-Gi, Jin-Young Kim, Ju-Seong Jung, and Kang-Seok Lee. 2023. "Seismic Capacity of R/C Buildings Retrofitted with a V-Bracing System Equipped with a Novel Laterally Layered Friction Damper" Applied Sciences 13, no. 24: 13205. https://doi.org/10.3390/app132413205
APA StyleLee, B.-G., Kim, J.-Y., Jung, J.-S., & Lee, K.-S. (2023). Seismic Capacity of R/C Buildings Retrofitted with a V-Bracing System Equipped with a Novel Laterally Layered Friction Damper. Applied Sciences, 13(24), 13205. https://doi.org/10.3390/app132413205