Abstract
The optical reflection characteristics of asphalt pavement have an important influence on road-lighting design, and the macrotexture and microtexture of asphalt pavement significantly affect its reflection characteristics. To investigate the impact of texture parameters on the retroreflection coefficient of asphalt pavement, the texture indices of rutted plate specimens and field asphalt pavement were obtained by a pavement texture tester, including the macrotexture surface area (S1), microtexture surface area (S2), macrotexture distribution density (D1), microtexture distribution density (D2), root mean square slope (Δq), skewness (Rsk), and steepness (Rku). The corresponding retroreflective coefficient RL was measured by using a retroreflectometer. In the laboratory experiments, rutted specimens of AC-13, SMA-13, and OGFC-13 asphalt mixtures were formed. The changes in texture parameters and the retroreflection coefficient of rutting specimens before and after rolling were studied, and a factor-influence model between macro- and microtexture parameters and RL was established, along with correlation models of the texture index and RL. The results show that after the rutting test, S1, S2, D1, D2, Δq, and Rku decreased, Rsk increased, and RL increased. In the single-factor model, the parameters could be used to characterize RL with high prediction accuracy, whereas for the onsite measurements, the parameters Δq, Rsk, and Rku could well characterize RL. The nonlinear model established, based on the BP neural network algorithm, improved the prediction accuracy. This research provides ideas for optimizing the reflection characteristics of asphalt pavement and a decision-making basis for road-lighting design.
1. Introduction
Scientific and reasonable road-lighting design is of great significance to improve road safety [1,2,3] and reduce energy consumption [4]. The optical reflection characteristics of the road surface constitute an essential basis for road-lighting calculations. The International Commission on Illumination (CIE) recommends using a reduced-brightness coefficient table (r-table) to represent the reflection characteristics of different pavement materials. The CIE provides a series of standard r-tables [5] for many lighting-design software calculations. These tables are very convenient for the design of road lighting. However, the standard r-tables obtained from measurement data in the 1970s do not widely represent the reflectance characteristics of roads today, and the use of uncorrected r-tables for lighting design will lead to a deviation between the designed and actual brightness of the pavement [6]. In recent years, increasing research efforts have been devoted to obtaining reduced-brightness coefficient tables [7,8,9,10,11] or developing different devices [12,13,14] to accurately obtain the optical reflectance characteristics of actual roads and improve the accuracy of road-lighting design.
However, the complexity of laboratory measurements and the backwardness of related measuring instruments restrict the accuracy of acquiring the reduced luminance coefficient. Therefore, the CIE recommends using the retroreflectivity coefficient, RL, which is measured at the road site, to indicate the reflective characteristics of the pavement surface [5].
The pavement’s surface texture is defined as any deviation of the pavement surface from the actual plane [15]. The World Road Association (known as PIARC) [16] classifies the surface structure of asphalt pavement into four types: microtexture, macrotexture, macrostructure, and uneven, based on the wavelength in the horizontal direction, the amplitude in the vertical direction, the power spectral characteristics of asphalt pavement, and the possible impact on road users, where the microtexture is less than 0.5 mm and the macrotexture is in the range of 0.5–50.0 mm [17]. The texture depends on the composition of the top layer of the pavement material, while the reflectivity of the surface is determined by the micro- and macrotexture [18].
Macrotexture refers to irregularities in the rough texture of the road surface, which mainly depend on the nature of the aggregate (such as its size, grading, shape, and distribution), the nominal maximum size of the aggregate, and the nature of the asphalt mixture (such as the content, mix design, and void ratio) [19,20,21]. The macrotexture depends mainly on the roughness of the road surface, controls the noise between the tires and the road surface as well as friction at high speeds, and mainly provides drainage in rainy weather [22]. Microtexture refers to the fine structural irregularities on the surfaces of the aggregate particles, generally reaching the micrometer level, and is mainly related to the mineral composition of the particles [23]. The microtexture interacts with rubber tires at the molecular scale and provides adhesion. Thus, it is important on both wet and dry pavement [24,25], and it also has important antislip properties [26].
Due to the low accuracy of traditional pavement texture measurement in the past, a set of ultra-high-speed line laser-testing systems, based on an image-recognition method, has been developed, which can significantly improve the efficiency and accuracy of 3D data measurement for the structure and texture morphology of asphalt pavement [27]. Yang et al. [28,29] measured the surface-texture characteristics of three typical grades of asphalt mixtures, AC, SMA, and OGFC, according to the experimental data to establish a regression model with the mass ratio, the product of particle size, and the average depth of the structure of the dependent variable. The model successfully predicted the structure of asphalt plate specimens using the parameters of different types of pavements. Weng et al. [30] obtained pavement texture data with the help of 3D laser scanning, extracted the surface-trait parameters based on geometric features and the multiscale feature parameters based on 2D wavelet transform as the model inputs, and predicted the gradation of asphalt under eight known gradations with the help of the model, and the goodness-of-fit was as high as 0.859.
Fernandez et al. [31] investigated the reflectance of interurban road pavement by real-time radar measurement. Moretti et al. [32] conducted a lighting design and case study of continuously reinforced concrete pavement, plain concrete pavement, and asphalt pavement to determine differences in pavement materials. The results showed that, regarding the total cost of cement pavement, energy consumption was 29% lower than that of asphalt pavement, and, in the use period of 5 years, the plain concrete pavement consumed less and had a longer life span than the continuously reinforced cement pavement. Cantisani et al. [33] conducted a life-cycle assessment (LCA) using four scenarios consisting of two types of road surfaces and two types of lighting systems. The result showed that using more reflective surface pavement materials (i.e., concrete vs. asphalt) could effectively mitigate the deleterious burdens related to road construction, maintenance, and use. Viktoras et al. [18] considered that the brightness of pavement was related to its reflective properties and that different pavements can have different reflective properties depending on the surface texture, material, and binder. Therefore, they conducted an experimental study on Vilnius city streets that differed in color and age. The results showed that red asphalt pavement had better reflective properties than black asphalt pavement. The simplified brightness factor of asphalt pavement installed in 2021 was about 12% lower than that of asphalt pavement installed 10 years ago.
To summarize, various studies have focused on obtaining the reflection coefficient of pavement materials and analyzing the measurement uncertainty, but not enough research has been conducted on the mechanism of the influence of material surface features on reflection characteristics. The environmental factors involved in actual road lighting are more complicated, with various types of pavement materials and different three-dimensional morphological structures. It is necessary to establish a scientific and reasonable quantitative expression model.
This research innovatively explores its influence on light-reflection characteristics from the perspective of the macro- and microstructure of asphalt pavement and proposes a research method combining retroreflection measurement and antiskid pavement texture test. The related indexes are extended from a laboratory test to a field test of asphalt pavement, and the correlation between the macro- and microtexture indexes and the inverse reflection coefficient of field pavement is deeply studied. Based on the indoor and field-test results, a quantitative characterization model between the macro-micro texture index and inverse reflection coefficient is established. The model provides a reliable method for asphalt-pavement lighting design in China.
2. Materials and Methods
2.1. Asphalt Mixtures
2.1.1. Asphalt
The binder used in the test was SBS-modified asphalt. The primary technical indicators of the binder were tested according to the Standard Test Methods of Bitumen and Bituminous Mixtures for Highway Engineering (JTG E20-2011) [34], and the test results are shown in Table 1. The results show that the technical indicators of the SBS-modified asphalt met the specification requirements of JTG F40-2004 [35].

Table 1.
Test results for SBS-modified asphalt.
2.1.2. Aggregates and Fillers
Basalt was used as coarse and fine aggregate in the test, and limestone mineral powder was used as filler. The density index of basalt, according to test specification JTG E42-2005 [36], is shown in Table 2, and the related technical index of limestone mineral powder is shown in Table 3. The results show that the aggregate and filler conformed to specification JTG F40-2004 [35].
Table 2.
Test results of aggregate density.
Table 3.
Limestone mineral powder technical index.
The typical and commonly used AC-13, SMA-13, and OGFC-13 graded asphalt mixtures were selected for the indoor test. The gradient curves are shown in Figure 1.
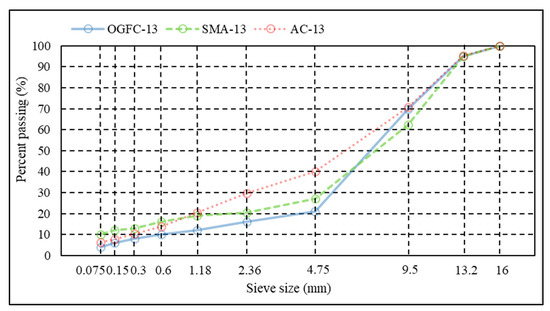
Figure 1.
Grading curves.
2.1.3. Fibers
The fibers in the SMA-13 asphalt mixture are lignin, and their basic performance was in accordance with the requirements of specification JTG F40-2004 [35]. Specific results are shown in Table 4.
Table 4.
Basic properties of lignin fibers.
2.2. Test Methods
2.2.1. Rutting Test
In this study, the rutting test was carried out according to the Standard Test Methods of Bitumen and Bituminous Mixtures for Highway Engineering (JTG E20-2011) [34]. The test used a Hamburg HYCZ-5A rutting instrument, the test temperature was 60 °C, the wheel pressure was 0.7 MPa, and the specimen size was 300 mm × 300 mm × 50 mm. The test wheel was a solid tire made of rubber with an outer diameter of 200 mm, wheel width of 50 mm, and rubber-layer thickness of 15 mm; the test wheel traveled a distance of 230 mm ± 10 mm, the round-trip rolling speed was 42 times/min ± 1 time/min, and the rolling time was 60 min. The test process is shown in Figure 2.
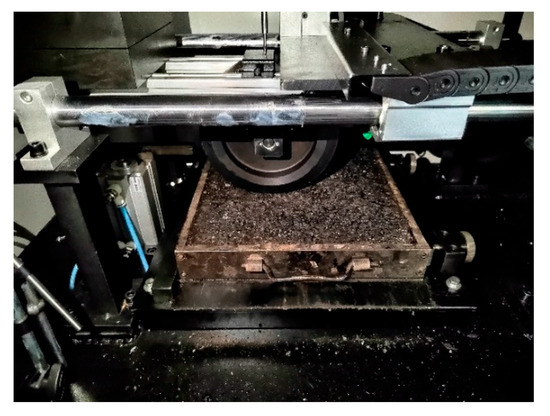
Figure 2.
Rutting test.
2.2.2. Test of Retroreflection Coefficient of Asphalt Pavement
An LTL-XL Mark II retroreflectometer was used to test the retroreflectivity coefficient, RL, of the asphalt pavement. The basic parameters of the retroreflectometer are listed in Table 5. The RL value represents the intensity of the driver’s visible reflected light on the road surface. In general, the higher the inverse reflection coefficient, the better the visibility of the road surface. The inverse reflection coefficient is the ratio of the inverse reflection intensity coefficient of the inverse reflection surface to its area. The retroreflective material can be regarded as a secondary light source centered on the illuminated point O after being illuminated and emits reflected light in all directions of space. The principle of retroreflection is shown in Figure 3. Assuming that the vertical illumination per unit area of the retroreflective material is E, and its luminous intensity in a certain direction of space is I, the calculation method of the retroreflective coefficient in this direction is shown in Equation (1).
where, RL denotes the inverse reflection coefficient, mcd/(LX·m2) and A represents the area of the sample, m2. R represents the luminous intensity coefficient, cd/LX; I represents the luminescence intensity, cd; and EL represents the vertical illuminance, LX.
Table 5.
Basic parameters of retroreflective tester.
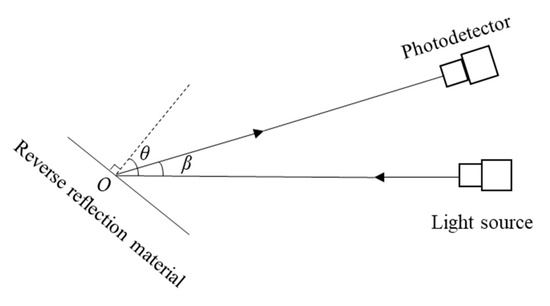
Figure 3.
Inverse reflection principle diagram.
The test included the following steps. First, the retroreflective measuring instrument was optically calibrated with the calibration unit, and then, the instrument was placed in the road-surface area to measure the relevant indicators and automatically calculate the average value. Finally, the instrument was connected to a computer to export the data. The indoor and field tests are shown in Figure 4.
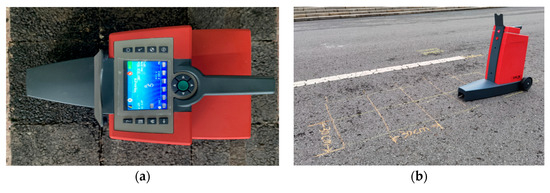
Figure 4.
Retroreflection coefficient test: (a) inhouse testing; (b) field testing.
2.2.3. Test of Asphalt-Pavement Texture Parameters
In this study, we used the PATT-II pavement antislip texture tester to obtain asphalt-pavement texture information. The scanning parameters of the tester’s laser sensor are shown in Table 6. The test includes the following main steps. First, open the pavement texture-scanning system software and set the parameters online. Second, enter the alignment process. When the laser sensor enters the effective range of data acquisition, the measured value begins to increase. When the distance from the alignment point is about 6 mm, the laser sensor will slow down and end the alignment process after arrival. Then, the point-scanning work starts. After the end of the scanning line, the laser sensor’s operating rod automatically moves to the next line of scanning. When all lines are scanned, the operating rod automatically moves back to the initial position. Finally, point-splicing preservation is carried out for the whole piece, and the collected data are imported into the data-processing software for analysis. The measurement of the texture index for the indoor rut board and asphalt pavement is shown in Figure 5.
Table 6.
Scanning parameters of the laser sensor.
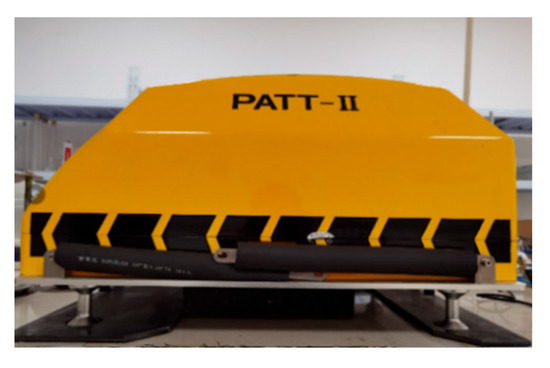
Figure 5.
Pavement texture index test.
Surface textures can be divided into two categories: microtextures and macrotextures. Based on the scanned three-dimensional texture-surface model, the macrotexture surface area S1 and microtexture surface area S2 at different depths are determined layer by layer, and the macrotexture distribution density D1 and microtexture distribution density D2 are further evaluated. At present, the three-dimensional surface area is mainly solved by the integral method and the projection method, and the projection method is more suitable for irregular surface graphics. The basic principle is to project the discrete spatial data points onto the xoy, yoz, and zox planes, respectively, and then, the data points on the three planes are expressed as follows.
xoy plane:
yoz plane:
zox plane:
The area of the polygon enclosed in the three planes is calculated as Equations (2)–(4). The surface area is calculated according to Equation (5).
The texture area in the unit datum plane is used to characterize the distribution density of the pavement’s surface texture, which is defined as the texture distribution density.
where S is the texture distribution density; AT is the macro or micro three-dimensional surface area, mm2; AP is the plane area of the texture cross-sectional area, which can be calculated by measuring the side length a and b of the area, mm2.
The contour arithmetic root mean square slope Δq and the contour arithmetic average slope are the same type of pavement texture structure parameters. The calculation formula can refer to Equation (7), and its mathematical meaning is the absolute value of the coordinate change rate of the asphalt-pavement contour curve along the height direction within the sampling range. The two parameters of skewness Rsk and steepness Rku characterize the comprehensive distribution characteristics of asphalt-pavement texture morphology. The calculation formula of asphalt-pavement profile deflection can be seen in Equation (8), and its mathematical meaning is the average value of the cubic of the asphalt-pavement profile offset. Skewness is used to characterize the degree of asymmetry of the distribution of asphalt-pavement contour amplitude relative to the baseline. The size of the skewness is related to the peak or valley of the asphalt-pavement contour. The definition of asphalt-pavement profile steepness is similar to that of asphalt-pavement profile skewness. The calculation formula can refer to Equation (9), and its mathematical meaning is the average value of the fourth-order central moment of the asphalt-pavement profile surface amplitude.
Where, N is the number of contours in the longitudinal sampling length of the asphalt-pavement contour curve; m is the number of contours in the transverse sampling length of the asphalt-pavement contour curve; Rq is the root mean square deviation of the three-dimensional profile of asphalt pavement; Z (xi, yi) is the elevation information corresponding to each point of the asphalt-pavement contour surface, based on the reference line.
where, N is the number of contours in the longitudinal sampling length of the asphalt-pavement contour curve; M is the number of contours in the transverse sampling length of the asphalt-pavement contour curve; Rq is the root mean square deviation of the three-dimensional profile of asphalt pavement; Z (xi, yi) is the elevation information corresponding to each point of the asphalt-pavement contour surface based on the reference line.
3. Results and Discussion
3.1. Effect of Texture Index on the Light-Reflection Characteristics of Asphalt-Mixture Specimens before and after Rutting and Rolling
To study the optical reflection characteristics, we used three grades of asphalt mixtures, AC-13, SMA-13, and OGFC-13, to conduct indoor rutting tests simulating the wearing effect of wheels on pavement. The macroscopic and microscopic texture indices and retroreflection coefficient before and after various rutted specimens were rolled were then measured to analyze the effect of the texture indices on the optical reflection characteristics in the indoor tests.
3.1.1. Analysis of Pavement Texture Parameters
According to the relevant research results [38,39,40], seven texture parameters of asphalt-mixture specimens before and after rolling in the rutting test were selected for comparative analysis: macrotexture surface area S1, microtexture surface area S2, macrotexture distribution density D1, microtexture distribution density D2, root mean square slope Δq, skewness Rsk, and kurtosis Rku. The specific measurement results are shown in Figure 6.
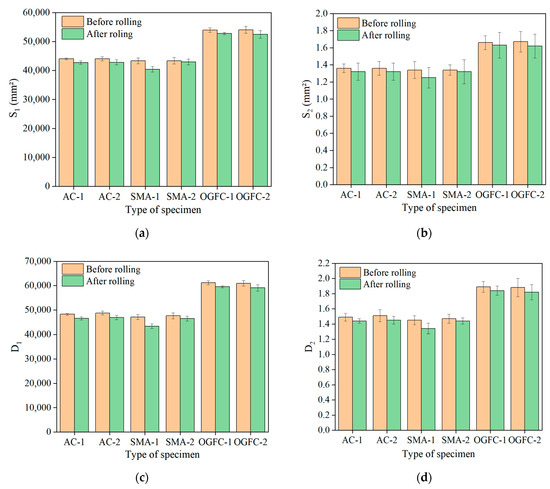
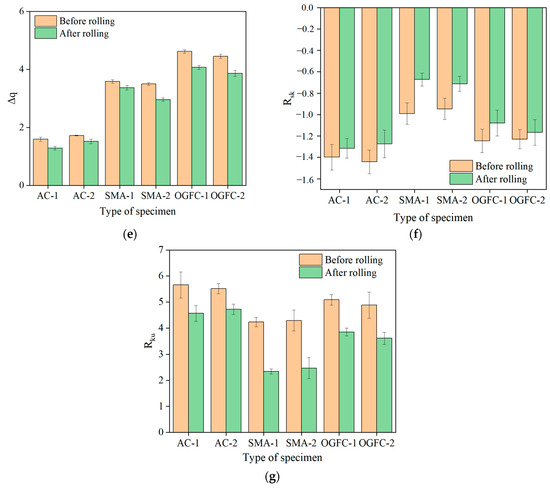
Figure 6.
Comparison of texture parameters of specimens before and after the rutting test: (a) macrotexture surface area, (b) microtexture surface area, (c) macroscopic texture distribution density, (d) microscopic texture distribution density, (e) root mean square slope, (f) skewness, and (g) kurtosis.
Figure 6 shows that the S1, S2, D1, D2, Δq, and Rku of the AC, SMA, and OGFC asphalt-mixture specimens after being rolled in the rutting test decreased and Rsk increased. The asphalt mixtures became flatter at the rutting location after being crushed by the rutting meter, resulting in corresponding changes in the texture parameters. By comparing the texture indices of different gradations of asphalt mixtures, it can be seen that the S1, S2, D1, D2, and Δq before and after the rutting test of AC and SMA asphalt-mixture specimens were smaller than those of the OGFC asphalt mixture. This is mainly related to the gradation design of the asphalt mixture. The OGFC-type asphalt mixture is a typical open-graded mixture with a large proportion of coarse aggregates, a large void ratio, prominent morphology, and a greater difference in surface texture than AC and SMA. The surface texture of type-A asphalt mixtures exhibits greater variability. Before and after the rutting test, the S1, S2, D1, and D2 values of AC and SMA were relatively similar, and the change trend of the texture indices before and after milling was consistent. By analyzing Figure 6f,g, it can be seen that the order was AC < OGFC < SMA in terms of the skewness index Rsk, and SMA < OGFC < AC in terms of the kurtosis index Rku.
3.1.2. Analysis of Retroreflection Coefficient Measurement Results
We used the retroreflection coefficient to characterize the light-reflection properties of the asphalt-mixture specimens. The reverse reflection coefficients of the different gradation types of asphalt mixtures before and after rolling by the rutting test were comparatively analyzed. Specific results are shown in Figure 7.
Figure 7.
Reverse reflection coefficients of different types of rutted specimens before and after rolling.
As shown in Figure 7, the reverse reflection coefficients for the rutted locations of the three types of rutted specimens, AC, SMA, and OGFC, were all larger than the reverse reflection coefficients. This may be because, after the rutting instrument is rolled, the area becomes dense, and the asphalt-mixture morphology changes accordingly. When measured by the instrument, the light reflection of the surface is more similar to the specular reflection compared to the rough surface that has not been rolled, and the intensity of the reflected light increases, as well as the measured retroreflection coefficient.
Meanwhile, it can be found that the reverse reflection coefficients of the AC and SMA rutted specimens before and after rolling are similar. This may be because the surface area of the macro-micro texture and the density of macro-micro texture distribution of these two specimens are similar, and their reverse reflection coefficients before and after rolling are greater than those of OGFC; this, in turn, may be because a larger proportion of coarse aggregates is used in the preparation of OGFC rutted specimens. Specifically, the amount of OGFC-graded coarse aggregate was 83.9%, the amount of AC-graded coarse aggregate was 70.4%, and the amount of SMA-graded coarse aggregate was 79.5%. A larger proportion of coarse aggregate was used in the preparation of OGFC rutting specimens. The surface-texture distribution of the graded specimens was wider, and the pores were larger, making the light reflection on the surface closer to the diffuse reflection and the reflected light intensity and measured reverse reflection coefficient smaller.
3.1.3. Influence of Asphalt-Pavement Texture Parameters on the Retroreflection Coefficient
To analyze the effect of the asphalt-mixture surface-texture index on the optical reflection characteristics, the relationship between the inverse reflection coefficient RL and the macro- and microtexture indices before and after the rutting test was determined by using the quadratic polynomial function. Specific results are shown in Figure 8.
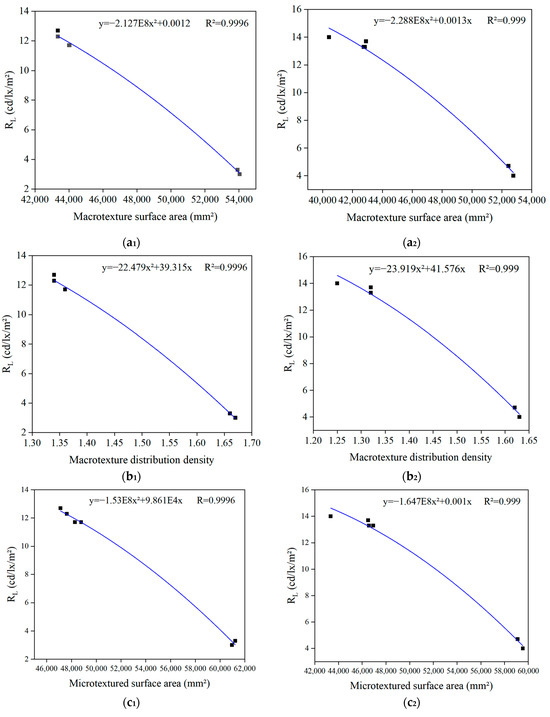
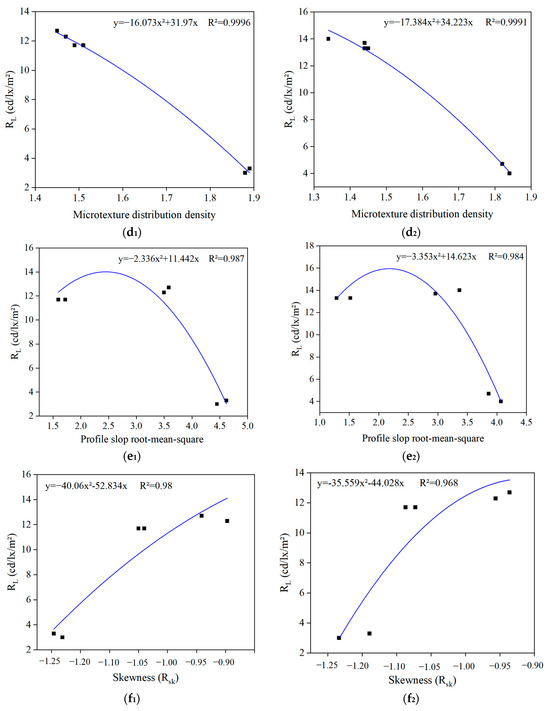
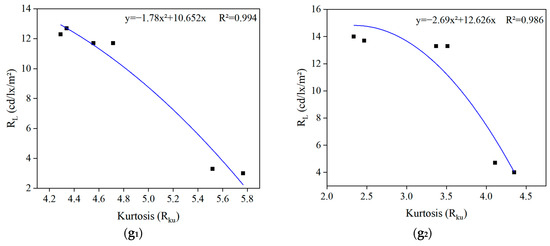
Figure 8.
Correspondence between texture index and RL. (a1–g1) Correlation between S1, D1, S2, D2, Δq, Rsk, Rku, and RL for rutted specimens before rolling. (a2–g2) Correlation between S1, D1, S2, D2, Δq, Rsk, Rku, and RL for rutted specimens after rolling.
As can be seen from Figure 8, the macrotexture surface area S1, microtexture surface area S2, macrotexture distribution density D1, microtexture distribution density D2, root mean square slope Δq, skewness Rsk, and kurtosis Rku of asphalt-mixture specimens before and after rolling in the rutting test were correlated with the retroreflection coefficient RL as a quadratic polynomial function with a better fitting effect, and the R2 was above 0.95.
3.2. Optical Reflection Characterization of Field Asphalt Pavement Based on Texture Parameters
To further study the mechanism of the influence of asphalt-pavement texture parameters on optical reflection characteristics, eight asphalt roads were tested onsite using a retroreflection coefficient measuring instrument and pavement texture tester. The correlations between the texture indicators are shown in Figure 9. Correlation equations between texture indices and optical reflection characteristics were constructed to analyze the relationship between the influence of macroscopic and microscopic texture indices on the reverse reflection coefficient.
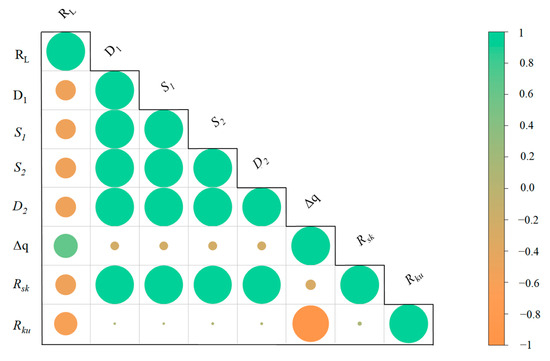
Figure 9.
Correspondence between texture index and RL.
3.2.1. Modeling of the Influence of Single-Texture Index Factors on Light-Reflection Characteristics
Considering the functional relationship between the texture index and the retroreflection coefficient of asphalt-mixture specimens before and after the indoor rutting test, and based on the macroscopic and microscopic texture parameters and retroreflection coefficient obtained from the eight onsite asphalt-pavement tests, a quadratic polynomial relationship model between individual texture parameters; the retroreflection coefficient was constructed to analyze the effect of individual texture index factors on the light reflectance characteristics. Specific results are shown in Figure 10.
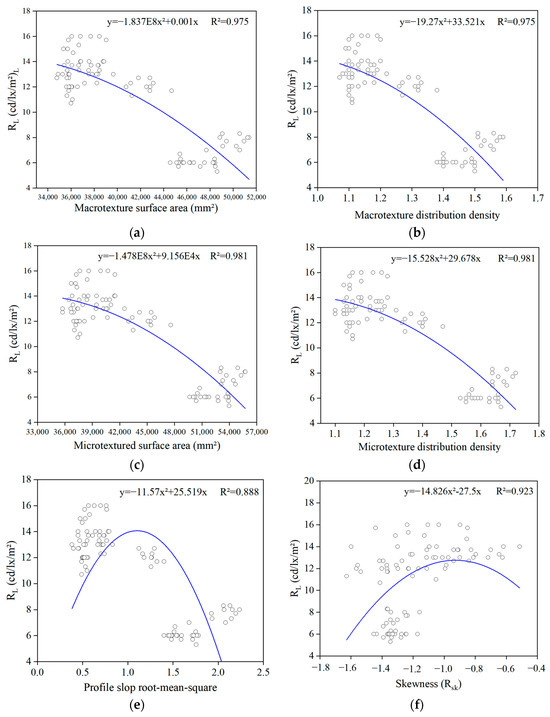
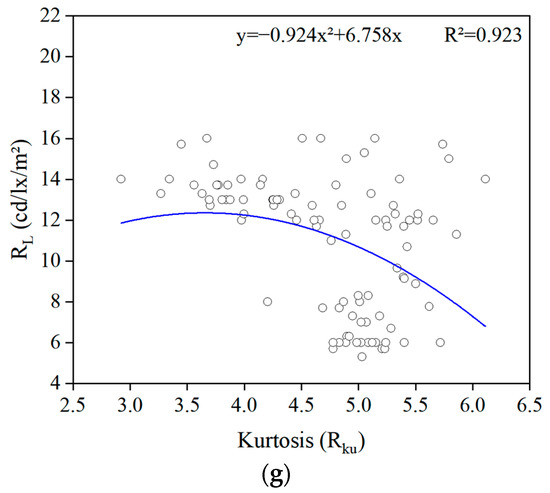
Figure 10.
One-factor modeling of the pavement texture index and reverse reflection coefficient: (a) S1 correlates with RL, (b) D1 correlates with RL, (c) S2 correlates with RL, (d) D2 correlates with RL, (e) Δq correlates with RL, (f) Rsk correlates with RL, and (g) Rku correlates with RL.
Figure 10 shows that the macrotexture surface area S1, microtexture surface area S2, macrotexture distribution density D1, microtexture distribution density D2, root mean square slope Δq, skewness Rsk, and kurtosis Rku for a series of macroscopic and microscopic texture parameters of the actual asphalt pavement and retroreflection coefficient RL are all quadratic polynomial correlations, and the R2 of the constructed single-factor influence model reaches more than 0.90. The results show that the retroreflection coefficient can be effectively predicted based on the texture parameters of asphalt pavement. Specifically, the correlation models of S1, S2, D1, D2, and RL all have R2 above 0.95, indicating the effective prediction of the light-reflection characteristics.
3.2.2. Modeling of the Influence of Multitexture Index Factors on the Light-Reflection Characteristics
To further investigate the influence of the asphalt-pavement texture indices on the reverse reflection coefficient, we deeply analyzed and mined all of the macro- and microtexture parameters and reverse reflection coefficients collected from asphalt pavement in the field and the retroreflection coefficient RL with the help of Weka 3.8.5 version software and constructed linear and nonlinear models between the two. When the absolute value of the correlation coefficient is greater than or equal to 0.8, it can be considered that the linear correlation between the two variables is high.
Linear Models
After the texture metrics were cross-validated several times using Weka software, it was determined that the model had the highest correlation and the smallest error when three metrics were used for multifactor linear modeling: root mean square slope Δq, skewness Rsk, and kurtosis Rku. The quantitative expression of the multifactor linear model is shown as Equation (10), which has a correlation coefficient of 0.8393, a mean error value of 1.543, and a root mean square slope of 1.8132. The linear correlation between variables can be considered high when the absolute value of the correlation coefficient is greater than or equal to 0.8. The results show that the prediction accuracy of the model is high, and the correlation between the texture index and RL is good.
Nonlinear Models
In this section, the multilayer perceptron model based on the BP algorithm is used to construct a nonlinear model of the effect of the asphalt-pavement macro- and microtexture parameters on the reverse reflection coefficient. The relationships between the input and hidden layers in the model established in this experiment are shown in Figure 11. The model was obtained by regression using the multilayer perceptron module of Weka software using S1, S2, D1, D2, Δq, Rsk, and Rku as the input layers. There was one hidden layer, and it contained four nodes. The neurons in the hidden layer used the sigmoid activation function, and its mapping relationship is given by Equation (11). The output layer was RL.
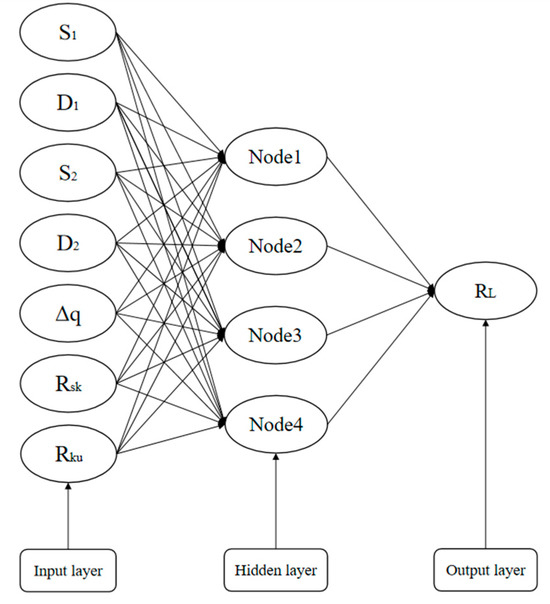
Figure 11.
Multilayer perceptron model.
The weight relationships between the input and hidden layers and between the hidden and output layers are shown in Table 7 and Table 8, respectively. The output results of the multifactor nonlinear model show that the correlation coefficient between the texture parameters and RL is 0.9191, the average error value is 1.0404, and the root mean square error is 1.3342, which indicates that the parameters S1, D1, S2, D2, Δq, Rsk, and Rku are better correlated with RL and that the nonlinear model has higher prediction accuracy than the linear model.
Table 7.
Weight relationship between the input and hidden layers.
Table 8.
Weight relationship between hidden and output layers.
4. Conclusions
In this study, the macroscopic texture index and the retroreflection coefficient of indoor rutted specimens and field asphalt pavement were measured, and the correlation between them was determined. Then, single and multifactor models of the influence of the macroscopic texture index on the optical reflection characteristics of asphalt pavement were constructed. The main conclusions are as follows:
- The abrasion effect of the rutting test had a great influence on the texture index and optical reflection characteristics of asphalt mixtures. After rolling, the S1, S2, D1, D2, Δq, and Rku of asphalt-mixture specimens with different gradations decreased, while Rsk and RL increased. Rku decreased the most, 43.65% for SMA, 16.8% for AC, and 25.15% for OGFC. This phenomenon was mainly related to the morphology change of the asphalt mixture;
- The influence of gradation design on the texture index and the optical reflection characteristics of the asphalt mixture were analyzed. The S1, S2, D1, D2, and Δq of AC and SMA-graded asphalt mixtures were smaller than those of OGFC, and the RL of AC and SMA was much larger than that of OGFC. The main reason was the difference between coarse aggregate contact behavior and the volume index;
- The model of the influence of a single texture index on the reverse reflection coefficient RL before and after the rutting test could be quantitatively characterized by the quadratic function, and the fitting coefficients were all above 0.95. The model laid the foundation for the study of field pavement;
- In terms of the influence of the multitexture index of asphalt pavement on the inverse reflection coefficient RL, the nonlinear model was more accurate than the linear model. The correlation coefficient was 0.92 for the nonlinear model and 0.84 for the linear model. It provided a theoretical basis for the safety design of asphalt pavement.
In summary, there is a good correlation between the macro- and microtexture parameters of asphalt pavement and the retroreflection coefficient, which can effectively reveal the reflection properties of the pavement material. Since the retroreflection coefficient is not widely used in lighting-design software, further research work will further focus on the relationship between macro- and microtexture parameters and the reduced-brightness coefficient table (r-table). Subsequently, based on obtaining the macro- and microtexture parameters of road surfaces, road-lighting designers can accurately calculate the reflection characteristics at different road positions and optimize the illumination design parameters, such as luminaire installation height, interval, and light-distribution curve.
Author Contributions
Conceptualization, P.X.; methodology, G.Q.; validation, C.Z. (Chao Zhang); formal analysis, X.W.; investigation, C.Z. (Chao Zhang); resources, P.X.; data curation, X.W.; writing—original draft preparation, P.X.; writing—review and editing, H.Z.; visualization, C.Z. (Chen Zhao); supervision, G.Q.; project administration, H.Y.; funding acquisition, P.X. All authors have read and agreed to the published version of the manuscript.
Funding
This research was funded by the National Key Research and Development Program of China, grant number 2022YFB2601900; the National Natural Science Foundation of China, grant number 52227815; and the Open Fund of Hunan Key Laboratory of Smart Roadway and Cooperative Vehicle–Infrastructure Systems (Changsha University of Science and Technology), grant number kfj210701.
Institutional Review Board Statement
Not applicable.
Informed Consent Statement
Not applicable.
Data Availability Statement
Data are contained within the article.
Conflicts of Interest
The authors declare no conflict of interest.
References
- Box, P.C.; Alroth, W. Relationship between Illumination and Freeway Accidents; TRB: Washington, DC, USA, 1971. [Google Scholar]
- Elvik, R. Meta-analysis of evaluations of public lighting as accident countermeasure. Transp. Res. Rec. 1995, 1485, 12–24. [Google Scholar]
- Elvik, R.; Høye, A.; Vaa, T.; Sørensen, M. The Handbook of Road Safety Measures; Emerald Group Publishing Limited: Bingley, UK, 2009. [Google Scholar]
- Gidlund, H.; Lindgren, M.; Muzet, V.; Rossi, G.; Iacomussi, P. Road surface photometric characterisation and its impact on energy savings. Coatings 2019, 9, 286. [Google Scholar] [CrossRef]
- CIE 144:2001; Road Surface and Road Marking Reflection Characteristics. International Commission on Illumination (CIE): Vienna, Austria, 2001.
- Greffier, F.; Muzet, V.; Boucher, V.; Fournela, F.; Lebouc, L.; Liandrat, S. Influence of pavement heterogeneity and observation angle on lighting design: Study with new metrics. Sustainability 2021, 13, 11789. [Google Scholar] [CrossRef]
- Ogando-Martínez, A.; Troncoso-Pastoriza, F.; Granada-Álvarez, E.; Eguía-Oller, P. Ellipsoid-based approximation method for the estimation of the actual reduced luminance coefficients of road surfaces for accurate lighting simulations. Sustain. Cities Soc. 2020, 63, 102502. [Google Scholar] [CrossRef]
- Muzet, V.; Greffier, F.; Verny, P. Optimization of road surface reflections properties and lighting: Learning of a three-year experiment. In Proceedings of the 29th Quadrennial Session of the CIE, Washington, DC, USA, 14–22 June 2019; pp. 525–535. [Google Scholar]
- Galatanu, C.D.; Canale, L. Measuring Reduced Luminance Coefficients for Asphalt Based on Imaging Method. In Proceedings of the 2022 IEEE International Conference on Environment and Electrical Engineering and 2022 IEEE Industrial and Commercial Power Systems Europe (EEEIC/I&CPS Europe), Prague, Czech Republic, 28 June–1 July 2022; pp. 1–5. [Google Scholar]
- Li, W.; Hu, Y.; Ji, Y.; Liu, M.; Shen, H. A Database Retrieval Method for the Prediction of Reduced Luminance Coefficient Tables of A Road Surface Based on Measurements in Situ. LEUKOS 2020, 18, 21–29. [Google Scholar] [CrossRef]
- Florian, G.; Valérie, M.; Gautier, M.; Paul, V.; Patrick, T. In Design of an adaptive lighting system able to consider the evolution of pavement reflection properties according to their moisture state. In Proceedings of the 2021 Joint Conference-11th International Conference on Energy Efficiency in Domestic Appliances and Lighting & 17th International Symposium on the Science and Technology of Lighting (EEDAL/LS: 17), Toulouse, France, 1–3 June 2021; IEEE: Piscataway, NJ, USA, 2022; pp. 1–6. [Google Scholar]
- Muzet, V.; Bernasconi, J.; Iacomussi, P.; Liandrat, S.; Greffier, F.; Blattner, P.; Reber, J.; Lindgren, M. Review of road surface photometry methods and devices–Proposal for new measurement geometries. Light. Res. Technol. 2021, 53, 213–229. [Google Scholar] [CrossRef]
- Chen, X.; Zheng, X.; Wu, C. Portable instrument to measure the average luminance coefficient of a road surface. Meas. Sci. Technol. 2014, 25, 035203. [Google Scholar] [CrossRef]
- Saint-Jacques, E.; Dumont, E.; Villa, C. Characterisation of the reflection properties of road surfaces using an in-lab gonioreflectometer. In Proceedings of the CIE 2017 Midterm Meetings and Conference on Smarter Lighting for Better Life, International Commission on Illumination, CIE, Jeju Island, Republic of Korea, 23–25 October 2017; pp. 23–25. [Google Scholar]
- Hall, J.W.; Smith, K.L.; Titus-Glover, L.; Evans, L.D.; Wambold, J.C.; Yager, T.J. Guide for Pavement Friction Contractor’s Final Report for National Cooperative Highway Research Program (NCHRP) Project 01-43; Transportation Research Board of the National Academies: Washington, DC, USA, 2009. [Google Scholar]
- Association, P.W.R. Road Safety Manual: Route Market; TRB: Washington, DC, USA, 2003. [Google Scholar]
- Honghui, L.; Sen, H.; Bo, L. Foreign asphalt pavement coarse structure test method and application. J. China Foreign Highw. 2009, 29, 66–68. [Google Scholar]
- Lunkevičiūtė, D.; Vorobjovas, V.; Vitta, P.; Čygas, D. Research of the Luminance of Asphalt Pavements in Trafficked Areas. Sustainability 2023, 15, 2826. [Google Scholar] [CrossRef]
- Kogbara, R.B.; Masad, E.A.; Kassem, E.; Scarpas, A.; Anupam, K. A state-of-the-art review of parameters influencing measurement and modeling of skid resistance of asphalt pavements. Constr. Build. Mater. 2016, 114, 602–617. [Google Scholar] [CrossRef]
- Chao, Z.; Huanan, Y.; Xuan, Z.; Ding, Y.; Xinghai, P.; Xianpeng, F. Unified characterization of rubber asphalt mixture strength under different stress loading paths. J. Mater. Civil Eng. 2023, 36, 040234983. [Google Scholar]
- Huanan, Y.; Chao, Z.; Guooing, Q.; Jinguo, G.; Xuan, Z.; Ding, Y.; Changyun, S. Characterization and evaluation of coarse aggregate wearing morphology on mechanical properties of asphalt mixture. Constr. Build. Mater. 2023, 388, 131299. [Google Scholar]
- Siqi, W. Research on Digitization Technology of Asphalt Pavement Surface Texture. Master’s Thesis, Southeast University, Dhaka, Bangladesh, 2016. [Google Scholar]
- Masad, E.; Rezaei, A.; Chowdhury, A. Field Evaluation of Asphalt Mixture Skid Resistance and Its Relationship to Aggregate Characteristics; Texas Transportation Institute: Austin, TX, USA, 2011. [Google Scholar]
- Dunford, A. Friction and the Texture of Aggregate Particles Used in the Road Surface Course. Ph.D. Thesis, University of Nottingham, Nottingham, UK, 2013. [Google Scholar]
- Flintsch, G.W.; McGhee, K.K.; Najafi, S.; León, I.E.D. The Little Book of Tire Pavement Friction; Surface Properties Consortium; Virginia Tech: Blacksburg, VA, USA, 2012. [Google Scholar]
- Mcquaid, G.; Woodward, D.; Millar, P.; Friel, S. Use of Close Range Photogrammetry to assess the microtexture of asphalt surfacing aggregates. In Proceedings of the International Journal of Pavements Conference-Maintenance and Rehabilitation of Pavements and Technological Control, São Paulo, Brazil, 9–10 December 2013. [Google Scholar]
- Zhiyong, H.; Bo, C.; Weixiong, L.; Xiaoning, Z.; Fuda, C. Line Laser Measurement Methods and Depth of Construction of Asphalt Pavements. Sci. Technol. Eng. 2019, 19, 252–258. [Google Scholar]
- Enhui, Y.; Qiang, C.; Jie, L.; Haibo, D.; Bing, H.; Yanjun, Q. Surface Texture Reconstruction and Construction Depth Prediction Model for As-phalt Pavements. China J. Highw. Transpor 2023, 36, 14. [Google Scholar]
- Shihai, D.; Enhui, Y.; Chenping, W.; Yaying, J.; Kaiyun, L.; Xinrui, Z. Three-dimensional high-precision laser non-contact inspection of asphalt pavement surface texture. J. Southwest Jiaotong Univ. 2020, 55, 758–764. [Google Scholar]
- Zihang, W. Asphalt pavement gradation prediction method based on three-dimensional texture characteristics. J. Tongji Univ. (Nat. Sci.) 2022, 50, 879–890. [Google Scholar]
- Fernandez, P.; Peña-García, A.; Poyatos-Martínez, D.; Escot-Bocanegra, D.; Fernández-Oliveras, A. In Reflectance of interurban-road pavements from radar-based measurements. In Proceedings of the 8th Iberoamerican Optics Meeting and 11th Latin American Meeting on Optics, Lasers, and Applications, Porto, Portugal, 22–26 July 2013; SPIE: Bellingham, WA, USA, 2013; pp. 458–465. [Google Scholar]
- Moretti, L.; Cantisani, G.; Di Mascio, P.; Caro, S. Technical and economic evaluation of lighting and pavement in Italian road tunnels. Tunn. Undergr. Space Technol. 2017, 65, 42–52. [Google Scholar] [CrossRef]
- Cantisani, G.; Di Mascio, P.; Moretti, L. Comparative Life Cycle Assessment of Lighting Systems and Road Pavements in an Italian Twin-Tube Road Tunnel. Sustainability 2018, 10, 4165. [Google Scholar] [CrossRef]
- E20; Standard Test Methods of Bitumen and Bituminous Mixtures for Highway Engineering. Ministry of Transport of the People’s Republic of China: Beijing, China, 2011.
- F40; Standard Test Methods of Bitumen and Bituminous Mixtures for Highway Engineering. Ministry of Transport of the People’s Republic of China: Beijing, China, 2004.
- E42; Test Methods of Aggregate for Highway Engineering. Ministry of Transport of the People’s Republic of China: Beijing, China, 2005.
- JTG/T533-2004; Plant Fibers Used in Asphalt Pavements. TransForyou Co., Ltd.: Beijing, China, 2004.
- Jin, D.; Boateng, K.A.; Ge, D.; Che, T.; Yin, L.; Harrall, W.; You, Z. A case study of the comparison between rubberized and polymer modified asphalt on heavy traffic pavement in wet and freeze environment. Case Stud. Constr. Mater. 2023, 18, e01847. [Google Scholar] [CrossRef]
- Jin, D.; Boateng, K.A.; Chen, S.; Xin, K.; You, Z. Comparison of Rubber Asphalt with Polymer Asphalt under Long-Term Aging Conditions in Michigan. Sustainability 2022, 14, 10987. [Google Scholar] [CrossRef]
- Jin, D.; Wang, J.; You, L.; Ge, D.; Liu, C.; Liu, H.; You, Z. Waste cathode-ray-tube glass powder modified asphalt materials: Preparation and characterization. J. Clean. Prod. 2021, 314, 127949. [Google Scholar] [CrossRef]
Disclaimer/Publisher’s Note: The statements, opinions and data contained in all publications are solely those of the individual author(s) and contributor(s) and not of MDPI and/or the editor(s). MDPI and/or the editor(s) disclaim responsibility for any injury to people or property resulting from any ideas, methods, instructions or products referred to in the content. |
© 2023 by the authors. Licensee MDPI, Basel, Switzerland. This article is an open access article distributed under the terms and conditions of the Creative Commons Attribution (CC BY) license (https://creativecommons.org/licenses/by/4.0/).