1. Introduction and Background
Driving is a common activity for many people, it provides social interactions with other people on the road, facilitates human independence, and offers a significant chance for exploring the world [
1]. The Department of Motor Vehicles reported that there are currently around 228.2 million driving licenses in the United States and the Road, and Highway construction in the United States (U.S.) has been increasing by 0.7% from 2021 [
2]. Moreover, there are over 284 million vehicles operating on roads throughout the United States. Therefore, making driving as safe as possible is an important issue in every day life.
Despite the safety improvements in road construction and vehicle manufacturing, the total number of vehicle crashes is still increasing. The National Highway Traffic Safety Administration (NHTSA) reported that 90% of road accidents in the U.S. are due to human errors and 20% of traffic accidents are caused by distracted drivers. In 2020, 3142 people were killed by distracted driving in the U.S [
3]. Using a mobile phone while driving has become one of the biggest factors responsible for accidental injuries and deaths in the U.S.
Distracted driving is any activity that diverts attention from driving including eating, drinking, talking to passengers, texting, adjusting the radio, or using navigation [
3]. Distracted driving can cause serious safety concerns for drivers as well as passengers. Among several activities taking the driver’s attention off the road, it is observed that a high-level distraction is caused by using mobile phones. The National Safety Council reported that texting while driving leads to 1.6 million crashes and nearly 390,000 injuries [
1]. If driver distraction is detected in real-time, and if an early warning is given, this can avoid traffic accidents. The focus of this study is to automatically detect driver’s distraction caused by using mobile phones. According to a report by the National Safety Council in U.S., using mobile phones while driving is considered a high-level distraction that leads to millions of crashes and thousands of injuries. A driver’s behaviors of “adjusting radio” or “talking with passengers” are considered as distraction behaviors in two benchmark datasets involved in this research. Currently, Driver Assistance Technologies (DAT) hold the potential to reduce traffic crashes and save thousands of lives each year [
3]. DAT are groups of electronic technologies that assist drivers in driving and parking functions such as avoiding collisions, pedestrian detection, and lane change warning. DAT use various sensors, computer vision, and machine learning algorithms to monitor the vehicle’s surroundings and make driving tasks easier and safer.
There have been many efforts to detect distracted drivers due to use of mobile phones while driving. Research shows that drivers on phone calls were not able to perceive risks. In fact, people who drive on phone calls increase the risk of a crash by about 4 and 6 times [
2]. Detecting drivers using mobile phones can be done in several ways, such as: using surveillance cameras, smart technologies, and mobile applications. Using image and video processing algorithms to detect the usage of mobile phones is considered the most reliable and widespread method due to several factors, such as: the accuracy of their results, concrete evidence when required, and it is easy to keep the data generated for long periods of time.
Traffic management systems, local governments, and traffic enforcement systems currently use cameras that are already installed and distributed all around the roadways for security, monitoring, and object detection purposes. Object detection deals with detecting instances of semantic objects of a certain class in digital images and videos. Object detection is an active and well-researched domain that includes face detection, pedestrian detection, distracted driver detection, vehicle detection, and more. Artificial Intelligence (AI) and Machine Learning (ML) applications are increasing daily. Deep Neural Networks (DNN) are an important topic in the field of artificial intelligence. Image and video processing uses AI and ML in several applications, such as in object detection. Using AI, ML, and DNN algorithms and techniques for object detection increases the accuracy of the detection and expands its applications. Deep learning can play a significant role by detecting the distracted driver activity and notifying the driver to stop while these activities occur to prevent accidents.
While U-Net may not be a suitable choice for object tracking on its own, it is worth mentioning that features extracted by U-Net architecture can be valuable for object detection tasks [
4]. Object tracking requires algorithms and architectures that are specifically designed to handle the temporal continuity and identity maintenance of objects across video frames. The U2-net architecture does not handle the temporal information and object identity across video frames. However, considering the temporal continuity of objects between frames will be considered when dealing with videos, and represents a future work that is outside the scope of this research. In this research, we develop a model called U2-net that automatically detects distracted drivers, especially those who are using mobile phones. The U2-net is a modified version of the original U-net architecture. U-Net is a convolutional neural network (CNN) architecture that consists of an encoding path and a corresponding decoding path, with skip connections that bridge the encoding and decoding paths at multiple resolutions. The encoding path is a series of convolutional and pooling layers that gradually reduce the spatial resolution of the input image, while the decoding path consists of transposed convolutional layers that progressively up-sample the feature maps to the original resolution. The skip connections combine the low-level feature maps from the encoding path with the high-level feature maps from the decoding path to capture both local and global information in the image. U-Net is a 2D CNN architecture that is widely used for image segmentation [
4,
5].
We modify the original U-net architecture by adding four convolution layers, two max pooling layers, and dropout layers to the contracting path. additionally, in the expanding path, we add four transpose convolution layers, two max pooling layers, and dropout layers. These new layers add more spatial information and context to the classifier and avoid model overfitting. Moreover, we use full-color images to provide more information to the classifier and educe the size of each input image to reduce the training time and minimize the model complexity. The dense layer is used to predict the output result that is formed by a weighted average function of its input. The U2-net model provides deep layers to represent image features and yields more precise classification results. The motivation behind this model is that it captures the context around the objects in order to provide a better object representation and classification.
The U2-net uses input images collected from cameras that capture frontal views from inside the vehicle. Many existing methods have some limitations, such as being locally integrated inside the vehicle, and therefore cannot prohibit distracted drivers. Additionally, their accuracy drops if the driver changes his behavior, Moreover, they do not provide concrete evidence. The U2-net model addresses some of these limitations by providing a dynamic and adaptive system that provides efficient results regardless of the driver behavior. It achieves 2.75% higher accuracy results than the D-HCNN [
6] on the MI-AUC dataset and 1.52% higher accuracy results than the MobileNetV2 [
7] on the State Farm dataset. The U2-net model can also help increase the drivers’ awareness of their driving habits and associated risks, promote safe driving practices, and help vehicle manufacturers improve the safety levels in vehicles and minimize the driver distraction. In addition, it can be integrated with smart surveillance cameras that are available on roadways and controlled by the Central Traffic Department. Additionally, the U2-net model is responsible for saving the captured images/video for the distracted driver, especially those who use their phone while driving, and send captured images to the main database for manual confirmation to take the correct action.
The main contribution of our work can be summarized as follows:
We develop a new model called U2-net that automatically detects distracted drivers, especially those who are using mobile phones;
We modify the original U-net model by adding more layers to both contracting and expanding paths, which can capture more intricate features and patterns in the data. Additionally, we add a flattened layer along a dense layer, which helps in the detection and classification process;
We update the regularization technique, optimization technique, and the loss function to improve the performance and avoid model overfitting;
We apply the U2-net into the image classification domain and evaluate it using two datasets: MI-AUC and State Farm datasets;
The evaluation results show that the U2-net model achieves higher accuracy, recall, precision, IoU, and F-score than what is achieved by many other state-of-the-art models.
2. Related Work
There are active efforts in developing methods for detecting distracted drivers. Because of the impact of distraction while driving on public safety and property, several governments and countries have enacted regulations that prohibit any cause of distraction while driving, especially mobile phone usage. These regulations have created a need for a smart system to detect mobile phone usage while driving for law enforcement. Currently, the driver’s use of mobile phones is mainly supervised by law enforcement officials through direct observation. It is time-consuming, inefficient, and almost impossible to cover all roadways. So, the challenge is to develop a smart system that automatically detects the usage of mobile phones while driving. There are different ways to solve such problems. First, we review detection methods that are different from visual-based methods. Then, we review visual-based methods that use AI and machine learning algorithms.
Detection using Sensors and Equipment: There are different ways to solve such problems. For example, one system uses sensors and equipment inside the vehicle, such as Hands on the Steering Wheel [
8], which block any notification on a smartphone for some period while the driver is conducting the vehicle. However, this system cannot avoid misuse. Another approach of Yang et al. [
9] used software running on the phone for capturing and processing high frequency sound signals sent by the car sound equipment. The sound signals are used to measure the position of the mobile phone and when the driver is talking on it [
10]. However, it depends on the mobile phone brand and the software must be continually enabled by the driver. A general and efficient way is to develop an image-based system that considers all different types of vehicles, gestures, positions, and mobile sizes. In addition, it should handle different weather conditions. All these situations make detection hard. The positions of cameras also affect the detection accuracy, which is either inside or outside the vehicle. Vehicle manufactures equip vehicles with inside cameras to enhance the safety level while driving, while the outside cameras are generally installed to detect illegal behaviors.
Detection using Deep Learning: Hesham Eraaqi et al. [
11] proposed a reliable deep leaning-based solution that achieves 90% accuracy. Additionally, the authors presented a genetically weighted ensemble of convolutional neural network for image classification that achieves 84.64% classification accuracy. Celaya-Padilla et al. [
12] proposed a novel approach to detect distracted drivers using mobile phones while driving. The authors used a ceiling-mounted wide angle camera coupled to a deep learning-convolutional neural network (CNN) to detect distracted drivers. The authors used Inception V3 deep neural network, which was trained to detect “texting and driving” subjects. The final CNN was trained and validated on a dataset of 85,401 images, achieving an area under the curve (AUC) of 0.891 in the training set, an AUC of 0.86 on a blind test, and a sensitivity value of 0.97 on the blind test.
Uzzol Hossain et al. [
7] developed a CNN-based method to detect distracted drivers and identify the cause of distractions such as talking, sleeping, or eating by means of face and hand localization. Four architectures, namely CNN, VGG-16, ResNet50, and MobileNetV2 have been adopted for transfer learning. The proposed model was trained with thousands of images from the state farm dataset containing 10 different postures or conditions of a distracted driver and analyzed the results using various performance metrics. The performance results showed that the pre-trained ResNet50 and Mo-bileNetV2 provide the best classification accuracy of 94.5% and 98.12%, respectively.
Detection using Combination Methods: Mohammed S. Majdi et.al. [
13] presented an automated supervised learning method called Drive-Net for driver distraction detection. The authors used a combination of a convolutional network (CN) and a random decision forest for classifying images of a driver. The authors compared the performance of the Drive-Net with two other popular machine-learning approaches: Recurrent Neural Network (RNN), and a multi-layer perceptron (MLP). Using about 22,425 acquired images under a controlled environment that are publicly available and manually annotated by an expert, Drive-Net achieves a detection accuracy of 95%.
Binbin Qin et al. [
6] proposed a new D-HCNN model based on a decreasing filter size with a smaller number of parameters than that used by models in many other studies. D-HCNN uses HOG feature images, L2 weight regularization, dropout and batch normalization to improve the performance. The authors conducted experimental evaluations on two public datasets: MI-AUC [
7] and State Farm [
14] with an accuracy of 95.59% and 99.87%, respectively, which represent higher accuracy values than those achieved by many other state-of-the-art methods.
There are several other attempts to develop efficient deep learning frameworks to detect distracted drivers such as EfficientDet [
15] and other models, described in Ref. [
16]. These attempts have analyzed the static characteristics of images. Other attempts, described in Ref. [
17] discover the temporal–spatial characteristics of images. Some of these attempts were done by fusing the attention features extracted from the dynamic optical flow information and the spatial feature of the single video frame to recognize the distracted driving posture [
17]. Others have combined the handcrafted features and fusion features in a hybrid scheme [
18].
Wang et al. [
19] developed an algorithm that uses input data generated from a camera inside the car. Such a system is not useful in all vehicles because drivers may easily block it while using a mobile phone and one cannot prohibit the driver from doing it.
Another study was done by Artan et al. [
20] that intended to get pictures from a front windshield view of the vehicle. First, the driver’s face was detected, then Region of Interest (ROI) was identified, and finally mobile phone usage gestures were detected. The detection approach was done by training the system with positive and negative pictures. Positive pictures are with mobile phone usage and negative pictures are without. They proposed two classification architectures, used full and half face images, and the performance in terms of accuracy, specificity, and sensitivity was compared. The evaluation results showed that the performances of two architectures are similar, above 86% for the mobile phone usage detection task.
A neural network-based application was developed to detect mobile phone usage [
21]. Sample positive (with phone) and negative pictures (without phone) were used for training and testing the cascade object detector on MATLAB. Initial evaluation results showed that the quality of the captured image and the number of images used for training play a major role in the detection accuracy, which was 75%.
Berri et al. [
22] used Support Vector Machine (SVM) with Polynomial kernel classification to develop an algorithm for extracting characteristics allowing mobile phone identification while driving a vehicle. They used sets of images with 100 positive and other 100 negative images containing frontal images of the driver. The evaluation results showed a success rate of 91.57% for the vision system.
For a 3D vision system, Berri and Osorio [
23] proposed a solution that uses Short-Term (ST) and Long-Term (LT) pattern recognition subsystems to analyze the positions of the driver’s hands. The system has three levels of alarms: no alarm, lowest alarm, and highest alarm. ST detects between no alarm or some level alarm. LT is responsible for determining the risk level, either low or high. The classifiers are based on ML and Artificial Neural Networks (ANN). Furthermore, the values set to adjust input features, neuron activation functions, and network topology/training parameters were optimized and selected using a Genetic Algorithm. The experiments achieved 95% accuracy as the best system performance results.
Aljohani [
24] proposed a model called “DenseNet-GA” that combines artificial deep learning and machine learning models with genetic algorithm for actions detection of drivers from input images. Two dense layers, K nearest neighbor, random forest, support vector machine, and extreme boost algorithms have been used as classifiers. The DenseNet-GA model was developed with the use of a state farm dataset that contains information of one safe driving class and nine dangerous behaviors. Experimental results show that the classification accuracy of the DenseNet-GA is 99.80% when using the state farm dataset. However, it is highly recommend that the proposed model is evaluated using another dataset.
Detection using U-net Model: One of the most efficient CNN approaches is U-Net, which is mainly used for medical image segmentation. U-Net contains a shrinking path for deriving information and a corresponding expansion path for restoration and has high accuracy for image segmentation [
25]. Many researchers have investigated U-Net because of its popularity and efficiency in image segmentation in several domains such as cytology [
5], geology [
26], and microorganisms [
27]. Although the original U-Net has a strong versatility in achieving good results in image segmentation, many variant network structures have been proposed to improve the segmentation effect [
28]. To the best of our knowledge, no research has previously investigated the U-Net to address the problem of detecting and classifying the driver’s state of distraction while driving, which might be used to alert the driver. This paper introduces an improved version of U-Net model that uses deep feature maps, dense layers, more convolution, max pooling, and dropout layers to add more spatial information and context to the classifier, which enhances the accuracy of the classification results.
There is a similar attempt that extends the U-Net architecture for volumetric medical image segmentation tasks called V-Net, which is a 3D CNN architecture that uses a similar encoding-decoding structure to U-Net but incorporates 3D convolutional layers instead of 2D convolutional layers. V-Net also uses residual connections to improve the gradient flow and speed up the convergence during training [
29].
Table 1 summarizes the related work in terms of the proposed method, architecture, dataset, and resulted accuracy.
3. The U2-Net Architecture
In this paper, we adjust and prolong the U-net architecture [
5] in a way that yields more precise image classification results. The U-net architecture was initially used to enhance image segmentation. It offers a training technique that greatly hinges on data augmentation and uses the prevailing annotated models well. The characteristics of the U-Net architecture, such as skip connections, fully convolutional design, and efficient training, have made it adaptable to a wide range of computer vision tasks beyond medical imaging. It has been successfully used in applications such as satellite image segmentation, road segmentation in autonomous driving, and more. Generally, the Fully Convolutional Networks (FCNs) enable end-to-end learning for pixel-wise predictions and capture local and global context information through convolutional layers. The U-Net architecture builds on the concept of (FCNs), which has shown promise in image segmentation tasks. The U-shape architecture allows high-level features and fine-grained details. The skip connections help preserve spatial information and enable the model to recover details lost during the down-sampling process and enhance accuracy. U-Net was designed with computational efficiency in mind, making it feasible for real-time or near-real-time applications. This efficiency is crucial in detecting distracted drivers, where quick results can have a significant impact on people who are using the road. In summary, the U-net architecture along with its innovative design and adaptability have made it a widely adopted and influential model in the field of image classification.
There are different neural network structures that have been used to detect distracted drivers such as VGGNet [
30], ResNet [
32], and EfficientNet [
33]. However, these structures do not preserve image spatial information nor concatenate image features, which are critical in our task. The strengths of U-Net lie in its suitability for recovering fine-grained details and spatial information [
34]. The novelty of the U2-net model are its structure, ability to adapt to different domains, and its ability to customize the loss function. Adding the color information to the model along with creating new different convolutional layers and aggregating them with dense and flattened layers allows the U2-net model to capture distinct visual cues of distracted driving and enhance the classification results. U2-net increases the depth of the whole U-net architecture without significantly increasing the computational cost because of the pooling operations.
The original U-net architecture is made up of two paths: expanding and contracting path. The encoder (contracting path) captures the image’s context, whereas the uniform, increasing path (the decoder) allows for exact location [
5]. The contracting route consists of max pooling and convolution layers, whereas the expanding path consists of transpose convolution operation and fully connected layers. The contracting path catches the information around the objects to offer a more accurate representation of the object, which is the reason behind this design. The U-Net design serves as the foundation for our U2-net.
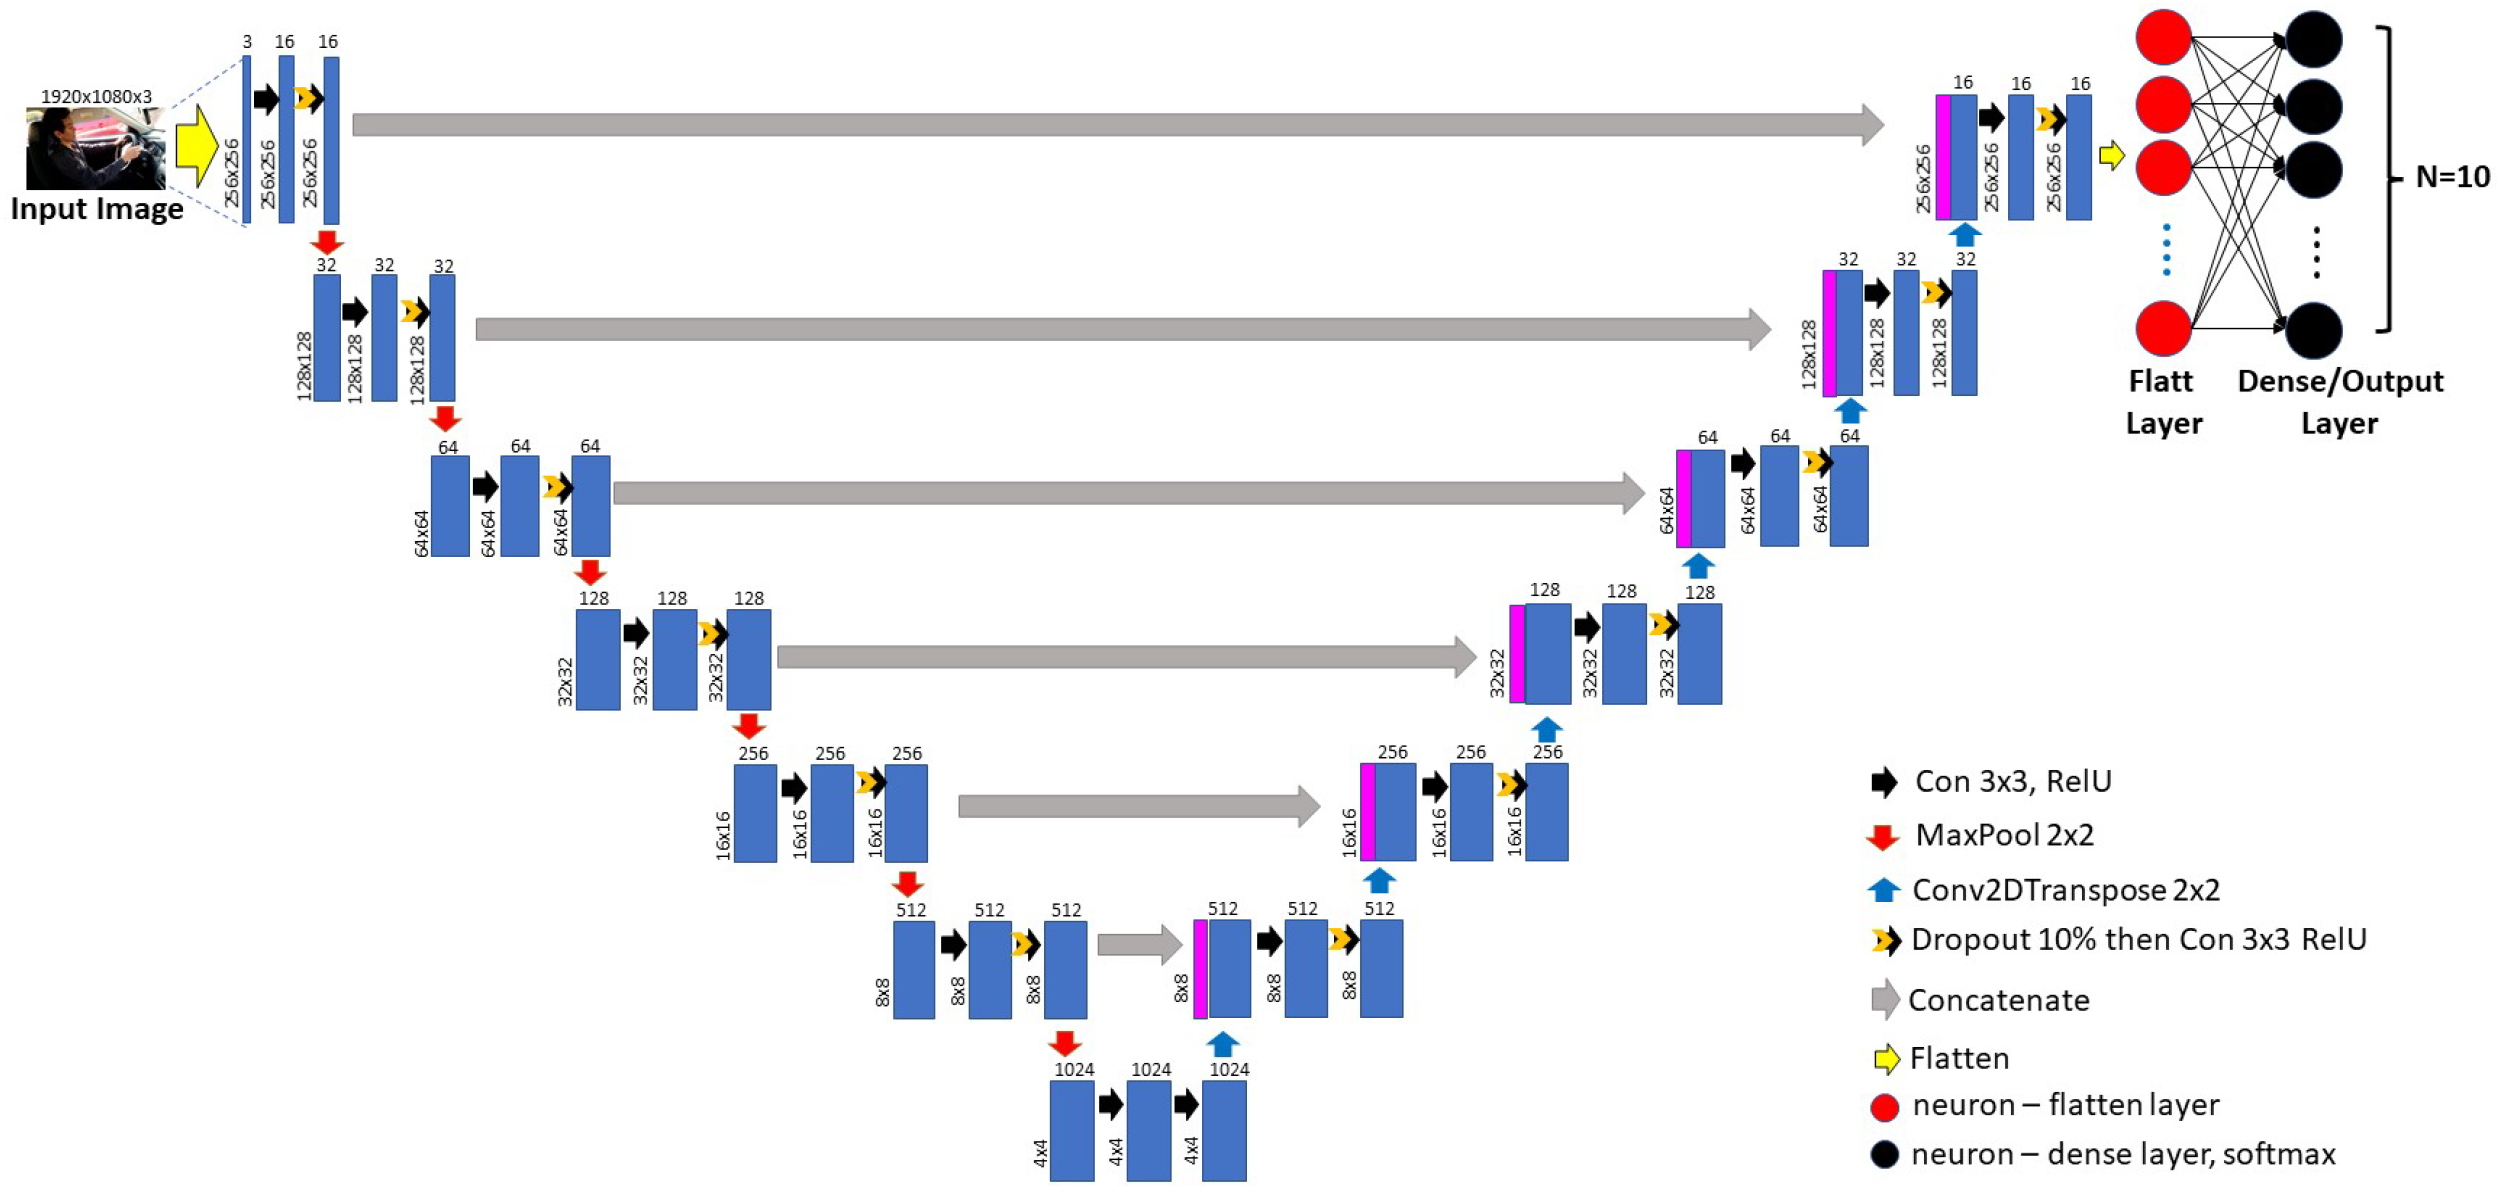
Figure 1 shows the architecture design of the U2-net model, which is created to automatically identify distracted drivers using input image.
In the U2-net model, we modify the unique U-net architecture by adding four convolution layers and two max pooling coatings to the contracting pathway. In addition, in the escalating path, we add four up-sampling (transpose convolution) layers and two max pooling layers. These new convolution layers add more spatial information and context to the classifier. Additionally, we use full-color images (RGB color channels) instead of gray-scale images, as in the U-net architecture. The transpose convolution layers upsurge the tenacity of the output. To keep sound localization and reduce the time set for training, we decrease the dimension of each input picture, making them 256 × 256 pixels in size and fodder as the input to the proposed architecture.
For each input image, convolutional operations are performed to extract image features, followed by pooling operators to reduce the image dimension. These convolutions and pooling operators are performed for the successive layers to reach the minimum image dimension that is full of features. Then the transpose convolution is accomplished to up-sample the input feature map to an anticipated output feature map. After that, concatenating the layers generated from the pooling operators with layers generated from the up-sampling operators is performed to increase the resolution of the results and to help extract the prevailing features that are essential for operational arrangement and exposure. A significant array of feature systems enable the web to transmit contextual data to more excellent firmness layers during the up-sampling process. The U2-net design, such as the U-net architecture, has both a contracting route (
Figure 1: left side) and an expanding path (
Figure 1: right side). The narrowing path is measured in the manner of a convolutional system. It comprises two 3 × 3 convolution layers applied repeatedly and one max pooling process. Each convolution employs the same Rectified Linear Unit (ReLU) and buffering. The stride of 2 is used for down-sampling using the identical buffer in the 2 × 2 max pooling procedure.
The U2-net architecture takes a set of images as input to generate a list of probabilities based on the number of classes as an output. Each image from each dataset represents an input to the contracting operation. The contracting operation begins with 16 filters (feature channels) and ends with 1024 filters, while the expansive operation begins with 1024 filters and ends with 16 filters. At each step in the contracting path, we drop 10% to avoid model overfitting and we double the number of feature channels to reach 1024 feature channels.
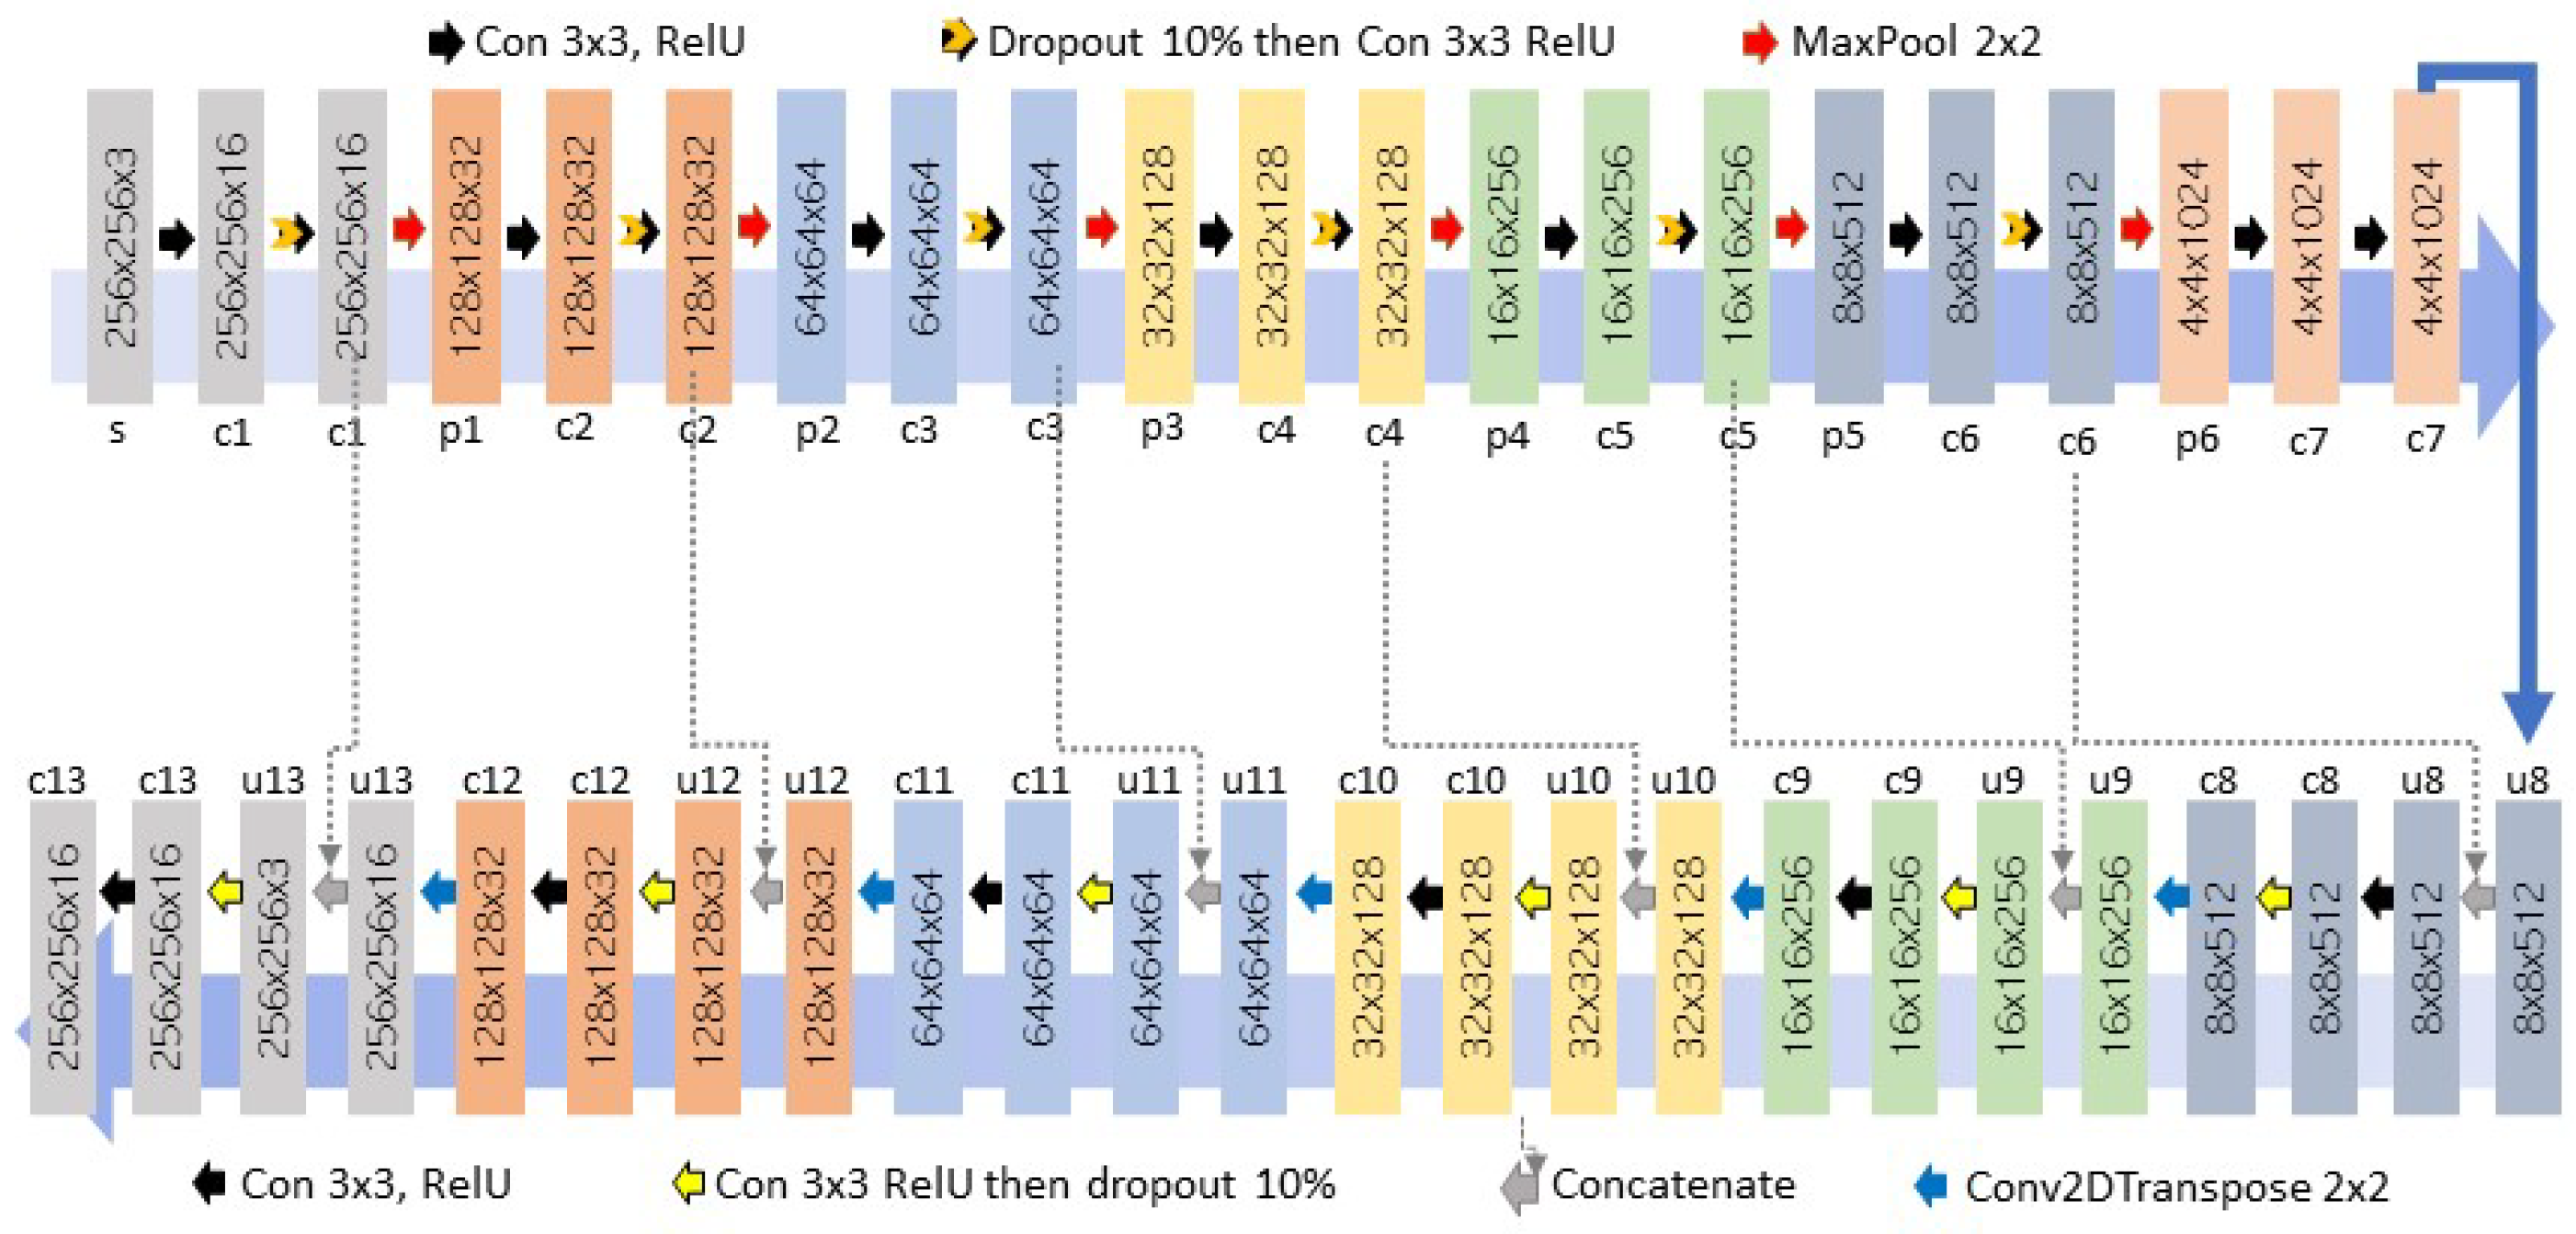
The feature map’s up-sampling (transpose convolutions) is the first stage in the expanding path. This is monitored by a 2 × 2 convolution, which cuts the number of feature channels in half, a concatenation with the corresponding feature map from the contracting path, and two 3 × 3 convolutions, each followed by ReLU activation function with the stride of 1 and with the same padding. In addition, we drop 10% each time to avoid model overfitting. A successive dense layer is used to gather a correct output, enhancing the accuracy. In total, the U2-net architecture has 1 input layer, 32 convolutional layers, 6 max-pooling layers, 6 transpose convolution layers, 6 concatenating operations, 12 dropout layers, and 1 dense layer, as follows and shown in
Figure 2.
1. Input layer. Each image from the dataset represents an input to the U2-model. We reprocess each input image by reducing the dimension to 256 × 256 × 3 with RGB color channels using a bi-cubic interpolation algorithm. Resizing plays a major role to train any Machine Learning (ML) or Deep Learning (DL) models.
2.
Convolutional layer. We use the typical convolutional layer in the U-net architecture generated by applying the convolution operation using a kernel of different sizes, number of filters, stride, padding, and activation function. This layer contains all the vital topographies of an image, such as color and gradient orientation. The input to the convolution layer is a matrix containing image information, while the output is a map full of image features. We used nested convolution operation along with the ReLU as an activation function. It is the most used initiation task in DL replicas that proposes supplementing and strengthening the nonlinearity properties of the neural system. Each image has a set of channels. We start with 16 different channels as an initial step and then duplicate it for each next layer in the encoding path, as described in
Figure 1 to reach out to 1024 channels. while in the decoding path, we start with 1024 and reduce this number by dividing it by 2 for each level to reach out to the original number 16. We use the
Conv2D function provided by
tensorflow.Keras to perform the convolution step. For any given input
x, the ReLU is defined as follows [
35,
36]:
3.
Max pooling layer. The down-sampling layer is another name for this layer. It is the layer handled after the convolution layer in the CNN design. The feature maps’ height and breadth are reduced while maintaining the same depth by the max pooling layer. To prevent model overfitting, reducing the map’s size, the amount of computation required, and the number of factors, is helpful. The down-sampling operation can be performed by using either maximum pooling or average pooling. Maximum pooling extracts the maximum value of the elements within a receptive field, and average pooling calculates the mean value. We used the maximum pooling as a pooling layer because it preserves the features in the input feature map in a better way in terms of object representation during the down-sampling process [
31,
37]. We use the
MaxPooling2D function provided by
tensorflow.Keras to perform the max pooling step.
4.
Transpose convolution layer. This layer is also known as the up-sampling or deconvolutional layer. We use this layer in the decoding path to precisely restore and locate features. It represents standard convolutions defined by the padding and stride and is usually carried out for up-sampling to generate an output feature map that has a spatial dimension greater than that of the input feature map. We use the
Conv2DTranspose function provided by
tensorflow.Keras to perform the transpose convolution step. For a given size of the input
i, kernel
k, padding
p, and stride
s, the size of the output feature map
o generated is given by:
5. Dropout layer. The dropout layer randomly deletes inputs based on the rate (we use 10%) at each update during training time, which helps prevent overfitting. We used the dropout operation after each first convolution when the max pooling, or up-sample operation, is completed. We use the Dropout function provided by tensorflow.Keras to perform the dropout step.
6. Dense layer (fully connected layer). In any neural network, a dense layer is a layer that is fully connected with its preceding layer. It analyses the features obtained from the fully connected preceding layers and predicts the output result that is formed by a weighted average function of its input. The weighted average is passed through an activation function that generates the output score of that neuron. Similarly, the process is carried out for all neurons of all layers.
For multi-class classification problems, the soft-max function is the most commonly used activation function. The number of dense layers depends on the problem requirement and number of output classes. Each neuron in the last dense layer has a vector that contains all the probabilities of an element belonging to each class as a classification result. The predicting class is the class that has the highest probability value. We used one
Flatten layer and one
Dense layer along with the
Soft-max function [
38] provided by
tensorflow.Keras to represent the output score value as:
where
W and
B stand for the amount of weight and biases in the preceding layer, respectively, and
gives the clustering likelihood for the specific class
i. The overall amount of courses is N. In this paper, we use N = 10.
7. Loss function. The value disparity between the expected and actual outcomes is the loss function. It evaluates how effectively the neural network simulates the training set of data. The algorithm performs better when the number is lower. Any model’s training goal is to reduce the loss value as much as possible. Cross entropy is a popular function of loss for classification algorithms. An optimization function known as the cross-entropy loss function is employed when building a classification model to categorize data by estimating the likelihood that the data will pertain to one class or another. For binary classification, binary cross entropy is frequently used as a loss function, and for multi-class classification, categorical and sparse categorical cross-entropy are commonly used. In the U2-net model, we used the categorical_crossentropy categorical cross entropy supported by TensorFlow.Keras.
8.
Optimizer. An optimizer is a program or function that modifies the training rate and weights of the neural network. As a result, it enhances precision and reduces overall waste. The optimizer is utilized from the software. we use
adam optimizer provided by
TensorFlow deep learning framework, which provides proven effectiveness and optimized implementations. The adam optimizer changes how the model’s parameters should be modified and adapts the learning rate to allow for efficient input processing when combined with the momentum idea [
39].
TensorFlow also provides
adam optimizer under
Keras.
9.
Concatenation. The concatenate layers play a crucial role in merging the outputs of different layers into a single layer. This allows the model to learn shared features across tasks, leading to improved performance, efficient training, and better generalization [
5]. We used the
concatenate function supported by
TensorFlow.Keras.


