Article

Spatiotemporal Variation of Fractional Vegetation Cover and Its Response to Climate Change and Topography Characteristics in Shaanxi Province, China

1
College of Natural Resources and Environment, Northwest A&F University, Yangling 712100, China
2
College of Humanities & Social Development, Northwest A&F University, Yangling 712100, China
3
Department of Plant and Environmental Science, College of Agricultural, Consumer and Environmental Sciences, New Mexico State University, Las Cruces, NM 88001, USA
*
Author to whom correspondence should be addressed.
Appl. Sci. 2023, 13(20), 11532; https://doi.org/10.3390/app132011532
Submission received: 24 September 2023 / Revised: 15 October 2023 / Accepted: 17 October 2023 / Published: 21 October 2023
(This article belongs to the Special Issue Applications of Remote Sensing and GIS in Land and Soil Resources)

Abstract

:
Since the beginning of the 21st century in Shaanxi Province, China, ecological restoration has increased fractional vegetation cover (FVC) and decreased soil and water erosion. The climate and topography will be critical factors for maintaining vegetation coverage in the future. Based on the moderate resolution imaging spectroradiometer (MODIS) normalized difference vegetation index (NDVI) data, we monitored FVC variations in Shaanxi Province, China, as well as in three subregions of the Loess Plateau (LOP), Qinling–Bashan Mountain (QBM), and Guanzhong Plain (GZP). Using Sen+Mann–Kendall, correlation analysis, and geodetector methods, we detected trends and responses to climate change and topographical characteristics in Shaanxi Province from 2000 to 2018. The results indicated that 73.86% of the area in Shaanxi Province exhibited an increasing FVC with a growth rate of 0.0026 year−1 from 2000 to 2018. The FVC in the three subregions varied, as QBM (87.24–91.47%) > GZP (47.45–66.93%) > LOP (36.33–49.74%), which displayed a significant increase, slight increase, and slight decrease, respectively. The variation of FVC was significantly positively correlated with climate factors (precipitation, temperature, sunshine duration) at monthly and seasonal scales. The time-lag duration between FVC and climate factors was 1–3 months except for the conjunctional areas of GZP with the LOP and QBM, which exhibited a time-lag of 5–6 months. Topographically, the landform of hills had the highest FVC increase at an altitude of 500–1500 m and a slope of 2°–6°. The dominant driving factors affecting FVC variation in Shaanxi Province and LOP area were climatic factors. In the QBM area, the dominant factors were related to topography (relief, elevation, slope), whereas in the GZP area, they were relief and sunshine duration. We can conclude that local topography characteristics are important in implementing revegetation projects because they strongly influence water, temperature, and sunshine redistribution.

1. Introduction

Vegetation reduction-induced environmental problems in Western China, such as soil erosion and desertification, have been paid great attention by the government. For example, the Three North Shelterbelt Project has been ongoing since 1978, with the aim of changing the hazards of sandstorms and condition of soil and water loss, and the Grain for Green Project (GGP) was implemented in 1999 to alleviate the situation of soil and water erosion on sloping farmland. Remarkable ecological benefits have been achieved by these revegetation measures in recent years [1,2,3]. Reports indicated that forest coverage increased from 20.4% in 1998 to 25.3% in 2013, and soil loss decreased from 1600 million tons in 1970 to 300 million tons in 2016 in the Yellow River basin [4]. Shaanxi Province in China was the first to implement the GGP, and researchers reported that the trend of vegetation coverage increased at a rate of 0.00878 year−1 from 2000 to 2015 [5], and the area with vegetation coverage advanced 400 km to the north [6]. However, cases that focused on vegetation coverage consistency indicated that the rate of increase in vegetation cover decreased, and in some areas, vegetation cover even decreased [7,8]. Survival rates for trees in regions where the GGP was implemented were only 24% [9]. The GGP ignored the climate and topographical factors that affect vegetation survival [10,11]. Therefore, exploring the relationship between vegetation coverage variation and climate and topographical factors will be essential to maintaining vegetation cover over time.
Vegetation plays an important role in the ecosystem, acting as a linkage between natural elements and realizing the interrelation and circulation of air, soil, water, and biomass [12,13,14,15]. In order to monitor vegetation variation, the academic community has proposed a variety of indexes, such as the normalized difference vegetation index (NDVI), leaf area index (LAI), ratio vegetation index (RVI), enhanced vegetation index (EVI), and fractional vegetation cover (FVC). Among these indexes, FVC is one of the most commonly used because it can directly reflect the coverage of surface vegetation [16,17]. FVC is considered to be a useful index for the assessment of ecological benefits of vegetation projects in hydrological and ecological models, studies of vegetation transpiration and soil water evaporation, and evaluation of land degradation [18,19,20,21,22]. Shen et al. [23] investigated the spatiotemporal changes of FVC and its relationship to climate change in the freshwater marshes of Northeast China from 2000 to 2016 based on the NDVI and climate data. Liao et al. [24] investigated the sensitivity of 16 parameters derived from C-band Radarsat-2 polarimetric SAR data to crop height and the FVC of corn and wheat.
Climatic conditions have a profound influence on the growth and spatial distribution of vegetation [25,26]. Wang et al. [27] found that changes in spring and winter precipitation have a greater impact on vegetation growth in the Qinling Mountains, while autumn and winter temperatures have a greater impact on vegetation growth in the northern Qinling Mountains. Yuan et al. [28] found that during the 2001–2015 period in the Yangtze River Delta, the temperature was the main climatic factor affecting vegetation growth at both annual and monthly scales, and precipitation had a 1–2 months’ time-lag effect on vegetation cover change. Guan et al. [29] analyzed the response of vegetation to climate change in the Hexi Corridor region from 2000 to 2010 and reported a high correlation between precipitation and vegetation changes in the Qilian Mountains. However, in the oasis region, NDVI was negatively correlated with precipitation. Land surface configuration decisively distributes water and heat flow among soil, air, and plants, which determines ground vegetation growth and coverage [30,31]. Li et al. [32] found that vegetation degradation areas in Gannan, Jiangxi Province, China were mainly located in low-elevation and low-slope regions, and vegetation degradation on shaded slopes was more severe. Yin et al. [33] found that the vegetation cover in the Daqing Mountains area of Inner Mongolia, China, increased with elevation and slope, and vegetation cover on shady slopes was greater than that on flatlands and sunny slopes.
As a leading province in the implementation of the GGP, Shaanxi has revegetated a 26,931 km2 area between 1999 and 2018, including 12,450 km2 of farmland returned to forest and grassland, 12,885 km2 of barren hill afforestation, and 1597 km2 of forest conservancy areas [34]. Significant improvement in vegetation cover has been reported by researchers in recent years, especially in the northern part of Shaanxi Province [7,35]. Vegetation projects are considered the dominant factors contributing to FVC improvement. However, at the local scale, stunted tree growth has been reported after several years of planting due to soil drying caused by the higher evaporation from the planted-tree areas than from areas dominated by shrubs and grass [36]. In some areas, for example in the Loess Plateau, the rate of increase of FVC has slowed down, and vegetation degradation has occurred [37]. This indicates that the climate and topographical factors must be considered during the revegetation process. Shaanxi Province encompasses variable topographical and climate conditions, including Qinling Mountain, Guanzhong Plain, and the Loess Plateau, and northern subtropical, warm temperate, and medium-temperate zones from south to north. Additionally, a warm and humid trend has been detected in the Loess Plateau area in recent years [38,39], which has increased the uncertainty of the effect of climate on vegetation coverage variation.
Over the past few decades, vegetation ecology and biodiversity have declined due to human activities. The development of remote-sensing technology has provided researchers with new vegetation-monitoring methods. However, many studies that reveal the impact of climate variation on vegetation have paid less attention to terrain factors. In the study of the hysteresis of vegetation response to climate variation, the correlation between average FVC and climate variation in a specific geographical area is usually determined, but this has relatively low accuracy. Determining the correlation by pixel can greatly improve the accuracy and consistency of research results. Therefore, the aims of the current study were (1) to detect the spatial and temporal variation of vegetation coverage in Shaanxi Province based on the long time-series vegetation index of FVC, (2) to analyze the response of FVC variation to climate change and topography, and (3) to quantify the contribution of climate and topographical factors on FVC variation. The results of this research are expected to provide a theoretical basis for accurate revegetation measures.

2. Materials and Methods
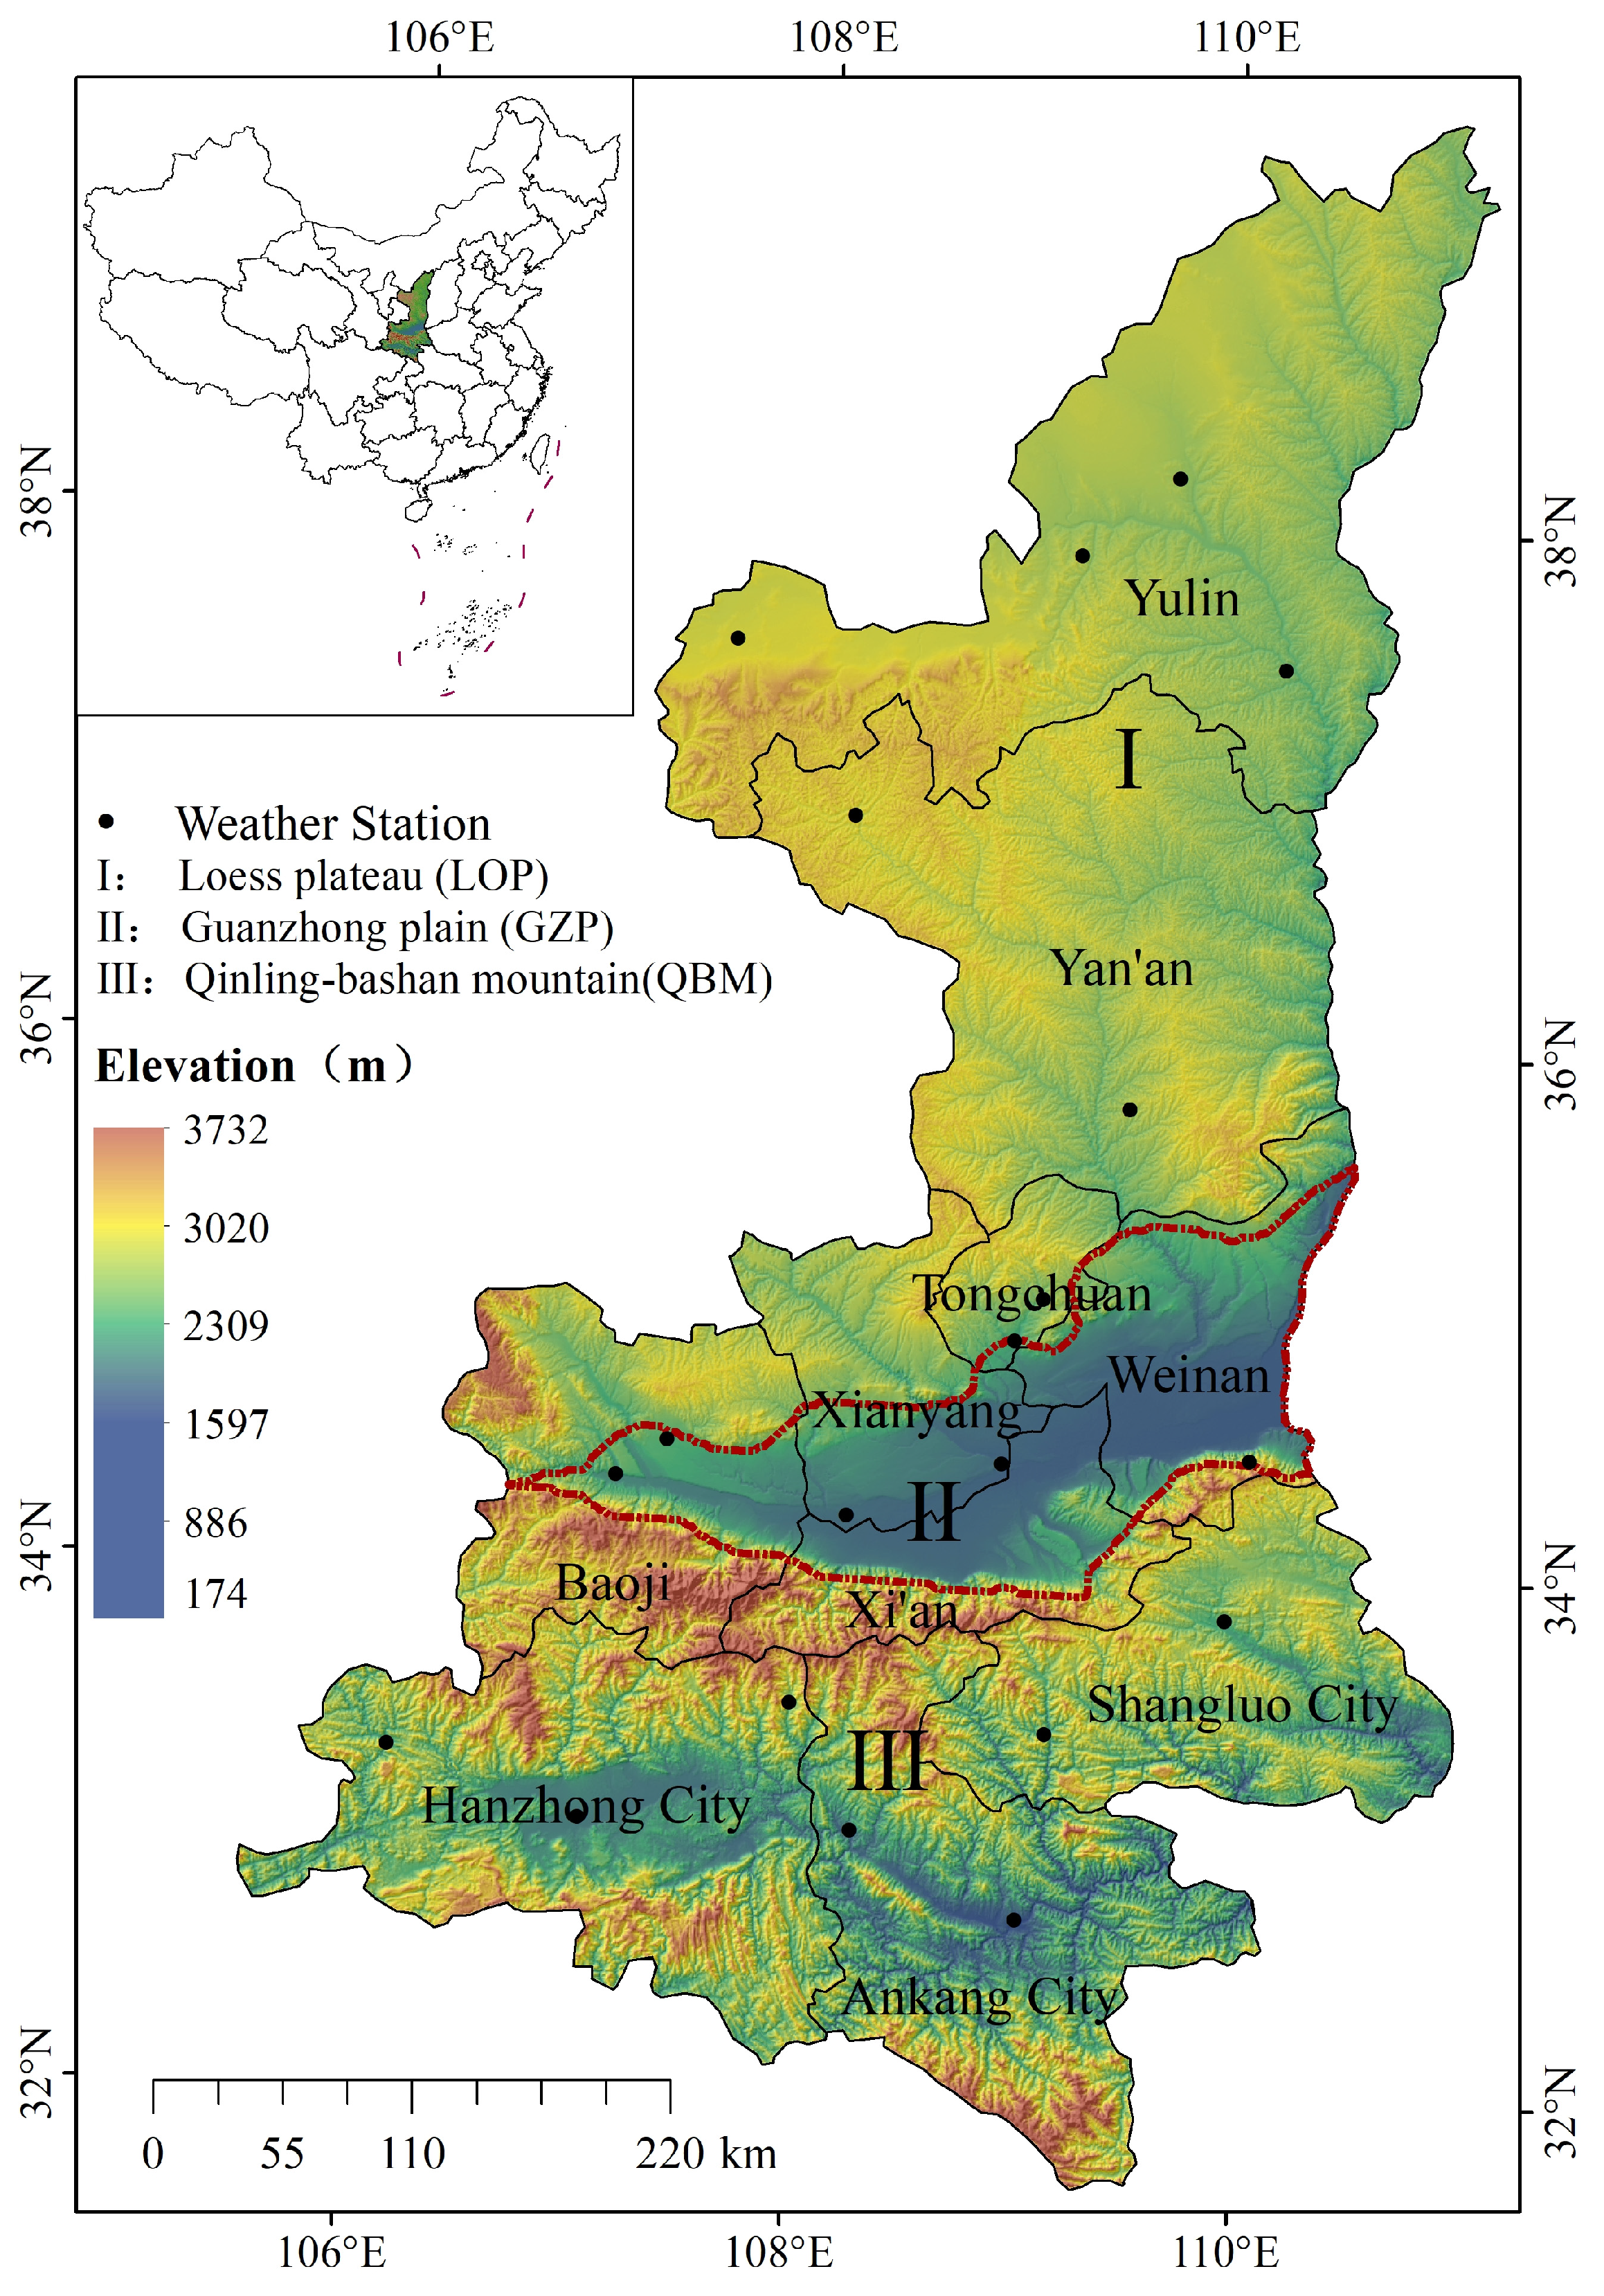
2.1. Research Area

Shaanxi Province is located in Northwestern China (Figure 1). It covers a total area of 205,800 km2 with the elevation ranging from 174 to 3732 m. The average annual temperature and rainfall range from 7 to 16 °C and from 400 to 1200 mm, respectively, gradually increasing from north to south, while the annual sunshine duration ranges from 1307 to 3050 h, gradually decreasing from north to south (http://en.shaanxi.gov.cn, accessed on 10 July 2022). The terrain of Shaanxi Province is high in the north and south, low in the middle, with plateaus, mountains, plains, and basins (Figure 1). Geologically, three distinct subregions can be identified: Qinling–Bashan Mountain (QBM), Guanzhong Plain (GZP), and Loess Plateau (LOP) according to climate, surface characteristics, and elevation. The QBM region, with an altitude of 1000–3000 m, has excellent hydrothermal conditions, coupled with the undulating topography and numerous rivers in the area. This subregion lies in the humid subtropical zone, with temperate winters and long, hot, humid summers. The dominant soil types are Udic Argosols and Cambosols developed from deluvial and alluvial parent material. Forest coverage is 43.31%, and the vegetation type is north subtropical mixed evergreen–deciduous broad-leaved forest. The GZP region is a major agricultural production base and an important national commercial grain base. This subregion is flat with the altitude ranging from 400 to 600 m, fertile Ustic Argosols soil, and a mild climate characterized by cool to cold winters and hot, humid summers. Deciduous broad-leaved forests are the representative vegetation of the region. The LOP region is regarded as one of the most eroded areas in the world due its lower plant coverage, erodible loess, dense gullies, and severe rainstorms in the summer. This subregion comprises a warm temperate deciduous broadleaf forest and a temperate steppe zone, where the land is susceptible to erosion, and soil moisture and nutrient deficiencies severely hinder agricultural development.

2.2. Data Sources and Preprocessing

The MODIS MOD13Q1 data from 2000 to 2018, with a spatial resolution of 250 m and temporal resolution of 16 days, were used to calculate FVC. The original data were projected and the band separated and mosaicked using the MRT (MODIS Reprojection Tools) method. They were then imported into ArcGIS for null filling and cropping to obtain the image dataset of Shaanxi Province. The maximum value composite (MVC) method was used to create monthly, seasonal, and annual NDVI data. Meteorological data, including monthly average temperature (TEM; °C), monthly total precipitation (PRE; mm), and monthly sunshine duration (SUN; h), were collected from 20 meteorological stations in Shaanxi Province provided by the China Meteorological Science Data Center (http://data.cma.cn/, accessed on 10 November 2021). To obtain the spatial variation of the climate factors, we used the Kriging model for temperature and sunshine, while the IDW (inverse distance weighting) model for precipitation was used for the interpolation process; both of these models have high accuracy as indicated in the literature [40,41,42].
Seasonal and annual meteorological data were synthesized based on the monthly data. The DEM data used in this study were derived from the geospatial data cloud (www.gscloud.cn, accessed on 15 October 2021) with a spatial resolution of 90 m and were preprocessed with projection, stitching, and cropping to extract topographic indicators such as altitude (ALT), slope (SLO), aspect (ASP), and relief amplitude (RIF) (Figure 2).

2.3. Methods

2.3.1. Fractional Vegetation Cover

In this study, we used pixel dichotomy to calculate the FVC of Shaanxi Province from 2000 to 2018. Under the assumption that each pixel contains only two parts of information—soil and vegetation—the NDVI value represented by each pixel was calculated by a weighted average sum based on the proportion of soil and vegetation in the pixel [43].
The formula of NDVI converted to FVC is as follows:
F V C = ( N D V I N D V I s ) / ( N D V I v N D V I s )
where NDVIs represents pixels that contain only soil information (approximately 0), and NDVIv represents pixels that contain only vegetation information (approximately 1). NDVI values with a confidence of 5% and 95% were used as NDVIs and NDVIv, respectively, to exclude the influence of individual extreme values on the calculation results. In this paper, we divided FVC into six grades: very low FVC (FVC ≤ 10%), lower FVC (10% < FVC ≤ 30%), low FVC (30% < FVC ≤ 45%), moderate FVC (45% < FVC ≤ 60%), high FVC (60% < FVC ≤ 75%), and higher FVC (75% < FVC ≤ 100%).

2.3.2. Vegetation Dynamic Monitoring

The Sen+Mann–Kendall method has been widely used in vegetation dynamic monitoring in recent years. Compared with the conventional linear regression method, it can better avoid the interference of measurement error or abnormal values [44]. The detailed calculation formula of the trend of the time series (β) can be found in the literature [44] as can the equations to test whether there is an increasing or decreasing trend in the statistic S [45].
In this study, n > 10, and we used the test statistic Z for trend testing. The formula is as follows:
Z Z = S 1 V A R   ( S ) ,     S > 0                       0 ,                       S = 0 S + 1 V A R   ( S ) ,     S < 0
V A R S = n n 1 2 n + 5 i = 1 m t i ( t i 1 ) ( 2 t i + 5 ) 18
where n is the number of sequential data, m is the number of knots (repeated data) in the sequence, and ti represents the width of the knot (the number of repeated data in the ith set of repeated data). With the bilateral trend test for Z, the critical value Z1−α/2 is found in the normal distribution table at the given significance level α. When |Z| ≤ Z1−α/2, the sequence trend is considered insignificant; if |Z| > Z1−α/2, the sequence trend is considered significant.
In this study, the trends of the FVC time-series data were classified into the following four categories:
β     β > 0     Z > 1.96 ,     Significant   imporvement     Z 1.96 ,               Slight   imporvement     β < 0     Z > 1.96 ,     Significant   degradation     Z 1.96 ,               Slight   imporvement

2.3.3. Correction Coefficient for Topographic Areas

The terrain fluctuation can differentiate sunshine distribution in shady and sunny slopes, which affects the brightness of the ground objects on the remote sensing data [46]. Therefore, a correction for topographic area must be performed, as follows, to eliminate the uncertainty of vegetation evaluation caused by differences in absolute topography and different topographic factors [47]:
K = S i e / S e S i / S
where Sie is the area of vegetation change type i in e-level topography, Se is the topographic areas of level e, Si is the area of vegetation and change type i in the study area, and S is the study area. k > 1 indicates that vegetation change type i is dominantly distributed in topography at level e, k = 1 indicates that vegetation change type i is smoothly distributed in topography at level e, and k < 1 indicates that the ith vegetation change type is nondominantly distributed on topography at level e.
We used the correlation coefficient method to calculate the correlation coefficients of FVC data with the TEM, PRE, and SUN of the current month and the previous 1–6 months, respectively, as follows [48]:
R x y = i = 1 n ( x i x ¯ ) ( y i y ¯ ) i = 1 n ( x i x ¯ ) 2 ( i = 1 n ( y i y ¯ ) 2
where Rxy is the correlation coefficient of two variables, xi is the time series data of year/month, yi is the time-series data of year/month, x ¯ is the average of multiyear/month time-series data, y ¯ is the average of multiyear/month PRE, and n is the number of samples. A significant correlation was considered to be at a 0.05 significance level. Each pixel selected the month with the maximum correlation coefficient value as the lag period. To analyze the instantaneous correlation and lag between FVC and climate, the MVC (maximum value composite) was used to calculate the spatial distribution of the lag period in the entire province.

2.3.4. Geodetector

Climate and topography are important factors affecting vegetation growth. To identify their importance on the FVC variation in Shaanxi Province, we introduced the geodetector method, with its advantage being that it can quantitatively reveal the explanatory degree of the affecting factors. We utilized factor and interaction detectors in the geodetector to analyze and reveal the explanatory degree of climatic and topographic factors to on spatial differentiation of vegetation through q statistics. The interaction between natural factors could be explained by comparing the q value after the superposition of single and double factors, which could identify the enhancement or weakening of the interaction between different natural factors on the explanatory degree of spatial differentiation of vegetation [49] as follows:
q = 1 h 1 L N h σ h 2 N σ 2
where L is the classification of influence factors; N h and N are the number of subtype area h and total area units, respectively; and σ h 2 and σ 2 are the variance of subtype area h and total area of FVC, respectively. The range of the q value is [0, 1], where the closer the value is to 1, the higher the degree of interpretation, and vice versa. This study was performed in R studio (4.2.2) using the GD package [50].

3. Results

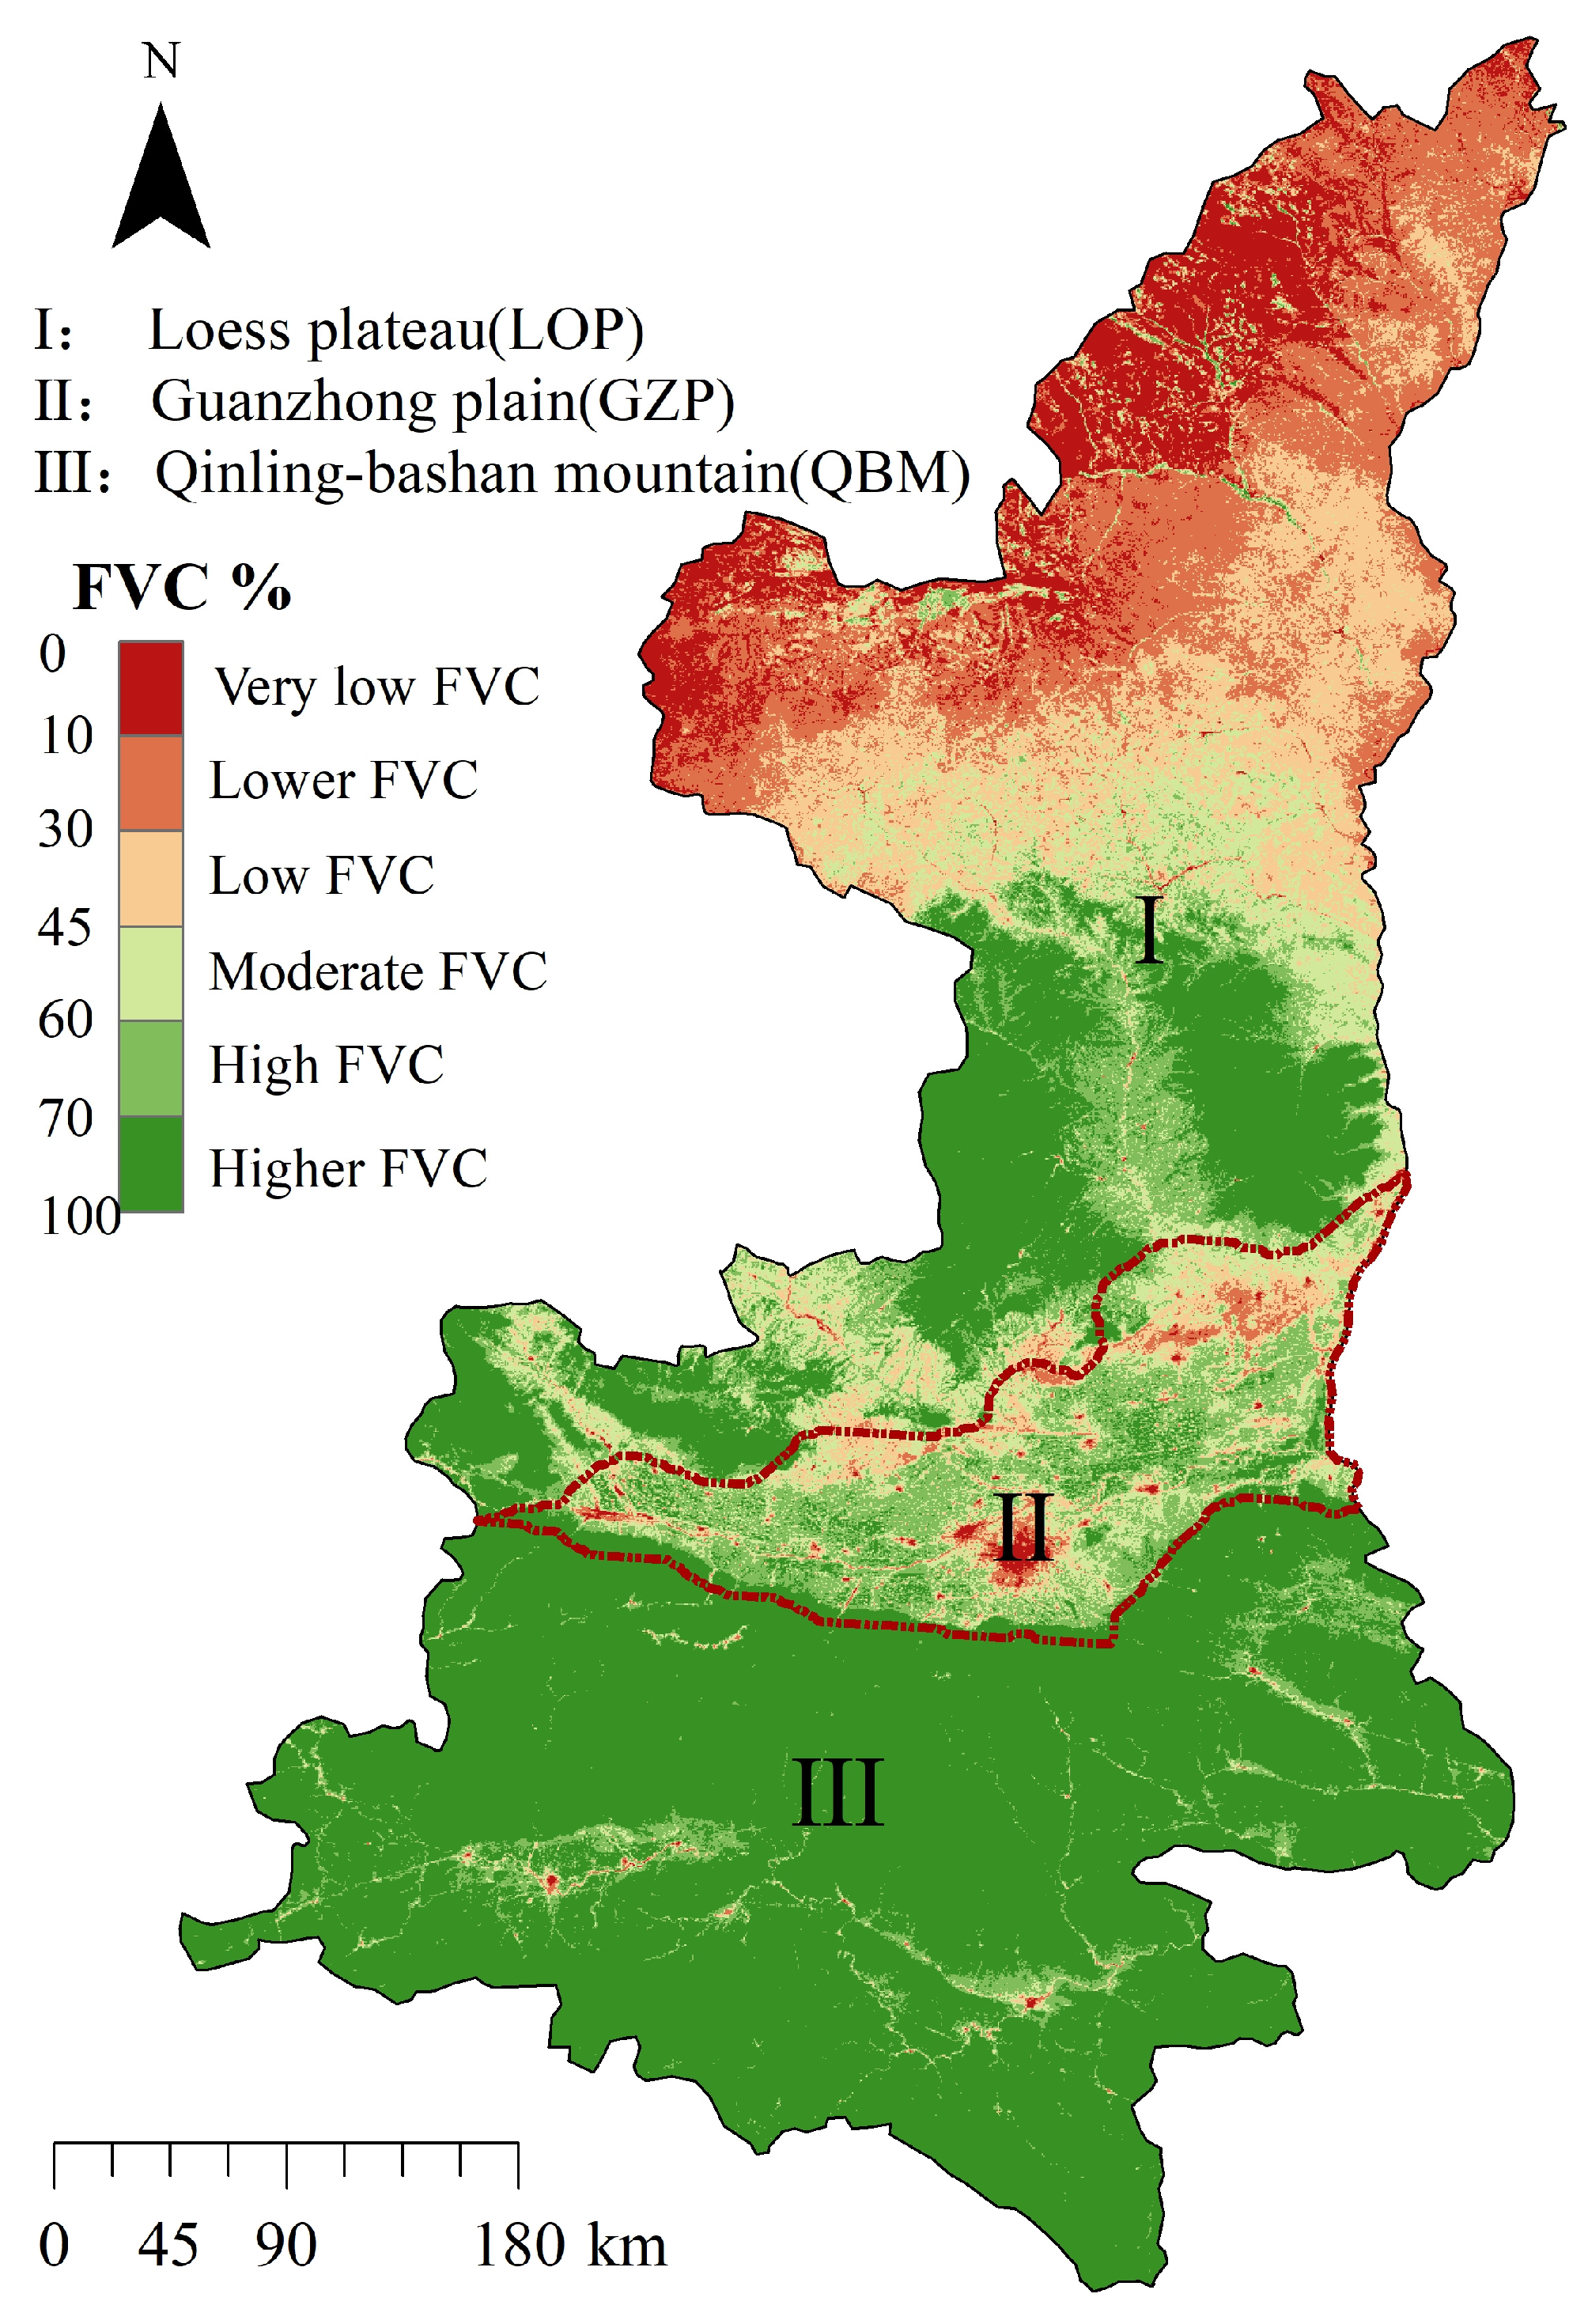
3.1. Spatial and Temporal Variation of FVC in Shaanxi Province

Statistically, the FVC ranged from 59.85% to 66.57%, with an average of 64.18% during the research period in Shaanxi Province (Figure 3). A significant increasing trend was detected from 2000 to 2018 with a rate of increase of 0.0026 year−1. The highest FVC was found in 2013, but it decreased from 2016 to 2018. Among the three subregions, the lowest FVC (ranged from 36.33% to 49.74%) was detected in the LOP area, but the rate of increase of 0.0075 year−1 was the highest. The highest FVC was found in the QBM area, ranging from 87.24% to 91.47%, but the rate of increase during the research period was small. In the GZP area, the FVC ranged from 47.45% to 66.93%, with a decreasing trend.
Spatial heterogeneity of FVC showed a significant decrease from south to north in Shaanxi Province (Figure 4). The high FVC areas, which mainly consisted of the QBM and southern LOP areas, accounted for 60.45% of the entire province. Meanwhile, the moderate, low, and lower FVC areas accounted for 9.94%, 11.33%, and 11.85%, respectively, and were distributed throughout the GZP and central LOP areas. The very low FVC areas, which mainly covered the northern LOP and central GZP areas, accounted for only 6.44% of the entire province.

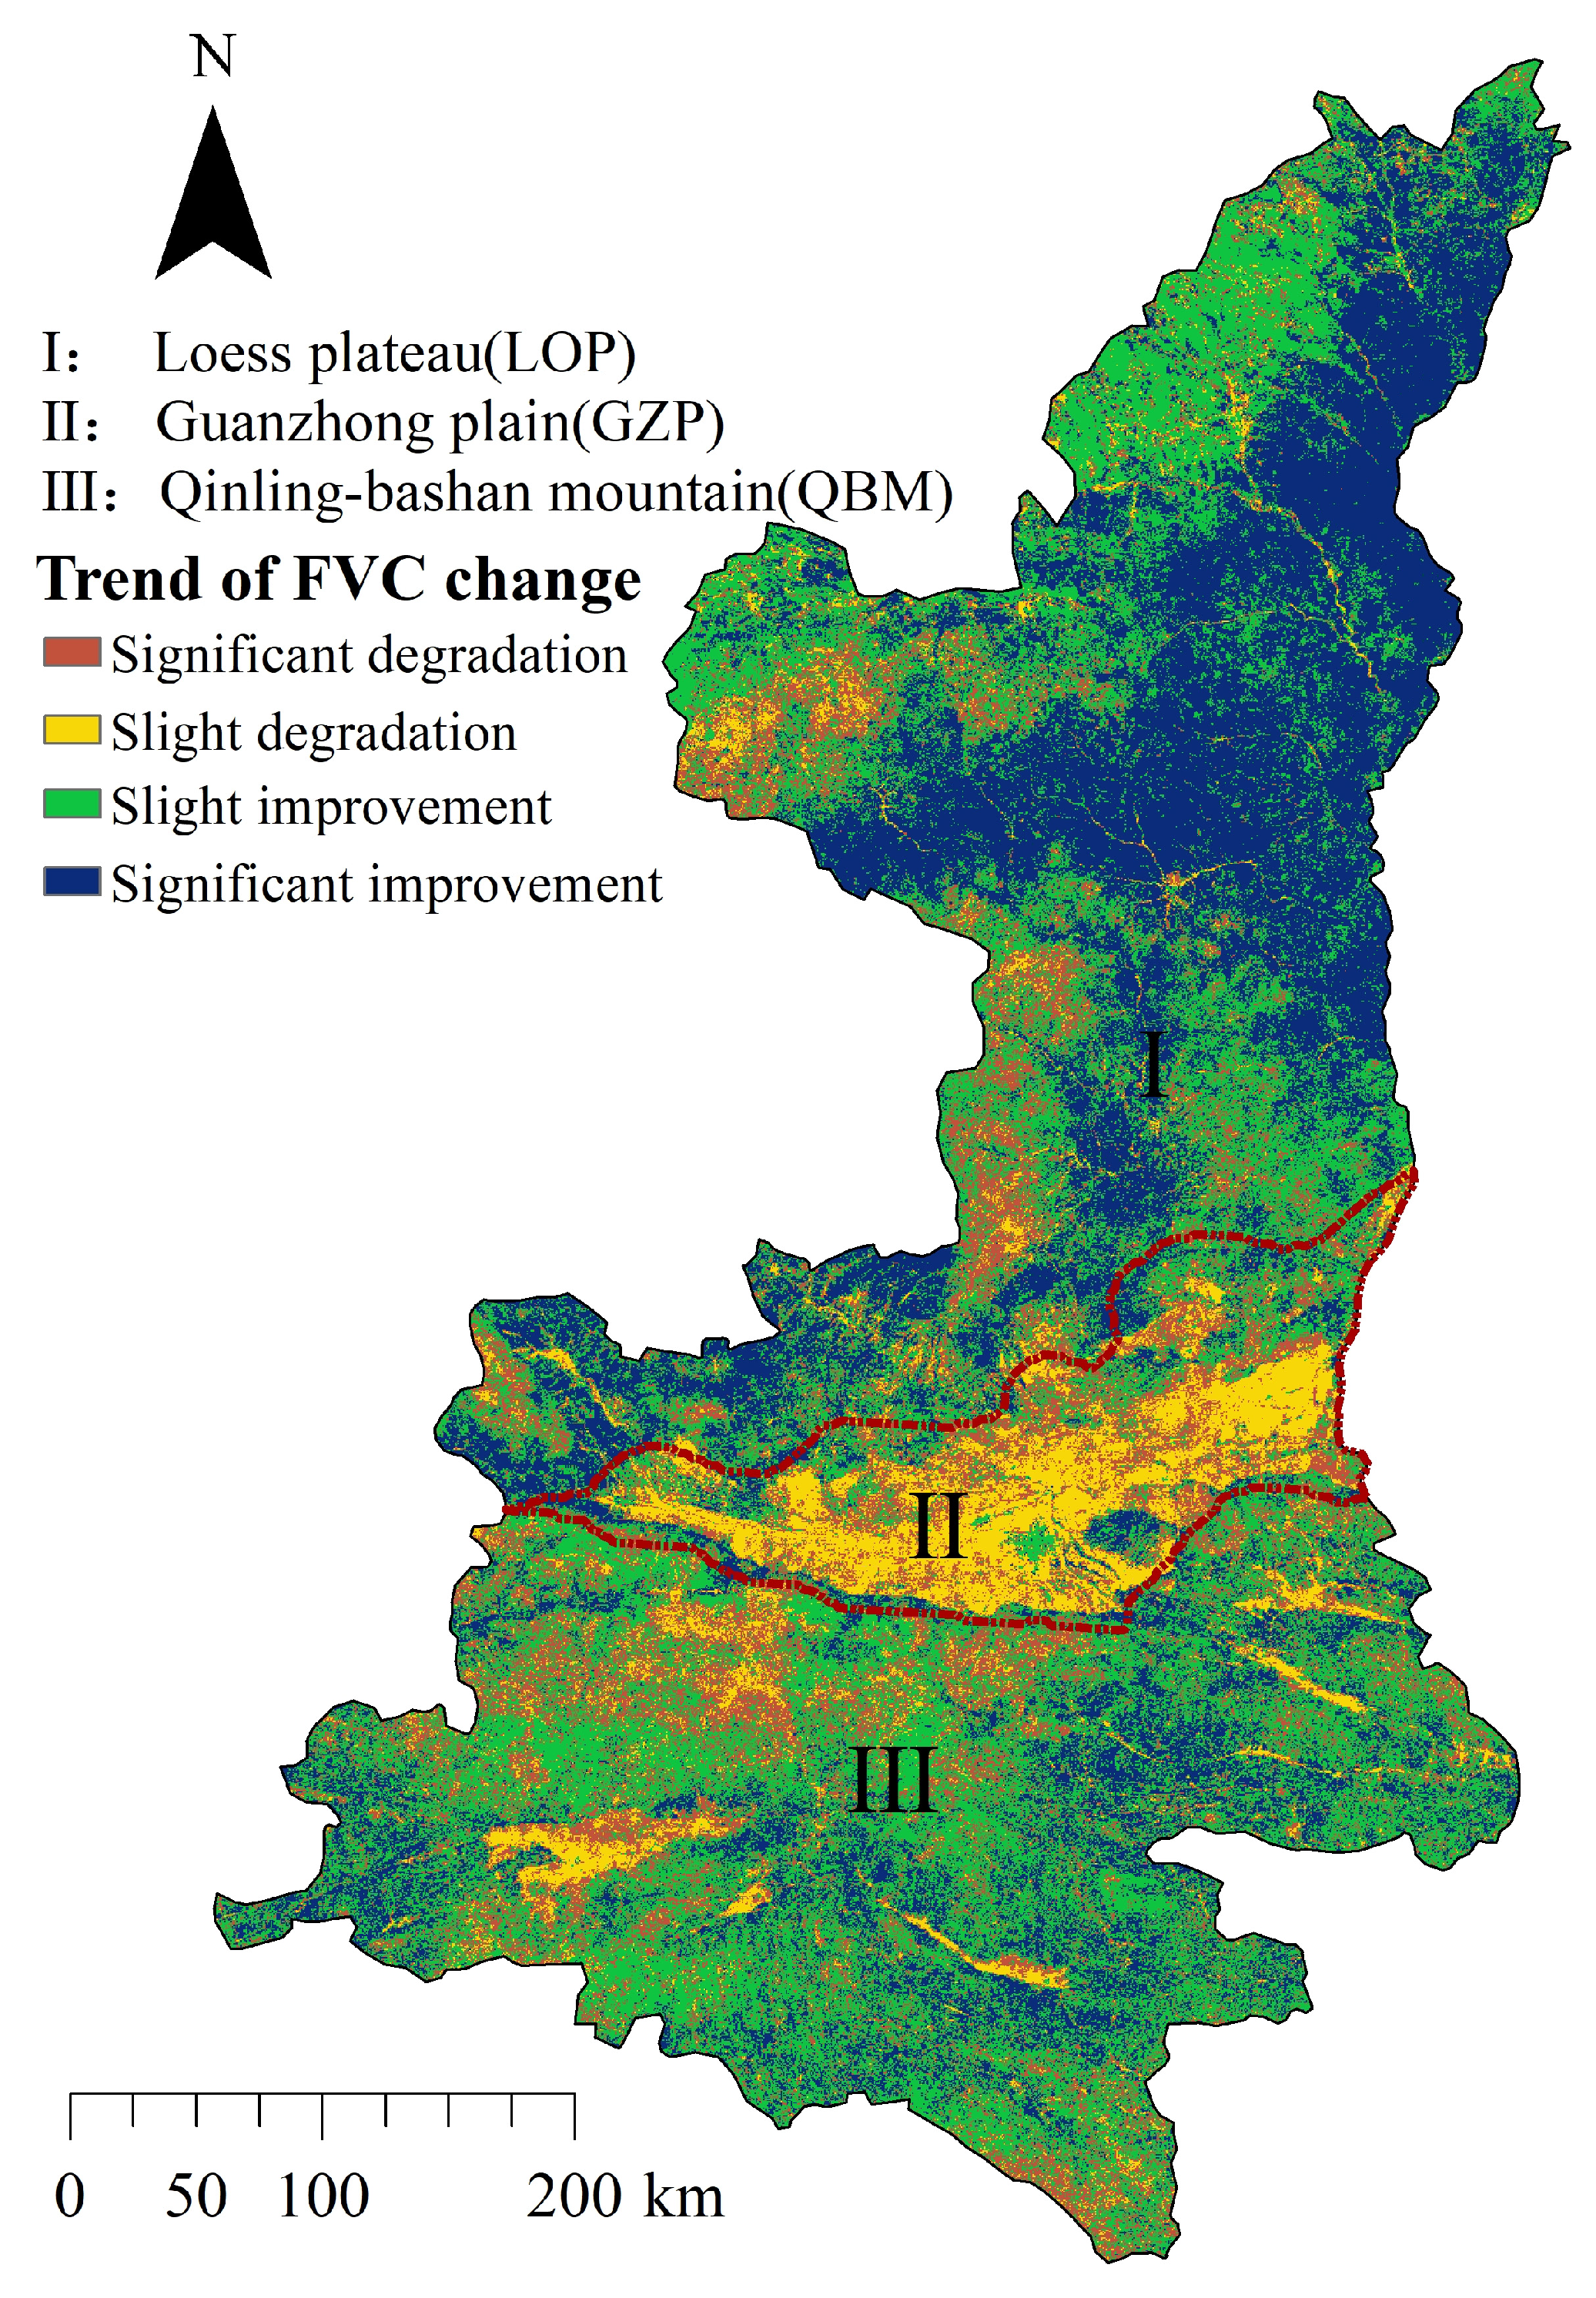
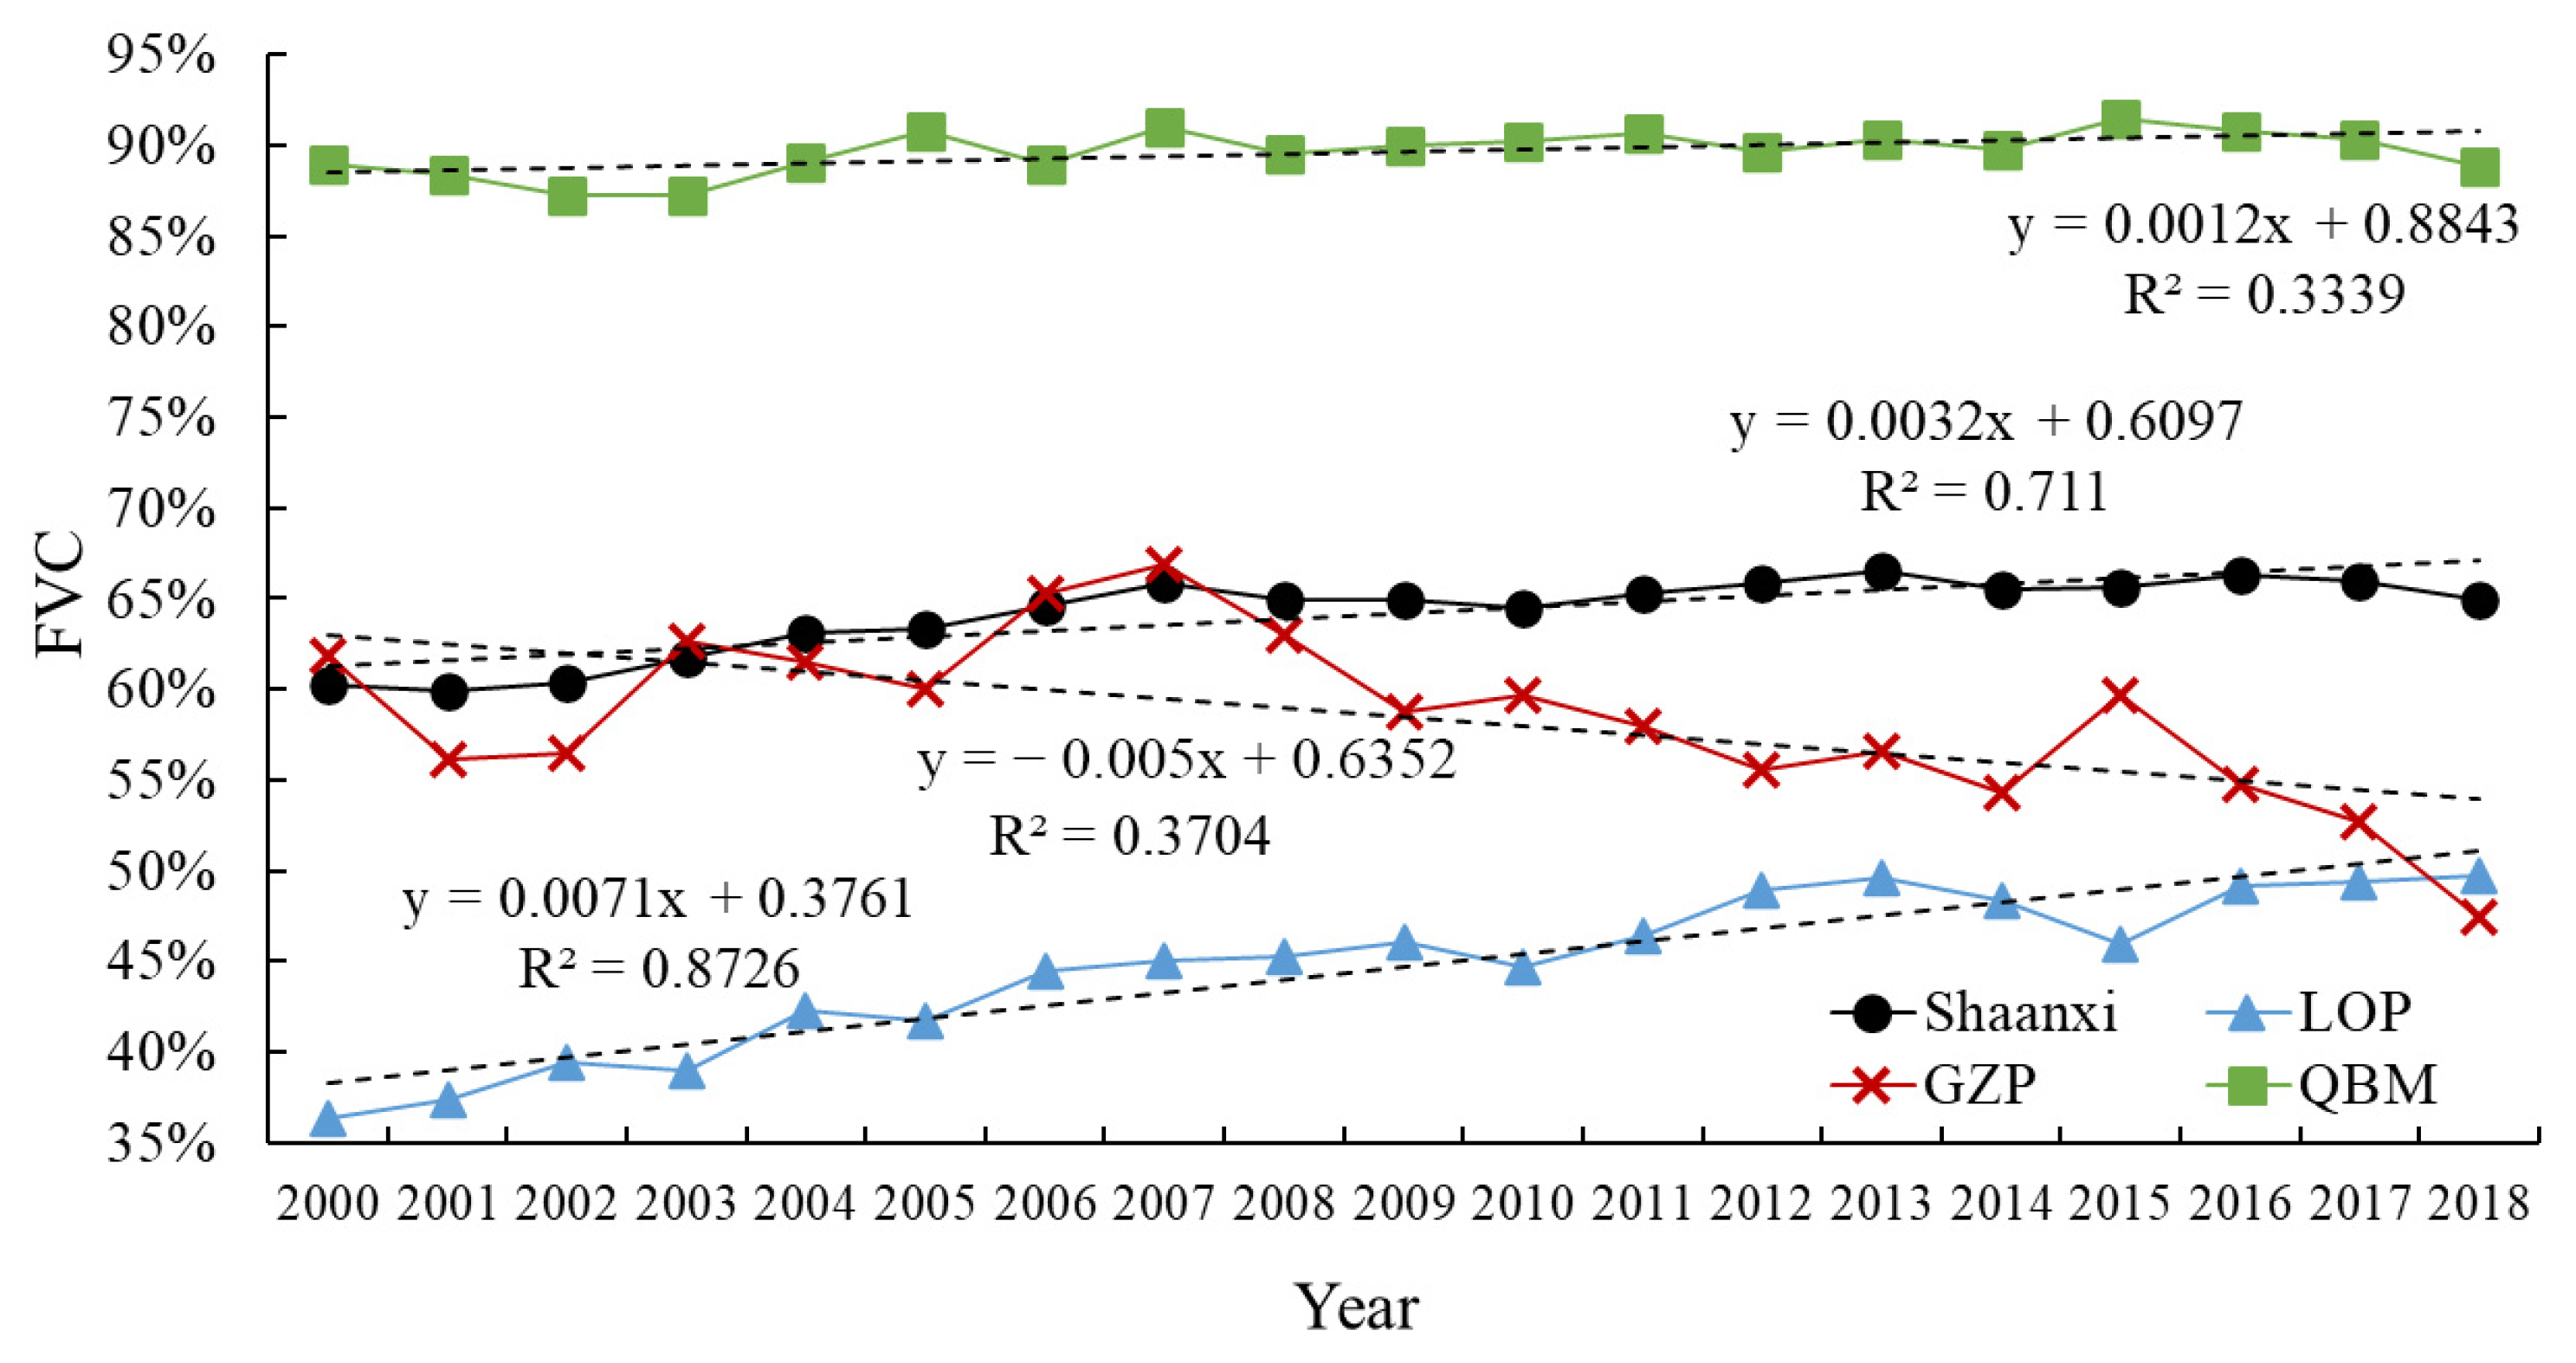
3.2. Changing Trend of FVC in Shaanxi Province

As shown in Figure 5, 73.86% of the area showed an improvement in FVC from 2000 to 2018, with 45.36% of the area being distributed in the eastern LOP area. The decrease in FVC area accounted for 26.14% of the study area and was mainly distributed in the GZP area. Only 18.29% of the area showed a significant decrease in FVC and was sporadically distributed in the research area.
As shown in Table 1, 84.75% of the FVC in the LOP area showed an improving trend, with 57.58% showing significantly improved cover. The degraded area of FVC in the GZP was higher than the improved area, but only 11.15% of the area showed a significant increase in cover. In the QBM area, 72.26% of the FVC detected had an improving trend, but only 21.66% this area showed significantly improved cover.

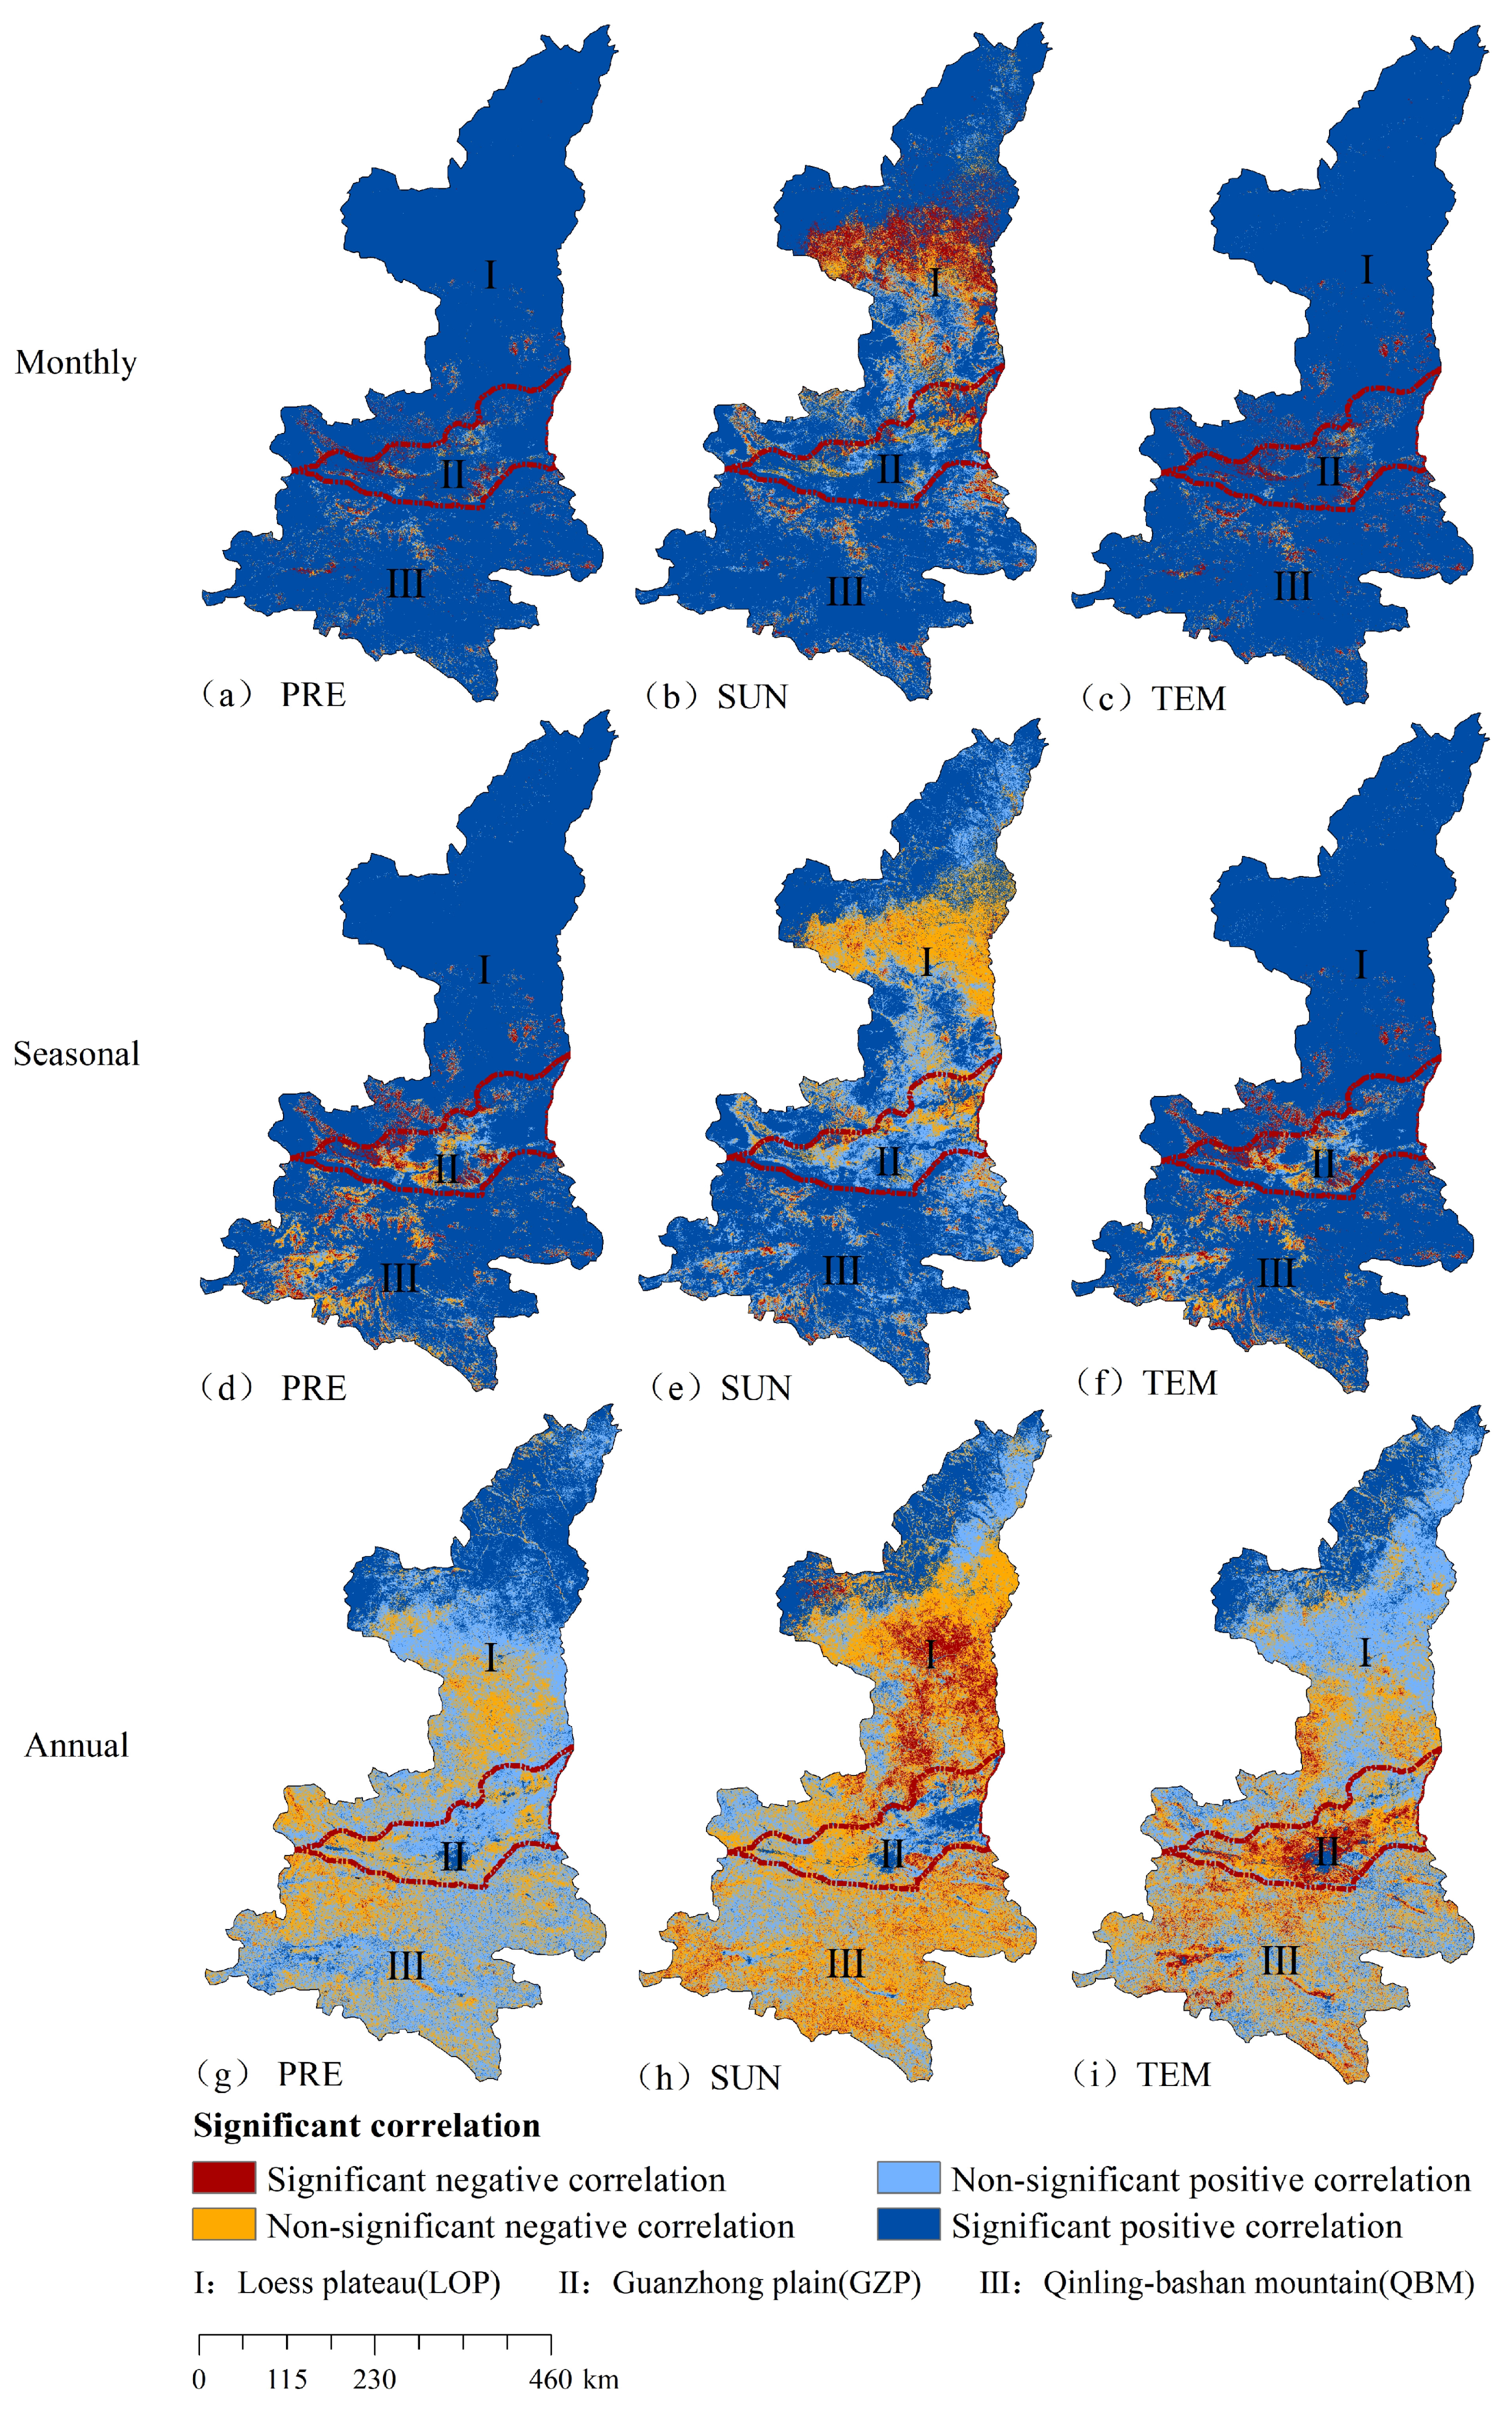
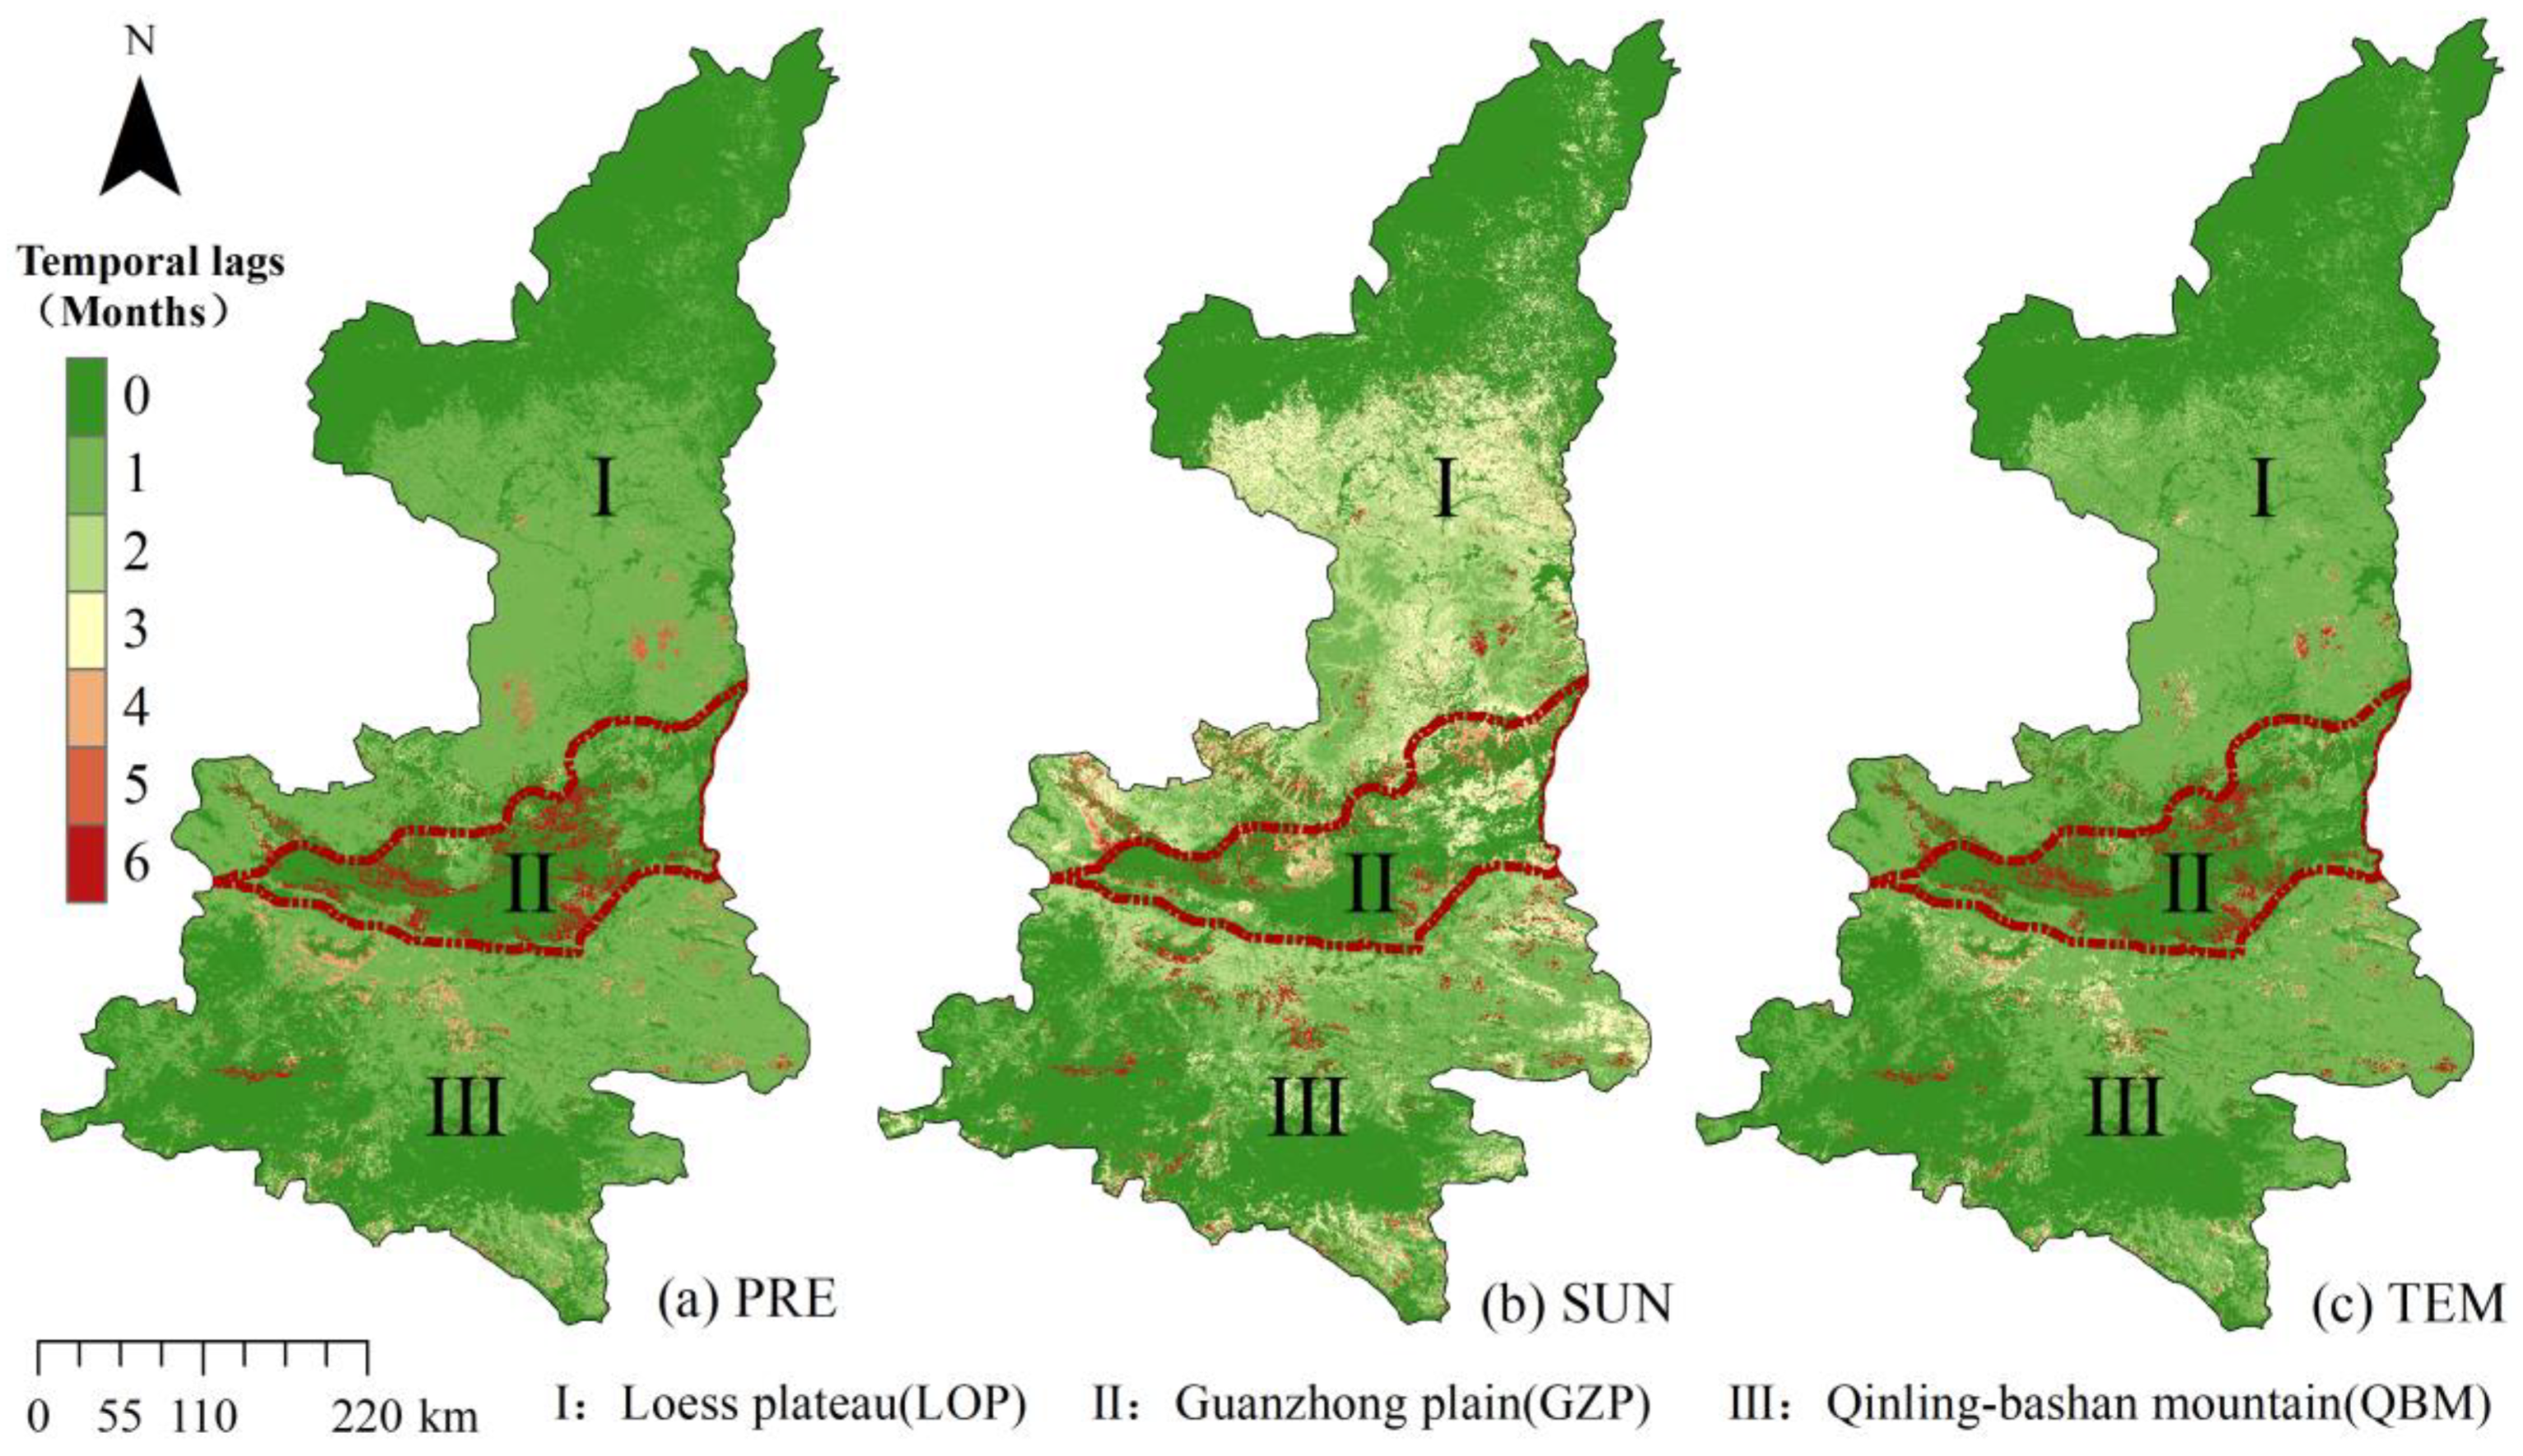
3.3. Response of FVC Variation to Climate Changes

As shown in Figure 6, the variation of FVC was significantly positively correlated with precipitation, sunshine duration, and temperature at the monthly and seasonal scales only but not at the annual scale. The correlations of FVC with TEM and PRE were significantly higher than that with SUN at the monthly and seasonal scales. The correlation between FVC and SUN was slightly higher than that between TEM and PRE on an annual scale. This indicates that there is a certain time lag between FVC and climate factors.
Most areas of Shaanxi Province received less than one month’s time-lag duration of FVC to PRE and TEM, and it was 1–3 months’ duration between FVC and SUN and spatially varied with latitude and topography (Figure 7). The area with no time-lag duration between FVC and PRE and TEM accounted for 49.62% of the total area. Additionally, a 5–6 months’ time-lag duration between FVC and PRE and between TEM and SUN was found at the center area of Shaanxi Province, especially in the conjunction area of the three subregions.

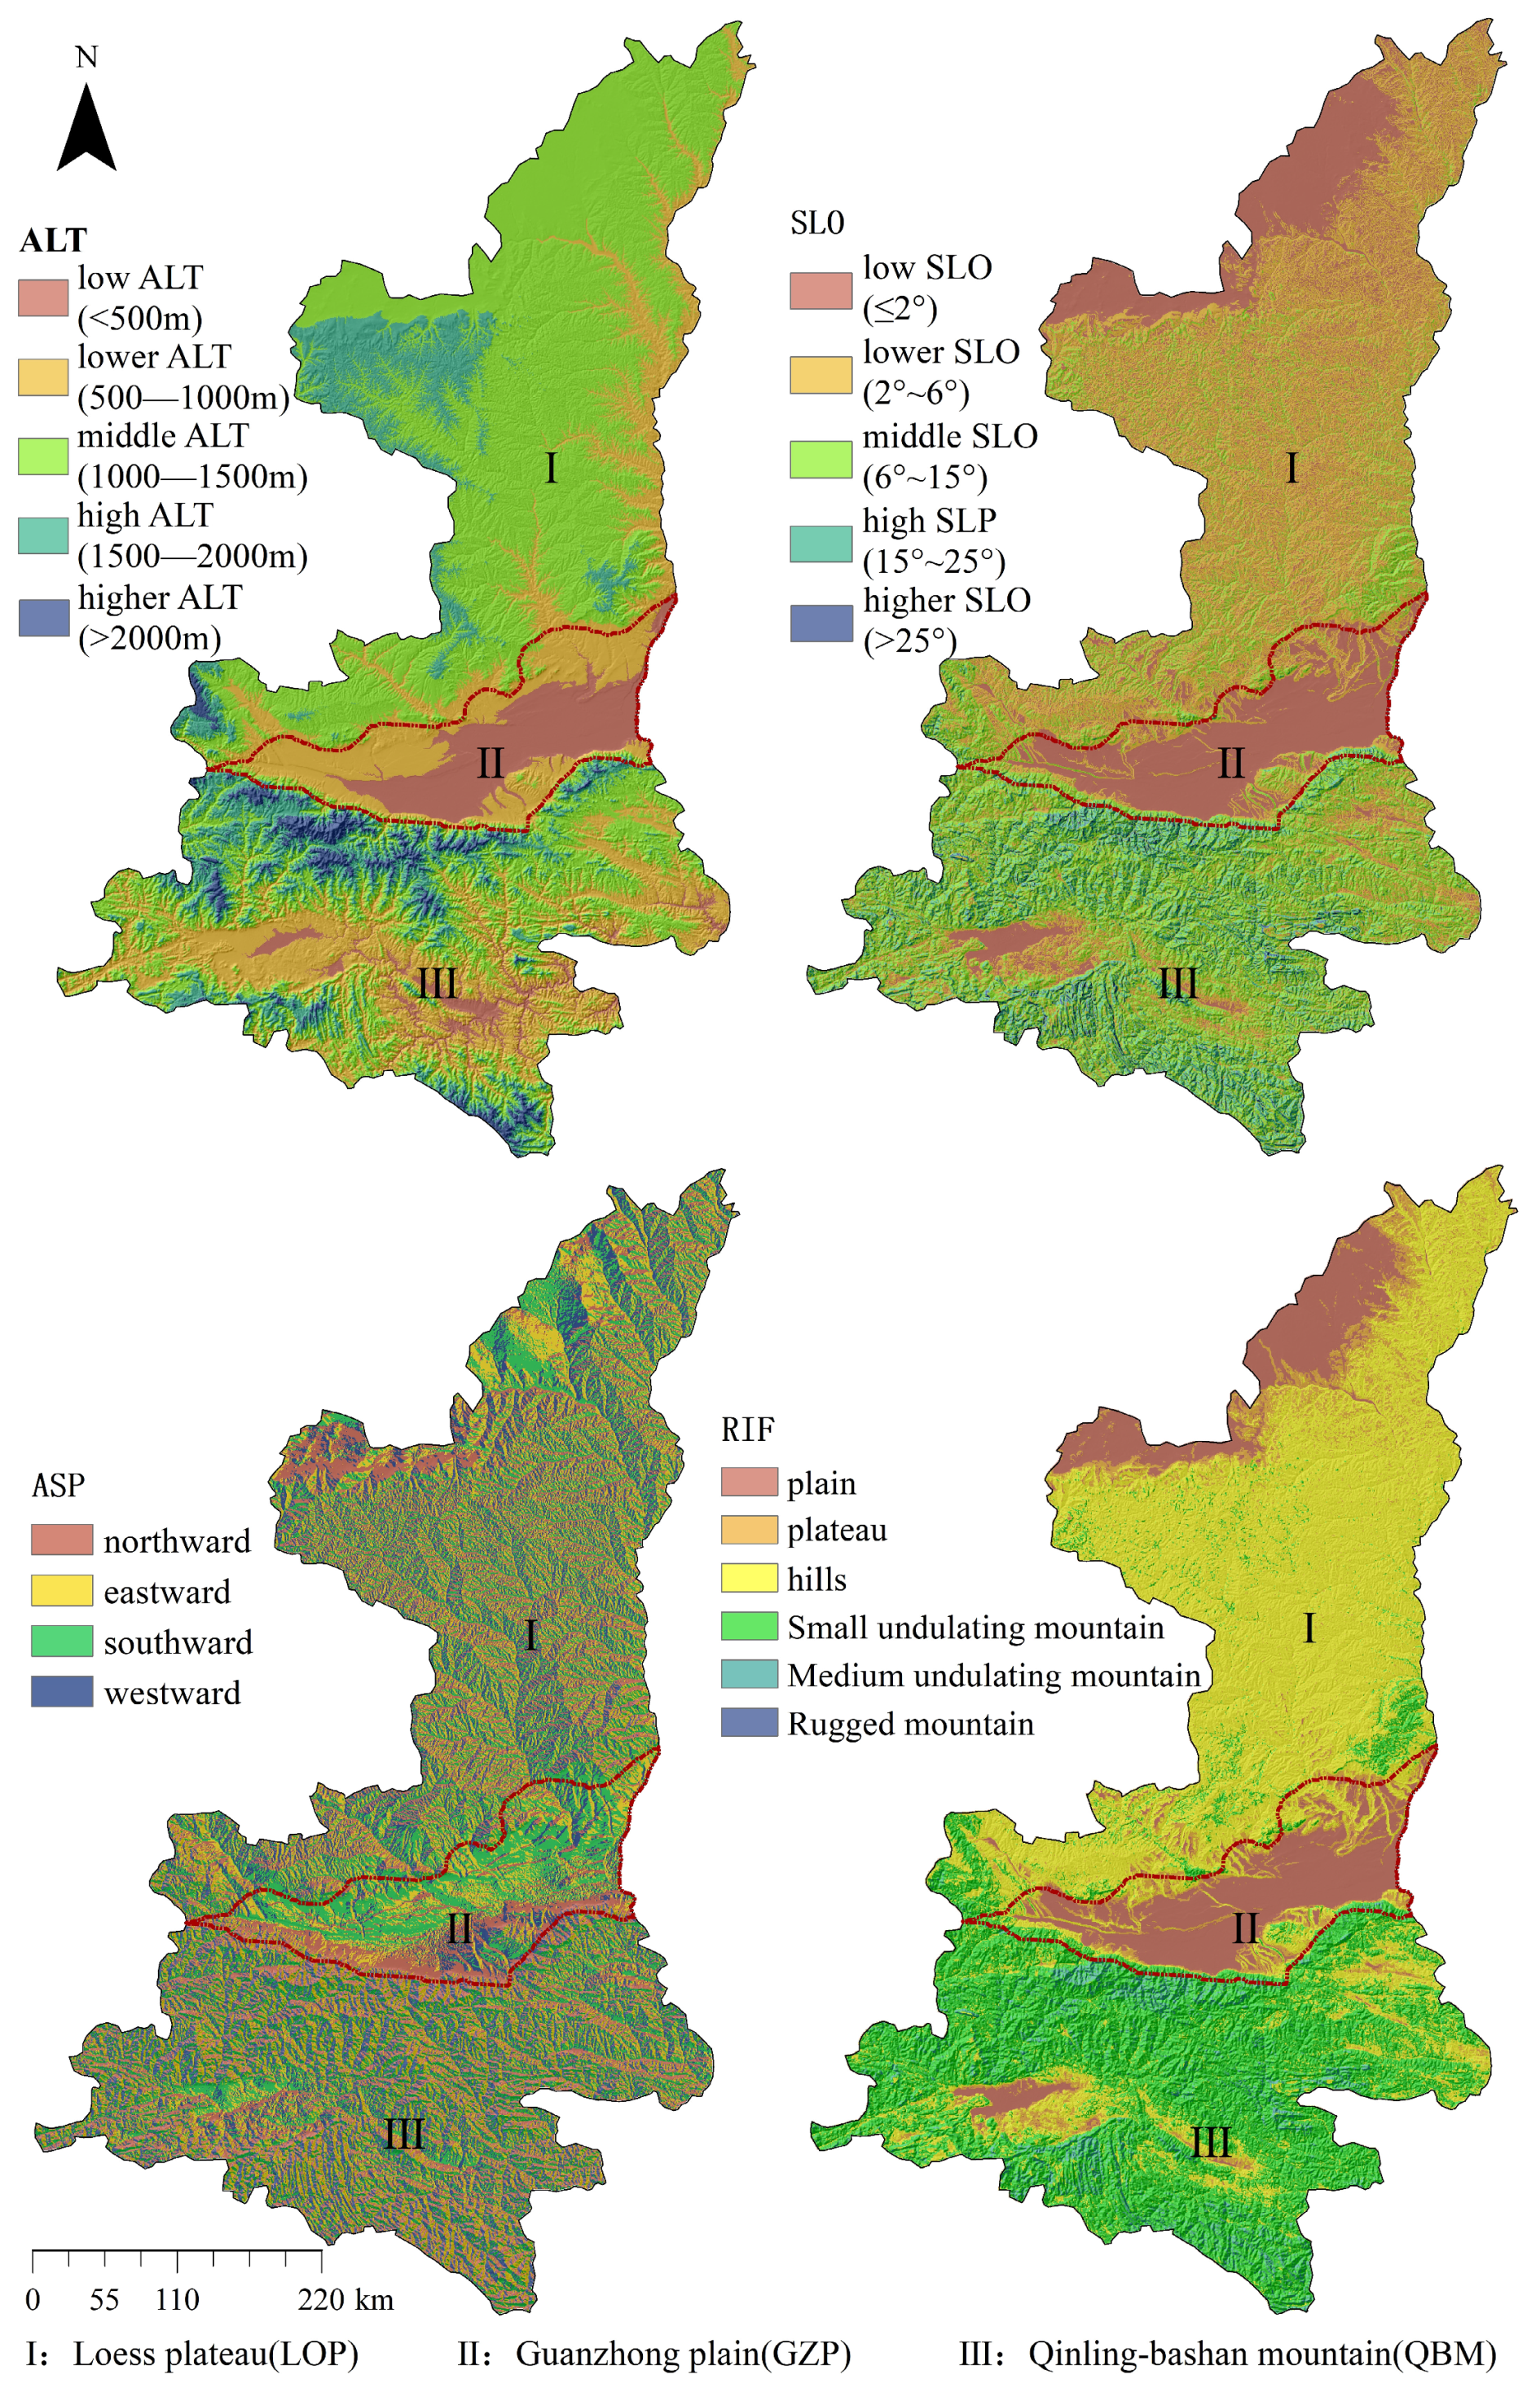
3.4. Response of FVC Variation to Topographic Factors

As shown in Table 2, the areas with significant increases in FVC were dominantly present at the lower ALT (500–1000 m) and middle ALT (1000–1500 m) (K > 1) from the perspective of elevation, the lower SLO (2°–6°), and in the hill landforms. Conversely, areas with low ALT (<500 m) and plateaus concentrated human activities, higher ALT (>2000 m), high SLO (15°–25°), higher SLO (>25°), and small-to-medium undulating mountain terrain showed a significant decrease in FVC. The distribution of FVC showed minimal variation across the four aspects.

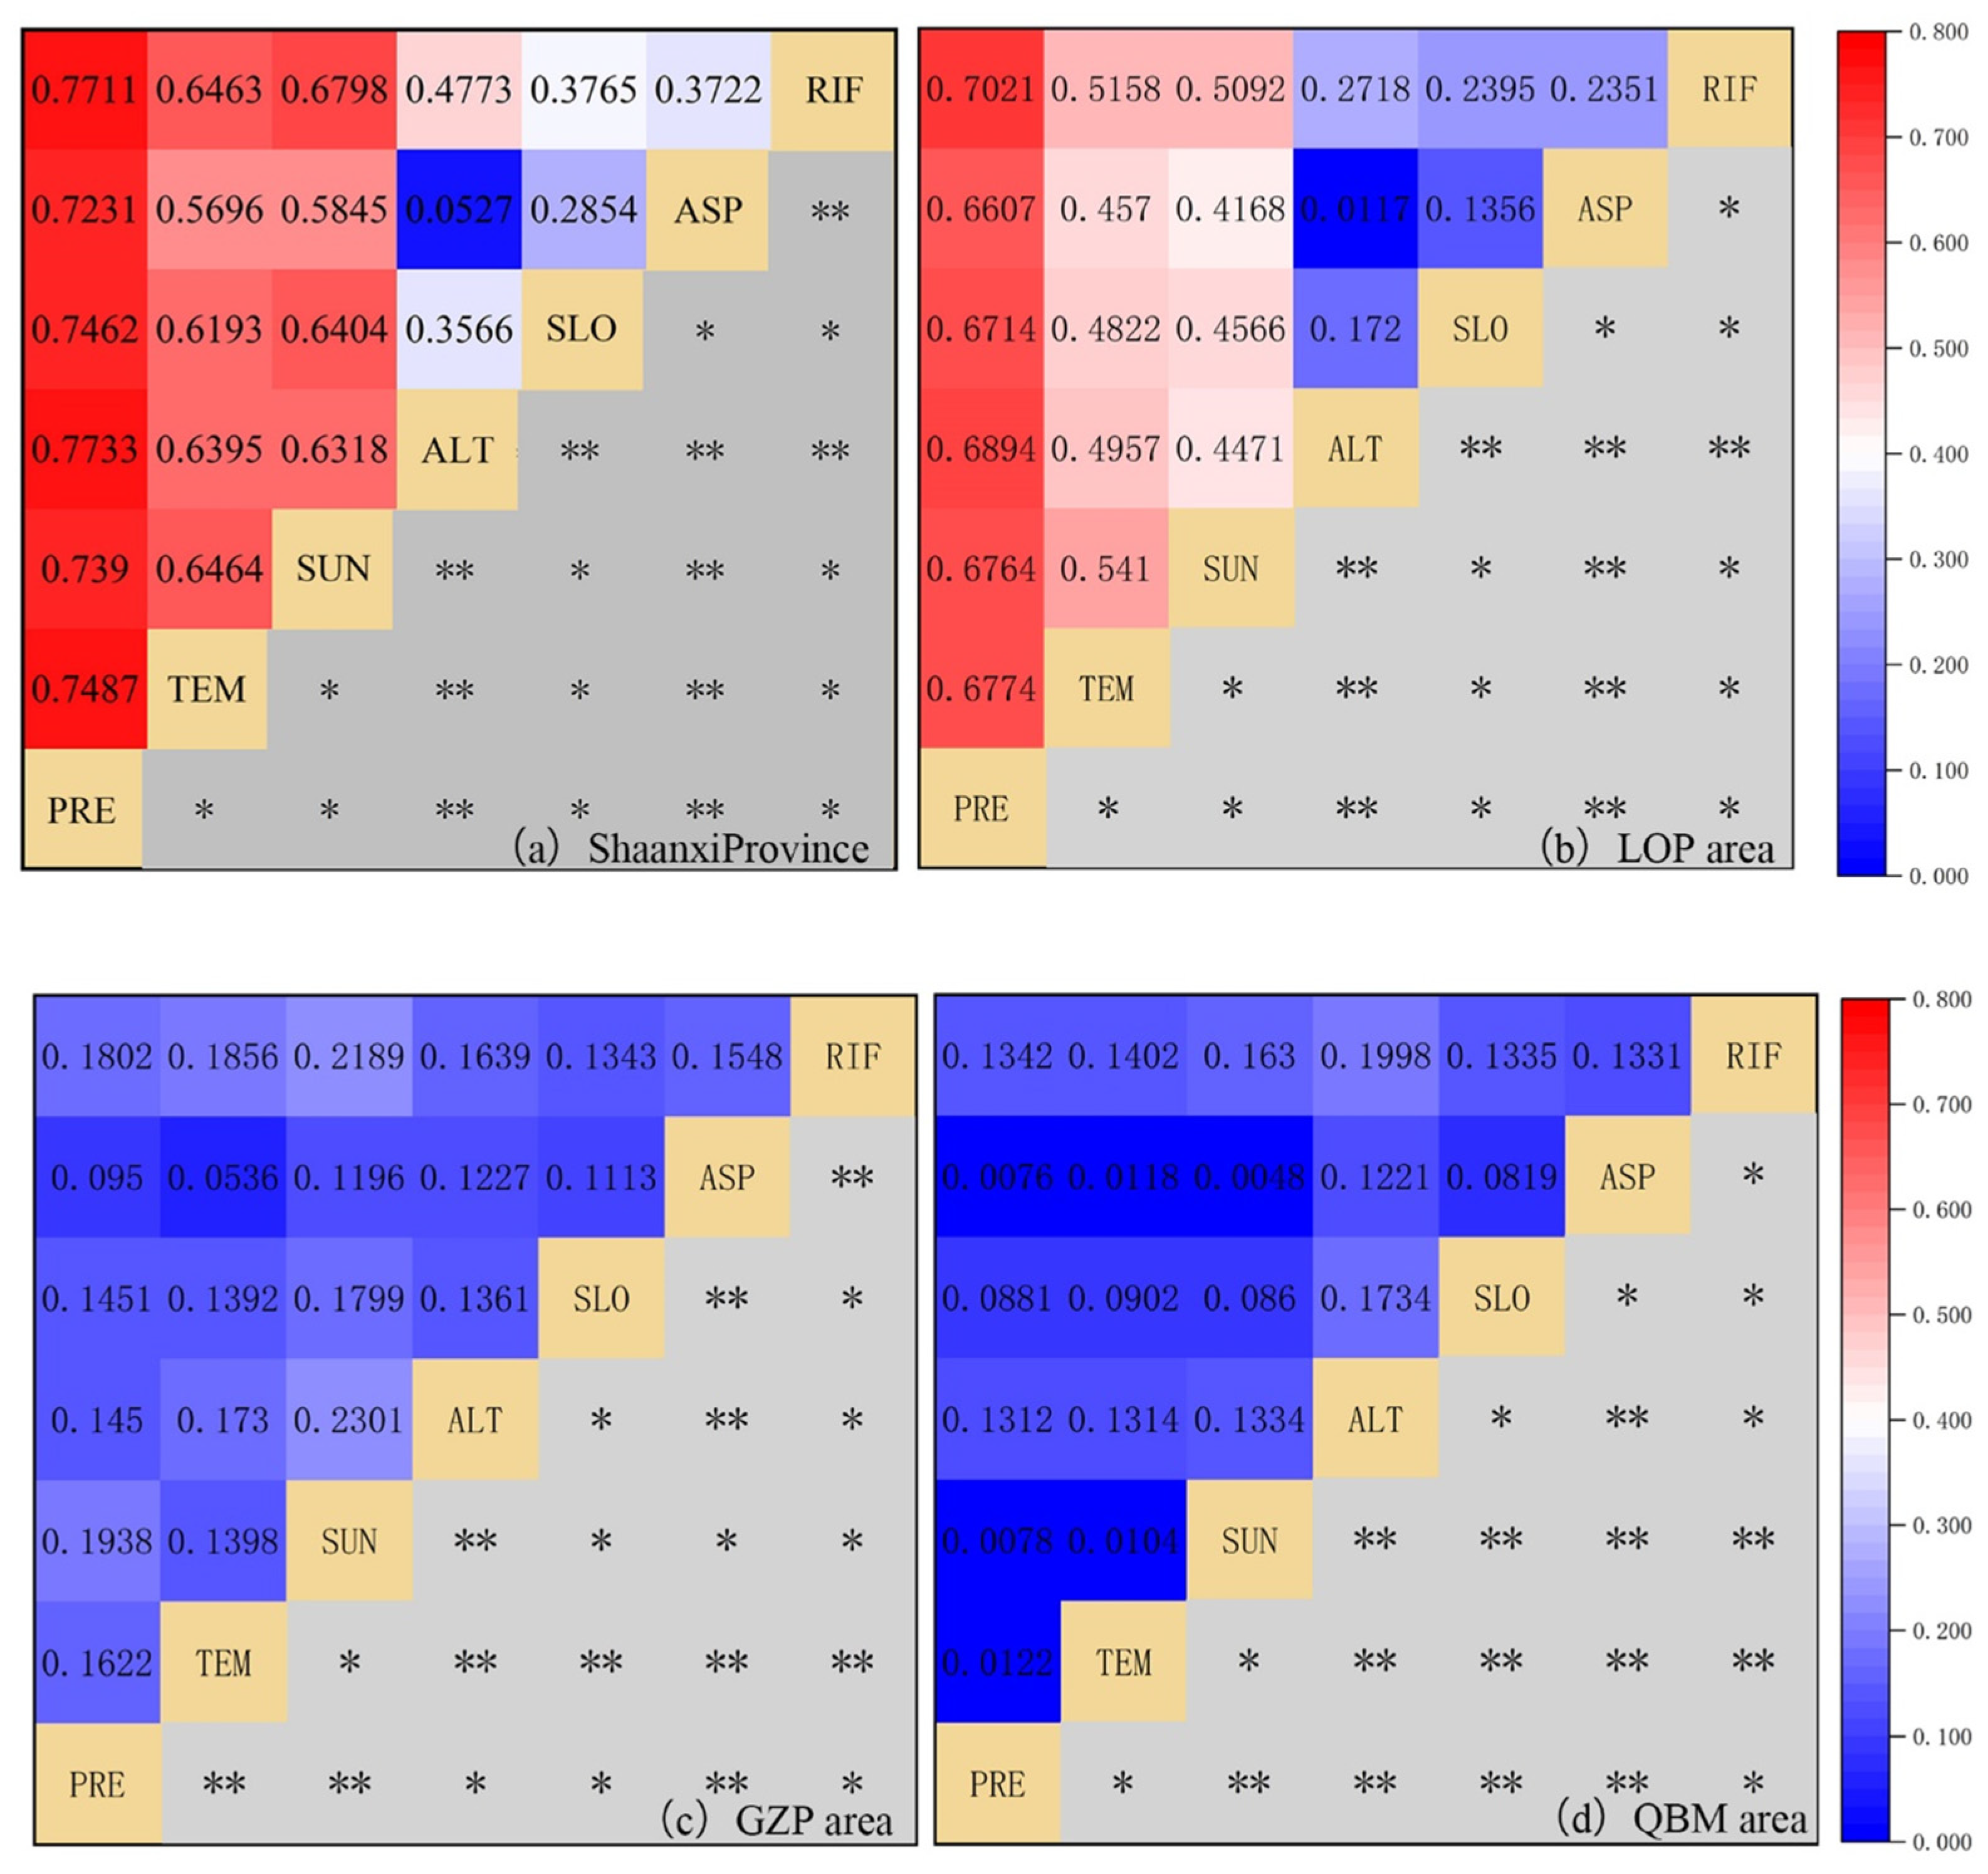
3.5. Correlation between FVC Variation and Climate and Topographical Factors

From a single-factor interpretation perspective, the climate factors of PRE, SUN, and TEM were dominant driving factors of FVC variation in Shaanxi Province with q values of 0.7197, 0.5812, and 0.5667 (Figure 8a), respectively. The topographical factors contributed less to FVC variation in Shaanxi Province than did climate factors, RIF and SLO received q values of 0.3698 and 0.2844, respectively, and few contributions were attributed to ALT and ASP. Climate factors of PRE, TEM, and SUN were dominant driving factors of FVC variation in the LOP area, with q values of 0.6556, 0.4525, and 0.4127 (Figure 8b), respectively. RIF and SUN were the dominant contributors of FVC variation in the GZP area, with q values of 0.1309 and 0.1062, respectively (Figure 8c). Topographic factors of RIF, ALT, and SLO were dominant driving factors of FVC variation in the QBM area, with q values of 0.1309, 0.1189, and 0.0797 (Figure 8d), respectively.
We used the ridge regression method to calculate and establish regression models between environmental factors with significant contribution values, and FVC were developed for Shaanxi Province as well as three subregions (Equations (8)–(11)). The explanation rates of the four models were 60.14%, 64.59%, 16.49%, and 51.51%, respectively, all of which reached a highly significant level (p < 0.01).
FVCShaanxi = 0.023 + 0.077RIF + 0.009TEM + 0.001PRE + 0.005SLO
FVCLOP = −1.181 + 0.039RIF + 0.035TEM + 0.002PRE + 0.003SLO
FVCGZP = 0.097 + 0.002RIF − 0.002TEM + 0.001PRE + 0.004SLO
FVCQBM = 0.512 + 0.083RIF − 0.010TEM + 0.001SLO
The geodetector tests indicated nonlinear and two-factor enhancement relationships between FVC changes and the climatic and geographical factors. Coupled interactions of any two factors were greater than those of single factors (Figure 9). Among the influencing factors, PRE received more than a 60% explanation rate and was 0.7733 of PRE∩ALT. Among the three subregions, the coupled interaction between the environmental factors and FVC variation was higher in the LOP area (with a q-value of 0.0117–0.7021) than in the GZP (with q-value of 0.0536–0.2301) and QBM (with a q-value of 0.0048–0.1998) areas, and PRE∩RIF, SUN∩ALT, and ALT∩SLO received the highest explanation rates in the three subregions, with q-values of 0.7021, 0.2301, and 0.1998, respectively.

4. Discussion

Vegetation growth and variation in coverage are controlled by several anthropogenic and natural factors [51]. Shaanxi Province spans about 860 km from south to north, is characterize by complex ground surface and climate differences that, and comprises three unique subregions (QBM, GZP and LOP), as well as three climate zones (northern subtropical zone, warm temperate zone, midtemperate zone from south to north). The higher FVC in the QBM area is associated with higher precipitation and temperature, as well as a mountain topography with a lower level of human activity [52]. Lower FVC in the LOP area can be due to the lower precipitation and temperature [53], whereas the heterogeneous FVC distribution in the GZP area can be attributed to the intensive activities such as crop production and building construction. From 2000 to 2018, 73.86% of the FVC area exhibited increasing coverage, and the LOP area showed the highest increase rate of 0.075 year−1. The LOP area was characterized by low rainfall, high evaporation, dense gullies, severe soil erosion, and intensive agricultural activities, which resulted in low vegetation coverage in this area. The increasing FVC in the LOP area verified the benefits of several vegetation projects such as GGP and the Three-North Shelterbelt Project in this area.
Besides the revegetation projects, the variation of FVC in Shaanxi Province is correlated with the characteristics of climate and topography [54,55]. Precipitation affects plant growth status by altering soil moisture content and humidity to influence vegetation water absorption and transpiration [56,57]. Temperature affects vegetation growth by influencing vegetation photosynthetic efficiency and water use efficiency [58]. From 2000 to 2018, the climate in Shaanxi Province changed to a warmer and more humid trend with decreasing sunshine duration (Figure 10). The time-lag duration between FVC and climate changes was correlated with the topographical characteristics: most of the research area received a 1–2 months’ time lag between FVC and PRE and TEM changes, whereas a 6 months’ time lag was detected in the conjunction area of GZP, QBM, and LOP. Previous studies have shown that soil temperature and soil moisture exhibit memory effects [59,60], and climate change can affect the temperature and water content of soil. This is likely the reason for the lagged response between vegetation and climate factors. As shown in Figure 1 and Figure 7, the conjunction area of the three subregions is characterized by the ALT steep drop with a lower ALT in GZP than in QBM and LOP. The steep ALT changes induce slow lateral infiltration of water and heat from higher to lower elevations, leading to a longer lag period. This finding has significant implications for the implementation of ecological measures.
Topographic factors indirectly contribute to FVC variation by altering the light, water, and heat flow, which in turn increase the heterogeneity of the spatial distribution of vegetation on a large scale [31,61]. Most agricultural production and residences were located in the low ALT area, where vegetation types and coverage changes were significantly affected by human activities, and this was consistent with slight FVC degradation in the GZP area. Inversely, a higher and stable FVC was detected in most areas of the QBM, with a higher ALT and only some human disturbances. In the northern LOP and most of the GZP area, the ground was flat with a lower slope that received slight FVC variation. However, in the central LOP area dominated by hills and terraces with 5–25° slopes, the GGP project was implemented, leading to a significant FVC improvement. Climatic changes and topographical characteristics were dominant influencing factors on FVC variation during the research period in Shaanxi Province. However, different controlling factors were also detected in the subregions. The climatic factors of PRE, TEM, and SUN were dominant controllers of FVC changes in the LOP area, while in the QBM area, the topographical factors of RIF, ALT, and SLO were dominant (Figure 8). The LOP area was characterized by a fragile ecosystem with lower rainfall and temperature compared with other subregions, as well as the steeper slopes and broken terrain. Therefore, soil and water conservation projects and revegetation were essential measures to consistently improve FVC in the LOP area. Conversely, the QBM area possesses superior climate conditions, with higher rainfall and heat supplement being beneficial to vegetation growth, but the large gullies, altitude difference, thin soil layer, and steep slopes restrict vegetation distribution. Reduced human disturbances and enhanced soil and water conservation will be helpful to maintaining high FVC in the QBM area.
There are some limitations in our research. The MODIS NDVI data used in this study is only available from 2000; however, our aim was to monitor the benefits of the GGP over the past 20 years, since its implementation in 1998. Therefore, our research could not reveal the spatial distribution characteristics and variation trend of FVC before 2000 and on a longer time scale beyond 2018. In the future, with the availability of more data collection plateaus and efficient mathematical methods, subsequent studies could consider adding more time-series data to further improve accuracy. In this study, only major climatic and topographic factors such as temperature, precipitation, sunshine duration, altitude, slope, aspect, and relief were selected, but geological background, soil texture, and plant species were not considered. However, this study does provide useful information on FVC and could be improved further by eliminating some of the limitations in future work.

5. Conclusions

This study monitored the variation of FVC and detected its response to climate change and topographic characteristics in Shaanxi Province from 2000 to 2018. We found that the FVC increased to 73.86% of the whole province, with a significant increase in the LOP area. FVC slightly increased in the QBM but showed a slight decrease in the GZP areas. These results demonstrate the effectiveness of vegetation restoration projects in controlling soil erosion in the research area, especially in the LOP subregion. The study showed that climate factors have a significant positive correlation with FVC on monthly and seasonal scales and are a direct driving factor of FVC variation. In most parts of Shaanxi Province, there was a time lag of 1–3 months in the response of FVC to climate change, while a lag of 6 months was observed in the conjunction area of the three subregions. The highest FVC increment was observed at an altitude of 500–1500 m, a slope of 2°–6°, and hilly landforms. On the regional scale, the dominant driving factor of FVC variation in LOP regions was related to climate, while in the QBM regions, topographic factors dominated. The implementation of the GGP is conducive to vegetation and ecological restoration, and exploring the environmental drivers of vegetation coverage variation can provide a basis for ensuring continuous improvement in vegetation coverage.

Author Contributions

Conceptualization, Y.L. and J.S.; Data curation, Y.L.; Formal analysis, Y.L.; Funding acquisition, Y.Q.; Investigation, Y.L.; Methodology, Y.L.; Project administration, and Y.Q.; Resources, and Y.Q.; Software, Y.L.; Supervision, X.W. and Y.Q.; Validation, Y.L., J.S., M.W. and J.G.; Visualization, Y.L. and J.S.; Writing—original draft, Y.L.; Writing—review and editing, X.W., M.K.S. and Y.Q. All authors have read and agreed to the published version of the manuscript.

Funding

The study was financially supported by the China National Science Fund Program (No. 42277310) and The Natural Science Basic Research Program of Shaanxi (No. 2022PT-28).

Informed Consent Statement

Informed consent was obtained from all subjects involved in the study.

Data Availability Statement

The MODIS MOD13Q1 data are from NASA EARTHDATA (https://www.earthdata.nasa.gov/, accessed on 12 July 2021). The meteorological data are from the China Meteorological Science Data Center (http://data.cma.cn/, accessed on 10 November 2021) and the DEM data from Geospatial Data Cloud (https://www.gscloud.cn/, accessed on 15 October 2021).

Conflicts of Interest

The authors declare no conflict of interest.

References

  1. Ding, Y.; Wang, F.; Mu, Q.; Sun, Y.; Cai, H.; Zhou, Z.; Xu, J.; Shi, H. Estimating land use/land cover change impacts on vegetation response to drought under ‘Grain for Green’in the Loess Plateau. Land Degrad. Dev. 2021, 32, 5083–5098. [Google Scholar] [CrossRef]
  2. Wei, H.; Xiang, Y.; Liu, Y.; Zhang, J. Effects of sod cultivation on soil nutrients in orchards across China: A meta-analysis. Soil Tillage Res. 2017, 169, 16–24. [Google Scholar] [CrossRef]
  3. Shao, H.; Sun, X.; Wang, H.; Zhang, X.; Xiang, Z.; Tan, R.; Chen, X.; Xian, W.; Qi, J. A method to the impact assessment of the returning grazing land to grassland project on regional eco-environmental vulnerability. Environ. Impact Assess. Rev. 2016, 56, 155–167. [Google Scholar] [CrossRef]
  4. Zhou, W.; An, Z. Suggestion on Implementation of the Gully and Land Management Program Which Is Equally as Important as the Grain for Green Project. Available online: https://www.cas.cn/xw/zjsd/201409/t20140919_4209929.shtml (accessed on 19 September 2014). (In Chinese).
  5. Feng, D.; Wang, J.; Fu, M.; Liu, G.; Zhang, M.; Tang, R. Spatiotemporal variation and influencing factors of vegetation cover in the ecologically fragile areas of China from 2000 to 2015: A case study in Shaanxi Province. Environ. Sci. Pollut. Res. 2019, 26, 28977–28992. [Google Scholar] [CrossRef]
  6. Li, R. The Sloping Land Conversion Program Has Greatly Improved Shaanxi Ecological Environment. Available online: http://lyj.shaanxi.gov.cn/zwxx/mtbd/201909/t20190919_2043856.html (accessed on 19 September 2019). (In Chinese)
  7. Guowei, P.; Linxin, S.; Qinke, Y.; Xiang, T. Vegetation Coverage in Different Landforms of Shaanxi Province: Spatial and Temporal Variations and Influencing Factors. J. Yangtze River Sci. Res. Inst. 2021, 38, 51–58+76, (Chinese with English Abstract). [Google Scholar]
  8. Cai, Y.; Zhang, F.; Duan, P.; Jim, C.Y.; Chan, N.W.; Shi, J.; Liu, C.; Wang, J.; Bahtebay, J.; Ma, X. Vegetation cover changes in China induced by ecological restoration-protection projects and land-use changes from 2000 to 2020. Catena 2022, 217, 106530. [Google Scholar] [CrossRef]
  9. Wang, G.; Innes, J.L.; Lei, J.; Dai, S.; Wu, S.W. China’s forestry reforms. Science 2007, 318, 1556–1557. [Google Scholar] [CrossRef] [PubMed]
  10. Normile, D. Getting at the roots of killer dust storms. Science 2007, 317, 314–316. [Google Scholar] [CrossRef]
  11. Zhengchao, R.; Huazhong, Z.; Hua, S.; Xiaoni, L. Climatic and topographical factors affecting the vegetative carbon stock of rangelands in arid and semiarid regions of China. J. Resour. Ecol. 2016, 7, 418–429. [Google Scholar] [CrossRef]
  12. Berry, S.L.; Farquhar, G.D.; Roderick, M.L. Co-evolution of climate, soil and vegetation. In Encyclopedia of Hydrological Sciences; John Wiley and Sons: Hoboken, NJ, USA, 2006. [Google Scholar]
  13. Wang, D.; Yue, D.; Zhou, Y.; Huo, F.; Bao, Q.; Li, K. Drought resistance of vegetation and its change characteristics before and after the implementation of the Grain for Green Program on the Loess Plateau, China. Remote Sens. 2022, 14, 5142. [Google Scholar] [CrossRef]
  14. Brandt, M.; Rasmussen, K.; Peñuelas, J.; Tian, F.; Schurgers, G.; Verger, A.; Mertz, O.; Palmer, J.R.; Fensholt, R. Human population growth offsets climate-driven increase in woody vegetation in sub-Saharan Africa. Nat. Ecol. Evol. 2017, 1, 0081. [Google Scholar] [CrossRef]
  15. Jiang, M.; He, Y.; Song, C.; Pan, Y.; Qiu, T.; Tian, S. Disaggregating climatic and anthropogenic influences on vegetation changes in Beijing-Tianjin-Hebei region of China. Sci. Total Environ. 2021, 786, 147574. [Google Scholar] [CrossRef]
  16. Jia, K.; Liang, S.; Wei, X.; Yao, Y.; Yang, L.; Zhang, X.; Liu, D. Validation of Global LAnd Surface Satellite (GLASS) fractional vegetation cover product from MODIS data in an agricultural region. Remote Sens. Lett. 2018, 9, 847–856. [Google Scholar] [CrossRef]
  17. Liang, S.; Wang, J. Fractional vegetation cover. In Advanced Remote Sensing; Academic Press: Cambridge, MA, USA, 2020. [Google Scholar]
  18. Xu, X.; Fan, W.; Tao, X. The spatial scaling effect of continuous canopy Leaves Area Index retrieved by remote sensing. Sci. China Ser. D 2009, 52, 393–401. [Google Scholar] [CrossRef]
  19. Gitelson, A.A.; Kaufman, Y.J.; Stark, R.; Rundquist, D. Novel algorithms for remote estimation of vegetation fraction. Remote Sens. Environ. 2002, 80, 76–87. [Google Scholar] [CrossRef]
  20. Qi, J.; Marsett, R.; Moran, M.; Goodrich, D.; Heilman, P.; Kerr, Y.; Dedieu, G.; Chehbouni, A.; Zhang, X. Spatial and temporal dynamics of vegetation in the San Pedro River basin area. Agric. For. Meteorol. 2000, 105, 55–68. [Google Scholar] [CrossRef]
  21. Jiang, Y.; Tang, R.; Jiang, X.; Li, Z.L.; Gao, C. Estimation of soil evaporation and vegetation transpiration using two trapezoidal models from MODIS data. J. Geophys. Res. Atmos. 2019, 124, 7647–7664. [Google Scholar] [CrossRef]
  22. Lu, A.; Tian, P.; Mu, X.; Zhao, G.; Feng, Q.; Guo, J.; Xu, W. Fuzzy Logic Modeling of Land Degradation in a Loess Plateau Watershed, China. Remote Sens. 2022, 14, 4779. [Google Scholar] [CrossRef]
  23. Shen, X.; Xue, Z.; Jiang, M.; Lu, X. Spatiotemporal change of vegetation coverage and its relationship with climate change in freshwater marshes of Northeast China. Wetlands 2019, 39, 429–439. [Google Scholar] [CrossRef]
  24. Liao, C.; Wang, J.; Shang, J.; Huang, X.; Liu, J.; Huffman, T. Sensitivity study of Radarsat-2 polarimetric SAR to crop height and fractional vegetation cover of corn and wheat. Int. J. Remote Sens. 2018, 39, 1475–1490. [Google Scholar] [CrossRef]
  25. Guo, Y.; Wei, H.; Lu, C.; Gao, B.; Gu, W. Predictions of potential geographical distribution and quality of Schisandra sphenanthera under climate change. PeerJ 2016, 4, e2554. [Google Scholar] [CrossRef] [PubMed]
  26. Sun, G.-Q.; Li, L.; Li, J.; Liu, C.; Wu, Y.-P.; Gao, S.; Wang, Z.; Feng, G.-L. Impacts of climate change on vegetation pattern: Mathematical modelling and data analysis. Phys. Life Rev. 2022, 43, 239–270. [Google Scholar] [CrossRef]
  27. Wang, B.; Xu, G.; Li, P.; Li, Z.; Zhang, Y.; Cheng, Y.; Jia, L.; Zhang, J. Vegetation dynamics and their relationships with climatic factors in the Qinling Mountains of China. Ecol. Indic. 2020, 108, 105719. [Google Scholar] [CrossRef]
  28. Yuan, J.; Xu, Y.; Xiang, J.; Wu, L.; Wang, D. Spatiotemporal variation of vegetation coverage and its associated influence factor analysis in the Yangtze River Delta, eastern China. Environ. Sci. Pollut. Res. 2019, 26, 32866–32879. [Google Scholar] [CrossRef] [PubMed]
  29. Guan, Q.; Yang, L.; Guan, W.; Wang, F.; Liu, Z.; Xu, C. Assessing vegetation response to climatic variations and human activities: Spatiotemporal NDVI variations in the Hexi Corridor and surrounding areas from 2000 to 2010. Theor. Appl. Climatol. 2019, 135, 1179–1193. [Google Scholar] [CrossRef]
  30. Wang, C.; Zhang, Z.; Zhang, J.; Tao, F.; Chen, Y.; Ding, H. The effect of terrain factors on rice production: A case study in Hunan Province. J. Geogr. Sci. 2019, 29, 287–305. [Google Scholar] [CrossRef]
  31. Ostendorf, B.; Reynolds, J.F. A model of arctic tundra vegetation derived from topographic gradients. Landsc. Ecol. 1998, 13, 187–201. [Google Scholar] [CrossRef]
  32. Hengkai, L.; Xiaosheng, L.; Bo, L.; Fashuai, L. Vegetation Coverage Variations and Correlation with Geomorphologic Factors in Red Soil Region: A Case in South Jiangxi Province. Sci. Geogr. Sin. 2014, 34, 103–109, (Chinese with English Abstract). [Google Scholar] [CrossRef]
  33. Duoduo, Y.; Yanhui, W. Temporal and spatial changes of vegetation coverage and its topographic differentiation in temperate continental semi-arid monsoon climate region. Acta Ecol. Sin. 2021, 41, 1158–1167, (Chinese with English Abstract). [Google Scholar]
  34. Liu, Y. In the Past 20 Years, the Grain for Green Project in Shaanxi Province Has Achieved Remarkable Results. Available online: https://www.cnr.cn/sxpd/sx/20190905/t20190905_524764317.shtml#:~:text=1999%E5%B9%B4%E8%87%B320,1000%E4%B8%87%E5%86%9C%E6%B0%91%E3%80%82 (accessed on 5 September 2019). (In Chinese).
  35. Sun, W.; Song, X.; Mu, X.; Gao, P.; Wang, F.; Zhao, G. Spatiotemporal vegetation cover variations associated with climate change and ecological restoration in the Loess Plateau. Agric. For. Meteorol. 2015, 209, 87–99. [Google Scholar] [CrossRef]
  36. Wang, Y.; Shao, M.a.; Liu, Z.; Warrington, D.N. Investigation of factors controlling the regional-scale distribution of dried soil layers under forestland on the Loess Plateau, China. Surv. Geophys. 2012, 33, 311–330. [Google Scholar] [CrossRef]
  37. Dengke, L.; Zhao, W. Changes of fractional vegetation coverage after returning farmland to forests and its response to climate in Shaanxi. Chin. J. Ecol. 2020, 39, 1–10, (Chinese with English Abstract). [Google Scholar] [CrossRef]
  38. Nie, T.; Dong, G.; Jiang, X.; Lei, Y. Spatio-temporal changes and driving forces of vegetation coverage on the loess plateau of Northern Shaanxi. Remote Sens. 2021, 13, 613. [Google Scholar] [CrossRef]
  39. Qian, C.; Shao, L.; Hou, X.; Zhang, B.; Chen, W.; Xia, X. Detection and attribution of vegetation greening trend across distinct local landscapes under China’s Grain to Green Program: A case study in Shaanxi Province. Catena 2019, 183, 104182. [Google Scholar] [CrossRef]
  40. Guihua, Y.; Tingbin, Z.; Yixuan, H.; Hong, Y.; Jingji, L.; Xiaojuan, B.; Dong, L. Applicability analysis of four spatial interpolation methods for air temperature. J. Chengdu Univ. Technol. (Sci. Technol. Ed.) 2020, 47, 115–128, (Chinese with English Abstract). [Google Scholar]
  41. Linrong, W.; Juanmin, W.; Haijun, L.; Xian, S. Spatiotemporal Variation of Solar Radiation and Sunshine Hours in Shaanxi Province. Bull. Soil Water Conserv. 2010, 30, 212–214, (Chinese with English Abstract). [Google Scholar] [CrossRef]
  42. Luan, X.; Meiying, D.; Feng, C. Comparison study of spatial interpolation methods based on hourly precipitation data from automatic weather stations. J. Meteorol. Environ. 2017, 33, 34–43, (Chinese with English Abstract). [Google Scholar]
  43. Fenfen, G.; Jianrong, F.; Dong, Y.; Xiang, G.; Kuifang, G.; Dingrong, Z. Remote sensing estimation of vegetation cover in Changdo County based on image dimidiate pixel model. Soil Water Conserv. China 2010, 30, 65–67, (Chinese with English Abstract). [Google Scholar] [CrossRef]
  44. Ali, R.; Kuriqi, A.; Abubaker, S.; Kisi, O. Long-term trends and seasonality detection of the observed flow in Yangtze River using Mann-Kendall and Sen’s innovative trend method. Water 2019, 11, 1855. [Google Scholar] [CrossRef]
  45. Dianlai, W.; Wenping, L.; Xinyuan, H. Trend analysis in vegetation cover in Beijing based on Sen+Mann-Kendall method. Comput. Eng. Appl. 2013, 49, 13–17, (Chinese with English Abstract). [Google Scholar]
  46. Xiaowei, T.; Kelin, W.; Yuemin, Y.; Chujie, L.; Yanfang, X.; Haitao, Z. Trends in vegetation and their responses to climate and topography in northwest Guangxi. Acta Ecol. Sin. 2014, 34, 3425–3434, (Chinese with English Abstract). [Google Scholar]
  47. Xuexiong, C.; Rutian, B.; Xiaojun, Z.; Weihong, H. Topographic Differentiation Effect on Vegetation Cover Change in Urban Districts of Taiyuan City. Bull. Soil Water Conserv. 2020, 40, 299–309, (Chinese with English Abstract). [Google Scholar] [CrossRef]
  48. Jufeng, W.; Liang, H.; Shaojuan, L.; Du, L.; Tao, H.; Qi, C.; Xiaoping, Z.; Baoyuan, L. Photosynthetic vegetation cover response to precipitation on the Inner Mongolian Steppe. Acta Ecol. Sin. 2020, 40, 5620–5629, (Chinese with English Abstract). [Google Scholar]
  49. Wang, J.F.; Li, X.H.; Christakos, G.; Liao, Y.L.; Zhang, T.; Gu, X.; Zheng, X.Y. Geographical detectors-based health risk assessment and its application in the neural tube defects study of the Heshun Region, China. Int. J. Geogr. Inf. Sci. 2010, 24, 107–127. [Google Scholar] [CrossRef]
  50. Song, Y.; Wang, J.; Ge, Y.; Xu, C. An optimal parameters-based geographical detector model enhances geographic characteristics of explanatory variables for spatial heterogeneity analysis: Cases with different types of spatial data. GISci. Remote Sens. 2020, 57, 593–610. [Google Scholar] [CrossRef]
  51. Yu, S.; Du, W.; Zhang, X.; Hong, Y.; Liu, Y.; Hong, M.; Chen, S. Spatiotemporal Changes in NDVI and Its Driving Factors in the Kherlen River Basin. Chin. Geogr. Sci. 2023, 33, 377–392. [Google Scholar] [CrossRef]
  52. Zhang, S.; Zhou, Y.; Yu, Y.; Li, F.; Zhang, R.; Li, W. Using the Geodetector Method to Characterize the Spatiotemporal Dynamics of Vegetation and Its Interaction with Environmental Factors in the Qinba Mountains, China. Remote Sens. 2022, 14, 5794. [Google Scholar] [CrossRef]
  53. Chen, S.; Zhang, Q.; Chen, Y.; Zhou, H.; Xiang, Y.; Liu, Z.; Hou, Y. Vegetation Change and Eco-Environmental Quality Evaluation in the Loess Plateau of China from 2000 to 2020. Remote Sens. 2023, 15, 424. [Google Scholar] [CrossRef]
  54. Liu, H.; Li, X.; Mao, F.; Zhang, M.; Zhu, D.e.; He, S.; Huang, Z.; Du, H. Spatiotemporal evolution of fractional vegetation cover and its response to climate change based on MODIS data in the subtropical region of China. Remote Sens. 2021, 13, 913. [Google Scholar] [CrossRef]
  55. He, J.; Shi, X.; Fu, Y. Identifying vegetation restoration effectiveness and driving factors on different micro-topographic types of hilly Loess Plateau: From the perspective of ecological resilience. J. Environ. Manag. 2021, 289, 112562. [Google Scholar] [CrossRef]
  56. Wang, X.; Wang, B.; Xu, X.; Liu, T.; Duan, Y.; Zhao, Y. Spatial and temporal variations in surface soil moisture and vegetation cover in the Loess Plateau from 2000 to 2015. Ecol. Indic. 2018, 95, 320–330. [Google Scholar] [CrossRef]
  57. Grantz, D. Plant response to atmospheric humidity. Plant Cell Environ. 1990, 13, 667–679. [Google Scholar] [CrossRef]
  58. Xie, B.; Qin, Z.; Wang, Y.; Chang, Q. Monitoring vegetation phenology and their response to climate change on Chinese Loess Plateau based on remote sensing. Trans. Chin. Soc. Agric. Eng. 2015, 31, 153–160. [Google Scholar]
  59. Zhang, H.; Yuan, N.; Ma, Z.; Huang, Y. Understanding the soil temperature variability at different depths: Effects of surface air temperature, snow cover, and the soil memory. Adv. Atmos. Sci. 2021, 38, 493–503. [Google Scholar] [CrossRef]
  60. He, Q.; Lu, H.; Yang, K. Soil moisture memory of land surface models utilized in major reanalyses differ significantly from SMAP observation. Earths Future 2023, 11, e2022E–e3215E. [Google Scholar] [CrossRef]
  61. Liwen, W.; Yaxing, W.; Zheng, N. Analysis of vegetation spatial and temporal variations in Qinghai province based on Remote Sensing. Environ. Sci. 2008, 29, 1754–1760, (Chinese with English Abstract). [Google Scholar] [CrossRef]
Figure 1. Elevation and topographical regions of Shaanxi Province.
Applsci 13 11532 g001
Figure 2. Spatial distribution of topographic factors.
Applsci 13 11532 g002
Figure 3. Interannual variation of vegetation index in Shaanxi Province.
Applsci 13 11532 g003
Figure 4. Spatial distribution of FVC in Shaanxi Province.
Applsci 13 11532 g004
Figure 5. Change trend of FVC in Shaanxi Province from 2000 to 2018.
Applsci 13 11532 g005
Figure 6. Correlation between FVC and climatic factors of Shaanxi Province.
Applsci 13 11532 g006
Figure 7. Time-lag duration of FVC variation with climate factors in Shaanxi Province.
Applsci 13 11532 g007
Figure 8. Detection of natural factors of FVC in Shaanxi Province according to q-statistics.
Applsci 13 11532 g008
Figure 9. Detection of interaction between influencing factors of FVC change in Shaanxi Province (*: two-factor enhancement, **: nonlinear enhancement).
Applsci 13 11532 g009
Figure 10. Interannual variation of climatic factors in Shaanxi Province from 2000 to 2018.
Applsci 13 11532 g010
Table 1. Change trends of FVC in Shaanxi Province from 2000 to 2018.
RegionSignificant Degradation (%)Slight Degradation (%)Slight Improvement (%)Significant Improvement (%)
Shaanxi Province18.297.8540.3533.51
LOP area12.342.9135.9548.80
GZP area29.9234.6424.2911.15
QBM area22.025.7250.6021.66
Note: LOP—Loess Plateau; GZP—Guanzhong Plain; QBM—Qinling–Bashan Mountain.
Table 2. Change trends of FVC under different topographic factors.
Topographic
Factor
ClassificationSignificant DegradationNon-
Significant Degradation
Non-
Significant Increase
Significant IncreaseTopographic
Factor
ClassificationSignificant DegradationNon-
Significant Degradation
Non-
Significant Increase
ALTLow ALT1.58 5.62 0.49 0.22 ASPNorthward0.97 1.08 0.99 1.01
Lower ALT0.99 1.08 0.98 1.01 Eastward1.01 0.93 1.00 1.01
Middle ALT0.69 0.27 1.03 1.30 Southward1.04 1.20 0.97 0.97
High ALT1.59 0.81 1.24 0.44 Westward0.96 0.77 1.04 1.03
Higher ALT2.50 2.44 0.85 0.02 RIFPlain1.21 3.90 0.85 0.27
SLOLow SLO1.09 2.57 0.86 0.75 Plateau1.13 1.63 0.85 0.91
Lower SLO0.85 0.52 0.87 1.34 Hill0.78 0.43 0.83 1.43
Middle SLO1.03 0.44 1.18 0.90 Small undulating mountain1.11 0.45 1.26 0.74
High SLO1.25 0.57 1.32 0.58 Medium undulating mountain1.40 0.69 1.31 0.48
Higher SLO1.37 0.65 1.34 0.47 Rugged mountain0.91 0.00 1.65 0.50
Note: low ALT (<500 m), lower ALT (500–1000 m), middle ALT (1000–1500 m), high ALT (1500–2000 m), higher ALT (>2000 m), low SLO (≤2°), lower SLO (2°–6°), middle SLO (6°–15°), high SLO (15°–25°), higher SLO (>25°).
Disclaimer/Publisher’s Note: The statements, opinions and data contained in all publications are solely those of the individual author(s) and contributor(s) and not of MDPI and/or the editor(s). MDPI and/or the editor(s) disclaim responsibility for any injury to people or property resulting from any ideas, methods, instructions or products referred to in the content.

