Featured Application
Generalise the use of a simple and validated tool to combat overweight and obesity in childhood health systems.
Abstract
The purpose of this observational study with a convenience sample is to validate a simple measurement of the mid-upper arm circumference to establish the screening points using the mid-upper arm circumference tape (MUAC) for childhood overweight and obesity between 9 and 12 years of age, or from 4th grade to 6th grade. Prior to the screening study, a pilot validation study of the MUAC tape measure versus anthropometric standard tape was carried out. The total sample for the screening cut-offs was 360 school students. The results obtained had a predictive value according to the evaluation of the area under the curve of 0.96 and overweight detection cut-off points were established at 23.3 and 22.4 cm for 4th grade, 23.6 and 22.7 cm for 5th grade and 24.6 and 23.8 cm for 6th grade for boys and girls, respectively. The cut-off points for the detection of obesity were established at 25.2 and 23.9 cm for 4th grade, 26.4 and 25.1 cm for 5th grade, and 27.7 and 26.4 cm for 6th grade boys and girls, respectively. The cut-off values of the MUAC are different not only between the sexes, but also increase as age or the specific course increases.
1. Introduction
In the 21st century, overweight and obesity are common epidemics in developed countries and are increasingly present in developing countries and during economic transition [1,2]. Currently, according to the World Health Organization (WHO), more than 41 million children under 5 years are overweight or have obesity, and more than 340 million people between 5 and 19 years have overweight or obesity worldwide. Their incidence and prevalence have increased worldwide [3]. The drastic rise in the prevalence of childhood overweight and obesity in recent years is due to significant changes in lifestyle and eating habits in childhood, as well as the promotion of an obesogenic environment that promotes and further encourages the incidence of obesity [4].
Regarding their relationship with other diseases, overweight and obesity in adulthood constitute a chronic pathology that presents greater comorbidity when it is more severe; in relation to the distribution of body fat, the risk of developing diseases such as type 2 diabetes mellitus, insulin resistance, dyslipidaemia, respiratory deficit, hypoventilation, arterial hypertension, coronary heart disease and hyperuricaemia, among others increases [5]. However, since childhood is a stage of growth and development at all levels, more nutrients are needed in relation to the adult stage. There may be a risk of malnutrition due to deficiency or excess when there is restricted access to food, or if a food pattern based on ultra-processed products is followed. An increase in overweight or obesity is a risk factor for cardiovascular diseases. There are several proven associations between markers of cardiovascular risk, such as biochemical parameters (triglycerides, total cholesterol, insulin, glucose), as well as diet and physical activity. There exist studies on childhood overweight and obesity, however, more consistent information on cardiometabolic and inflammatory risks during this period is required [6,7].
Among markers of cardiovascular risk, diet represents a significant modifiable risk factor for the etiopathogenesis of obesity. Dietary patterns, as well as habits of life, can be assumed to be both a risk or a beneficial factor at the cardiovascular level and are strictly related to obesity and other cardiovascular diseases [8,9].
During childhood and adolescence, there are many physiological and psychological changes that influence behaviour and lifestyle in the medium and long term. In childhood, variations in the development and growth between girls and boys appear. Thus, in boys, the age range in which the outbreak of puberty growth begins is from 10 to 15 years, however, in girls, it goes from 8 years to 13 years. These outbreaks of pubertal growth differ in the speed of growth as well as in body size and weight gain [10]. There are also significant differences in growth physiology regarding body composition development with respect to sex. A study carried out with 888 children aged 6 years from the UK and India showed significant differences with respect to the percentage of body fat; boys had 4.5% more body fat than girls [11,12].
A study carried out in the Spanish state in 2015, the ALADINO study (Alimentación, Actividad Física, Desarrollo Infantil y Obesidad—Food, Physical Activity, Child development and Obesity) [13], was carried out with 10,899 boys and girls aged between 6 and 9 years, with the aim of measuring childhood overweight and obesity in school, and a high percentage of overweight and obesity was observed in the age group prior to the sample of this study. The overweight percentages observed in boys and girls between 6 and 9 years old were 22.4 vs. 23.9%; that is a difference of 1.5% attributable to sex for the same age group. However, for obesity, values of 20.4 vs. 15.8% with respect to sex were observed. These data show a difference of 5.2% in obesity with respect to sex for the same age group. There were significant differences in overweight and obesity values with respect to sex; girls were 1.5% more overweight than boys, but in terms of obesity, boys were 4.6% more obese than their female counterparts.
At the national level, in Spain, the ALADINO study carried out in 2019 [14,15,16] showed the prevalence of overweight and obesity in children aged 6–9 years across 276 schools in all Spanish regions with a sample of 16,665 schoolchildren. The prevalence of overweight was 23.3% (21.9% in boys and 24.7% in girls) and the prevalence of obesity was 17.3% (19.4% in boys and 15.0% in girls) using WHO growth standards for infants [17].
Thanks to these two studies, ALADINO 2015 and ALADINO 2019, it can be observed that there is a stable trend in the prevalence of overweight, and a minimal but visible decrease in the prevalence of childhood obesity in Spain.
Given the introductory background, there is the possibility of sex differences in the factors that determine the occurrence of overweight or obesity in childhood. In this regard, it seems that the stage of sexual development coincides with a generalised weight gain in both boys and girls, with differences between them. Other important factors are food, obesogenic environments, eating patterns and physical activity. In this sense, it would be advisable to have a tool to determine whether overweight or obesity is sensitive to these factors.
Regarding the screening for childhood overweight and obesity, body mass index percentiles linked to cut-off points for children can be used as a reference. These percentiles vary according to age and sex; reference tables for height-for-age and weight-for-age in boys and girls were obtained from the WHO [18].
In this context, a new effective tool for detecting childhood overweight and obesity would be desirable. The mid-upper arm circumference (MUAC) tape would provide the simplicity of a single measurement, which is quick, inexpensive, without the need for additional devices and usable in any setting, such as school, primary care or community, so that early nutritional strategies can be implemented to tackle this pandemic. Arm circumference measured with MUAC tape can be used as a useful tool for nutritional screening for overweight and obesity, both in childhood and adolescence. The tape is plasticised, used on the right arm, which is naked and relaxed, and the measurement is taken at the midpoint between the tip of acromion and olecranon processes [19,20,21,22].
2. Materials and Methods
Weight (Tanita BC-601 monitor, 0.1 kg), height (SECA stadiometer, 1 mm) and arm circumference measurements (SECA tape measure, 1 mm, and Doctors Without Borders designed MUAC tape, 1 mm) were taken according to the standards of the International Society for the Advancement of Kineanthropometry (ISAK) [11,12,23]. An observational study with a convenience sample was undertaken. The validation study of the MUAC measure was developed with a sample of 108 students described by age and sex. A total screening study sample of 360 students (175 boys and 185 girls) consisted of the 4th (n = 135, 67 boys and 68 girls, aged between 9 and 10 years), 5th (n = 118, 58 boys and 60 girls, aged between 10 and 11) and 6th (n = 107, 50 boys and 57 girls, aged between 11 and 12 years) courses. The analysis data were divided into courses by age and sex and the data were analysed to identify optimal cut-off values compared to the WHO height/weight percentile for each course [23,24,25]. All samples were collected in 5 schools in 3 towns in the province of Valencia (Spain). For the recruitment of students, voluntary participation in the study was requested through the school council in 5 public primary schools. Parents were subsequently notified in writing of their voluntary participation. Informed consent to the study was sent and requested to be signed to participate. Finally, 80% of the total sample of invited students participated. The measurements were taken during the 2018/2019 school year in the schools during school hours, starting with their first-class hour and before brunch time. To carry out the anthropometric measurements, the participants were divided into pairs of students and a supervising schoolteacher. The measurements were carried out in an empty and spacious auxiliary classroom.
As for data analysis, the qualitative variable “sex” and the quantitative variables “age”, “height”, “weight” and brachial perimeter measured with “tape measure” and “MUAC tape” were obtained and the samples were categorised by courses (4th, 5th, and 6th) and sex.
The statistical software R-Studio 4.2.0 was used to calculate the mean value, standard deviation and range of values for quantitative variables and for sex and grade.
To establish the correlation between the quantitative statistical values of “tape measure” and “MUAC tape”, as well as the correlation between tape measure, MUAC tape measure and final percentile in relation to height percentile and weight percentile by age, sex, height and weight, the statistical software R-Studio was also used.
From the quantitative variables, the variables “cut-off percentile”, “weight percentile”, “body mass index” and “total percentiles” were obtained for each age. Specific percentiles were calculated individually for each age, sex, weight and height using the web application “Percentile Calculator” of the “Initiative for the Humanization of Childbirth and Lactation Care (IHAN)”, UNICEF Spain, based on the WHO Child Growth Standards [26].
The study protocol was approved by the Human Research Ethics Committee (H1513343373169) of the University of Valencia and all procedures were conducted according to the Declaration of Helsinki. In addition, both the principals of the participating schools and the legal guardians of the participating students were informed. This research did not receive any specific grants from funding agencies in the public, commercial or non-profit sectors.
3. Results
About the validation of the MUAC tape measurement against metric measurement, based on the Pearson correlation function, a positive correlation (R = 0.87) was observed between the tape measure and the MUAC tape, giving validity to rapid screening using the MUAC. After the significant result of the correlation between the brachial perimeter and MUAC tape measurement, in the studied sample, established as excess of weight, overweight or obesity are values of 22.5 cm MUAC in 9-year-olds, 23.0 cm MUAC in 10-year-olds with 1 case below “false negative” and 2 cases above “false positive”, 23.7 cm MUAC in 11-year-olds with 1 case above “false positive” and 24.4 cm MUAC for 12-year-olds.
Once the MUAC has been validated as a tool for the screening of childhood overweight and obesity in the pilot study, it is possible to establish the correlation between the quantitative statistical values of the brachial perimeter and MUAC tape measurement.
In order to use the MUAC tape for overweight and obesity screening in children, there is a problem with this measurement when schoolchildren have a very large arm circumference, as an MUAC measurement cannot be obtained because the tape is not long enough. However, this only occurred in two cases in the sample. However, as seen in the pilot study, the arm circumference measurement with the tape measure and the MUAC tape had a high correlation (R = 0.96); therefore, the arm circumference measurement with the tape measure can be used to estimate the MUAC tape value for these children as the prediction of the statistical model is significant and very good. After obtaining the results of the data from the pilot study conducted earlier, these results can be seen in Figure 1. Then, the following two models are considered:
M1: MUAC = β0 + β1 P. Brachial
M2: MUAC = β0 + β1 P. Brachial + β2 + β3 + β4 + β5
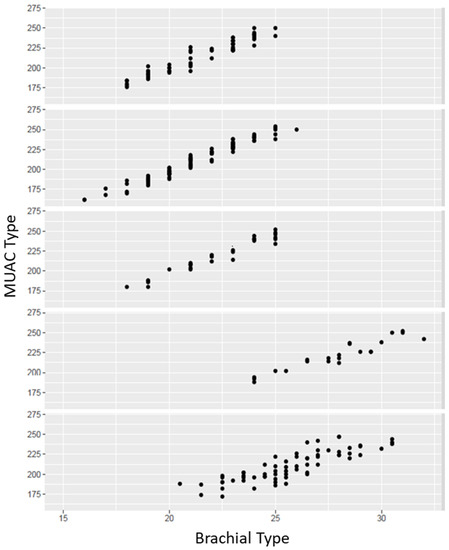
Figure 1.
Positive correlation of the brachial perimeter measured by metric tape and MUAC tape in the 5 different schools analysed. MUAC Type: millimetres. Brachial Type: centimetres.
Figure 1 shows the brachial perimeter values at school. These charts may be the key to reinforce the use of the MUAC tape, as it seems to be a more reliable and consistent measure.
Normal distribution of the total sample of participants for each school was analysed, and a positive and progressive confirmation is observed in the results of the sample.
It is observed that the brachial perimeter measurements by the MUAC tape are more consistent than those made with the tape measure due to the dispersion of the points, since we observe that the distribution of the first independent measurements by school follow a positive linear relationship, while those on the tape measure do not. Assuming the linear relationship between both variables and the bias observed between schools, the imputation of the MUAC for children who do not have values is shown in Figure 2.
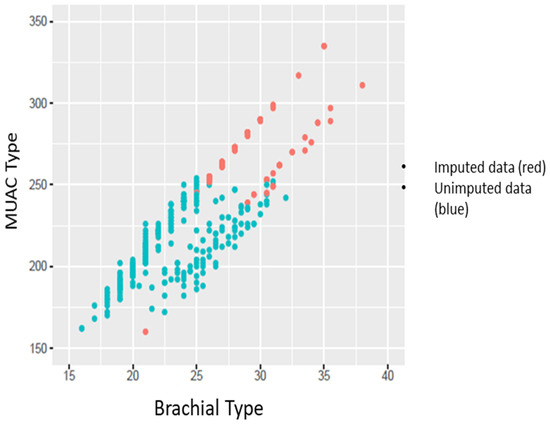
Figure 2.
Imputation of MUAC values for children that could not be measured in the sample. MUAC Type: millimetres. Brachial Type: centimetres.
Assuming the linear relationship between the two variables and the error observed between the schools, it is observed that the variation between the schools is significant; therefore, they are considered for the imputation of the missing MUAC values.
The final objective is to define cut-off points for children with overweight or obesity by using MUAC tape. However, it is possible to see in Figure 3 that MUAC tape values for children not only vary between sexes but also increase as they age. In the case of this study, we do not have all the ages of the students, but if the courses they are doing are known, the age of the students can be deduced.
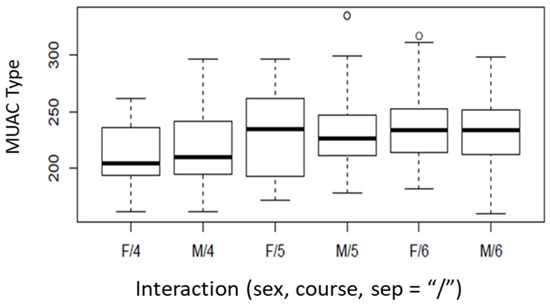
Figure 3.
Boxplots of MUAC type by sex and course. “a”—“1” “b”—“2” “b”—“2”. F = female; M = male; 4: 4th course (9–10 years); 5: 5th course (10–11 years); 6: 6th course (11–12 years). “a” and “b” show statistically significant differences between sexes; “1” and “2” show statistically significant differences between courses. MUAC Type: millimetres.
Figure 3 shows how the 4th grade sample exhibits statistically significant differences (“a”—“1”) with respect to the 5th and 6th grade sample, but there are no statistically significant differences between the latter two (“b”—“2”).
Then, sex and course are determining factors in establishing the MUAC tape values for overweight and obesity in children. To define the cut-off levels of overweight and obesity by using the MUAC tape, first, the criteria for students with obesity are established. It is assumed that there is a probability p that a child has obesity depending on the MUAC, sex and course with a generalised linear model (GLM) if p follows a Bernoulli distribution, mathematically:
p|MUAC, sex, course ~ Be(p)
Assuming that they are linearly related:
where the male variable is worth 1 if the student to analyse is male and 0 if they are female. The 5th and 6th variables are also binary, taking the value 1 if the student belongs to one of both courses and 0 in another case. Table 1 summarizes the estimation of the model coefficients (β) and their significance. It can be observed that there is sufficient statistical evidence to believe that obesity is different between sexes (as β2 = 1.485 > 1 with p value < 0.05). In addition, as children progress through courses, the MUAC cut-off point at which a child is considered to be obese increases and age is a significant factor in distinguishing cut-off points.
logit(p) = β0 + β1 MUAC + β2 Male + β35 5thCourse + β36 6thCourse

Table 1.
Generalised linear model summary for obesity.
It is interesting to analyse whether the coefficients that compare the probabilities of being obese are also different between the 5th and 6th courses. Our hypothesis is as follows:
In particular, the p value resulting from this test is 0.002. There are significant differences in the cut-off points between the 5th and 6th courses. In establishing the MUAC cut-off points to define obesity, the value of MUAC tape is taken such that the probability that this student has no obesity is 50%. Table 2 shows the different MUAC cut-off points for childhood obesity according to course and sex.
Table 2.
Middle upper arm circumference cut-off values for schoolchildren with obesity per course and sex.
In this case, the specificity of the model was 81.5% and the sensitivity was 97.3%. The total number of students with childhood obesity was 53 students with a 4.2% error to classify them as non-obese and a 15.1% error to classify them as obese.
The same procedure used to define the cut-off points for the MUAC tape above which a child can be considered in a state of overweight is repeated below.
In this case, a small detail should be considered, as the target now defines a cut-off point that, if a child exceeds a certain MUAC tape value, it should be considered as an overweight status; therefore, obese children are assumed to be overweight, as they are above the overweight level and are consistent in the statistical model.
As before, by defining the same statistical model it is assumed that a child has a probability p of being considered overweight depending on the MUAC tape value, sex and course. Table 3 summarises the GLM for describing the probability that a student is overweight. Again, there is sufficient statistical evidence to indicate that the MUAC level at which a boy is overweight is different from that of a girl, lowering the cut-off for boys (as β2 = 1.023 > 1 with p value < 0.05).
Table 3.
Generalised linear model summary for overweight.
However, it is interesting to analyse whether the coefficients comparing the odds of being overweight are also different between the 5th and 6th courses. Our hypothesis is as follows:
In particular, the p value resulting from this test is 0.0132735. Then, there are significant differences in the cut-off points between the 5th and 6th courses for overweight individuals. Table 4 shows the cut-off points to consider for children in a state of overweight depending on the course they are in.
Table 4.
Cut-off values for mid-upper arm circumference for children with obesity by course and sex.
In this case, the specificity of the model was 86.4% and the sensitivity 91.5%. The total number of overweight students was 127 students, with a 10.3% error to classify them as not overweight and a 14.2% error to classify them as overweight.
4. Discussion
During the childhood period, there are differences in growth and development between boys and girls, where many changes are observed. Boys begin the onset of puberty from 10 to 15 years of age, while girls begin from 8 to 13 years of age [27], but without evidence of any statistically significant difference in body fat percentage between the sexes [28].
There is much scientific evidence that suggests that there are differences in many respects, in relation to a school, about sex. Focusing attention on the possible differentiation of the value of MUAC on sex for the screening for overweight and obesity in childhood, the MUAC measure has generally been used as a tool for screening for undernutrition [29,30], however, there are studies that suggest the possibility of using MUAC for the follow-up of overweight and obesity in public health, as well as a tool to identify children and adolescents who require further evaluation or management of comorbidities [19,31,32].
On the other hand, another study conducted on 5358 Turkish students aged 6 to 17 years, with the same objective as the present study, gave an MUAC value between 19.9 cm and 22.6 cm according to age and sex for students aged 10 to 12 years. This study obtained a value of the area under the curve of (AUC) 0.91, i.e., a high predictive value [31]. In the present study the AUC value was 0.96. This difference may be due to the larger age range studied in the Turkish sample; although this value is above AUC = 85, it has a high predictive value. Comparing the results of the two studies, it is observed that the MUAC cut-off values obtained in the Turkish study do not coincide with the values obtained in this study, although it is observed that the cut-off values are different depending on the age and sex of the participants.
In another comparative study carried out with Argentinean and American samples, 22,736 schoolchildren aged 4 to 14 years were analysed, measuring the brachial perimeter with a tape measure and MUAC tape, and differences were observed between them based on these anthropometric measurements. Thus, in this study, it was observed that the MUAC value increased progressively with age, as in our study [33].
Studies have also been undertaken in which the measurement of brachial perimeter is used as a screening tool for excess body fat in the paediatric population, where significant differences also appear between values by sex and course [34,35]. Moreover, it is possible to carry out a nutritional diagnosis beyond the classic parameters such as BMI, intake, albumin, etc., and focus a new vision for a more precise, simple and rapid nutritional diagnosis that can be more sensitive and specific for nutritional diagnoses [18].
The overweight model has a sensitivity of 91.5% and a specificity of 86.4%, and the obesity model has a sensitivity of 97.3% and a specificity of 81.5%. Both values are very high, which means that these models are highly suitable for screening for childhood overweight and obesity. Furthermore, the AUC exceeded 0.85 for overweight (AUC = 0.96) and obesity (AUC = 0.96), and the statistical model was significant and very good. However, future studies with a representative sample would be necessary for a final validation.
As for the limitations of the study, the main ones were the adherence of the participating schools and families. As far as schools are concerned, it takes a lot of time and repeated efforts to get the school to participate in the study. Another point to be taken into account is the adherence of the students, as some did not give informed consent to the parents, or the loss of documents was observed, or the parents ignored it completely.
5. Conclusions
The present study found the MUAC tape to be a useful and simple tool with potential in anthropometric screening for childhood overweight and obesity. The MUAC measure was validated against the tape measure and the MUAC cut-off values for both overweight and obesity were defined as different between sexes, while an increase in the MUAC tape value was also observed as the course of the schoolchildren increased.
Author Contributions
Conceptualization, V.F. and J.B.; methodology, D.L.-M., J.B. and M.J.E.; software, V.F. and J.R.; validation, D.L.-M., J.B. and M.J.E.; formal analysis, V.F., J.R. and M.J.E.; investigation, V.F. and J.B; data curation, V.F., J.R. and D.L.-M.; writing—original draft preparation, V.F. and J.R.; writing—review and editing, D.L.-M., J.B. and M.J.E.; supervision, M.J.E. All authors have read and agreed to the published version of the manuscript.
Funding
This research received no external funding.
Institutional Review Board Statement
The study was conducted in accordance with the Declaration of Helsinki and approved by the Institutional Ethics Committee University of Valencia (H1513343373169).
Informed Consent Statement
Informed consent was obtained from all subjects involved in the study.
Data Availability Statement
The data presented in this study are available on request from the corresponding author. The data are not publicly available due to ethical or privacy issues.
Conflicts of Interest
The authors declare no conflict of interest.
References
- World Health Organization; United Nations International Children’s Emergency Fund. Global Strategy for Infant and Young Child Feeding. In Proceedings of the Fifty-fourth World Health Assembly, Geneva, Switzerland, 14–22 May 2001; WHO: Geneva, Switzerland, 2003; p. 8. [Google Scholar]
- Dokova, K.G.; Pancheva, R.Z.; Usheva, N.V.; Haralanova, G.A.; Nikolova, S.P.; Kostadinova, T.I.; Rodrigues, C.E.; Singh, J.; Illner, A.-K.; Aleksandrova, K. Nutrition transition in europe: East-west dimensions in the last 30 Years—A narrative review. Front. Nutr. 2022, 9, 919112. [Google Scholar] [CrossRef]
- World Health Organization. Obesity and Overweight; WHO: Geneva, Switzerland, 2021; Available online: https://www.who.int/news-room/fact-sheets/detail/obesity-andoverweight#:~:text=%2Fm2).-,Adults,than%20or%20equal%20to%2030 (accessed on 14 July 2022).
- Tully, L.; Arthurs, N.; Wyse, C.; Browne, S.; Case, L.; McCrea, L.; O’Connell, J.M.; O’Gorman, C.S.; Smith, S.M.; Walsh, A.; et al. Guidelines for treating child and adolescent obesity: A systematic review. Front. Nutr. 2022, 9, 902865. [Google Scholar] [CrossRef] [PubMed]
- Lim CY, S.; Foo, Y.W.; Tok CL, X.; Lim, Y.Y.; Loke, K.Y.; Lee, Y.S.; Ng, N.B.H. Screening for metabolic complications of childhood and adolescent obesity: A scoping review of national and international guidelines. Obes. Rev. 2022, 23, e13513. [Google Scholar] [CrossRef] [PubMed]
- Balagopal, P.B.; de Ferranti, S.D.; Cook, S.; Daniels, S.R.; Gidding, S.S.; Hayman, L.L.; McCrindle, B.W.; Mietus-Snyder, M.L.; Steinberger, J.; American Heart Association Committee on Atherosclerosis Hypertension and Obesity in Youth of the Council on Cardiovascular Disease in the Young; et al. Nontraditional Risk Factors and Biomarkers for Cardiovascular Disease: Mechanistic, Research, and Clinical Considerations for Youth. Circulation 2011, 123, 2749–2769. [Google Scholar] [CrossRef]
- Singh, M.; Benencia, F. Inflammatory processes in obesity: Focus on endothelial dysfunction and the role of adipokines as inflammatory mediators. Int. Rev. Immunol. 2019, 38, 157–171. [Google Scholar] [CrossRef]
- Tam, C.S.; Clément, K.; Baur, L.A.; Tordjman, J. Obesity and low-grade inflammation: A pediatric perspective. Obes. Rev. 2010, 11, 118–126. [Google Scholar] [CrossRef]
- Karatzi, K.; Moschonis, G.; Barouti, A.A.; Lionis, C.; Chrousos, G.P.; Manios, Y. Dietary patterns and breakfast consumption in relation to insulin resistance in children. The Healthy Growth Study. Public Health Nutr. 2014, 17, 2790–2797. [Google Scholar] [CrossRef] [PubMed]
- Chapman, S. Child and adolescent obesity. Paediatrics and Child Health (United Kingdom). Paediatr. Child Health 2021, 31, 322–329. [Google Scholar] [CrossRef]
- World Health Organization. Height-for-Age (5–19 Years); WHO: Geneva, Switzerland, 2022; Available online: https://www.who.int/toolkits/growth-reference-data-for-5to19-years/indicators/height-for-age (accessed on 19 October 2022).
- World Health Organization. Weight-for-Age (5–10 Years); WHO: Geneva, Switzerland, 2022; Available online: https://www.who.int/toolkits/growth-reference-data-for-5to19-years/indicators/weight-for-age-5to10-years (accessed on 19 October 2022).
- Spanish Agency for Food Safety and Nutrition. ALADINO Study 2015: Surveillance Study of Growth, Nutrition, Physical Activity, Child Development and Obesity in Spain 2015; Ministry of Health, Social Services and Equality: Madrid, Spain, 2016.
- Spanish Agency for Food Safety and Nutrition. Surveillance of Childhood Obesity; AESAN: Bangkok, Thailand, 2022. Available online: https://www.aesan.gob.es/AECOSAN/web/nutricion/subseccion/vigilancia_obesidad_infantil.htm (accessed on 27 October 2022).
- García-Solano, M.; Gutiérrez-González, E.; López-Sobaler, A.M.; Saavedra, M.Á.D.R.; de Dios, T.R.; Villar-Villalba, C.; Yusta-Boyo, M.J.; Pérez-Farinós, N. Weight status in the 6 to 9 year-old school population in Spain: Results of the ALADINO 2015 study. Ann. Pediatr. 2021, 94, 366–376. [Google Scholar] [CrossRef]
- Spanish Agency for Food Safety and Nutrition. ALADINO Study 2019: Study on Diet, Physical Activity, Child Development and Obesity in Spain 2019; Ministry of Health, Social Services and Equality: Madrid, Spain, 2020.
- Spanish Agency for Food Safety and Nutrition. Summary of the Report of the Fourth Round (2015–2017) of the WHO European Childhood Obesity Surveillance Initiative (COSI) of the WHO Regional Office for Europe; Spanish Agency for Food Safety and Nutrition: Madrid, Spain, 2021.
- De Onis, M.; Onyango, A.W.; Borghi, E.; Siyam, A.; Nishida, C.; Siekmann, J. Development of a WHO growth reference for school-aged children and adolescents. Bull. World Health Organ. 2007, 85, 660–667. [Google Scholar] [CrossRef]
- Mazicioǧlu, M.M.; Hatipoǧlu, N.; Öztürk, A.; Çiçek, B.; Üstünbaş, H.B.; Kurtoǧlu, S. Waist Circumference and Mid−Upper Arm Circumference in Evaluation of Obesity in Children Aged Between 6 and 17 Years. J. Clin. Res. Pediatr. Endocrinol. 2010, 2, 144. [Google Scholar] [CrossRef] [PubMed]
- Çiçek, B.; Öztürk, A.; Mazicioğlu, M.; Inanç, N.; Kurtoğlu, S. A novel cut-off for abdominal obesity derived from various an-thropometric indices to predict body composition: Arm fat area. Turk. J. Med. Sci. 2010, 40, 515–523. [Google Scholar] [CrossRef]
- Paulo de Souza, L.; Prado, S.; Fabiane, C.; Marlon, K.; de Lucena, R.; Paraguassú, P. Methods for obtaining reliable anthropometric data. Caderno de Graduação—Ciências Biológicas e da Saúde—UNIT—SERGIPE 2015, 3, 87–100. [Google Scholar]
- World Health Organization. European Childhood Obesity Surveillance Initiative (COSI) Report on the Fourth Round of Data Collection, 2015–2017; WHO Regional Office for Europe: Copenhagen, Denmark, 2021. [Google Scholar]
- The International Society for the Advancement of Kinanthropometry. ISAK. 2022. Available online: https://www.isak.global/ (accessed on 17 September 2022).
- Sánchez, E.; Carrascosa, A.; Fernández, J.M.; Ferrández, A.; López, D.; López, J.P. Spanish growth studies: Current situation, usefulness and recommendations for use. Ann. Pediatr. 2011, 74, 193.e1–193.e16. [Google Scholar] [CrossRef]
- López, D. Assessment of Growth and Nutritional Status in Adolescent Children and Young Adults in the Autonomous Community of Madrid; Universidad Autónoma de Madrid: Madrid, Spain, 2011. [Google Scholar]
- Initiative for the Humanisation of Birth and Breastfeeding Care (IHAN). Percentile Calculator. IHAN. 2017. Available online: https://www.ihan.es/calculadora-de-percentiles/ (accessed on 19 October 2022).
- De Arruda, G.A.; Fernandes, R.A.; Christófaro, D.G.D.; De Oliveira, A.R. Relationship between chronological age, indicators of body adiposity and physical fitness related to children’s health. Revista Andaluza de Medicina del Deporte 2013, 6, 24–29. [Google Scholar] [CrossRef]
- Lakshmi, S.; Metcalf, B.; Joglekar, C.; Yajnik, C.S.; Fall, C.H.; Wilkin, T.J. Differences in body composition and metabolic status between white UK and Asian Indian children (EarlyBird 24 and the Pune Maternal Nutrition Study). Pediatr. Obes. 2012, 7, 347–354. [Google Scholar] [CrossRef]
- Ferreira, M.; Bohme, M.T.S.; Bohme, M.T.S. Sex differences in child motor performance: Influence of body adiposity. São Paulo Mag. Phys. Educ. 1998, 12, 181–192. [Google Scholar]
- Aguayo, V.M.; Aneja, S.; Badgaiyan, N.; Singh, K. Mid upper-arm circumference is an effective tool to identify infants and young children with severe acute malnutrition in India. Public Health Nutr. 2015, 18, 3244–3248. [Google Scholar] [CrossRef]
- Grellety, E.; Krause, L.K.; Shams Eldin, M.; Porten, K.; Isanaka, S. Comparison of weight-for-height and mid-upper arm circumference (MUAC) in a therapeutic feeding program in South Sudan: Is MUAC alone a sufficient criterion for admission of children at high risk of mortality? Public Health Nutr. 2015, 18, 2575–2581. [Google Scholar] [CrossRef]
- Michaels, R.E.; Pearce, J.M. 3-D printing open-source click-MUAC bands for identification of malnutrition. Public Health Nutr. 2017, 20, 2063–2066. [Google Scholar] [CrossRef]
- Oyhenart, E.E.; Castro, L.E.; Garraza, M.; Cesani, M.F.; Torres, M.F.; Quintero, F.A.; Dahinten, S.L.; Alfaro, E.; Bejarano, I.F.; Carrillo, R.Á. Comparative study of the percentiles of arm circumference, muscle area, and fat area in Argentine and American children aged 4–14 years. Nutr. Hosp. 2019, 36, 552–562. [Google Scholar] [CrossRef] [PubMed]
- Dalmau, J.; Alonso, M.; Gómez, L.; Martínez, C.; Sierra, C.; Suárez, L. Childhood Obesity. Recommendations of the Nutrition Committee of the Spanish Association of Pediatrics. Part II. Diagnosis. Comorbidities. Treatment. Ann. Pediatr. 2007, 66, 294–304. [Google Scholar] [CrossRef] [PubMed]
- García, J.M.; García, C.; Bellido, V.; Bellido, D. New approach to nutrition. Assessment of the patient’s nutritional status: Function and body composition. Nutr. Hosp. 2018, 35, 1–14. [Google Scholar] [CrossRef]


Disclaimer/Publisher’s Note: The statements, opinions and data contained in all publications are solely those of the individual author(s) and contributor(s) and not of MDPI and/or the editor(s). MDPI and/or the editor(s) disclaim responsibility for any injury to people or property resulting from any ideas, methods, instructions or products referred to in the content. |
© 2023 by the authors. Licensee MDPI, Basel, Switzerland. This article is an open access article distributed under the terms and conditions of the Creative Commons Attribution (CC BY) license (https://creativecommons.org/licenses/by/4.0/).