Abstract
This document presents the modeling of load profile consumption for Low-and-Moderate-Income (LMI) communities in the Caribbean Islands, as well as an assessment of the solar-rooftop energy potential. In this work, real data, together with synthetic and electricity bill data, were collected to validate and improve the load profile models. The solar-rooftop energy potential was obtained through a National Renewable Energy Laboratory (NREL) software called the PVWatts calculator, and mathematical analysis. The analysis of rooftop solar energy potential was conducted to enable the minimum size of solar power systems to fit the energy demand in the community. The results obtained allow estimation of the capacity of the energy system for each house or an entire community.
1. Introduction
1.1. General Context
The world of electrical energy production is turning to the renewable resources sector to mitigate pollution due to the use of fossil fuels in energy production [1]. In addition, it is well known that fossil fuel is a finite resource; so, those sectors that use fossil fuels must start looking for an alternative. Among the best alternatives, the production of energy based on renewable resources such as solar, wind, tidal, thermal, and others has been presented, taking the solar resource as one of the most prominent. In this sense, multiple investigations have been developed around the generation of electrical energy based on solar resources. These studies are focused on many aspects, such as the increase in the efficiency of photovoltaic (PV) panels, the integration of the PVs with other distributed resources such as batteries, and studies related to the solar energy potential of the roofs of houses [2].
The studies of the solar energy potential are a great contribution to specialized literature, since they provide the methodology to analyze solar power potential in any location. This aspect is directly linked to social development, since, in most cases, low-and-middle-income communities are the ones that have the most difficulties in accessing a quality, reliable, and constant energy resource [3,4]. In this part of the study, the use of renewable resources already has great environmental, economic, and technical benefits within the framework of the electricity market. However, in order to implement an electric power generation system based on PV panels, it is necessary to carry out a prior assessment of the solar energy potential and to estimate the energy consumption through the load profiles associated with the community under test. This makes it possible to manage the use of energy resources, such as batteries or the main power grid.
The study of the load profiles of a community allows estimating a more precise and reliable energy system, which will generate economic and technical benefits for the community where the resource will be installed. A well-estimated energy system must consider that the installed power corresponds to the demand. In addition, the system must be able to supply the demand of loads at any time of the day if it is going to depend only on the PV and batteries. It must also be able to operate together with the main power grid when required (this would be in cases of energy sales and support in the network for stabilization, among others).
All the research around load profiles [2,4,5,6] and energy management have a great impact on the academic research world, as well as in relation to energy markets, energy management, and social development programs, among others. One of the most cited studies is the modeling of household load profiles and the analysis of the solar energy potential of the roofs. This joint evaluation makes it possible to analyze the development potential of some locations with low or medium resources. To develop this work, it was necessary to apply different technological tools, software, and electronic devices that allowed us to obtain all the necessary data to develop this document. One of the software implemented was PVWatts, which allows analyzing the solar potential of the rooftop of some residences from some measurements of the roof estimated by satellite. Another tool used to obtain real data from load profiles were smart meters; the data collected by smart meters were very useful to model loads and especially to validate the load profile methodology proposed in this document. The software used to model the load profiles was Matlab Simulink, which allowed us to build a model of the load profiles.
1.2. Contributions and Scope
This work proposes the use of two concepts: the generation and consumption of energy. The generation of energy in this case by PV panels is analyzed from the point of view of solar energy potential. The energy consumption is represented by a new way to model load profiles based on real data and random load behavior. Therefore, this paper presents the development of different types of load profiles focused on households. It also contributes to the evaluation of the solar energy potential in a community to analyze the energy balance.
1.3. Paper Organization
The document is organized as follows: Section 2 presents the community under analysis, as well as the solar energy potential and the tools used to determinate the solar energy potential in the community, followed by an analysis of energy production. Then, Section 3 presents the load profiles model and assessment of the solar-rooftop energy potential, showing the data and parameters considered to evaluate the solar energy potential and validate the proposed load profiles model. The development of the method, and the results, are presented in Section 4; further, the real data used to compare the obtained results is presented in this section. Section 5 presents the validation load profiles model. This section presents, through graphics, the results obtained as a form of visual validation. Finally, Section 6, the conclusions derived from the work and future works are presented.
2. Test Community
The analysis of load profiles and energy demand starts by knowing the community under test, since this will allow having a reference of load profiles and energy demand.
2.1. Knowing the Community
The community selected for the research was La Salud, located in the town of the Mayaguez municipality in Puerto Rico. This community is classified as LMI. The demographic data about the La Salud community by census 2020 [7] are presented in Table 1; further, Figure 1 shows the geography and limits of the La Salud Community.

Table 1.
Demographic data.
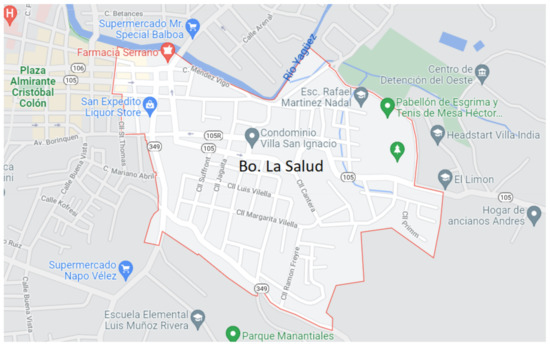
Figure 1.
La Salud community.
The daily life of the La Salud community is associated with urban planning. According to the Planning Board, in 2017, they reported the following about the urban area in Mayagüez that applies to the studied community: “It has abandoned structures. The community has a limited area for recreation and leisure. There is a degradation of the urban landscape. It is prone to flooding due to its location next to the Mayagüez river and ponds. Some businesses are deteriorated (Planning Board, 2017)”.
The community contains more than a thousand houses. To make the analysis of the data in this research more comfortable, it was decided to divide the community of La Salud into smaller parts, which for the purposes of this study we will call sections. We obtained a total of 33 sections, as shown in Figure 2.
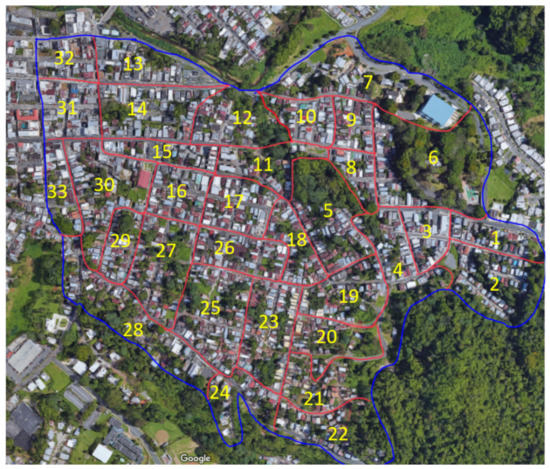
Figure 2.
Thirty-three sections of the La Salud community.
La Salud has a lot of abandoned residences and businesses. The people who reside in this community are mostly elderly, so they cannot take care of the urban areas by themselves. For this reason, the urban infrastructure in the community is in decline and affects the residents themselves. The people noted that the entrances to the rooms were in states that posed a danger to these elderly residents. However, the team found that a greater danger was the state of the electrical infrastructure; it consists of cables that hang at dangerous heights and are covered in vegetation, and it is considered a threat to the lives of residents.
During the work in the community, the following needs were identified:
- Hygienic: dirty roads, houses with accumulated garbage, etc.
- Energetic: people mention that the light is expensive, damaged network, etc.
- Educational: lack of knowledge regarding energy.
- Recreational: guide the community about the places available for parents to promote recreation in their children.
- Health: cancer, deterioration in the legs, diabetes, etc.
2.2. Tools for Solar Potential
We start with the simulation, validation, and virtual installation of the PV panels, using the PVWatts Calculator, a tool of NREL. For this experiment, the option was to draw the systems individually in each house—that is, fixed systems were not taken to achieve the best use of the roofs and have detailed data of the selected houses. To use the calculator, it is necessary to provide information about the location of the system or array, basic design parameters, and an average annual retail electricity rate if obtaining an estimated cost of production is desired [8].
3. Load Profiles Model and Assessment of the Solar-Rooftop Energy Potential
3.1. Study Case 1: Load Profiles Model
This section presents the process carried out to obtain household load profiles and the data acquisition process. The considerations to develop this work are shown in Table 2 [6].
Table 2.
Characteristics of residential load consumption.
Additionally, this work used real data obtained from smart meters to validate the models.
The model of energy demand was built for LMI communities to learn about the solar energy capacity needed to provide consumer demand. In a community, there are different types of houses; so, an energy consumption demand model was developed for five different sizes of houses based on census information (5 profiles of houses) [9]. The human behavior of energy consumption using electrical appliances was emulated based on an average time schedule and a random behavior [5]. Figure 3 presents the general concept of the model.
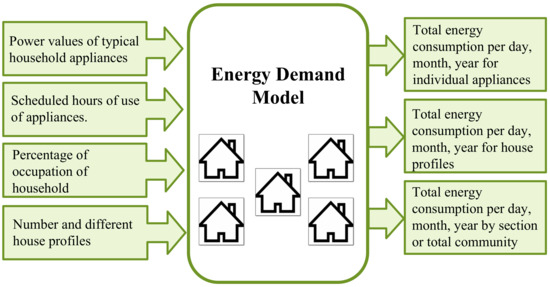
Figure 3.
Load profiles model concept.
Based on the census information, we consider the inputs and outputs of the model.
3.1.1. Inputs of Model
The basic appliances are expected to define the power values of the electrical model that will approximately emulate electrical consumption—as well as the schedule hours of used appliances—that allow us to describe the power ON or power OFF device behavior. Further, it is considered a percentage of occupation of the household to modify the total consumption of the community. Finally, as input, we have the number of and different house profiles. This input allows us to quantify the houses of the same profile.
3.1.2. Outputs of Model
The model allows us to generate different profiles. These data consider aggregated load profiles by houses and for the whole community. The total electricity consumption can be split by day, month, and year, as well as the overall consumption of each individual appliances. The output data are used to plot and analyze the peaks of energy consumption and the hours of maximum energy consumption, thus identifying the critical case, corresponding to the case with the highest energy consumption.
3.2. Study Case 2: Solar-Rooftop Energy Potential
Among the objectives of this research was to identify LMI communities to collect and classify data through the use of software. The data were then used for simulations and analysis of the best use of PV energy to increase the sustainability and resiliency of communities.
3.2.1. Design
According to the information obtained, the project for data collection is designed and validated, based on the contribution of NREL, in the report Puerto Rico Solar-for-All: LMI PV Rooftop Technical Potential and Solar Savings Potential [10]. Using the Solar for All tool [11], the potential of the solar resource for the LMI communities was sizing, as can be seen in Figure 4. Giving continuity to the project in conjunction with Arizona State University (ASU) and the University of Puerto Rico at Mayaguez (UPRM), a new project “Developing socially and economically generative, resilient PV energy systems for low and moderate income communities: Applications for Puerto Rico” [12], was projected for 3 years and in different previously selected communities in Puerto Rico; thus, our research is born as part of the project and the results obtained serve as a contribution to the communities.
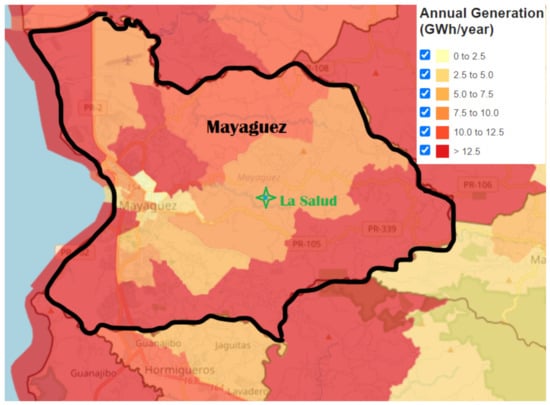
Figure 4.
NREL’s tools—Solar for all.
3.2.2. Solar Energy Potential
It is important to analyze the behavior of solar irradiation in the community. For this work, the Google Project Sunroof tool was used, which measures the amount of sunlight that reaches the roofs using 2D models derived from aerial images. This allows us to estimate the shading and possible position of the sun in the sky for each point of a roof [13,14,15]. Figure 5 captures the solar energy potential of the community in three divisions, classified as northwest, northeast, and south, thus capturing the solar irradiation potential in the houses within the community.
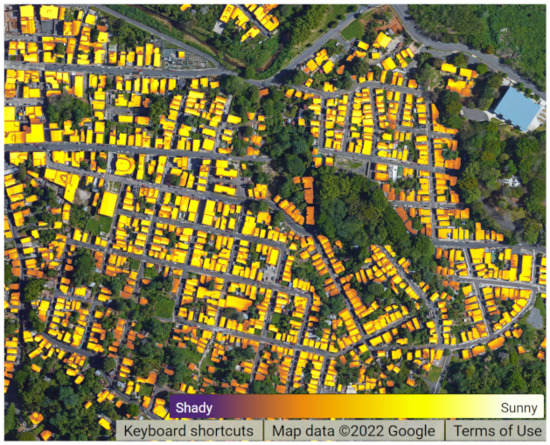
Figure 5.
Solar energy potential by Project Sunroof from Google.
4. Development of the Methodology
4.1. Study Case 1: Development of Load Profiles Model Proposed in Simulink
The model in Simulink considers the five different types of households (1 to 5 bedrooms) presented in the last section, shown in Table 3. The model describes the typical consumption behavior of the main electrical appliances in a home in Puerto Rico. The implemented model allows the addition or removal of appliances, making it more flexible. The model emulates the random human behavior of turning appliances on or off according to a programmed schedule, where typical consumption is expected.
Table 3.
Distribution of bedrooms in the test community [7].
4.1.1. Inputs of Model
The model of the consumption of electrical appliances was adjusted according to the needs of the community. Moreover, power benchmarks were taken from the supplier pages of the appliances, considering three different capacities for each appliance from small to medium and big, to be used in the different profiles of the houses [4,5]. Table 4 shows an example for one device.
Table 4.
Example of power values for an Air conditioner.
From the supplier pages of the appliances, we can obtain the power data consumption and use the values in the implemented model in Simulink, as shown in Figure 6.
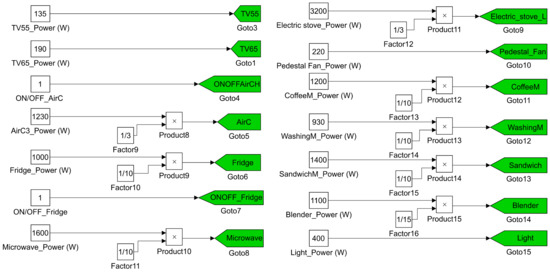
Figure 6.
Typical appliance power values running on the Simulink Model.
The energy consumption demand is based on human behavior, which is simulated through a programmed schedule and random behavior blocks that are responsible for turning on/off basic appliances at scheduled times. The random behavior is desired, because the energy demand does not always have the same behavior, as is shown in Figure 7 and Figure 8.
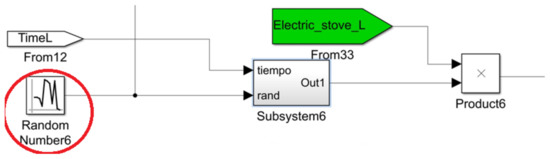
Figure 7.
Model structure, random behavior.
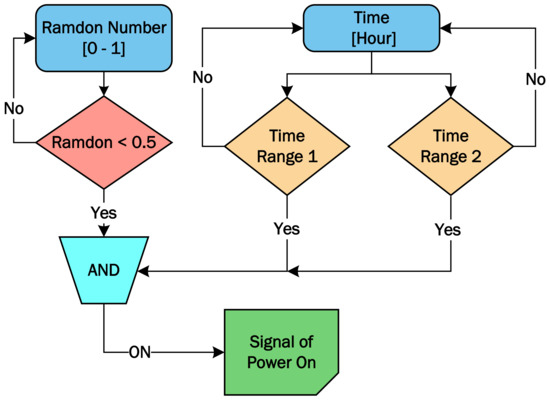
Figure 8.
Modeling time ranges of use.
Figure 8 shows an example of the implementation of using two ranges for a device. The output signal is triggered through the random variable, which allows the emulation of different behaviors (on/off).
4.1.2. Outputs
With the consumption model development in Simulink, we obtained the output data of the power consumption per day, month, and year for different load profiles and calculated the total energy consumption. The load profiles considered are individual appliances, house profiles, sections of the community, and total community. In this work, the data were generated for hours to be compared with real data.
4.1.3. Collect Energy Demand Data for Households
To develop this work, real data were obtained to compare with simulated load profiles. The data were obtained through smart meters in the houses under test in the selected community. Smart meters allow the measurement of total power consumption and energy demand for individual devices. The smart meter employed in this case was an Emporia Gen 2 Vue Energy Monitor, which has the following features:
REAL-TIME ENERGY DATA: the smart meter connects to WiFi to monitor and send data power use to the database. APPLIANCE MONITORING: the smart meter has eight individual sensors that provide data for all monitored devices. APPLIANCES MONITORED: Air conditioner, Water-heater, Washer, Range (Oven), Fridge, Lights, TV, and others.
Figure 9 shows an example of the smart meter installation in a house under test. The smart meter and sensor are connected in a power distribution panel.
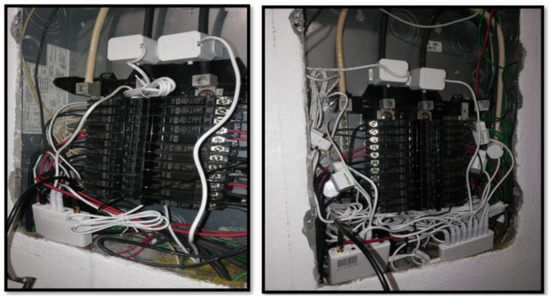
Figure 9.
Installs in circuit panels of most split-phase 120 Vac homes with clamp-on sensors.
4.2. Study Case 2: Development of Solar-Rooftop Energy Potential
4.2.1. Analysis and Design
Several stages are considered to achieve this project. The first stage was the visit to the community to collect information on demographic variables of the inhabitants and perception variables regarding solar PV energy, household infrastructure, and energy demand. The second part designs a plan for data collection, it begins with the simulation and virtual installation of PV panels using NREL’s PVWatts Calculator tool. For our experiment, the option of drawing the systems individually in each house was taken—that is, no fixed systems were taken. This was decided with the aim of achieving the best use of the roofs and having detailed data of the selected houses. In the third stage of the project, a descriptive statistical analysis was performed in RStudio programming language R, dedicated to statistical computing and graphics, for the behavior of the variables regarding the production of solar PV energy and the relationship with the size of the installed system.
In the fourth stage, different load profiles are designed for households, according to the characteristics of the population, for the collection of demand or consumption data, generated through the use of models created in MATLAB—Simulink.
4.2.2. Solar Energy Potential
The solar potential analysis was carried out for each house inside of the section. The first step was selecting the house and the available area was estimated for simulation. The simulation was carried out for one year and the data were saved for hours. The parameters of the PVWatts calculator were set to default.
4.3. Comparison between Consumption and Energy PV Generation
The solar energy potential of a community house was evaluated using synthetic demand load profiles. As a first step, we selected each house and the available roof area to estimate the system size using the PVWatts Calculator. Section 16 was chosen as an example to determine the maximum system size that each home can support, and is explained in more detail in the Section 5.3.
This procedure is repeated in all sections of the community. Through this process, it was found that the size of the system that can be supported on the available rooftop area in all community houses is between 5 kW and 15 kW. Therefore, PV system sizes of 1 kW, 2 kW, and 4 kW were selected for analysis. Two characteristics were taken into account to select the PV system size: system sizes of less than 5 kW can be supported on the available roof area of the community’s homes and economical resources of the community. For the analysis, two load profiles were used: the load profile of a house with 1 bedroom, which represents the lowest consumption, and the most representative load profile of the community, which is a house with 3 bedrooms, according to Table 3.
5. Validation Results
5.1. Study Case 1: Load Profiles Model Validation
Figure 10 shows an example of the output load profile energy consumption in Watt-hour (Wh) of house lights. This output can be generated for all load profiles under study.
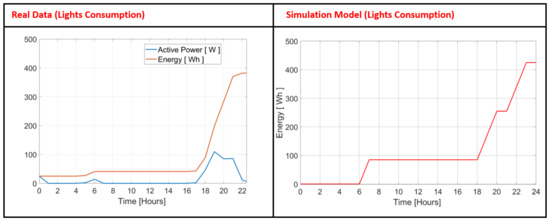
Figure 10.
Real data vs. Simulation model (Lights), the red line represents the energy consumption in both graphs [Wh].
Figure 11, Figure 12 and Figure 13 present a comparison between the measured data and the data generated by the simulation load profile model. The simulation and the actual measured data were performed over the same time periods. In these figures the results of the simulated load profile model can be seen on the right side of the graph. On the right side of the graph the red lines indicate the power consumed by the appliance and on the left side of the graph it shows the actual data measured by the smart meters which are expressed as a bar graph. In all the graphs it is observed that they have a similarity in their average power consumption value of each appliance represented by the blue dotted line present in both graphs. The results are not exact to the actual data due to human random behavior.
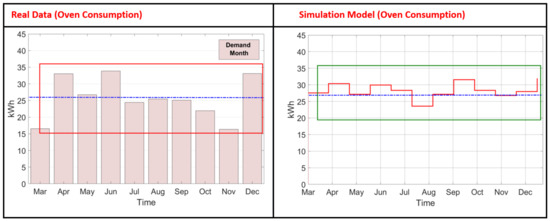
Figure 11.
Real data vs. Simulation model (Oven).
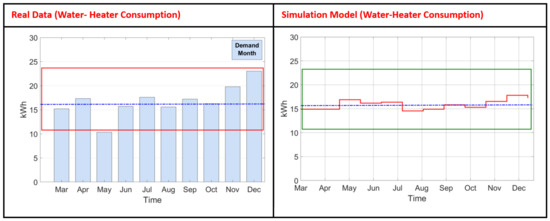
Figure 12.
Real data vs. Simulation model (Water-Heater).
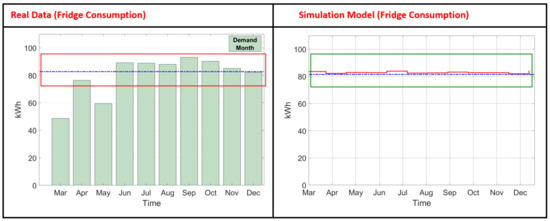
Figure 13.
Real data vs. Simulation model (Fridge).
Figure 14 shows the total energy consumption per month of a house located in the community under study. This figure is composed of three subplots. One of them is generated for smart meter data (a), the other is generated considered bill data (b), and (c) is the figure obtained from the simulation model, where the red line indicates the power consumed by the whole profile and the blue dotted line represents the average power consumption value of the case proposed. The above-mentioned subplots are presented considering the same period of time. The results show that the smart meter, bill, and simulation model data present similar average energy consumption, approximately to 300 kWh, which corresponds to the house load profile model consumption per mount. The simulated model presents a minimum error in the output load profile.
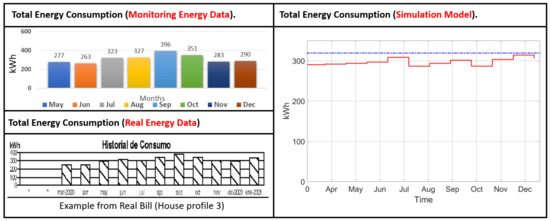
Figure 14.
Total energy consumption from smart meter, bill, and simulation model.
5.2. Study Case 2: Results of Assessment of the Solar-Rooftop Energy Potential
The study of potential solar allows us to estimate the capacity of energy production of any place that uses PV systems. The analysis was carried out during the hours of 6:00 to 18:00 depending on the solar irradiance available in the location. Figure 15 shows the average solar potential for a year of houses on section 16 from the test community, where the maximum potential generation is 11:00 in this case.
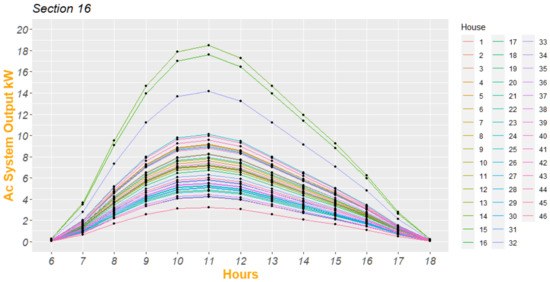
Figure 15.
Average solar potential estimation in section 16 for a day.
Figure 16 shows the estimated average daily solar potential for one year for each section of the community, where the potentials are within a range of 2 kW to 5 kW, which means of the sections.
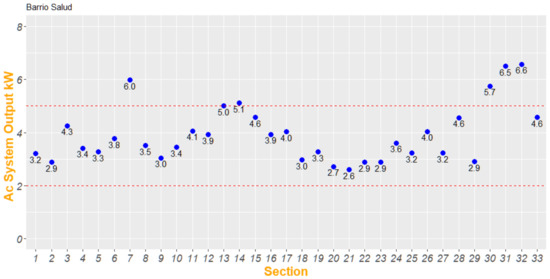
Figure 16.
Average daily solar potential estimation of the community for one year.
5.3. Comparison between the Difference Consumption and Energy PV Generation
Figure 17 shows that the size of the PV system that can be supported on the rooftop area available on all section 16 houses is in the range of 5 kW to 15 kW.
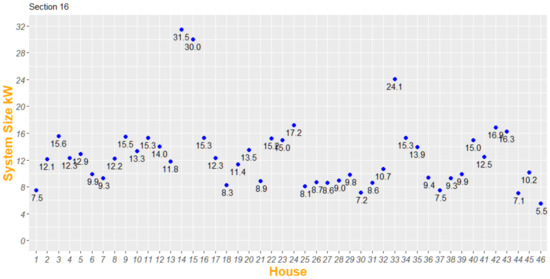
Figure 17.
Maximum system size supported per home.
The analysis of the results shown considers the solar impact on the photovoltaic generation systems using three days of photovoltaic generation: a typical day of irradiation, a clear or maximum irradiation day, and a cloudy or minimum irradiation day [14,16].
Figure 18, Figure 19 and Figure 20 show the results of PV system estimation of 1 kW, 2 kW, and 4 kW. The profiles represent the Typical energy PV (green), Maximum energy PV (orange), Minimum energy PV (purple), and the consumption of House energy (blue).
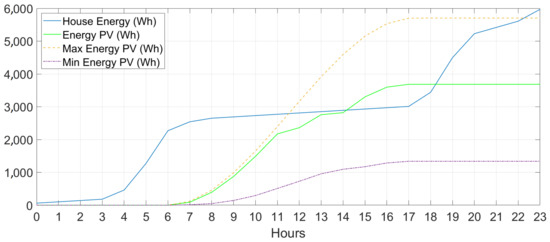
Figure 18.
Profile 1 vs. 1 kW system (day).
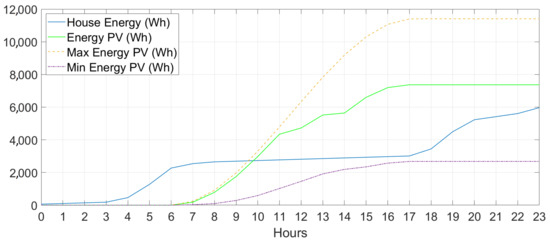
Figure 19.
Profile 1 vs. 2 kW system (day).
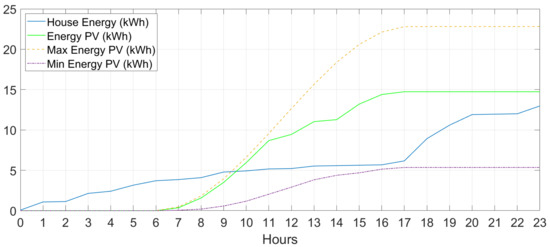
Figure 20.
Profile 3 vs. 4 kW system (day).
In Figure 18, it is observed that the 1 kW PV system is not sufficient for the demand of the one-bedroom house profile. The cloudy day or with minimum irradiance only generated 20% of the house energy demand. Further, the day with typical and maximum irradiance only generated around 63% and 96%, respectively.
In Figure 19, it is observed that the 2 kW PV system is sufficient for the demand of the one-bedroom house profile. The day with minimum irradiance generated 36% of the house energy demand. The day with regular PV generation supplied 100% of the house energy demand.
In Figure 20, it is observed that the 4 kW PV system is enough to supply the demand of the three-bedroom house profile on a day with regular irradiance. However, the PV system is oversized; thus, the energy generated is wasted.
Table 5 presents the summary of the analysis performed for the 1 kW, 2 kW, and 4 kW PV systems considering the different household profiles.
Table 5.
Differences in demand profiles vs. PV power generation.
It is highlighted that a size of 4 kW would cover the needs of the profiles of two and three bedrooms, which represent approximately of the characteristics of the households in the community. On the other hand, the 2 kW size is considered to cover the basic needs of a household, such as a backup or emergency system.
6. Conclusions and Future Work
6.1. Conclusions
- An analysis of the solar PV potential was carried out, where the community would support system installations between 5 kW and 15 kW, for the 1188 homes. A very important result of this analysis was the finding that approximately 74% of the households have three bedrooms or less; therefore, it is favorable for them to install a 4 kW photovoltaic system.
- In this study, it was found that a PV system with a minimum size of 4 kW can generate cumulative energy that, at the end of the day, supplies the entire cumulative energy demand for a load profile of a three-bedroom house. In practice, this is not enough to maintain the energy balance every moment due to the hours when there is no solar power generation, as the energy consumed cannot be fed and must be supplied by other sources such as batteries or the main power grid.
- A study was carried out to create profiles of houses of between one and five bedrooms to determine energy consumption.
- This study facilitates the steps to find the minimum PV system size for a household using NREL tools.
- This study serves as a basis for determining the minimum PV system size and is a starting point for selecting the capacity of the battery system needed to store excess energy or to supply the energy demanded by a household.
6.2. Future Works
- Use other photovoltaic solar simulation tools, which have greater efficiency in the use of solar irradiation.
- Extend this study to help determine the sizes of battery banks needed, without using mains power.
- Extend this study to help determine the required battery bank sizes for the stand-alone mode.
Author Contributions
Conceptualization, D.D.C.-O., O.D.G., C.A.V.P. and F.A.; methodology, D.D.C.-O., O.D.G., C.A.V.P. and F.A.; formal analysis, D.D.C.-O., O.D.G., C.A.V.P. and F.A.; investigation, D.D.C.-O., O.D.G., C.A.V.P. and F.A.; resources, D.D.C.-O., O.D.G., C.A.V.P. and F.A.; writing—original draft preparation, D.D.C.-O., O.D.G., C.A.V.P. and F.A. All authors have read and agreed to the published version of the manuscript.
Funding
This work was supported by the U.S. Department of Energy (DOE), the Office of Energy Efficiency and Renewable Energy (EERE), and the Solar Energy Technologies Office, under Award Number DE-EE0002243-2144.
Institutional Review Board Statement
Not applicable.
Informed Consent Statement
Not applicable.
Data Availability Statement
No new data were created or analyzed in this study. Data sharing is not applicable to this article.
Acknowledgments
This research was funded by the U.S. Department of Energy. The authors are thankful to the Sustainable Energy Center (SEC).
Conflicts of Interest
The authors declare no conflict of interest.
References
- Belu, R. Fundamentals and Source Characteristics of Renewable Energy Systems; CRC Press: Boca Raton, FL, USA, 2019. [Google Scholar] [CrossRef]
- Rastegar, M.; Fotuhi-Firuzabad, M.; Zareipour, H. Home energy management incorporating operational priority of appliances. Int. J. Electr. Power Energy Syst. 2016, 74, 286–292. [Google Scholar] [CrossRef]
- Ochoa, R.G. Pobreza energética en América Latina; CEPAL: Vitacura, Chile, 2014; p. 36. [Google Scholar]
- Agnetis, A.; de Pascale, G.; Detti, P.; Vicino, A. Load Scheduling for Household Energy Consumption Optimization. IEEE Trans. Smart Grid 2013, 4, 2364–2373. [Google Scholar] [CrossRef]
- Pipattanasomporn, M.; Kuzlu, M.; Rahman, S.; Teklu, Y. Load Profiles of Selected Major Household Appliances and Their Demand Response Opportunities. IEEE Trans. Smart Grid 2014, 5, 742–750. [Google Scholar] [CrossRef]
- Fahim, M.; Sillitti, A. Analyzing Load Profiles of Energy Consumption to Infer Household Characteristics Using Smart Meters. Energies 2019, 12, 773. [Google Scholar] [CrossRef]
- Decennial Census. Available online: https://data.census.gov/table?g=0500000US72097 (accessed on 26 December 2022).
- (NREL). PVWatts Calculator Version 8. Available online: https://pvwatts.nrel.gov/ (accessed on 27 December 2022).
- Encuesta sobre la Comunidad. Available online: https://censo.estadisticas.pr/EncuestaComunidad (accessed on 22 December 2022).
- Mooney, M.; Waechter, K.; Miller, C. Puerto Rico Solar-for-All: LMI PV Rooftop Technical Potential and Solar Savings Potential|NREL Data Catalog; The National Renewable Energy Laboratory (NREL): Golden, CO, USA, 2020.
- Solar For All. Available online: https://maps.nrel.gov/solar-for-all/ (accessed on 20 December 2022).
- PROJECT PROFILE: Arizona State University 5 (FY2018 Photovoltaics)—Department of Energy. Available online: https://www.energy.gov/eere/solar/project-profile-arizona-state-university-5-fy2018-photovoltaics (accessed on 22 December 2022).
- Project Sunroof, by Google. Available online: https://sunroof.withgoogle.com/ (accessed on 22 December 2022).
- Zhen, Z.; Liu, J.; Zhang, Z.; Wang, F.; Chai, H.; Yu, Y.; Lu, X.; Wang, T.; Lin, Y. Deep Learning Based Surface Irradiance Mapping Model for Solar PV Power Forecasting Using Sky Image. IEEE Trans. Ind. Appl. 2020, 56, 3385–3396. [Google Scholar] [CrossRef]
- Wang, F.; Zhang, Z.; Chai, H.; Yu, Y.; Lu, X.; Wang, T.; Lin, Y. Deep Learning Based Irradiance Mapping Model for Solar PV Power Forecasting Using Sky Image. In Proceedings of the 2019 IEEE Industry Applications Society Annual Meeting, Baltimore, MD, USA, 29 September–3 October 2019; pp. 1–9. [Google Scholar] [CrossRef]
- Nakafuji, D.; Hong, A. Minimum Day Time Load Calculation and Screening; The National Renewable Energy Laboratory (NREL): Golden, CO, USA, 2014.


Disclaimer/Publisher’s Note: The statements, opinions and data contained in all publications are solely those of the individual author(s) and contributor(s) and not of MDPI and/or the editor(s). MDPI and/or the editor(s) disclaim responsibility for any injury to people or property resulting from any ideas, methods, instructions or products referred to in the content. |
© 2023 by the authors. Licensee MDPI, Basel, Switzerland. This article is an open access article distributed under the terms and conditions of the Creative Commons Attribution (CC BY) license (https://creativecommons.org/licenses/by/4.0/).