Abstract
In the development of a tool wear monitoring system in milling, the complex cutting path always brings challenges to the system’s reliability in the production line. The cutting path effect on the acoustic emission (AE) and vibration signals during the micro milling processes was investigated in this study by implementing three types of cutting paths in a micro milling experiment. To generate the data for analysis, an experiment was conducted on a micro milling research platform using an AE sensor and an accelerometer installed on a fixture attached to the spindle housing. To demonstrate the effect of the cutting path on the performance in the monitoring of tool wear, a simple linear classifier is proposed, along with the signal features generated from the different signal lengths and the bandwidth size in the frequency domain. The results show that the signal features generated from the cutting of a straight line, the corner of the square path, and the circle path are different from each other. The increase in the signal length to generate features, which will reduce the corner effect, could improve the performance of the developed monitoring system. However, the results suggest that avoiding the complex cutting path for feature generation might be a better strategy for developing a micro milling tool wear monitoring system.
1. Introduction
A tool condition monitoring system has drawn a great deal of attention in the industry lately due to the rapid development of intelligent manufacturing systems. At the same time, the demand for micromechanical machining in the industry has also been rapidly increasing due to the increasing development of products with small features. The low signal strength and limited space for sensor installation when dealing with small parts make it more challenging to monitor the micro tool condition than in cases with conventional tools sizes. Although the tool condition monitoring system for the conventional size of tools has been studied for decades and a number of review papers have been reported [1,2,3,4,5,6,7,8,9], there are still several challenges regarding implementing the laboratory-developed system to the production line, including the noise, system uncertainty, and the complex cutting paths inherent in milling processes. One of the key solutions is to obtain reliable signal features during cutting.
Different types of sensors have been investigated in previous studies for tool wear monitoring, including the current sensor [10,11], dynamometer [12,13,14,15,16,17], accelerometer [18,19,20,21], acoustic emission (AE) sensor [22,23,24,25,26], microphone [27,28,29,30], and vision sensor [31,32]. Multi-sensor systems were also studied to improve system reliability [33,34,35]. Recently, classifier design has become another focus in the development of a tool wear monitoring system. Several types of signal processing algorithms were investigated, including the linear classifier design [27,36], a neural network [18,19,20,21,33,37,38], fuzzy logic [39,40], a decision tree [25], the hidden Markov model (HMM) [14,41], and AutoEncoder [42]. However, straight line cutting was always implemented in these laboratory works to develop and evaluate the tool wear monitoring system in milling. For the investigations of vibration and AE signal for tool wear monitoring, Hsieh and Lu [18] applied the spindle vibration signal and a back-propagation neural network to monitor the micro tool wear in a straight line micro milling process on SK2 steel and demonstrated that the proposed methods hold the potential to be implemented in the production line. Huang et al. [19] proposed a tool wear monitoring method using vibration signals collected from accelerometers on the workpiece and developed classifiers based on short-time Fourier transform (STFT) and a deep convolutional neural network (DCNN) in straight line milling operations. The experimental results prove that the proposed method is more accurate and relatively more reliable than other compared methods, such as SVR, PSO-SVR, and PSO-LSSVR. Gomes et al. [34] monitored the wear of cutting tools in the micro milling process using an SVM (support vector machine) artificial intelligence model, along with the vibration and sound signals. The straight line microchannel was used to collect signals in the experiments. A classification accuracy of up to 97.54% was obtained in the evaluation. Prakash and Kanthababu [23] presented a study on tool condition monitoring using a workpiece AE signal in the micro-end milling of different materials, including aluminum, copper, and steel alloys. A strong relationship between the tool wear (flank wear) and acoustic emission (AERMS) signals could be observed in this study. Hu et al. [24] used the AE signal on the workpiece to monitor four states of tool wear conditions in the channel milling of titanium alloy Ti-6Al-4V under MQL conditions. Support vector machine (SVM) integrated with linear discriminant analysis was adopted as the classifier. An overall 98.9% classification rate was obtained in this study. In 2021, Twardowski et al. [25] reported the use of the AE signal on a workpiece to monitor flank wear in the straight line milling of aluminum-ceramic composite containing 10% SiC. A decision tree was adopted in this study to identify the tool condition. In the study of tool wear monitoring development for complex cutting paths, Ma et al. [20] employed a stacked network in conjunction with a feature extraction method that combines vibration singularity analysis with correlation analysis to reduce the effect of the cutting path change on the system performance. A stacked long short-term memory neural network (LSTM) trained by selected features was used to estimate tool wear to reduce the path effect in the machining titanium alloy (Ti6Al4V) work piece with a rounded four-tooth integral alloy end mill. However, no feature analysis has been performed regarding the change in the cutting path.
In the past decades, several research results have demonstrated that the developed tool wear monitoring system, with vibration and AE signals, could provide a promising performance in straight line or channel cutting. However, the cutting path in industrial applications for milling processes is more complicated than simple straight line cutting, and it creates a difficult challenge regarding the industrial application of tool condition monitoring systems developed in the laboratory. In view of the cutting mechanism, the change in tool/material engagement volume and direction is expected to lead to different cutting force and signal features under the same cutting condition. To provide a better strategy to improve the capability of transferring the system developed in the laboratory to industrial applications, the cutting path effect on the spindle vibration and AE signals in micro milling was investigated in this study by implementing three types of cutting paths in a micro milling experiment. The accelerometer and AE sensor were installed on a fixture attached to the spindle housing to collect the signals for feature analysis. Finally, a linear classifier was also implemented to analyze the performance improvement by reducing the path change effect with the increase in the signal length of the sampled signals.
2. Experimental Setup
To investigate the cutting path effect on the spindle AE and vibration signals correlated to the tool wear condition, experiments were conducted on a micro milling research platform, as shown in Figure 1. The research platform was developed by the micro manufacturing research laboratory in NCHU, Taiwan. It includes an ITRI PC controller, an XY-axis motion table with a resolution of 1 μm, a Z-axis motion table, and an NSK-EM30 S6000 electric-motor driven spindle with a rotation speed of up to 60,000 rpm. For the sensor installation, A Kistler 8152B121 AE sensor was installed on a fixture attached to the spindle housing, along with a 3-axis accelerometer (Endevco 65-100-R). The working frequency range is from 50 kHZ to 400 kHz for the AE sensor and from 1.5 Hz to 6 kHz for the 3-axis accelerometer. In signal acquisition, the AE and vibration signals were collected by a PCI-6132 and PCI-6251 data acquisition card, with a sampling rate of 2 MHz and 30 kHz, respectively. Three types of cutting paths, including straight line cutting, square path cutting, and circle path cutting, were designed, as shown in Figure 2, to analyze the vibration and AE signals affected by changing the cutting direction. The implementation of the cutting pattern is illustrated in Figure 3. Three types of cutting paths were integrated together for each cutting pass. For the tool size and cutting condition setup, the size of the micro end mill used in the test is 700 μm, and the cutting condition for the test is listed in Table 1. During the cutting, the tool wear condition was recorded by a portable optical microscope on the cutting site, without removing the tool from the tool holder (Figure 1).
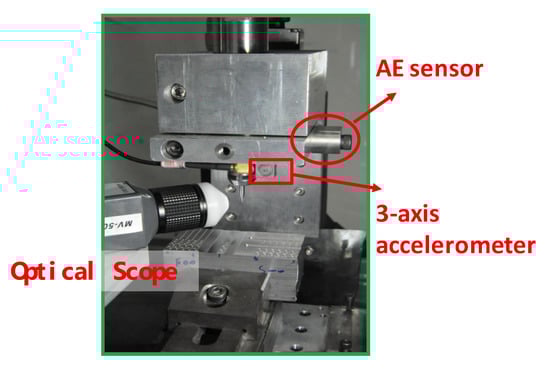
Figure 1.
Experimental setup for sensors in micro milling.
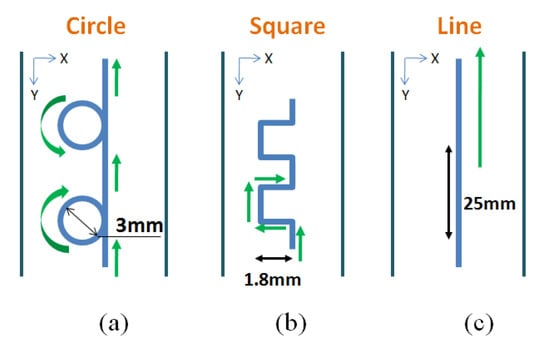
Figure 2.
Cutting path designs in micro milling: (a) circle path cutting; (b) square path cutting; (c) straight line cutting.
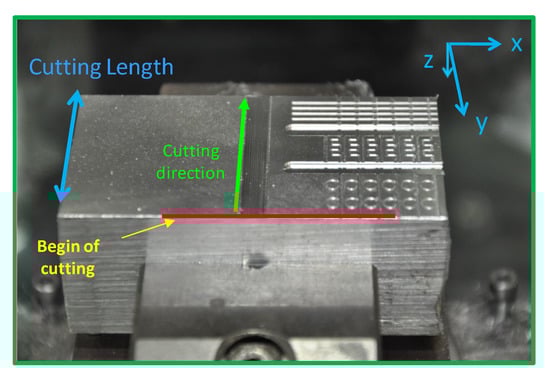
Figure 3.
Implementation of the cutting test for the micro milling process.

Table 1.
Cutting conditions.
3. System Development for Verification
The modules and the development procedure for the tool condition monitoring system implemented in this study are shown in Figure 4. The modules of this system include signal transformation, feature selection, and classifier design. The fast Fourier transformation (FFT), combined with the class-mean scatter criterion, was adopted in this study for signal transformation and correlation analysis of the features and tool wear. The Fisher linear classifier [43] was chosen in this study as the model for the classifier.
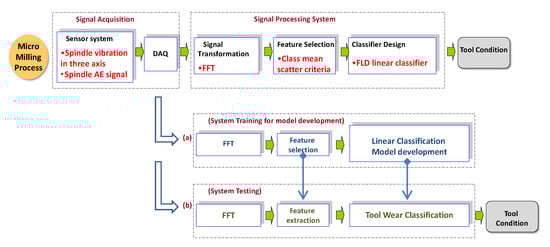
Figure 4.
Schematic of tool wear monitoring system for tool wear classification.
The time domain signals usually exhibit lower sensitivity to the change in micro tool wear and are transformed into the feature space for the analysis in this study. After transforming the time domain signals into the frequency domain, some frequency signal features can be more sensitive to the change in tool wear than others and may therefore be considered valuable features as the input elements to the classifier for identifying the tool condition.
To evaluate the sensitivity of each feature in the frequency domain regarding the change in micro tool wear, the class-mean scatter criterion was adopted, and the classifier index which estimates the between-scatter to within-class scatter ratio is used for analysis [44]. The between-class scatter and within-class scatter are defined as follows. The mean of the features for each class was obtained using individual features in Equation (1) [44]:
where
class
pattern in a class
feature
.
The overall system mean is determined as follows:
where
The within-class scatter and individual-class scatter are defined as in Equations (3) and (4), respectively:
The is defined as in Equation (5) as follows:
4. Results and Discussion
4.1. Path Effect on Signal Features
The cutting edge and the flank wear level of the sharp and worn tool obtained online are shown in Figure 5. The corresponding time domain raw signal collected during three types of cutting paths for the sharp and worn tool conditions is illustrated in Figure 6a and Figure 7a, respectively. The types of cutting paths cannot be identified by the vibration raw signals in the three directions. However, after transforming the raw signal to the time-frequency domain by using wavelet transformation, some changes in the signals correlated to the change in cutting path can be observed, with the wavelet coefficient representing the low-frequency signal. Moreover, as tool wear increases, a more unstable vibration signal can also be observed in the selected wavelet coefficient in Figure 7b. Moreover, the Y- and Z-direction vibration signals demonstrate a higher sensitivity to the tool wear than the X-direction signal.
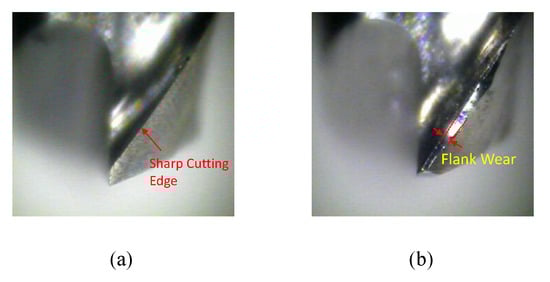
Figure 5.
Tool wear condition for signal collection: (a) sharp tool; (b) 30 μm tool wear level.
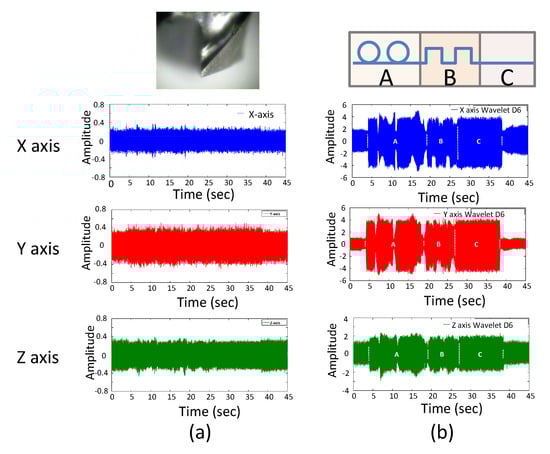
Figure 6.
Time domain vibration signal with a new tool: (a) raw signal; (b) wavelet coefficient (sharp tool).
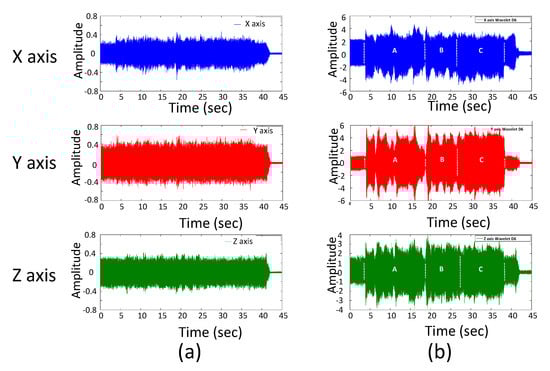
Figure 7.
Time domain vibration signal with a worn tool: (a) raw signal; (b) wavelet coefficient (30 um).
To investigate more detailed information on the signal change as the direction change in cutting, the wavelet coefficients obtained from the circle and square cuttings are extracted from full-length signals, as shown in Figure 8 and Figure 9, respectively. In the circle cutting, the change of signal amplitude in part B can be clearly matched to the direction change in the cutting path. Additionally, due to the appearance of overlap machining at the intersection of the circle and the straight line paths, the low signal energy can be identified between part A and part B in the signal analysis, as well as between part B and part C. In the square cutting, as shown in Figure 9, the portion of the cutting moving in the Y-direction will lead to a higher X-direction vibration signal in parts A and C. Based on the observation discussed above, the change in cutting direction is proven to lead to a significant change of the amplitude of the vibration signal in the specific frequency range.
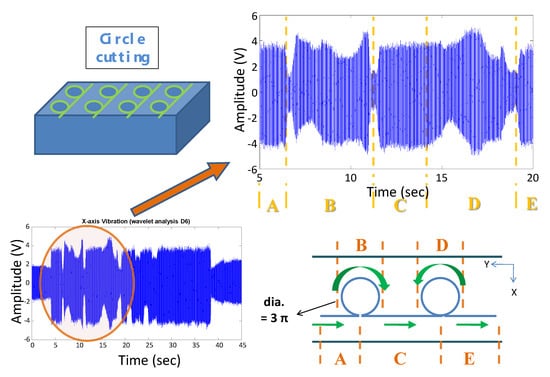
Figure 8.
Signal change in circle path cutting (sharp tool in x−direction).
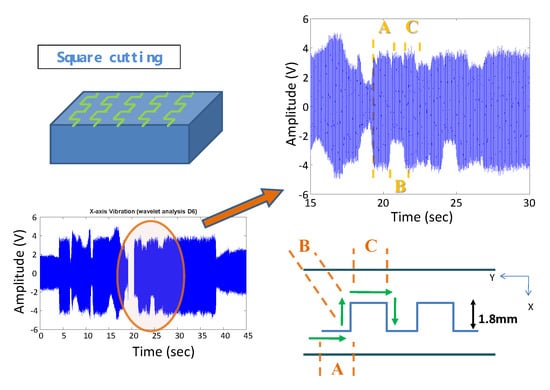
Figure 9.
Signal change in square path cutting (sharp tool in x−direction).
The AE signals are generated primarily by the strain rate of the material on the workpiece and the tool, as well as the friction on the tool—chip interface. The raw signal of the AE signals collected simultaneously with the vibration signals are shown in Figure 10 for the sharp and worn tool. In contrast with the vibration signal discussed above, no clear energy change in the signal features can be observed in the change in the cutting path. This suggests that the direction change in the cutting path might not significantly affect the AE signal, as its effect on the vibration signals is in all directions.
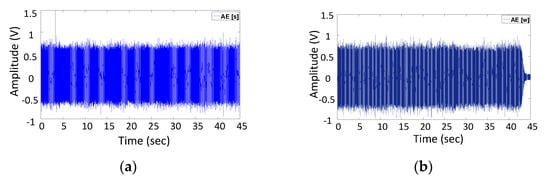
Figure 10.
Time domain AE signal: (a) sharp tool; (b) worn tool.
4.2. Sensitivity Analysis of Signal Features to Tool Wear
The frequency response of the X−direction vibration signal corresponding to three types of cutting paths, with a 0.27-s sampling length, is shown in Figure 11, along with the corresponding scatter index J calculated for each frequency (bandwidth 60 Hz) based on 5 sharp and worn datasets. The frequency domain feature with the higher index value J will be considered more sensitive to the tool condition change and is usually selected as the input vector for the designed classifier. Based on the analysis in Figure 11, the frequency features which hold the highest sensitivity to the increase in tool wear in each type of cutting path were observed to be different from each other. For example, in the case of straight line cutting, the energy of the frequency features at 2.4 kHz, 4 kHz, and 5.6 kHz for the worn tool case is higher than for the sharp tool case (Figure 11a). In contrast, the energy of features at 1 kHz, 4.2 kHz, and 5.8 kHz collected from the worn tool examples are lower than for the sharp tool samples. However, this result will not match the cases in the square and circle path cutting conditions, except for features higher than 5.4 kHz. In the frequency range lower than 3.2 kHz, the features in straight line cutting have a relatively higher-value scatter index J (Figure 11b) than in the square and circle path cutting situations. In contrast, the high-frequency features play a much more important role in detecting tool conditions in the square and circle path cutting conditions, and they might also be good features, since the scatter value in the high-frequency range is also sufficiently high in the straight line cutting situation. These results suggest that selecting the lower frequency features as the input to the classifier, based on the results obtained from straight line cutting, will lead to failure in monitoring the tool wear condition when the cutting path consists of all three types of cutting paths.
The frequency response of the AE signals and the scatter index J for each frequency feature is also investigated and is shown in Figure 12. Different from the vibration signal in the x-direction, the patterns of its energy distribution over the frequency for three types of cutting paths are similar to each other. The AE signal energy concentrates on the frequency range from 50 kHz to 220 kHz for all three types of cutting paths. By investigating the scatter index for each frequency feature, the one located around 170 kHz has the highest value J for all types of paths. These results suggest that the AE signal features might not be significantly affected by changing the cutting paths compared to the vibration signals.

Figure 11.
Frequency domain vibration signal in the x-direction and scatter index for sharp and worn tools: (a) frequency domain signals; (b) classification index J (60 Hz).

Figure 12.
Frequency domain AE signal and classification index for sharp and worn tools: (a) frequency domain signals; (b) classification index J (6 kHz).
4.3. Reduction of Path Effect by Signal Length and Bandwidth of Feature
The signal feature is usually generated by a specific length of sampled signals. The different sampled signal lengths might change the sensitivity of specific features to the tool wear. The sampled signal length selected for generating the features has been increased, as well as the bandwidth size for frequency features, to investigate their effect on the scatter index. The scatter indices for frequency features generated with signal lengths of 0.017 s. and 2.27 s. are shown in Figure 13. The increase in the scatter index level can be clearly observed as the signal length of the sampled signal increases from 0.017 s to 2.27 s. This result suggests that the variation in signal features is decreased and the contribution of the path change in deteriorating the tool wear monitoring system might be reduced by increasing the signal length. However, unlike the results shown in Figure 11 with the sampled signal length of 0.27 s, some frequency features obtained from the sampled signal length of 2.27 s and located higher than 5.2 kHz exhibited the highest value of the scatter index in the straight line cutting and will be selected as the input to develop the classifier. In this case, a better performance of the classifier will be expected, since the same frequency range of features could also be selected for the circle and square path cutting. On the other hand, when the sampled signal length is reduced from 2.27 s to 0.017 s, the classification index is low for all cutting paths, and no common frequency features could be chosen for any of the three types of paths. The higher variation in the signal caused by the path change might be the primary factor contributing to this result.
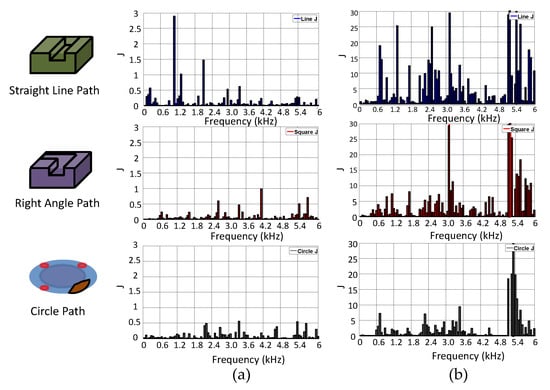
Figure 13.
Scatter index J with various signal lengths: (a) 0.017 s; (b) 2.27 s.
The scatter index J for the AE signal features with various sampled signal lengths is shown in Figure 14, with sampled signal lengths of 0.015 s. and 0.22 s. The lower signal length for the AE signal, rather than the vibration signal, was investigated because of the higher sampling rate setup for collecting the AE signal. In Figure 14, the increase in the value of the J index could be observed as the signal length increase. This result is in good agreement with the results obtained for the vibration signal. However, the change in the cutting path does not change the pattern significantly.These results suggest that the noise or disturbance effect caused by different path changes is reduced by increasing the signal length for both signals. However, the noise and disturbance in the AE signal are provided by the variation material propety, tool-material engagement, and machine tool peformance, not by the cutting path direction change.
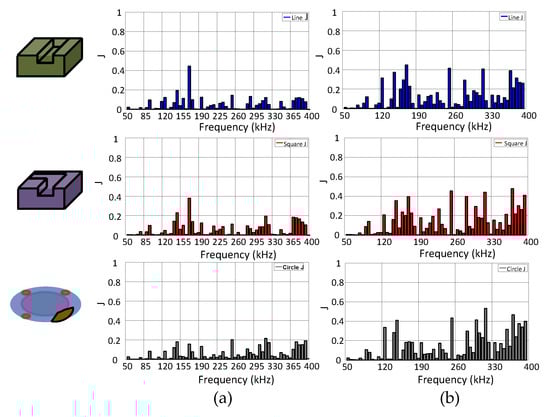
Figure 14.
Classification index J with various AE signal lengths for feature generation: (a) 0.015 s; (b) 0.22 s.
For the frequency features, the bandwidth chosen to generate them is usually expected to affect their sensitivity to the monitoring target and the noise/disturbance. Therefore, the effect of the bandwidth size for frequency features on the scatter index is analyzed here. An example of the frequency response of an X-direction vibration signal, with bandwidth sizes of 150 Hz and 300 Hz, is shown in Figure 15. The corresponding scatter-index J of each frequency feature calculated, based on repeated tests, is shown in Figure 16. By investigating the index J for all three types of cutting paths, shown in Figure 16, no significant change could be observed when changing the bandwidth of the frequency features from 150 Hz to 300 Hz. On the other hand, by investigating the scatter index change for AE signals shown in Figure 17, the scatter index is reduced as the bandwidth is reduced. However, no significant pattern change was observed when comparing the scatter indices of the three cutting paths to one another. This result might again suggest that the variation in the AE signal is not contributed by the type of the cutting path, but by the variation in other parameters, such as the spindle bearing, material property, tool-material engagement condition, and machine tool performance along any type of cutting path. Figure 18 shows the scatter index J for the AE signal from two different tools. The value is only calculated from the signals collected from different time intervals in a test with one tool applied. It demonstrates a significant change in index J for these two cases and might support the above discussion. However, further study could be conducted in the future to solve this issue.
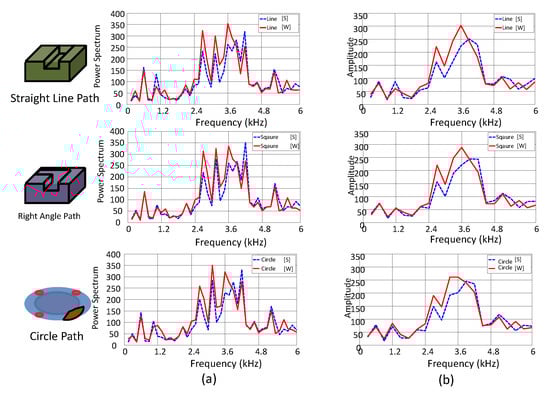
Figure 15.
Frequency domain vibration signal with various bandwidth sizes: (a) 150 Hz; (b) 300 Hz (X-direction).
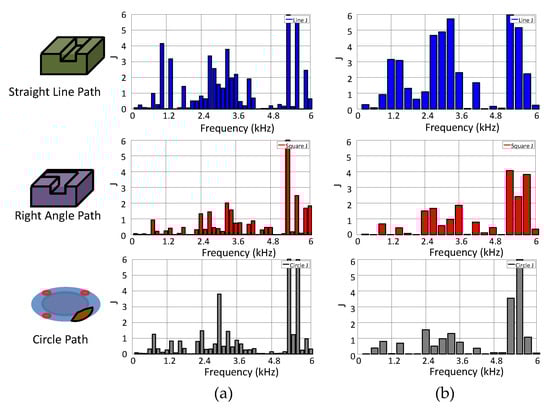
Figure 16.
Classification index J with various bandwidth sizes: (a) 150 Hz; (b) 300 Hz (X-direction).
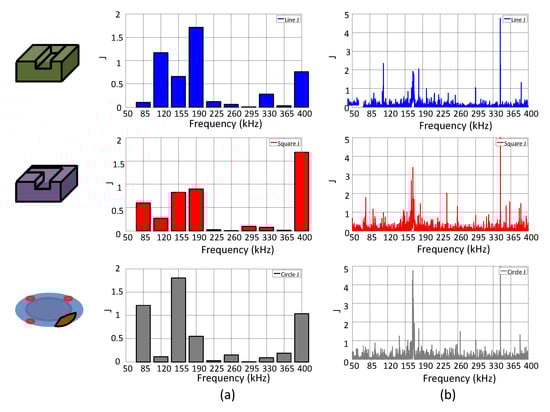
Figure 17.
Classification index J with various bandwidth sizes: (a) 36 kHz; (b) 150 Hz.
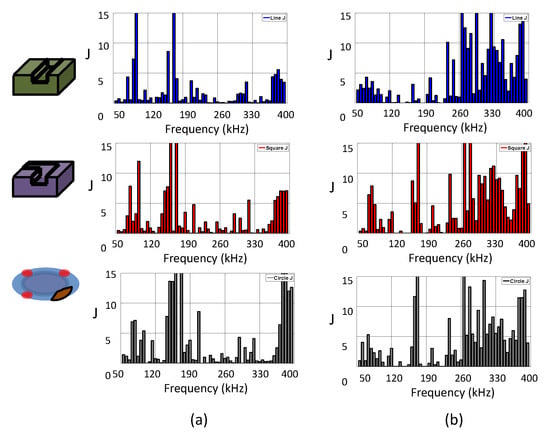
Figure 18.
Classification index J calculated from data collected from different cutting tools: (a) tool 1; (b) tool 2.
4.4. Classification of Tool Wear Condition for Various Cutting Paths and Sensor Directions
Based on the analyses results in previous sections, a simple linear classifier is developed to verify the cutting path effect on the performance of a monitoring system and to investigate the benefits we could obtain by increasing the sample signal length. By considering the effect of the changing cutting direction with different cutting paths, four models were independently developed, based on each type or direction of the sensor signal. A total of 3 sets of signals collected in the straight line cutting condition were used to train and generate the model. The signals obtained from 2 sets of tests other than those used for training the model were used to verify the system, including all three types of cutting paths. The classification rates of tool wear corresponding to vibration signals in the three directions and AE signals are shown in Table 2 and Table 3. The results illustrate that the classification rates for the cases with square and circle cutting are far lower than the results for the case with straight line cutting. This result are in good agreement with the signal feature analysis based on the scatter index J and could support the conclusions that the characteristics of cutting motion in the circle and square cuttings are different from the one (straight line cutting) used for developing the linear classification model. Moreover, the Z-direction vibration signal was observed to exhibit a higher capability for monitoring tool wear with the lower cutting path effect. This might be caused by the change in direction of the cutting in the circle or square path, leading to the lowest impact in the Z-direction (out of plane); the results match well with the observations in Figure 6 and Figure 7. When considering the differences between the vibration and the AE signals, a lower classification rate for the AE signal than for the vibration signal was observed. This might be caused by the features of the signal varing randomly due to paramters other than the cutting path change.
Table 2.
Tool wear classification rate with various axis vibration signals (model trained by line data).
Table 3.
Tool wear classification rate with the AE signal (model trained by straight line data).
In the previous discussion, the increase in the sampled signal length could increase the value of the scatter index J and reduce the cutting path effect on the vibration signal. The classification rate for all three types of cutting paths, with various sampled signal lengths, is shown in Table 4. Four levels of sampled signal lengths were used in this study, including 0.017 s, 0.27 s, 0.82 s, and 2.18 s. for vibration signals and 0.015 s 0.22 s, 1 s, and 1.75 s. for the AE signal. The difference between the chosen signal length is caused by the different sampling rates and the easy operation of transforming the time domain signals to the frequency response. The results, as shown in Table 4, Table 5 and Table 6, demonstrate that the increase in the sampled signal length in feature generation can significantly improve the classification rate. When considering the signals from three directions, the Z-direction vibration signal demonstrates less sensitivity to the cutting path. A 100% classification can be obtained by properly choosing the signal length for each processing unit using the model developed with only the data collected from the straight line cutting condition. In contrast, the AE signal provides the lowest classification rate of all three signals. This result is in good agreement with the discussion above.
Table 4.
Tool wear classification rate with the X-axis vibration signal and a 150 Hz bandwidth size (model trained by straight line data).
Table 5.
Tool wear classification rate with the Z-axis vibration signal and a 150 Hz bandwidth size (model trained by straight line data).
Table 6.
Tool wear classification rate with AE signals and various signal lengths (model trained by straight line data).
5. Conclusions
In this study, the cutting path effect on the acoustic emission (AE) and vibration signals during micro milling processes was investigated by implementing three types of cutting paths in a micro milling experiment. The results show that the time domain signal generated from the cutting of a straight line, the corner of the square path, and the circle path are different from each other. Based on the correlation analysis of the frequency features with tool wear, the optimum frequency features which are closely related to the tool wear condition differ along with the change in cutting paths for the vibration signal. However, the cutting path effect on the AE signal is lower than that of the vibration signal. In the study of the effect on the monitoring performance caused by the sampled length and bandwidth size of the features, the increase in the sampled signal length to generate the signal features will reduce the path change effect, based on the scatter index analysis. Moreover, unlike that of the sampled signal length, the cutting path effect was not observed to change with the increase in the bandwidth size of the features. In the analysis of the performance of the developed linear monitoring system by applying signals obtained from different types of cutting paths, a low classification rate was obtained for events with a cutting path other than the straight line cutting, which was used to train the model. However, when an increase in the sampled signal length is applied to generate features, the performance of the developed monitoring system improved significantly. Although the monitoring performance could be improved by reducing the cutting path effect and increasing the signal length per sample, avoiding the complex cutting path in collecting the signal might be a better strategy when developing a tool wear monitoring system in the micro milling process with complex cutting paths.
Author Contributions
Conceptualization, M.-C.L.; methodology, M.-C.L. and C.-R.H.; software, C.-R.H.; validation, M.-C.L. and C.-R.H.; formal analysis, M.-C.L. and C.-R.H.; investigation, M.-C.L. and C.-R.H.; resources, M.-C.L.; writing—original draft preparation, M.-C.L. and C.-R.H.; writing—review and editing, M.-C.L.; visualization, M.-C.L. and C.-R.H.; supervision, M.-C.L.; project administration, M.-C.L.; funding acquisition, M.-C.L. All authors have read and agreed to the published version of the manuscript.
Funding
This research received no external funding.
Institutional Review Board Statement
Not applicable.
Informed Consent Statement
Not applicable.
Data Availability Statement
Not applicable.
Acknowledgments
This paper was partially supported by the National Science and Technology Council, Taiwan, grant number: [MOST 111-2218-E-002-032 -].
Conflicts of Interest
The authors declare no conflict of interest.
References
- Byrne, G.; Dornfeld, D.; Inasaki, I.; Ketteler, G.; König, W.; Teti, R. Tool condition monitoring (TCM)-the status of research and industrial application. Ann. CIRP 1995, 44, 541–567. [Google Scholar] [CrossRef]
- Dimla, D.E., Sr. Sensor signals for tool-wear monitoring in metal cutting operations—A review of methods. Int. J. Mach. Tools Manuf. 2000, 40, 1073–1098. [Google Scholar] [CrossRef]
- Rehorn, A.; Jiang, J.; Orban, P. State-of-the-art methods and results in tool condition monitoring: A review. Int. J. Adv. Manuf. Technol. 2005, 26, 693–710. [Google Scholar] [CrossRef]
- Hopkins, C.; Hosseini, A. A Review of Developments in the Fields of the Design of Smart Cutting Tools, Wear Monitoring, and Sensor Innovation. FAC Pap. OnLine 2019, 52, 352–357. [Google Scholar] [CrossRef]
- Nath, C. Integrated Tool Condition Monitoring Systems and Their Applications: A Comprehensive Review. Procedia Manuf 2020, 48, 852–863. [Google Scholar] [CrossRef]
- Wong, S.Y.; Chuah, J.H.; Yap, H.J. Technical data-driven tool condition monitoring challenges for CNC milling: A review. Int. J. Adv. Manuf. Technol. 2020, 107, 4837–4857. [Google Scholar] [CrossRef]
- Serin, G.; Sener, B.; Ozbayoglu, A.M.; Unver, H.O. Review of tool condition monitoring in machining and opportunities for deep learning. Int. J. Adv. Manuf. Technol. 2020, 109, 953–974. [Google Scholar] [CrossRef]
- Pimenov, D.Y.; Bustillo, A.; Wojciechowski, S.; Sharma, V.S.; Gupta, M.K.; Kuntoğlu, M. Artificial intelligence systems for tool condition monitoring in machining: Analysis and critical review. J. Intell. Manuf. 2022. [Google Scholar] [CrossRef]
- Mohamed, A.; Hassan, M.; M’Saoubi, R.; Attia, H. Tool Condition Monitoring for High-Performance Machining Systems—A Review. Sensors 2022, 22, 2206. [Google Scholar] [CrossRef]
- Al-Sulaiman, F.A.; Abdul Baseer, M.; Sheikh, A.K. Use of electrical power for online monitoring of tool condition. J. Mater. Process. Technol. 2005, 166, 364–371. [Google Scholar] [CrossRef]
- Yuan, J.; Liu, L.; Yang, Z.; Bo, J.; Zhang, Y. Tool wear condition monitoring by combining spindle motor current signal analysis and machined surface image processing. Int. J. Adv. Manuf. Technol. 2021, 116, 2697–2709. [Google Scholar] [CrossRef]
- Tansel, I.N.; Arkan, T.T.; Bao, W.Y.; Mahendrakar, N.; Shisler, B.; Smith, D.; McCool, M. Tool wear estimation in micro-machining—Part I: Tool usage-cutting force relationship. Int. J. Mach. Tools Manuf. 2000, 40, 599–608. [Google Scholar] [CrossRef]
- Zhu, K.; Hong, G.S.; Wong, Y.S.; Wang, W. Cutting force denoising in micro-milling tool condition monitoring. Int. J. Prod. Res. 2008, 46, 4391–4408. [Google Scholar] [CrossRef]
- Li, W.; Liu, T. Time varying and condition adaptive hidden Markov model for tool wear state estimation and remaining useful life prediction in micro-milling. Mech. Syst. Signal Process. 2019, 131, 689–702. [Google Scholar] [CrossRef]
- Li, S.; Zhu, K. In-situ tool wear area evaluation in micro milling with considering the influence of cutting force. Mech. Syst. Signal Process. 2021, 161, 107971. [Google Scholar] [CrossRef]
- Delin Liu, D.; Liu, Z.; Zhao, J.; Song, Q.; Ren, X.; Ma, H. Tool wear monitoring through online measured cutting force and cutting temperature during face milling Inconel 718. Int. J. Adv. Manuf. Technol. 2022, 122, 729–740. [Google Scholar]
- Liu, T.; Wang, Q.; Wang, W. Micro-milling tool wear monitoring via nonlinear cutting force model. Micromachines 2022, 13, 943. [Google Scholar] [CrossRef]
- Hsieh, W.; Lu, M. Application of back propagation neural network for spindle vibration based tool wear monitoring in micro milling. Int. J. Adv. Manuf. Technol. 2012, 61, 53–61. [Google Scholar] [CrossRef]
- Huang, Z.; Zhu, J.; Lei, J.; Li, X.; Tian, F. Tool wear monitoring with vibration signals based on short-time Fourier transform and deep convolutional neural network in milling. Math. Probl. Eng. 2021, 2021, 9976939. [Google Scholar] [CrossRef]
- Ma, K.; Wang, G.; Yang, K.; Hu, M.; Li, J. Tool wear monitoring for cavity milling based on vibration singularity analysis and stacked LSTM. Int. J. Adv. Manuf. Technol. 2022, 120, 4023–4039. [Google Scholar] [CrossRef]
- Sun, W.; Zhou, J.; Sun, B.; Zhou, Y.; Jiang, Y. Markov transition field enhanced deep domain adaptation network for milling tool condition monitoring. Micromachines 2022, 13, 873. [Google Scholar] [CrossRef]
- Lee, D.E.; Hwang, I.; Valente, C.M.O.; Oliveira, J.F.G.; Dornfeld, D.A. Precision manufacturing process monitoring with acoustic emission. Int. J. Mach. Tools Manuf. 2006, 46, 176–188. [Google Scholar] [CrossRef]
- Prakash, M.; Kanthababu, M. In-process tool condition monitoring using acoustic emission sensor in microendmilling. Mach. Sci. Technol. 2013, 17, 209–227. [Google Scholar] [CrossRef]
- Hu, M.; Ming, W.; An, Q.; Chen, M. Tool Wear Monitoring in Milling of Titanium Alloy Ti-6Al-4V under MQL conditions based on a new tool wear categorization method. Int. J. Adv. Manuf. Technol. 2019, 104, 4117–4128. [Google Scholar] [CrossRef]
- Twardowski, P.; Tabaszewski, M.; Wiciak-Pikuła, M.; Felusiak-Czyryca, A. Identification of tool wear using acoustic emission signal and machine learning methods. Precis. Eng. 2021, 72, 738–744. [Google Scholar] [CrossRef]
- Wan, B.-S.; Lu, M.-C.; Chiou, S.-J. Analysis of spindle AE signals and development of ae-based tool wear monitoring system in micro-milling. J. Manuf. Mater. Process. 2022, 6, 42. [Google Scholar] [CrossRef]
- Lu, M.C.; Kannatey-Asibu, E., Jr. Analysis of sound signal generation due to flank wear in turning. J. Manuf. Sci. Eng. 2002, 124, 799–808. [Google Scholar] [CrossRef]
- Ravikumar, S.; Ramachandran, K.I. Tool wear monitoring of multipoint cutting tool using sound signal features signals with machine learning techniques. Mater. Today Proc. 2018, 5, 25720–25729. [Google Scholar] [CrossRef]
- Liu, M.K.; Tseng, Y.H.; Tran, M.Q. Tool wear monitoring and prediction based on sound signal. Int. J. Adv. Manuf. Technol. 2019, 103, 3361–3373. [Google Scholar] [CrossRef]
- Hou, Y.; Sun, B.; Sun, W.; Lei, Z. Tool wear condition monitoring based on a two-layer angle kernel extreme learning machine using sound sensor for milling process. J. Intell. Manuf. 2022, 33, 247–258. [Google Scholar]
- Banda, T.; Farid, A.A.; Li, C.; Jauw, V.L.; Lim, C.S. Application of machine vision for tool condition monitoring and tool performance optimization–a review. Int. J. Adv. Manuf. Technol. 2022, 121, 7057–7086. [Google Scholar] [CrossRef]
- Yang, J.; Duan, J.; Li, T.; Hu, C.; Liang, J.; Shi, T. Tool wear monitoring in milling based on fine-grained image classification of machined surface images. Sensors 2022, 22, 8416. [Google Scholar] [CrossRef]
- Jemielniak, K.; Arrazola, P.J. Application of AE and cutting force signals in tool condition monitoring in micro-milling. CIRP J. Manuf. Sci. 2008, 1, 97–102. [Google Scholar] [CrossRef]
- Gomes, M.C.; Brito, L.C.; Bacci da Silva, M.; Antonio ˆ Viana Duarte, M. Tool wear monitoring in micromilling using Support Vector Machine with vibration and sound sensors. Precis. Eng. 2021, 67, 137–151. [Google Scholar] [CrossRef]
- Liu, X.; Zhang, B.; Li, X.; Liu, S.; Yue, C.; Liang, S.Y. An approach for tool wear prediction using customized DenseNet and GRU integrated model based on multi-sensor feature fusion. J. Intell. Manuf. 2022. [Google Scholar] [CrossRef]
- Kannatey-Asibu Jr., E.; Emel, E. Linear discriminant function analysis of acoustic emission signals for cutting tool monitoring. Mech. Syst. Signal Process. 1987, 1, 333–347. [Google Scholar] [CrossRef]
- Abellan-Nebot, J.V.; Subirón, F.R. A review of machining monitoring systems based on artificial intelligence process models. Int. J. Adv. Manuf. 2010, 47, 237–257. [Google Scholar] [CrossRef]
- Sayyad, S.; Kumar, S.; Bongale, A.; Kotecha, K.; Selvachandran, G.; Suganthan, P.N. Tool wear prediction using long short-term memory variants and hybrid feature selection techniques. Int. J. Adv. Manuf. 2022, 121, 6611–6633. [Google Scholar] [CrossRef]
- Du, R.X.; Elbestawi, M.A.; Li, S. Tool condition monitoring in turning using fuzzy set theory. Int. J. Mach. Tools Manuf. 1992, 32, 781–796. [Google Scholar] [CrossRef]
- Yao, Y.; Li, X.; Yuan, Z. Tool wear detection with fuzzy classification and wavelet fuzzy neural network. Int. J. Mach. Tools Manuf. 1999, 39, 1525–1538. [Google Scholar] [CrossRef]
- Zhu, K.; Wong, Y.S.; Hong, G.S. Multi-category micro-milling tool wear monitoring with continuous hidden Markov models. Mech. Syst. Signal Process. 2009, 23, 547–560. [Google Scholar] [CrossRef]
- Ou, J.; Li, H.; Huang, G.; Zhou, Q. A novel order analysis and stacked sparse auto-encoder feature learning method for milling tool wear condition monitoring. Sensors 2020, 20, 2878. [Google Scholar] [CrossRef] [PubMed]
- Bishop, C.M. Neural Networks for Pattern Recognition; Oxford University Press: Oxford, UK, 2007. [Google Scholar]
- Emel, E.; Kannatey-Asibu, E., Jr. Tool Failure Monitoring in Turning by Pattern Recognition Analysis of AE Signals. J. Eng. Ind. 1988, 110, 137–145. [Google Scholar] [CrossRef]
Disclaimer/Publisher’s Note: The statements, opinions and data contained in all publications are solely those of the individual author(s) and contributor(s) and not of MDPI and/or the editor(s). MDPI and/or the editor(s) disclaim responsibility for any injury to people or property resulting from any ideas, methods, instructions or products referred to in the content. |
© 2023 by the authors. Licensee MDPI, Basel, Switzerland. This article is an open access article distributed under the terms and conditions of the Creative Commons Attribution (CC BY) license (https://creativecommons.org/licenses/by/4.0/).