Abstract
Determining moisture content (MC) distribution during the drying of porous materials such as wood is crucial for developing drying schedules and assessing their suitability to achieve optimised processes. This study aimed to determine the causes of the unique drying behaviour and the well-known unusual longer drying time of western hemlock compared to other similar softwoods. In situ X-ray computed tomography (CT) was used to study the evolution of MC in timber during the drying process. The drying behaviour of western hemlock (Tsuga heterophylla (Raf.) Sarg.) was compared with Norway spruce (Picea abies (L.) Karst.) and Scots pine (Pinus sylvestris L.) from green to oven-dried condition with industry-proposed drying schedules used for steering a custom-made experimental kiln combined with a CT scanner. CT scanning was performed at 30 min intervals during the complete drying period of 30 h, and the CT images were processed to calculate the MC evolution within the specimen. Western hemlock showed a considerably slower capillary-phase drying and did not go into the transition and diffusion phases when a schedule adapted to pine and spruce drying was applied for its drying. CT images and MC gradient calculations showed a lower drying rate and severe non-uniformity in MC distribution, which could be due to the effect of higher green MC and the presence of wet pockets. Furthermore, the evaporation front at the first 5 h of drying receded faster into the hemlock specimen, and as drying proceeded, it slowed down compared to other specimens.
1. Introduction
The reduction in the moisture content (MC) of green sawn timber is inevitable due to the hygroscopic nature of wood, which will absorb or desorb water depending on the surrounding conditions. It is also crucial in order to reach the required mechanical properties of wooden products, lower weight, etc. [1,2]. Desorption or adsorption of water in wood under a certain MC level, known as the fibre saturation point (FSP), is associated with shrinkage and swelling, respectively, which causes stresses in the wood material that may result in distortion and cracking of the sawn timber. Drying of sawn timber must thus be performed in a controlled way to reduce the undesired consequences of water removal. Kiln drying is the most common industrial method to dry softwood timbers, and it is performed on large volumes of green sawn timber by blowing air through the timber packages placed in the kiln. The timber is stacked with a defined distance between each layer of timber, and the air condition in the kiln is regulated by adjusting temperature and relative humidity (RH) over time. Psychrometric measurements are achieved for monitoring the process, which is set through the so-called drying schedule, which regulates these parameters with the aim of reaching a final target MC of the timber without causing distortion, cracking, or other quality lowering changes of the sawn timber.
Green wood contains liquid water in the cell lumen (free water) and water chemically bonded to the cell wall (bound water). At the initial stages of the drying process, the so-called capillary regime, liquid water is transported from the inner parts of the wood to the surface, where it evaporates. As the moisture level is lowered and the FSP is reached, the moisture transport transitions into being diffusion-driven when the bound water is removed [3].
The anatomical structure of a tree can be divided into the sapwood, which is the outermost part that transports water from the roots to the leaves, and into heartwood, which is the central part of the stem that does not transport free water. Nevertheless, the structure and properties of wood vary largely between species and within a single tree, making it complicated to extrapolate drying methods, as different woods may absorb or desorb water differently before reaching the equilibrium moisture content (EMC). Western hemlock, growing in coastal regions of North America [4], and Norway spruce and Scots pine, growing in Scandinavia, are common softwood species used in sawmilling, with very extended use in timber engineering. However, western hemlock has been considered more difficult to dry than the Scandinavian-grown Norway spruce and Scots pine, and the reasons for that have been suggested to be a higher initial MC in green conditions, a higher extractive content, and a lower permeability [5,6]. A motive for this study is that when drying technologies from Scandinavia were transferred to North America, the drying times for hemlock were reported to be approximately twice those for spruce and pine. This unexpected behaviour was surprising, given that these three species are softwoods with a close range of density values. Literature records show that hemlock is prone to a phenomenon known as wet pockets (also known as wet wood or sinker wood), formed mainly due to bacterial infection in the living tree, and occurs mostly in the heartwood and in the transition zone between heartwood and sapwood [5,7]. Wet pockets manifest during drying as localised regions within the timber with significantly higher MC, often above FSP; meanwhile, other regions are well below it. This could be one of the causes for the drying of hemlock to be considerably more time-consuming than spruce and pine.
In practice, wet pockets are assumed to be the reason for increased drying time, higher energy consumption, and non-uniform final MC of the timber, which may cause quality-reducing defects in drying. Kozlic et al. [8] found extractive subtraction by dissolving in chemical composition to be more effective in achieving uniformed final MC than raising the temperature. Ward et al. [9] confirmed Kozlic’s results and observed a reduced presence of wet pockets in young western hemlock trees and proposed sorting the timber prior to drying according to MC, preferably determined by using electrical resistance MC meters. Modern tools such as machine learning and stochastic models are applied prior to drying to sort western hemlock timbers based on the initial MC with the goal of achieving homogeneity in the final MC [10,11,12]. Implementing post-drying equalisation of the MC may be effective in preventing non-uniformity in the MC levels by decreasing dry bulb temperature, which leads to reducing over-drying, while it prolongs drying time [13]. Berberović et al. [14] found an inverse correlation between basic density and heartwood percentage of hemlock on drying rate, while initial MC was positively correlated. Chaffe et al. [15] also reported pit aspiration causing a reduction in diffusion coefficient as a possible reason for the slow drying rate.
X-ray computed tomography (X-ray CT) is one of the most accurate non-destructive methods utilised in industry for measuring the inner properties of logs. X-ray CT detects the density of a material, which can be used to evaluate density distribution, and on a lab-scale, can also be used to determine the MC distribution in the entire timber volume. Different methods for determining MC precisely from CT data have been investigated [16]. Analysing CT data would also lead to enhancing our comprehension of the effect of important parameters in drying behaviour, such as temperature and density, by improving the numerical modelling of moisture gradients and flow speed, especially in transition, diffusion, and conditioning regimes [17].
The objective of this study was to determine the causes of the well-known longer drying time and drying behaviour (wet pockets) for western hemlock compared to Norway spruce and Scots pine using X-ray computed tomography (CT), a technology that allows for internal imaging of the wood structure due to density variations, combined with timber drying in a custom-made experimental drying kiln. Developing the knowledge of the dominant wood-drying regime by utilising CT image processing can lead to providing an optimised drying schedule that minimises energy consumption. The drying behaviour of heartwood and sapwood of the three species was studied for pine and spruce industrial drying schedules. Furthermore, a comparative assessment was conducted to determine if high green MC and wet pockets of western hemlock were visible and if they affected the drying rate and regimes.
2. Materials and Methods
A total of three specimens of western hemlock, two specimens of Norway spruce, and one specimen of Scots pine with the size of 500 × 80 × 36 mm were selected based on their sapwood and heartwood content, aiming to obtain specimens with almost more than 90% volume of the content of either heartwood or sapwood. During the process of sampling, storage in the freezer, and handling, there were measures taken to prevent any undesired loss of moisture prior to the experiments. The wood specimens were wrapped in plastic and stored in a freezer. The cross-sectional ends of the specimens were covered in heat-resistant silicone to prevent drying in the longitudinal direction during the experiments, thereby avoiding the “end-effects”. As indicated in Figure 1, the green specimens were thawed in water just before the drying experiment started to maintain surface MC during the start-up of the dryer.
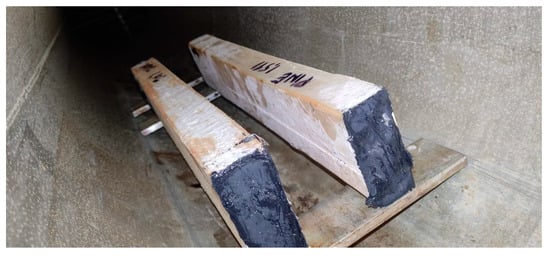
Figure 1.
Specimens in the drying chamber. The white layer on the surfaces is ice due to the water thawing.
2.1. Gravimetric MC Measurements
The green MC of all the specimens was determined with the gravimetric method [18]:
where MG and MOD are the green and the oven-dried weight, i.e., the weight at 0% MC, respectively. These values are tabulated in Table 1, and they are in the range of values mentioned in the Forest Products Laboratory’s Wood Handbook [18].

Table 1.
Specimens’ green moisture content at the start of the drying experiments (MC0).
2.2. Kiln Drying and CT Scanning
This study was carried out by using a custom-made drying kiln coupled with a medical CT scanner installed at Luleå University of Technology (LTU) in Skellefteå, as shown in Figure 2.
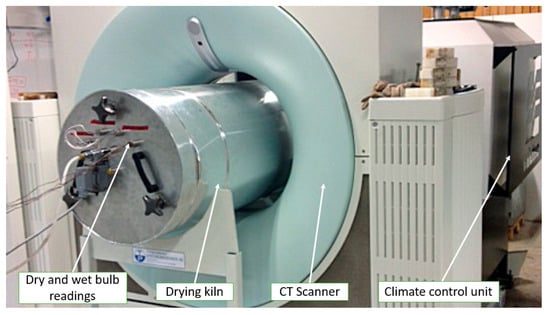
Figure 2.
Kiln drying and simultaneously CT scanning at Luleå University of Technology.
The drying kiln is made of aluminium to allow for X-rays passing the envelope. The volume of the tube is approx. 0.3 m3. The heating coils have a capacity of 3 kW; the airflow is provided by a 5 kW electric motor-driven fan that can be adjusted by variable frequency drive between 1 to 8 m/s. The temperature range of the kiln is from room temperature to 220 °C, and dry-bulb and wet-bulb temperature readings monitor the relative humidity. Moist air is extracted from the kiln through venting. The software controlling the drying parameters is Valmatics 4.0 [Valutec AB, Skellefteå, Sweden].
A medical Siemens Somatom Emotion CT scanner [Siemens, Munich, Germany] was used in combination with the drying kiln. Two-dimensional CT images of the timber cross section were taken at 0.5 h time intervals with a pixel resolution of 1.7 pixels per mm.
2.3. Drying Schedule
Figure 3 presents the drying schedules implemented in the industry (Valutec AB) for spruce and pine and applied in this experiment to reach a target MC of 18% in all drying runs.
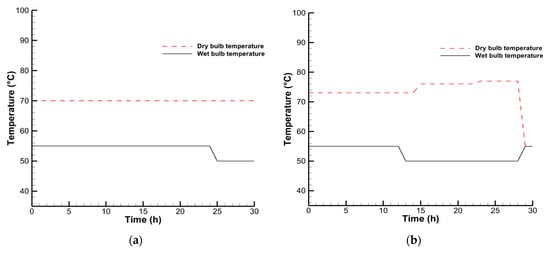
Figure 3.
Drying schedules used in the experiments for drying runs: (a) hemlock/pine sapwood (I), and (b) hemlock/spruce heartwood and hemlock/spruce sapwood (II and III).
2.4. MC Calculations from the CT Images
The CT images of specimen cross sections were converted into density images by calibrating them with water and air phantoms included in the scanning zone, and the MC was calculated in a Python algorithm for the advanced image processing, which transformed the shrinkage deformation/distortion of the specimens due to shrinkage occurring below FSP to the shape in green state (registration transformation) [19,20]. This transformation is necessary for the comparison of a specific region within a specimen at two different MCs, where the drying has resulted in a MC change that, in turn, has caused shrinkage and distortion of the specimen. These calculated MC values from the image processing of CT data are compared with the MC measured according to the gravimetric method:
where MCOD is the gravimetrically obtained MC, and MCCT is the MC obtained through the processing of the CT images.
2.5. Drying Rate
The drying rate is here defined as the proportion of evaporable water during each time step of the drying process [8]:
where E is the fraction of evaporable water left in the wood; MC is the current moisture content of the specimen at any given time t during the drying; EMC1 and MC0 are the equilibrium moisture content under the specific drying conditions (climate) and the moisture content at the beginning of the drying of the wood, respectively.
2.6. Moisture Gradient
The MC gradient is a parameter capable of providing a more comprehensive explanation of the influence of wet pockets on drying behaviour, specifically within the heartwood of hemlock and spruce specimens. For this aim, the Esping method [21] is implemented by dividing specimens’ cross sections into sections, which calculate the MC gradient (MCgrad) by taking the maximum and average MC of each section, and can be formulated as follows:
where MCmax and MCavg state the maximum and average values of MC in each section of the specimen.
3. Results and Discussions
3.1. Average MC Loss
The average MC loss during the drying runs I, II, and III is shown in Figure 4. As expected, Scots pine sapwood dries faster than hemlock to the target MC (Figure 4a), while for hemlock, it did not reach even FSP, which was reported to be around 17% [22]. It can be observed that below the FSP, the steepness of the MC curve for pine is reduced, showing the lower drying rate of the diffusion regime. Figure 4b indicates that the slope of the MC loss curves for hemlock and spruce heartwood is similar, while spruce heartwood reached the target MC faster than the hemlock heartwood. The specimen of hemlock sapwood cracked significantly during the drying test, which meant that the moisture content could not be calculated reliably based on the CT measurements. Therefore, this specimen has been excluded from the results analysis, as can be seen in Figure 4c. There is, however, an evident difference in drying behaviour between spruce heartwood and spruce sapwood, where the sapwood drying occurred initially under the effect of heat transfer with the evaporation of free liquid water, while in heartwood, most of the time, it is a diffusion regime where there is no free water (Figure 4b,c).
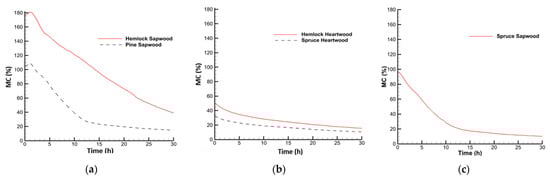
Figure 4.
Average MC distribution for (a) hemlock/pine sapwood, (b) hemlock/spruce heartwood, and (c) spruce sapwood.
Table 2 shows the comparison of green MC measurements obtained through the gravimetric method and CT method for the three drying runs according to Equation (2), which shows the differences between the two methods. Error values are below 4.5% between the gravimetrically measured MC calculation and the average MC from CT image processing. As already mentioned, substantial cracks appeared during the drying of hemlock sapwood in drying run III, which makes it not feasible to analyse the MC changes with good precision, and CT images could not be processed for bringing into the discussions.
Table 2.
The errors of the MC were obtained from the CT-processed images as a percentage of the gravimetrically measured MC.
3.2. MC Distribution
Figure 5 shows the pixel-wise MC calculated from the density-based CT images for three drying runs for each 5 h of drying up to 30 h, and as explained, the last drying run only included spruce sapwood.
In all drying runs, pine and spruce reached the desired target MC and capillary, transition, and diffusion regimes occurred. The moisture reduction starts from the sawn-timber surfaces, creating a drier “shell”. Liquid water migrates from the inner regions of the specimens toward their surface (the capillary phase). The water undergoes rapid evaporation on the specimen’s surface, faster than new water is added to this region, creating the “shell”. The dominant heat-transfer regime is convection through air, which is needed to transport the evaporated water away from the specimen. As drying continued and liquid free water reduced, the diffusion phase with conduction-dominated heat transfer was governed, which, because of the high initial MC of hemlock sapwood, after 30 h liquid water observed in the images, proved that it was still in the capillary phase.
Figure 5a shows that once the surface has dried out in both pine and hemlock specimens, the evaporation front recedes deeper towards the centre of the timber, resulting in the formation of a dry layer on the surface and a still moist core. This recession is faster for pine compared with hemlock except for the first 5 h of the drying process, so it can be inferred that two different drying behaviours occurred in hemlock compared to pine. When the moisture content moved from above FSP to below FSP for pine, the drying process was slowed down. This can be observed in pine specimens for around 10 h and 15 h, which showed free water discontinuity in the pine and implies a transition to diffusion known as irreducible saturation, where shrinkage begins on the outer region of the timber. However, the hemlock specimen remained at the capillary regime. As can be seen, it might be said that the MC distribution and changes in hemlock sapwood are uniform during the drying, and there is no abnormal local high MC, which can be inferred as the absence of wet pockets. At the same time, a high initial MC impacts on prolonging the drying time.
Figure 5b indicated MC loss of spruce and hemlock heartwood, where spruce reaches the desired target MC while hemlock has abnormally high MC regions (wet pockets), which makes it have high MC resistance to drying in some regions, even when other regions are below FSP or target MC, as shown in 20 h of drying. This specimen faces overdrying and high local MC issues, which enhance drying stress and defects. Permeability is a critical factor in wood drying, especially during the initial stages when water migrates to the surface of the wood through capillary flow. As the drying process progresses, the permeability diminishes due to pit aspiration [23]. Apart from the inherent higher initial MC and wet pockets, lower permeability in hemlock sapwood and heartwood compared with spruce in all directions could be another reason for having prolonged drying time [24,25]. The behaviour of the evaporation front is not like the first run, and it can be said that in all drying times, it recedes slower into hemlock heartwood compared to spruce heartwood.
Figure 5c shows that the MC change for the spruce sapwood specimen started from high green MC, which achieved the desired target MC uniformly with the proposed drying schedule. Compared with drying spruce heartwood specimens, it can be seen that free water in sapwood is the reason for having a more extended capillary regime than heartwood species, which mostly is bound water diffusion-controlled.
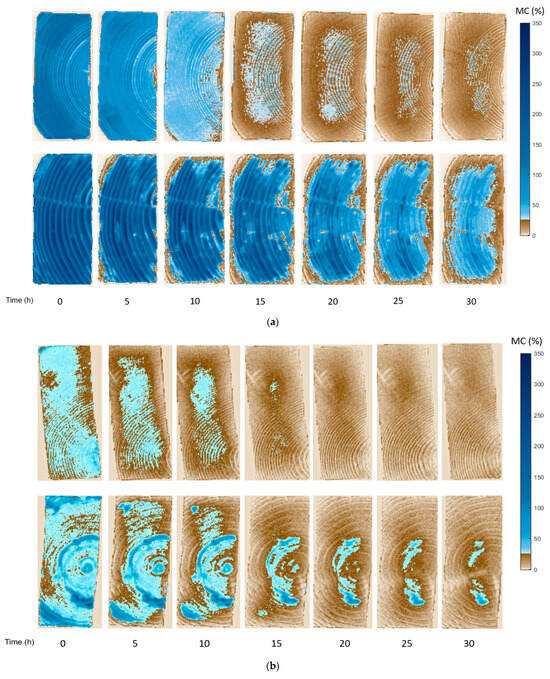
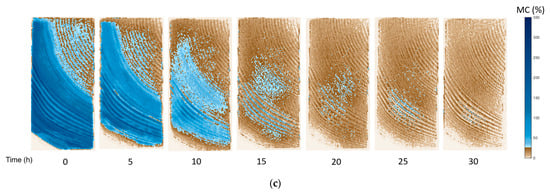
Figure 5.
CT images of MC change during drying runs of (a) pine (above)/hemlock (below) sapwood, (b) spruce (above)/hemlock (below) heartwood, and (c) spruce sapwood.
3.3. Drying Rate
To obtain a more comprehensive assessment of the differences in drying behaviour among the specimens, calculating the drying rate (E) according to Equation (3) can provide a more insightful perspective.
It can be observed in Figure 6a that during the initial hour of drying, there is a minor rise in E. This increase can be because the wood absorbs moisture from the surrounding environment. At the beginning of the drying process, the wet-bulb temperature was lower than the temperature on the timber surface, but after reaching equilibrium, it began to decrease, and the evaporation front started to recede into the wood [26]. In the first drying run, approximately 1.5 h was required for beginning the MC decrement and warming up the equipment; however, for the second drying run (Figure 6b), this time was not needed since the kiln was already settled and warmed up from the first run. Since the last hour of the drying schedule of spruce heartwood was assigned for conditioning and a higher value of EMC, to have a unified MC distribution in the specimens, drying did not occur, and E went to zero, which does not imply that there was no evaporable water left in the specimens. Figure 6a shows that as the drying process progressed, the residual evaporable water within the specimens was close. After approximately 5 h, the difference in E value between the specimens increased dramatically. Pine sapwood showed faster water evaporation than hemlock, which also corresponds with what was observed in CT images where in the first 5 h of drying, the evaporation front receded faster into the hemlock sapwood. Afterwards, it slowed down compared with pine. This phenomenon can be explained by the lower permeability and porosity that obstructed void spaces within the hemlock and restricted the movement of liquid water towards the surface. This behaviour repeated for the second run, and the value of E was lower for spruce heartwood in all drying times, while there is not much difference in the steepness of the graphs, and CT images showed regions with abnormally high MC for hemlock that the E value can’t represent, and MC gradient investigation is needed.
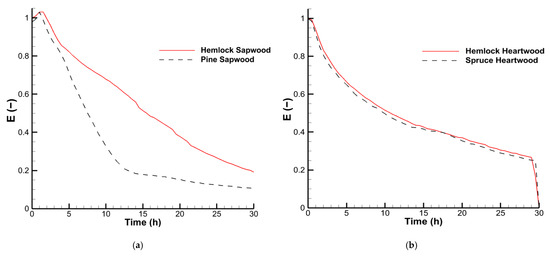
Figure 6.
Evaporable water left in the specimens, i.e., drying rate (E): (a) hemlock/pine sapwood, and (b) hemlock/spruce heartwood.
3.4. MC Gradient
As demonstrated in Figure 7, in the CT measurements, each section of the specimen covers three pixels with the size of 0.5892 mm in the x direction and the whole of the y direction.
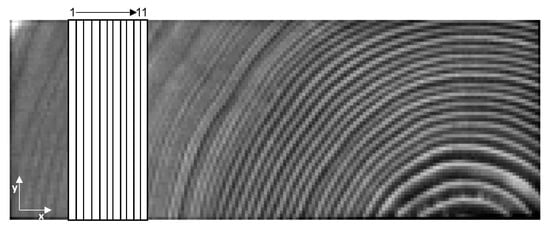
Figure 7.
Sections for the calculation of MC gradients.
By evaluating E trends, since the curve steepness between the species is close, the MC gradient approach provides a more comprehensive elucidation regarding the presence of wet pockets, which most likely occurred in the heartwood. Figure 8a demonstrates the MC gradients calculated by Equation (4) for spruce and hemlock heartwood in four drying times and demonstrates that values of MC gradients in most of the drying times and sections are more intense in hemlock than the spruce, up to even six times higher in some sections. By comparing the MC gradient of spruce (Figure 8a), it can be inferred that as the drying process progressed, MC distribution tended towards greater uniformity, and 5 h MC gradient in most of the sections was exceeded over the 20 h when the specimens were dried. This behaviour cannot be observed in the hemlock specimen (Figure 8b) since, in distinct regions, the transition occurred from the capillary into diffusion-dominated regimes, while the rest is still in a capillary-controlled state, and the MC gradient becomes more intense in 20 h even compared with 5 h, which showed unusual resistance to drying that may indicate wet pocket presence.
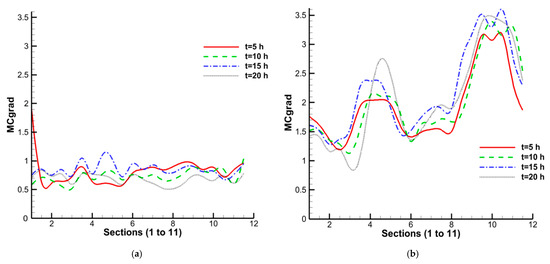
Figure 8.
MC gradients in cross section of (a) spruce heartwood and (b) hemlock heartwood.
4. Conclusions
The purpose of this study was to determine the causes of the unique drying behaviour and the well-known longer drying time of western hemlock compared to Norway spruce and Scots pine. Due to a higher initial moisture content and the presence of wet pockets, particularly in the heartwood, hemlock fails to achieve the target moisture content when subjected to the same drying schedule as Norway spruce and Scots pine. Different drying behaviours were observed for hemlock sapwood, i.e., the evaporation front receded faster into the specimen compared with pine sapwood in the first 5 h, and after that, this receding slowed down. Analysing MC gradients of hemlock heartwood indicated regions with abnormally high MC, known as wet pockets. Average MC did not provide comprehensive information on drying behaviour and necessitated the utilisation of moisture content gradient analysis.
A drying schedule adapted for timber prone to create wet pockets may result in over-drying for species not prone to the presence of wet pockets, if mixed timber species are dried together in the same kiln. It is also recommended to sort hemlock timbers before drying into high-content sapwood and high-content heartwood, respectively, and adapt the drying schedule to the type of wood. This approach aims to mitigate the challenge of non-uniformity in MC. Additionally, for heartwood stacks, suitable conditioning measures need to be implemented.
Further research can be implemented by providing a drying schedule suited for hemlock heartwood and sapwood on a lab scale and applying the related schedules with MC gradient measurements on an industrial scale, which was the limitation of this study due to the lack of hemlock specimens.
Author Contributions
Conceptualisation, E.H. and J.C.; methodology, E.H., J.C., L.H. and D.S.; software, L.H. and E.H.; validation, E.H., J.C., L.H. and D.S.; formal analysis, E.H.; investigation, E.H.; writing—original draft preparation, E.H.; writing—review and editing, E.H., J.C., L.H. and D.S.; visualisation, E.H.; supervision, D.S. All authors have read and agreed to the published version of the manuscript.
Funding
This research received no external funding.
Institutional Review Board Statement
Not applicable.
Informed Consent Statement
Not applicable.
Data Availability Statement
Not applicable.
Conflicts of Interest
The authors declare no conflict of interest.
References
- Sehlstedt-Persson, M. Impact of Drying and Heat Treatment on Physical Properties and Durability of Solid Wood. Ph.D. Thesis, Luleå University of Technology, Wood Science and Engineering, Skellefteå, Sweden, 2008. [Google Scholar]
- Yin, Q.; Liu, H.-H. Drying stress and strain of wood: A review. Appl. Sci. 2021, 11, 5023. [Google Scholar] [CrossRef]
- Niemz, P.; Teischinger, A.; Sandberg, D. Springer Handbook of Wood Science and Technology; Springer Nature: Cham, Switzerland, 2023. [Google Scholar]
- Jozsa, L.; Munro, B.; Gordon, J.R. Basic Wood Properties of Second-Growth Western Hemlock; Special Publication SP-38; Forintek Canada Corp.: Fredericton, NB, Canada, 1998. [Google Scholar]
- Shahverdi, M.; Oliveira, L.; Avramidis, S. Kiln-drying optimisation for quality pacific coast hemlock timber. Dry. Technol. 2017, 35, 1867–1873. [Google Scholar] [CrossRef]
- Moya, R.; Muñoz, F.; Jeremic, D.; Berrocal, A. Visual identification, physical properties, ash composition, and water diffusion of wetwood in Gmelina arborea. Can. J. For. Res. 2009, 39, 537–545. [Google Scholar] [CrossRef]
- Ward, J.C.; Pong, W.Y. Wetwood in Trees: A Timber Resource Problem; General Technical Report PNW-112; US Department of Agriculture, Forest Service, Pacific Northwest Forest and Range Experiment Station: Portland, OR, USA, 1980; p. 60. [Google Scholar]
- Kozlik, C.J. Problems of drying western hemlock heartwood to a uniform final moisture content. In Proceedings of the 21st Annual Meeting of Western Dry Kiln Clubs; Washington-Idaho-Montana Seasoning Club: Missoula, MT, USA, 1970; pp. 55–61. [Google Scholar]
- Ward, J.C.; Kozlik, C.J. Kiln drying sinker heartwood from young-growth western hemlock: Preliminary evaluation. In Proceedings of the 26th Annual Meeting of Western Dry Kiln Clubs; Oregon State University: Corvallis, OR, USA, 1975; pp. 44–63. [Google Scholar]
- Rahimi, S.; Avramidis, S.; Lazarescu, C. Estimating moisture content variation in kiln dried Pacific coast hemlock. Holzforschung 2022, 76, 26–36. [Google Scholar] [CrossRef]
- Rahimi, S.; Nasir, V.; Avramidis, S.; Sassani, F. Benchmarking moisture prediction in kiln-dried Pacific Coast hemlock wood. Int. Wood Prod. J. 2022, 13, 219–226. [Google Scholar] [CrossRef]
- Elustondo, D.; Avramidis, S. Stochastic numerical model for conventional kiln drying of timbers. J. Wood Sci. 2003, 49, 485–491. [Google Scholar] [CrossRef]
- Rohrbach, K.; Oliveira, L.; Avramidis, S. Drying schedule structure and subsequent post-drying equalisation effect on hemlock timber quality. Int. Wood Prod. J. 2014, 5, 55–64. [Google Scholar] [CrossRef]
- Berberović, A.; Milota, M.R. Impact of wood variability on the drying rate at different moisture content levels. For. Prod. J. 2011, 61, 435–442. [Google Scholar] [CrossRef]
- Chafe, S.A. Relationship between equilibrium moisture content and specific gravity in wood. J. Inst. Wood Sci. 1991, 12, 119–122. [Google Scholar]
- Hansson, L.; Couceiro, J.; Fjellner, B.-A. Estimation of shrinkage coefficients in radial and tangential directions from CT images. Wood Mater. Sci. Eng. 2017, 12, 251–256. [Google Scholar] [CrossRef]
- Florisson, S.; Hansson, L.; Couceiro, J.; Sandberg, D. Macroscopic X-ray computed tomography aided numerical modelling of moisture flow in sawn timber. Eur. J. Wood Wood Prod. 2022, 80, 1351–1365. [Google Scholar] [CrossRef]
- Ross, R.J. Wood Handbook: Wood as an Engineering Material; General Technical Report FPL-GTR-282; Department of Agriculture, Forest Service: Madison, WI, USA, 2021. [Google Scholar]
- Hansson, L.; Cherepanova, E. Determination of wood moisture properties using a CT-scanner in a controlled low-temperature environment. Wood Mater. Sci. Eng. 2012, 7, 87–92. [Google Scholar] [CrossRef]
- Poupet, B.; Couceiro, J.; Florisson, S.; Hansson, L.; Sandberg, D. Estimation of moisture distribution in sawn timber using computed tomography. In Proceedings of the WCTE 2023—2023 World Conference on Timber Engineering, Oslo, Norway, 19–22 June 2023. 7p. [Google Scholar]
- Esping, B. Trätorkning 2: Torkningsfel-åtgärder. [Wood Drying 2: Drying Failure and Actions]; Swedish Institute of Wood Technology Research (Trätek): Stockholm, Sweden, 1988. (In Swedish) [Google Scholar]
- Koumoutsakos, A.; Avramidis, S. Mass transfer characteristics of western hemlock and western red cedar. Holzforschung 2002, 56, 185–190. [Google Scholar] [CrossRef]
- Hansmann, C.; Wimmer, R.; Teischinger, A. Permeability of wood—A review. Drev. Vysk. 2002, 47, 1–16. [Google Scholar]
- Rayirath, P.; Avramidis, S. Some aspects of western hemlock air permeability. Maderas. Cienc. Y Tecnol. 2008, 10, 185–193. [Google Scholar]
- Moore, J. Wood Properties and Uses of Sitka Spruce in Britain; Research Report; Forestry Commission: Edinburgh, Scotland, 2011; 60p. [Google Scholar]
- Pang, S.; Wiberg, P. Model predicted and CT scanned moisture distribution in a Pinus radiata board during drying. Holz Als Roh-Und Werkst. 1998, 56, 9–14. [Google Scholar] [CrossRef]
Disclaimer/Publisher’s Note: The statements, opinions and data contained in all publications are solely those of the individual author(s) and contributor(s) and not of MDPI and/or the editor(s). MDPI and/or the editor(s) disclaim responsibility for any injury to people or property resulting from any ideas, methods, instructions or products referred to in the content. |
© 2023 by the authors. Licensee MDPI, Basel, Switzerland. This article is an open access article distributed under the terms and conditions of the Creative Commons Attribution (CC BY) license (https://creativecommons.org/licenses/by/4.0/).