


Non-Contact Monitoring of Operating Conditions for Solar Cells in a Photovoltaic Module Using a Surface Potential Meter for Detecting the Risk of Fire


Abstract
:Featured Application
Abstract
1. Introduction
- Inexhaustible energy source
- 2.
- Maintenance, automation, and uncrewed operations are easy.
- 3.
- Installation locations are not limited.
- 4.
- Because of its modular structure, it is suitable for mass production and has a considerable scale advantage.
2. Materials and Methods
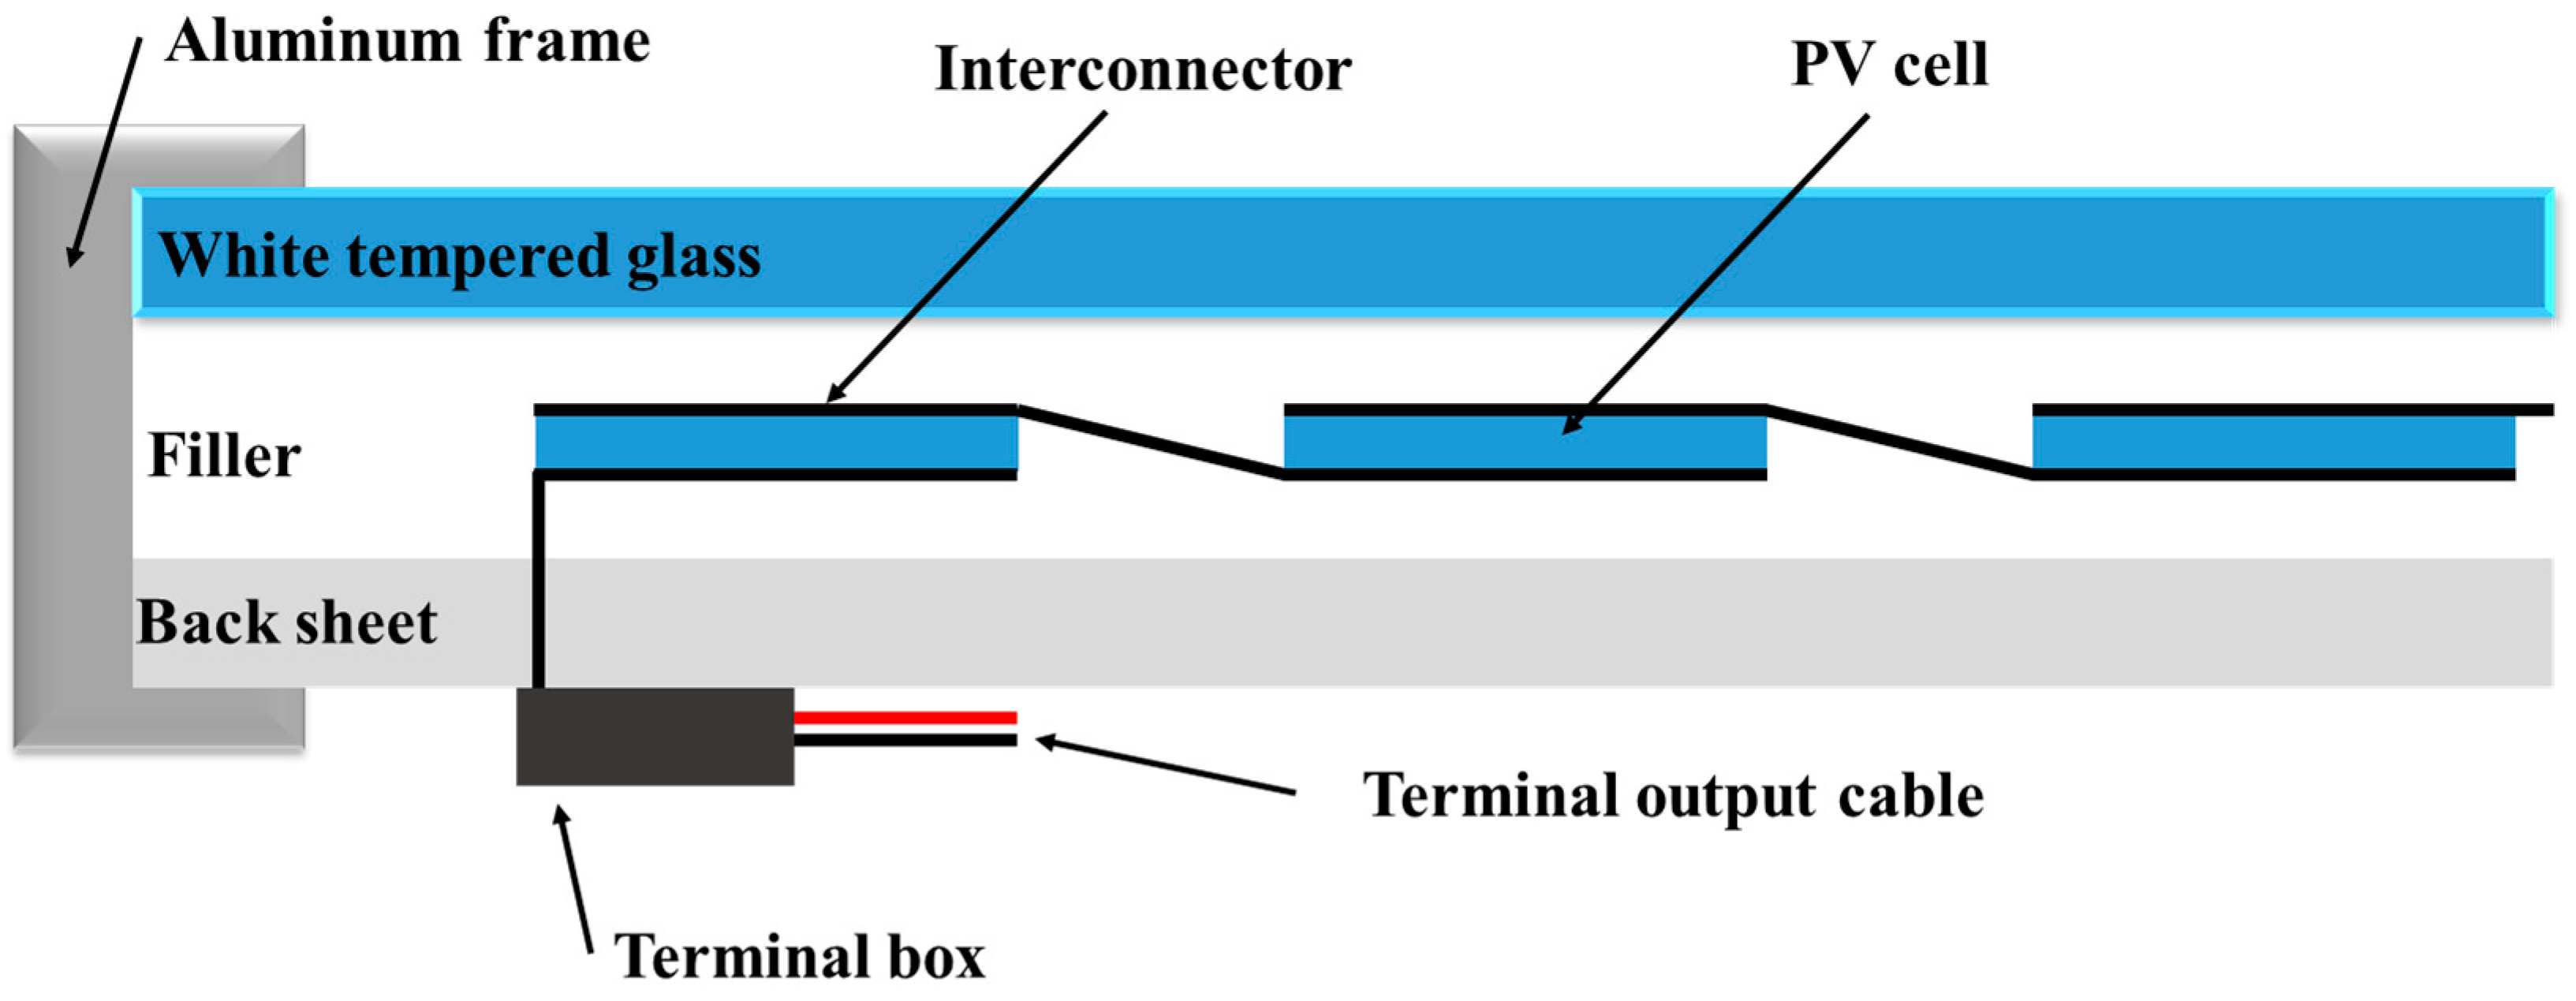
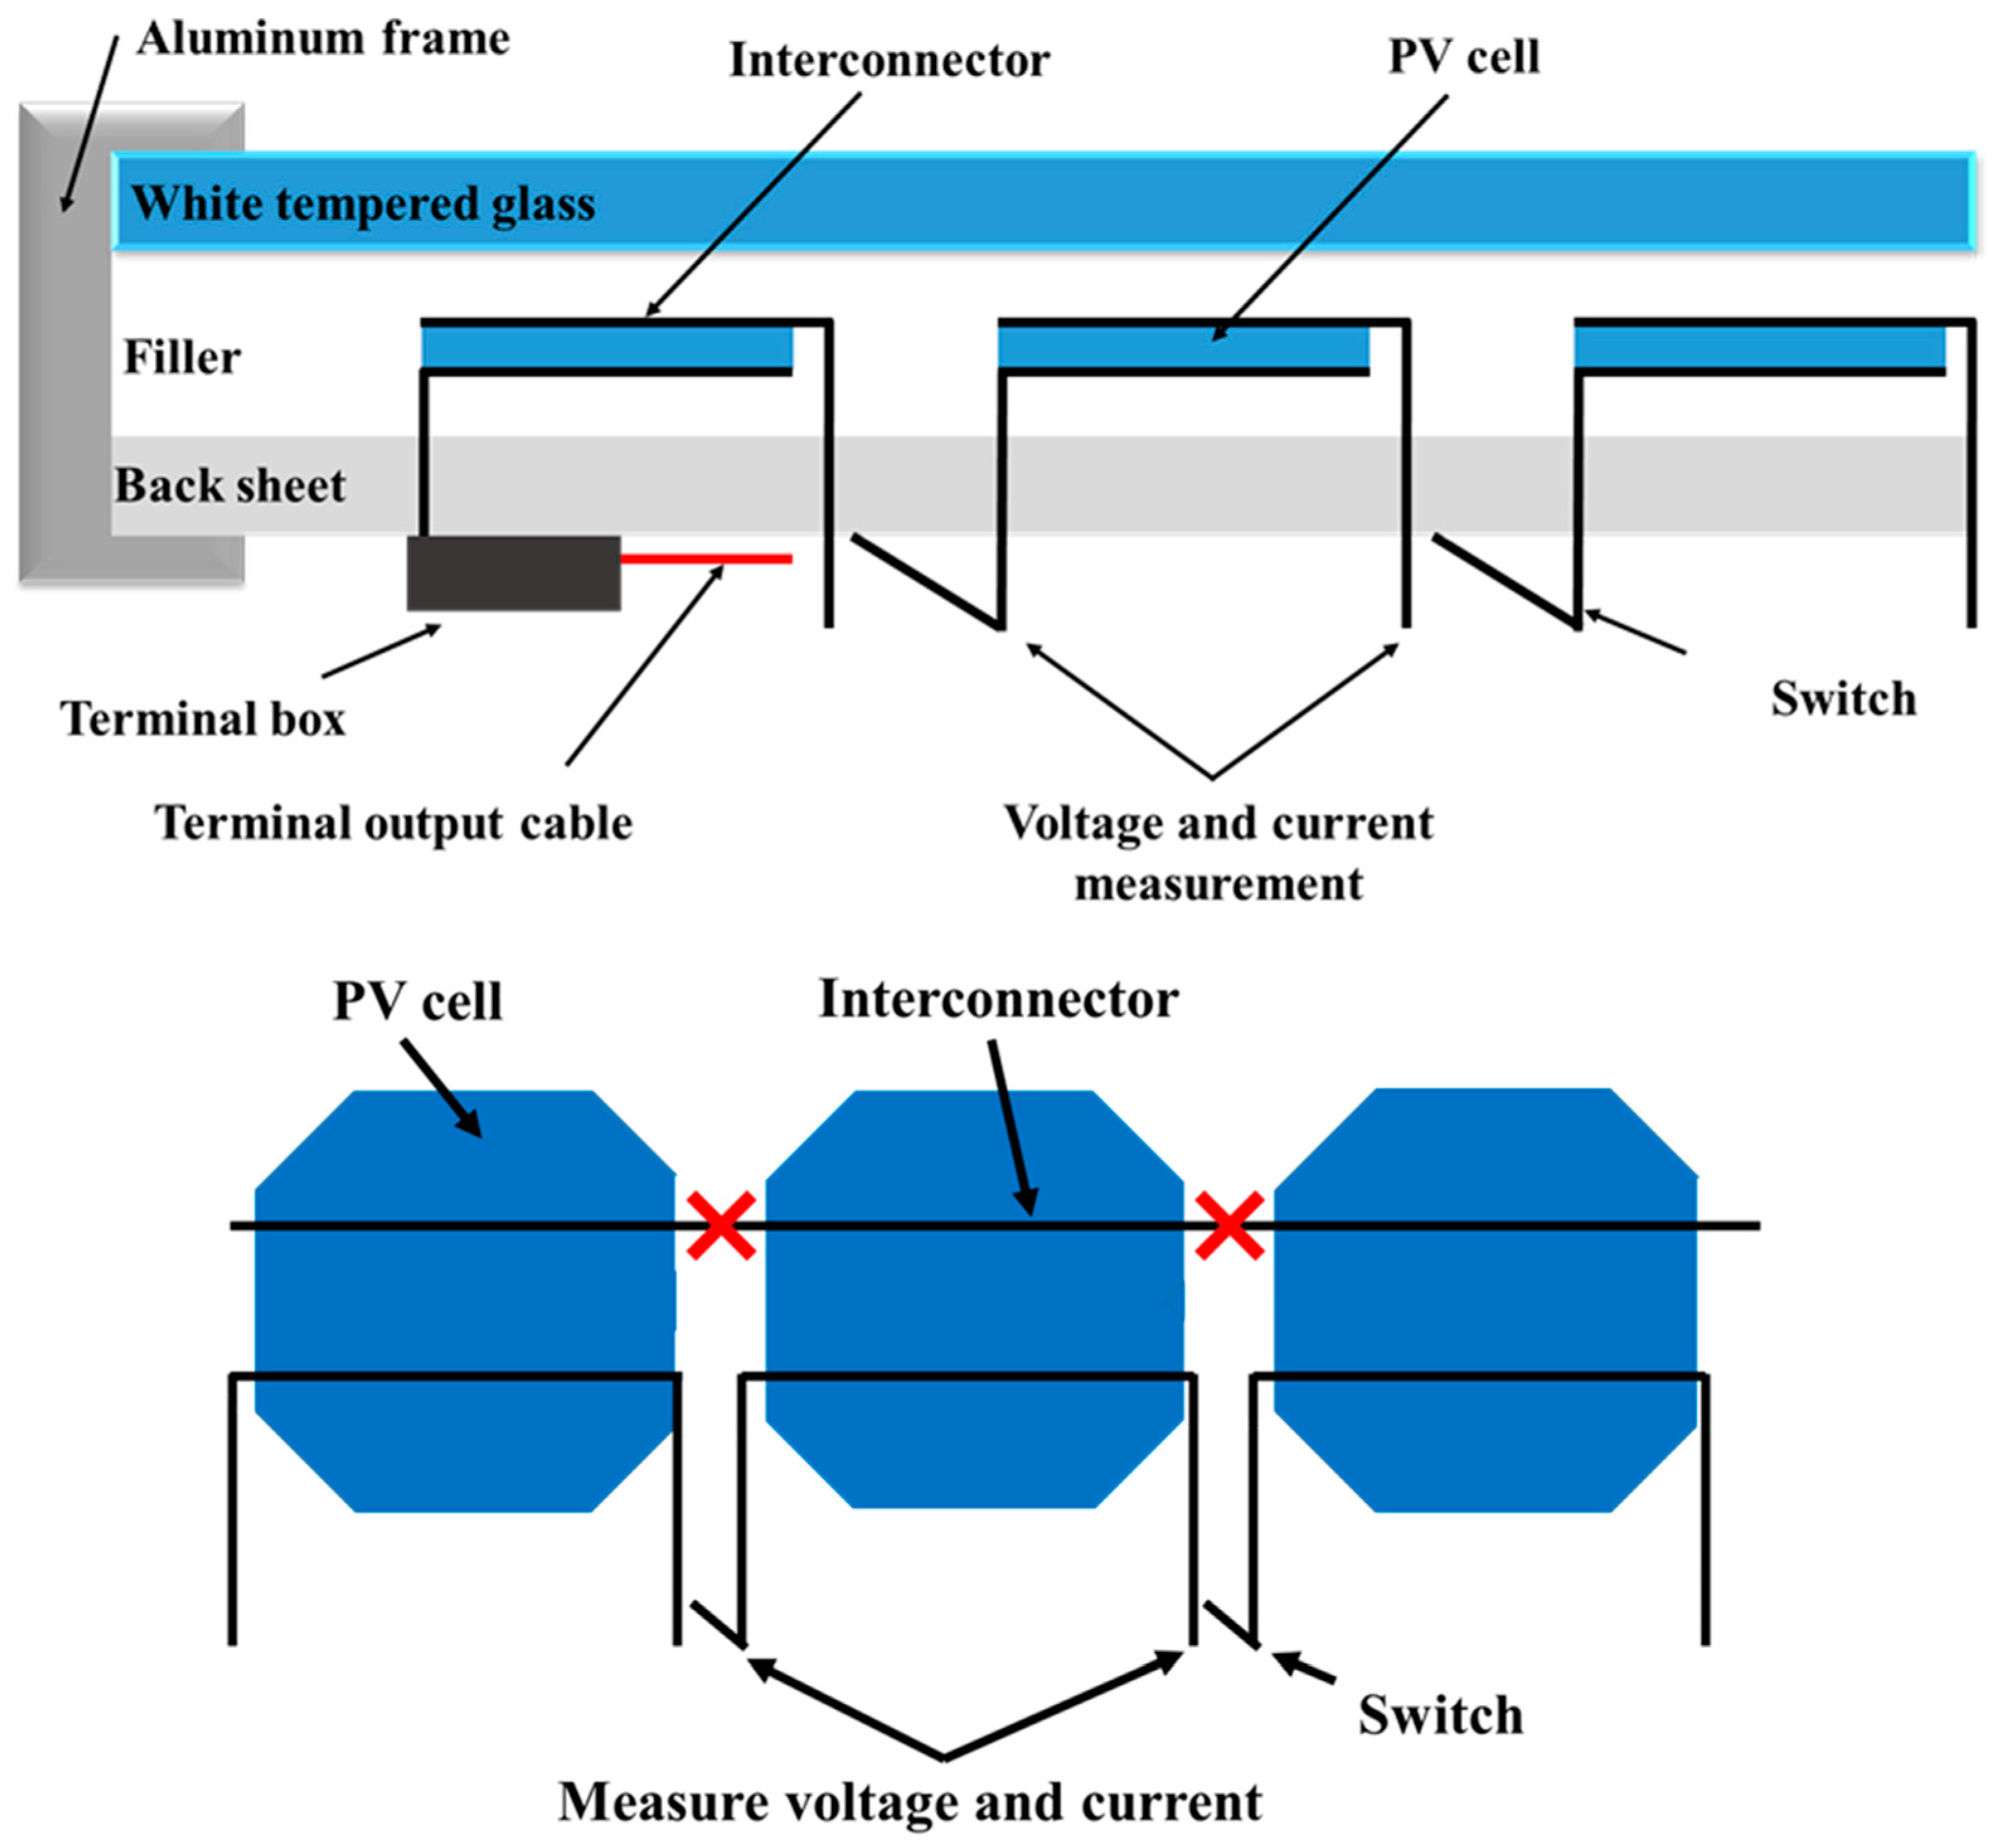
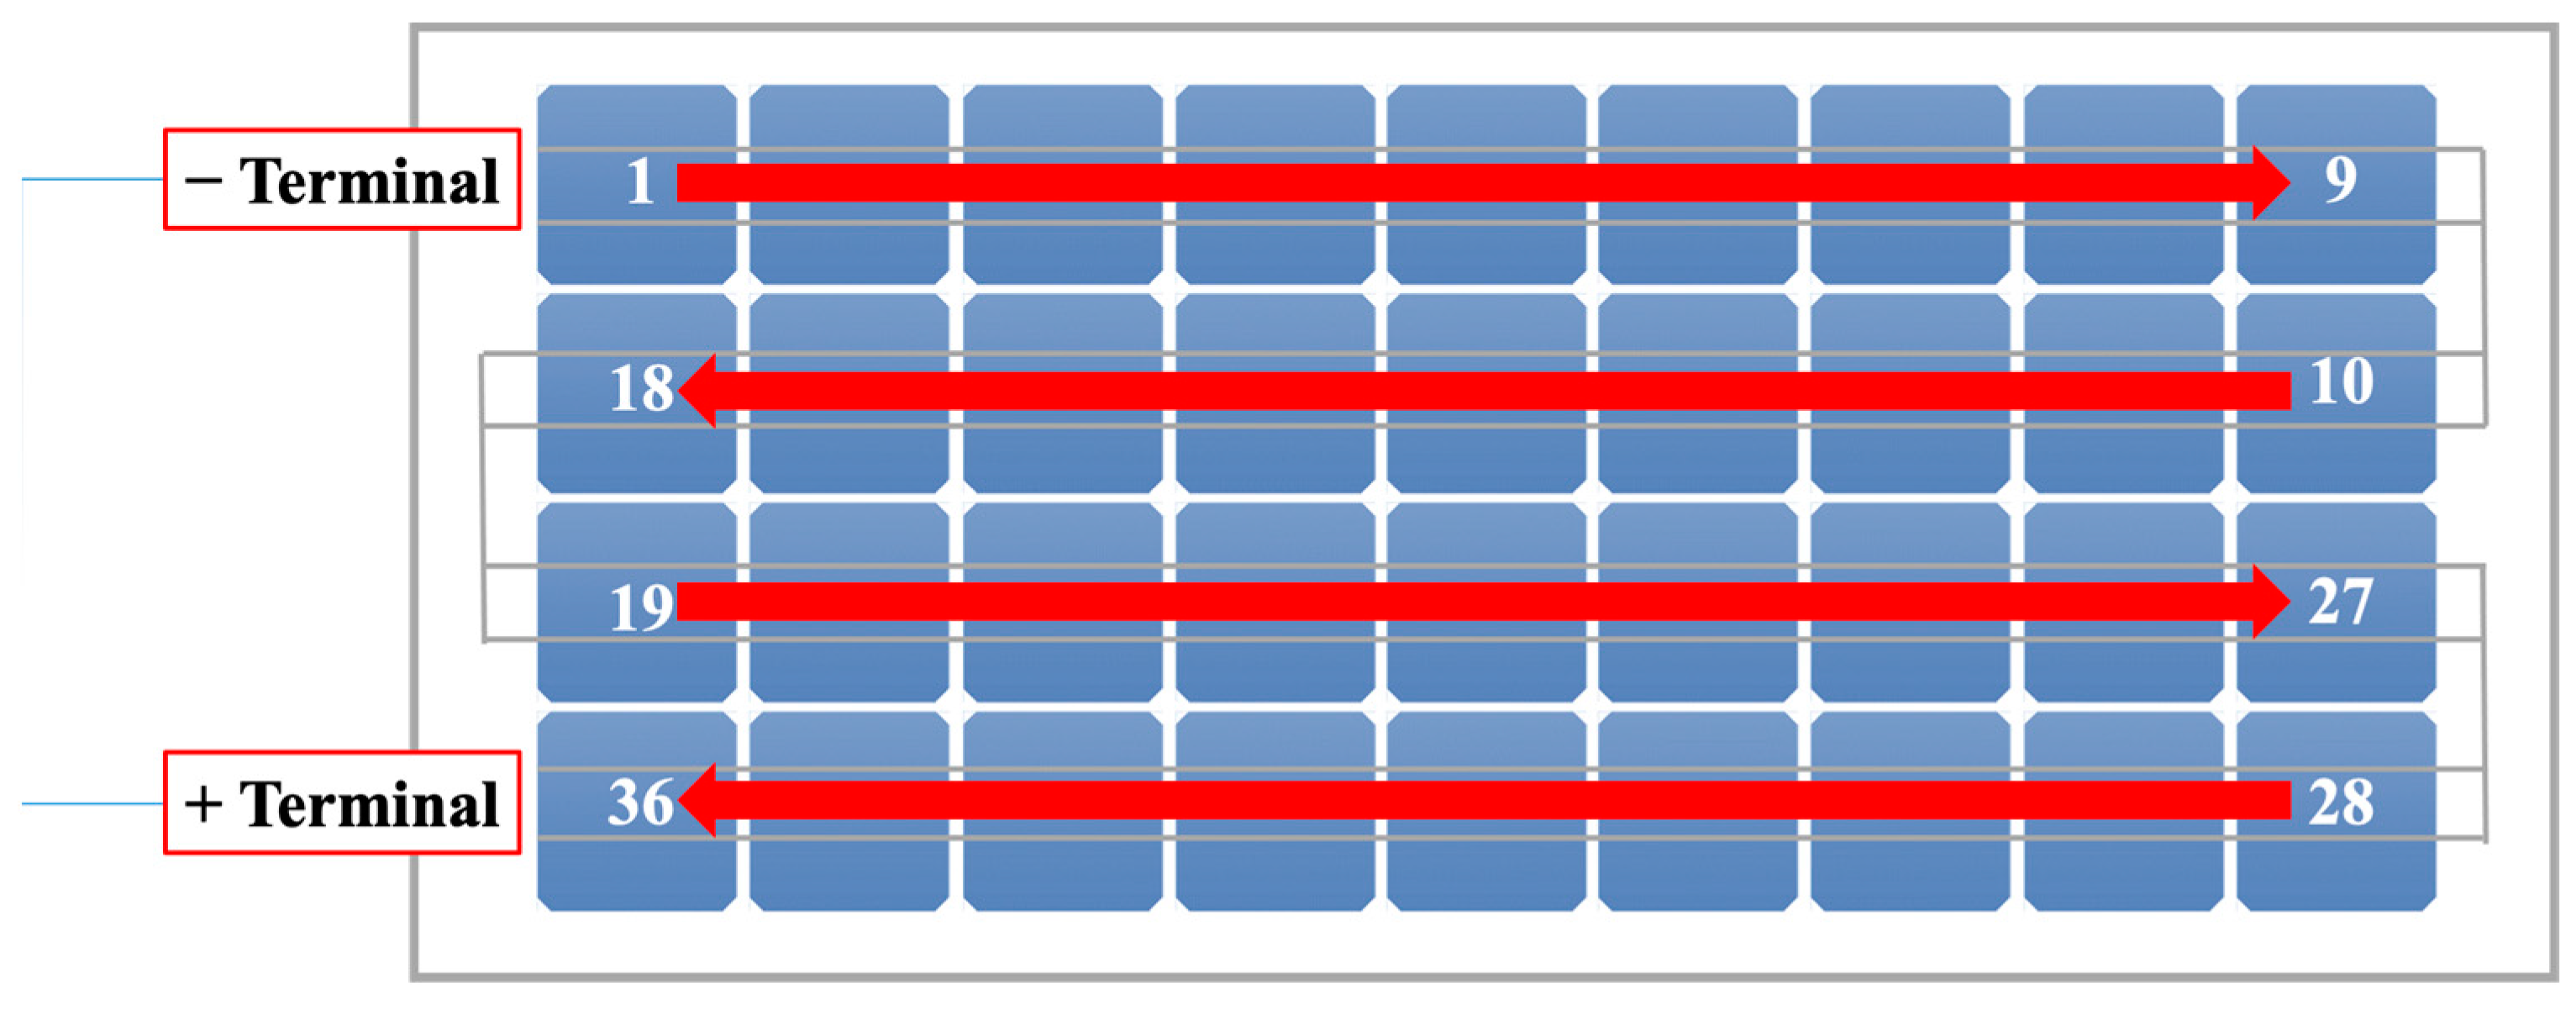
2.1. Photovoltaic Modules, in General
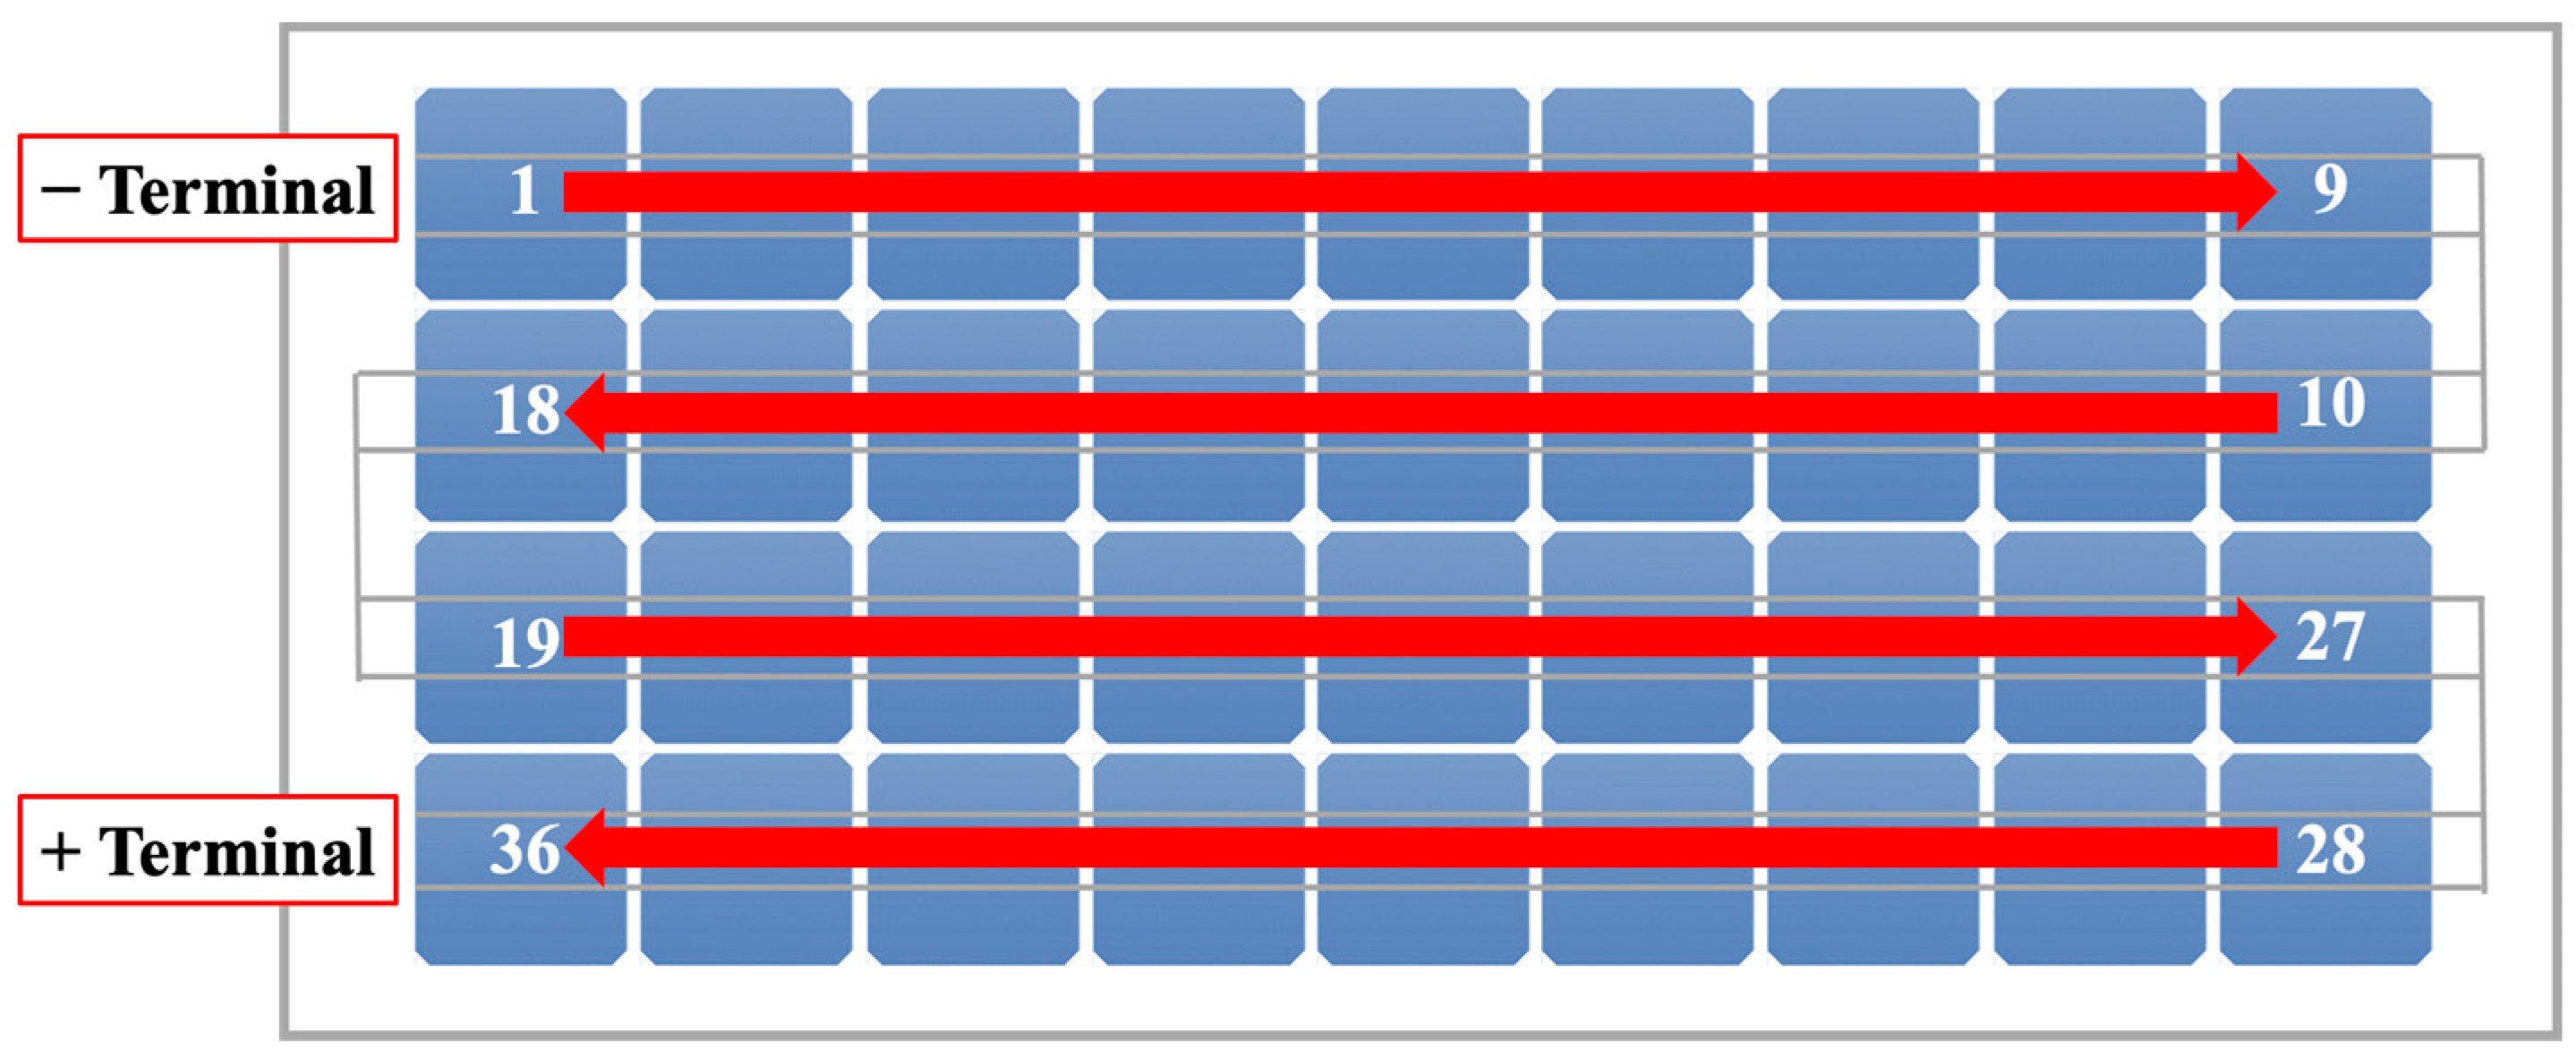
2.2. Photovoltaic Module Used in This Work
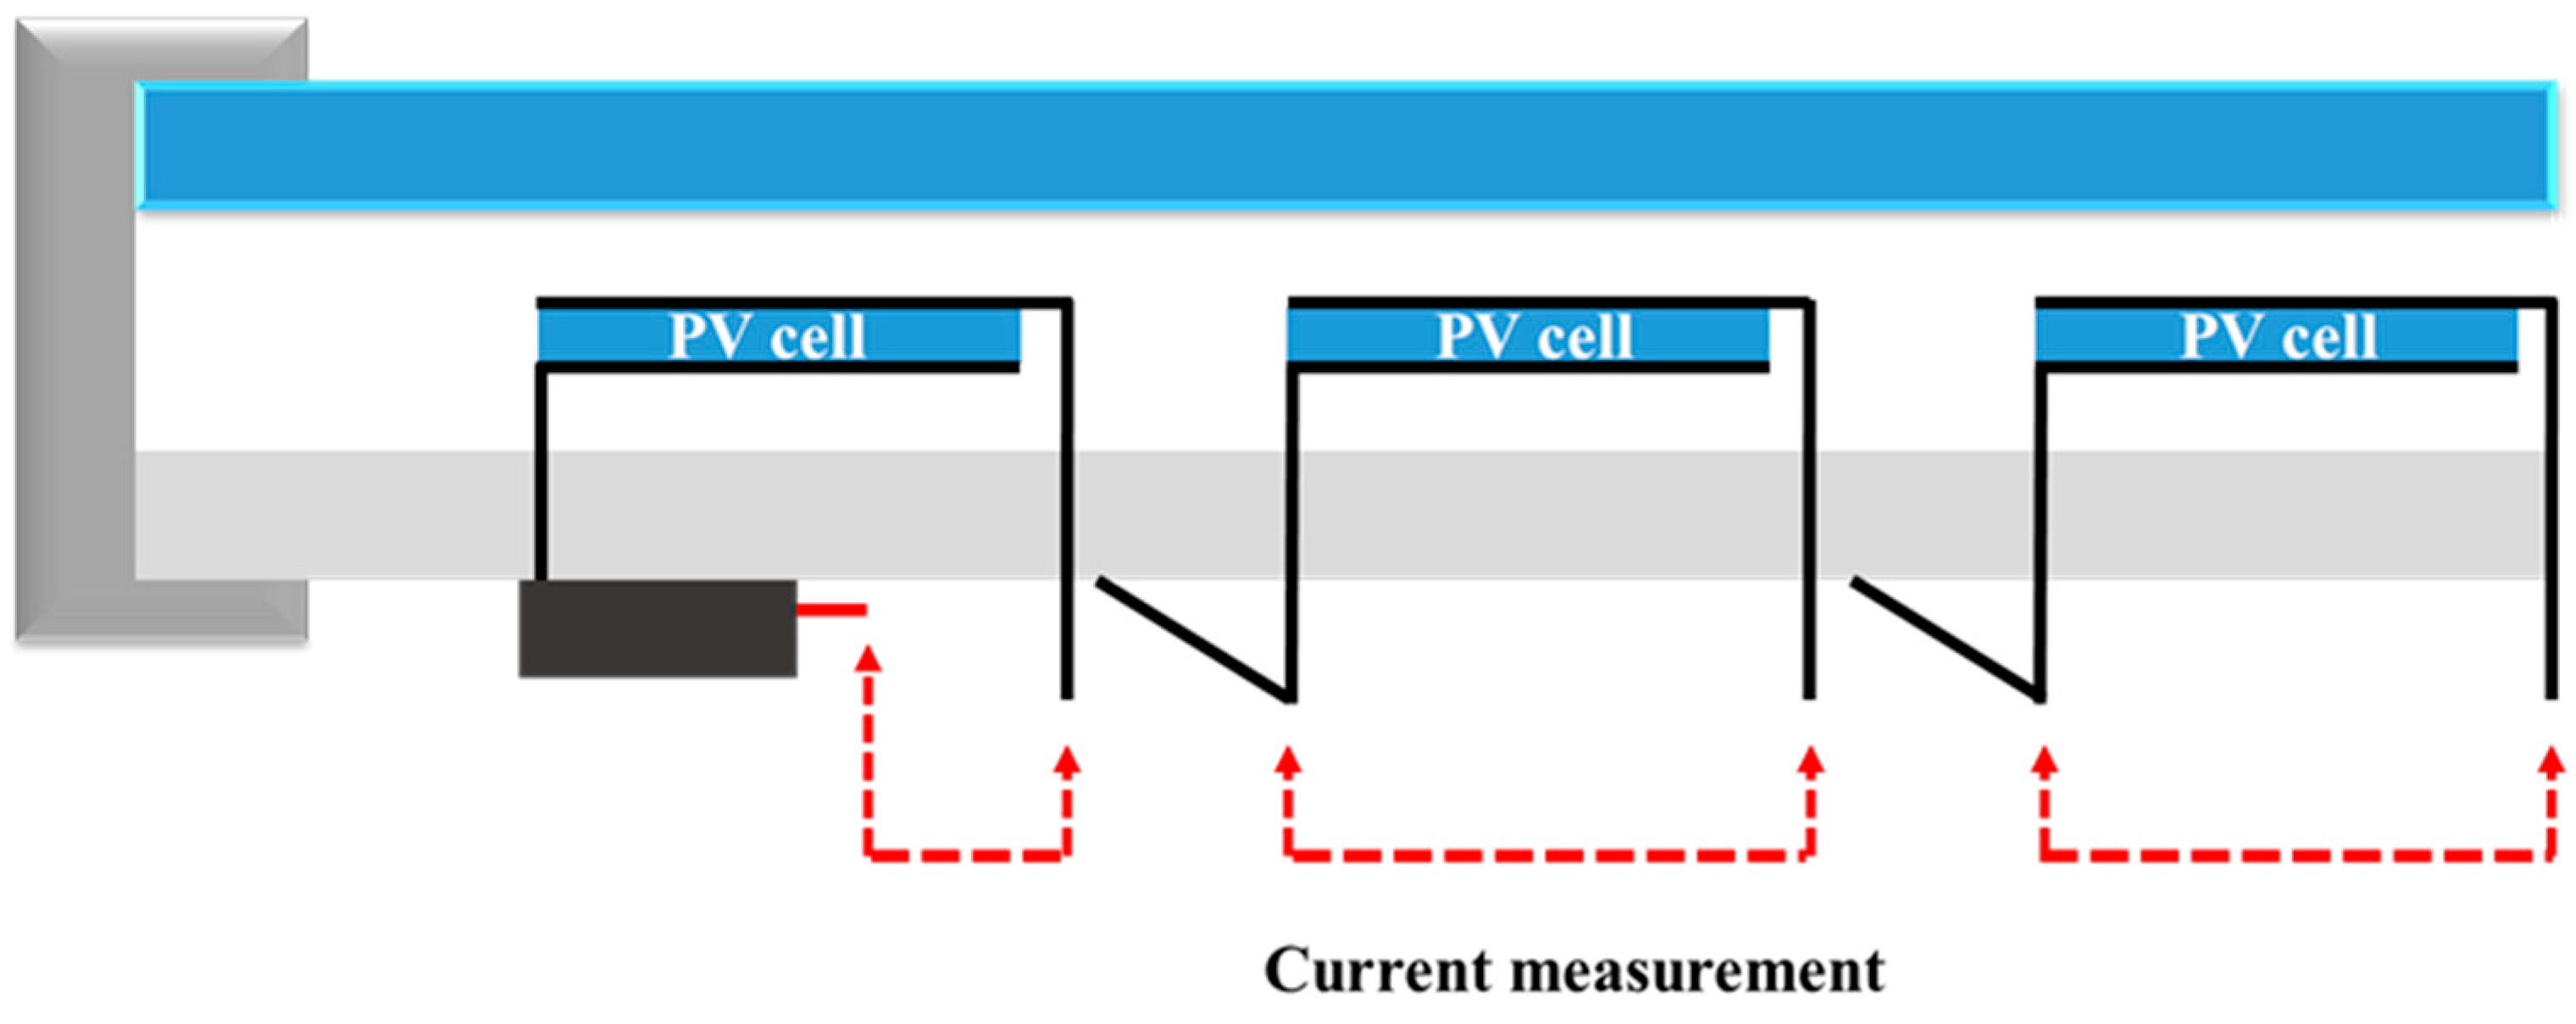
2.3. Testbed
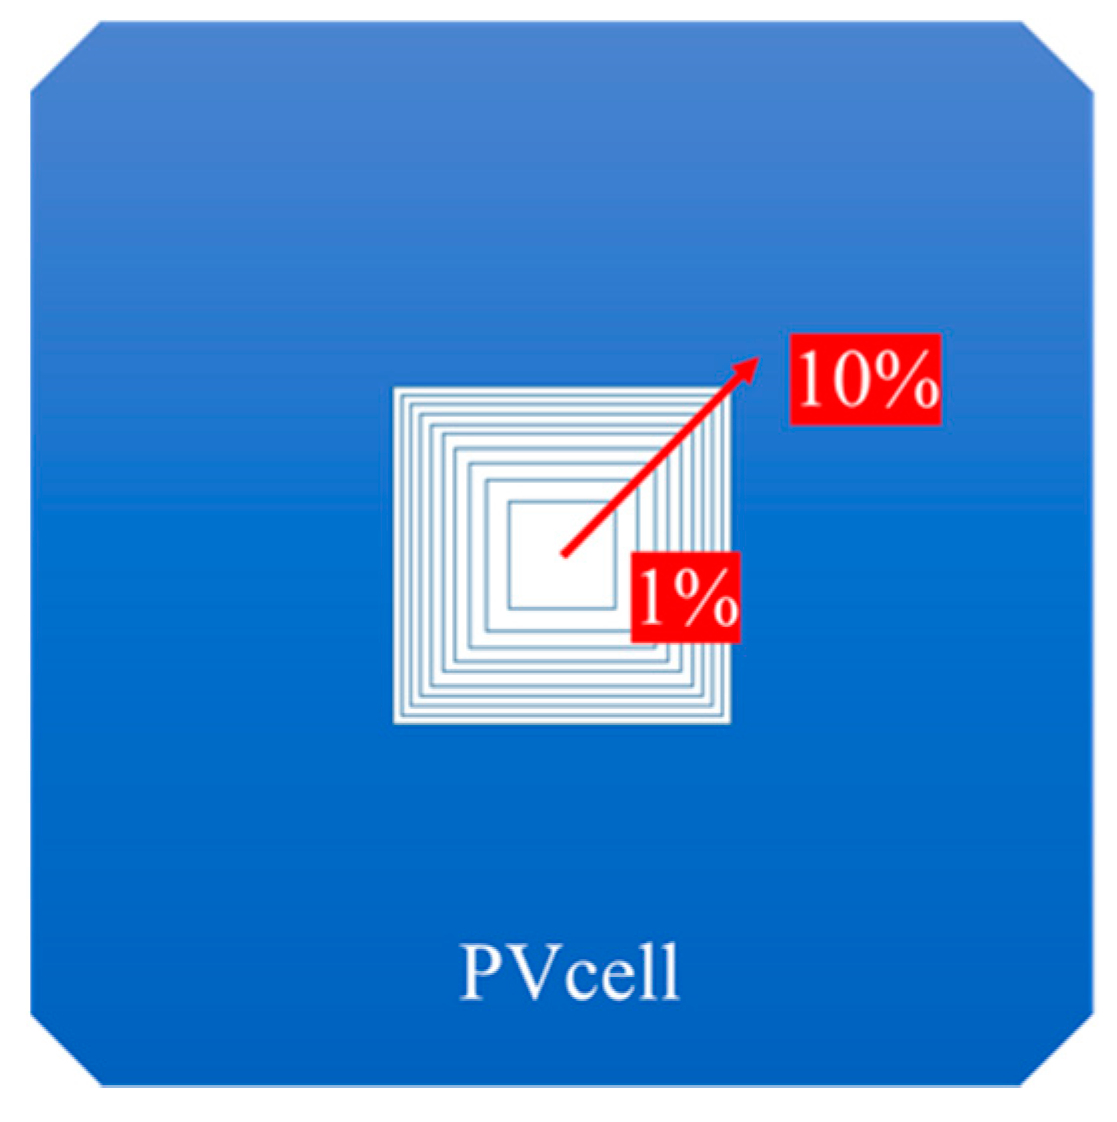
2.4. Surface Potential Meter
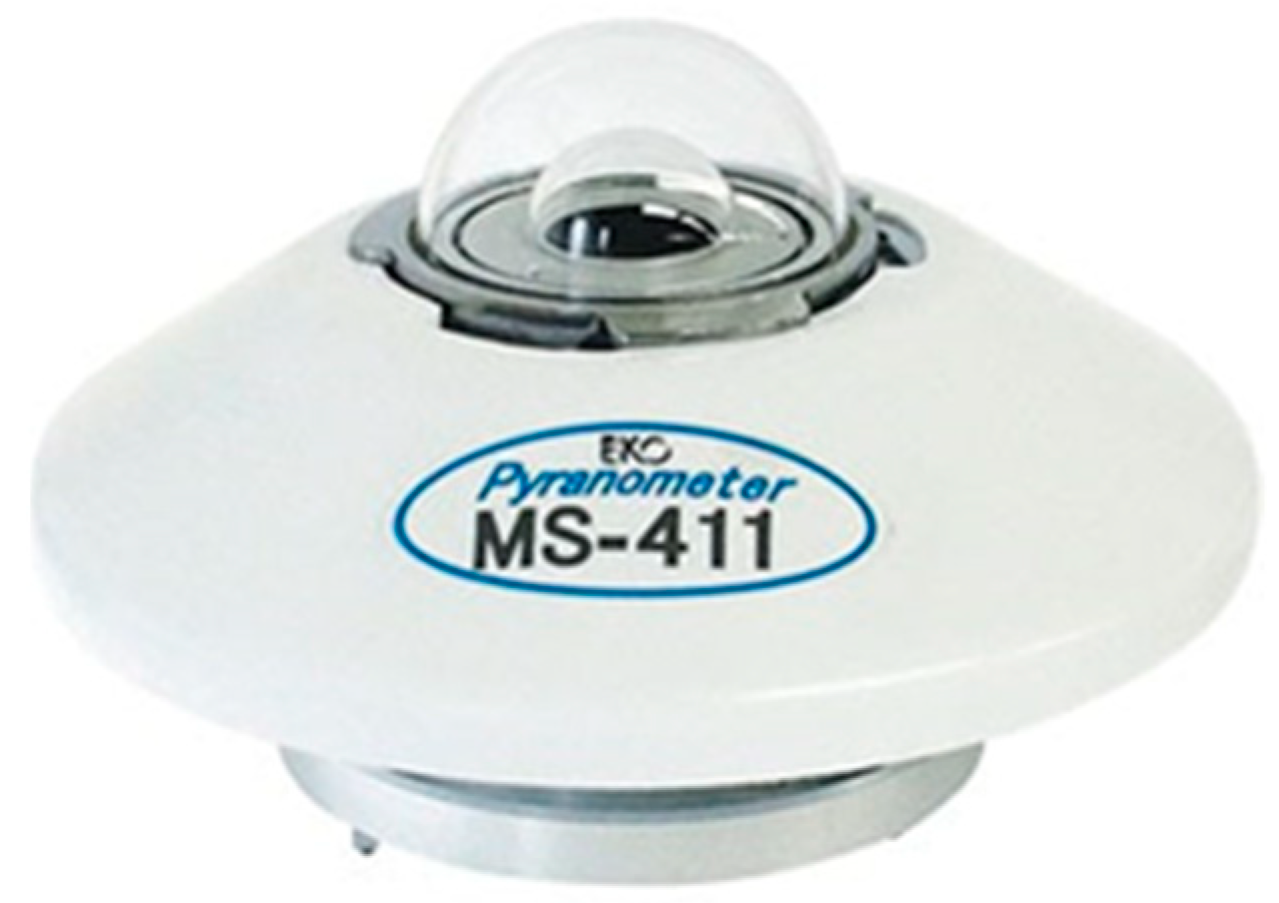
2.5. Pyranometer
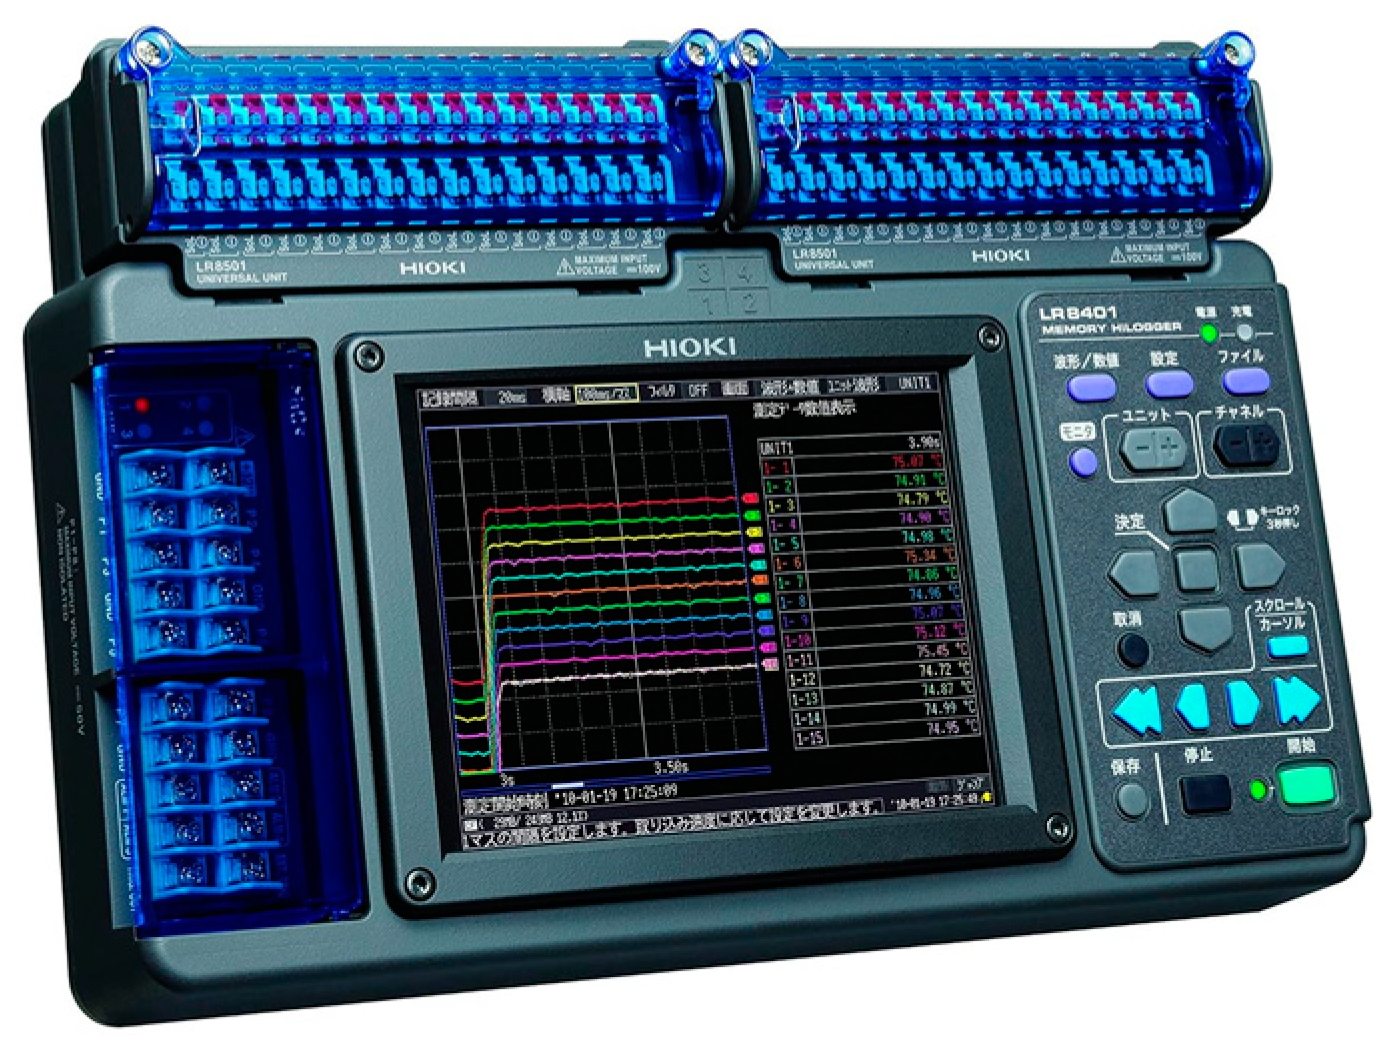
2.6. Datalogger
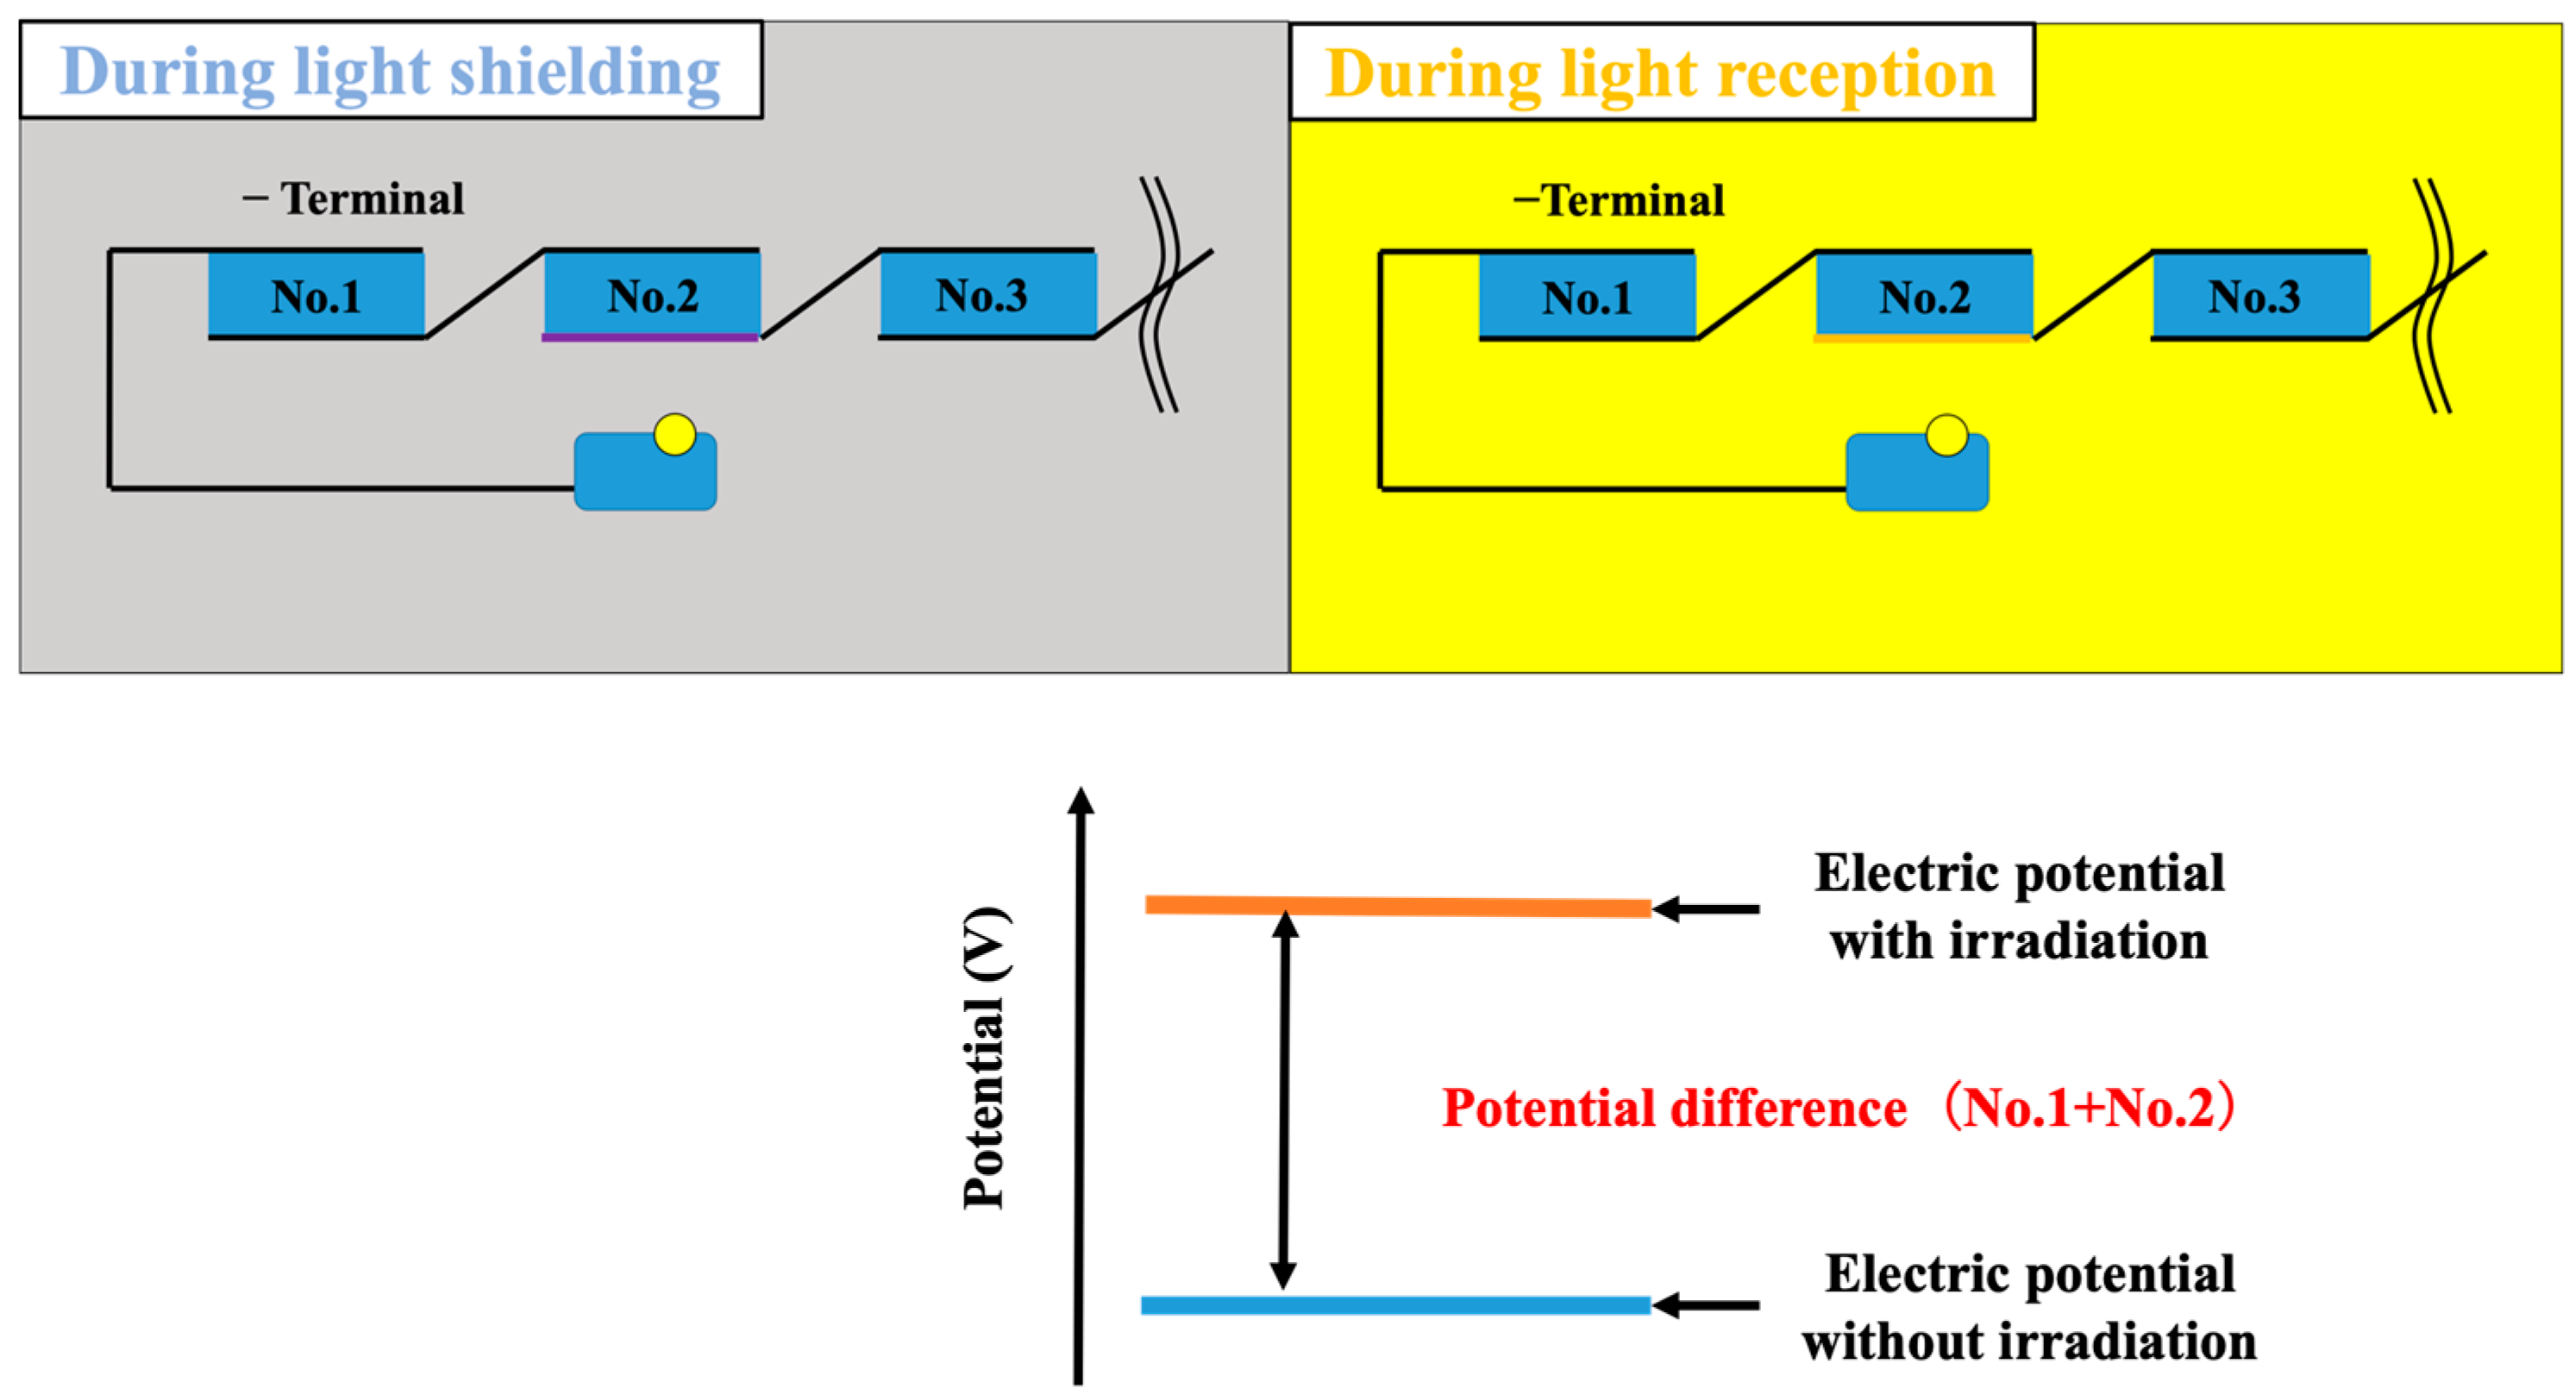
2.7. Calculation Method of Potential Difference by Surface Potential Meter
2.8. Experimental Method—General Procedure
2.9. Experimental Method—Open Circuit Condition
2.10. Experimental Method—Short Circuit Condition
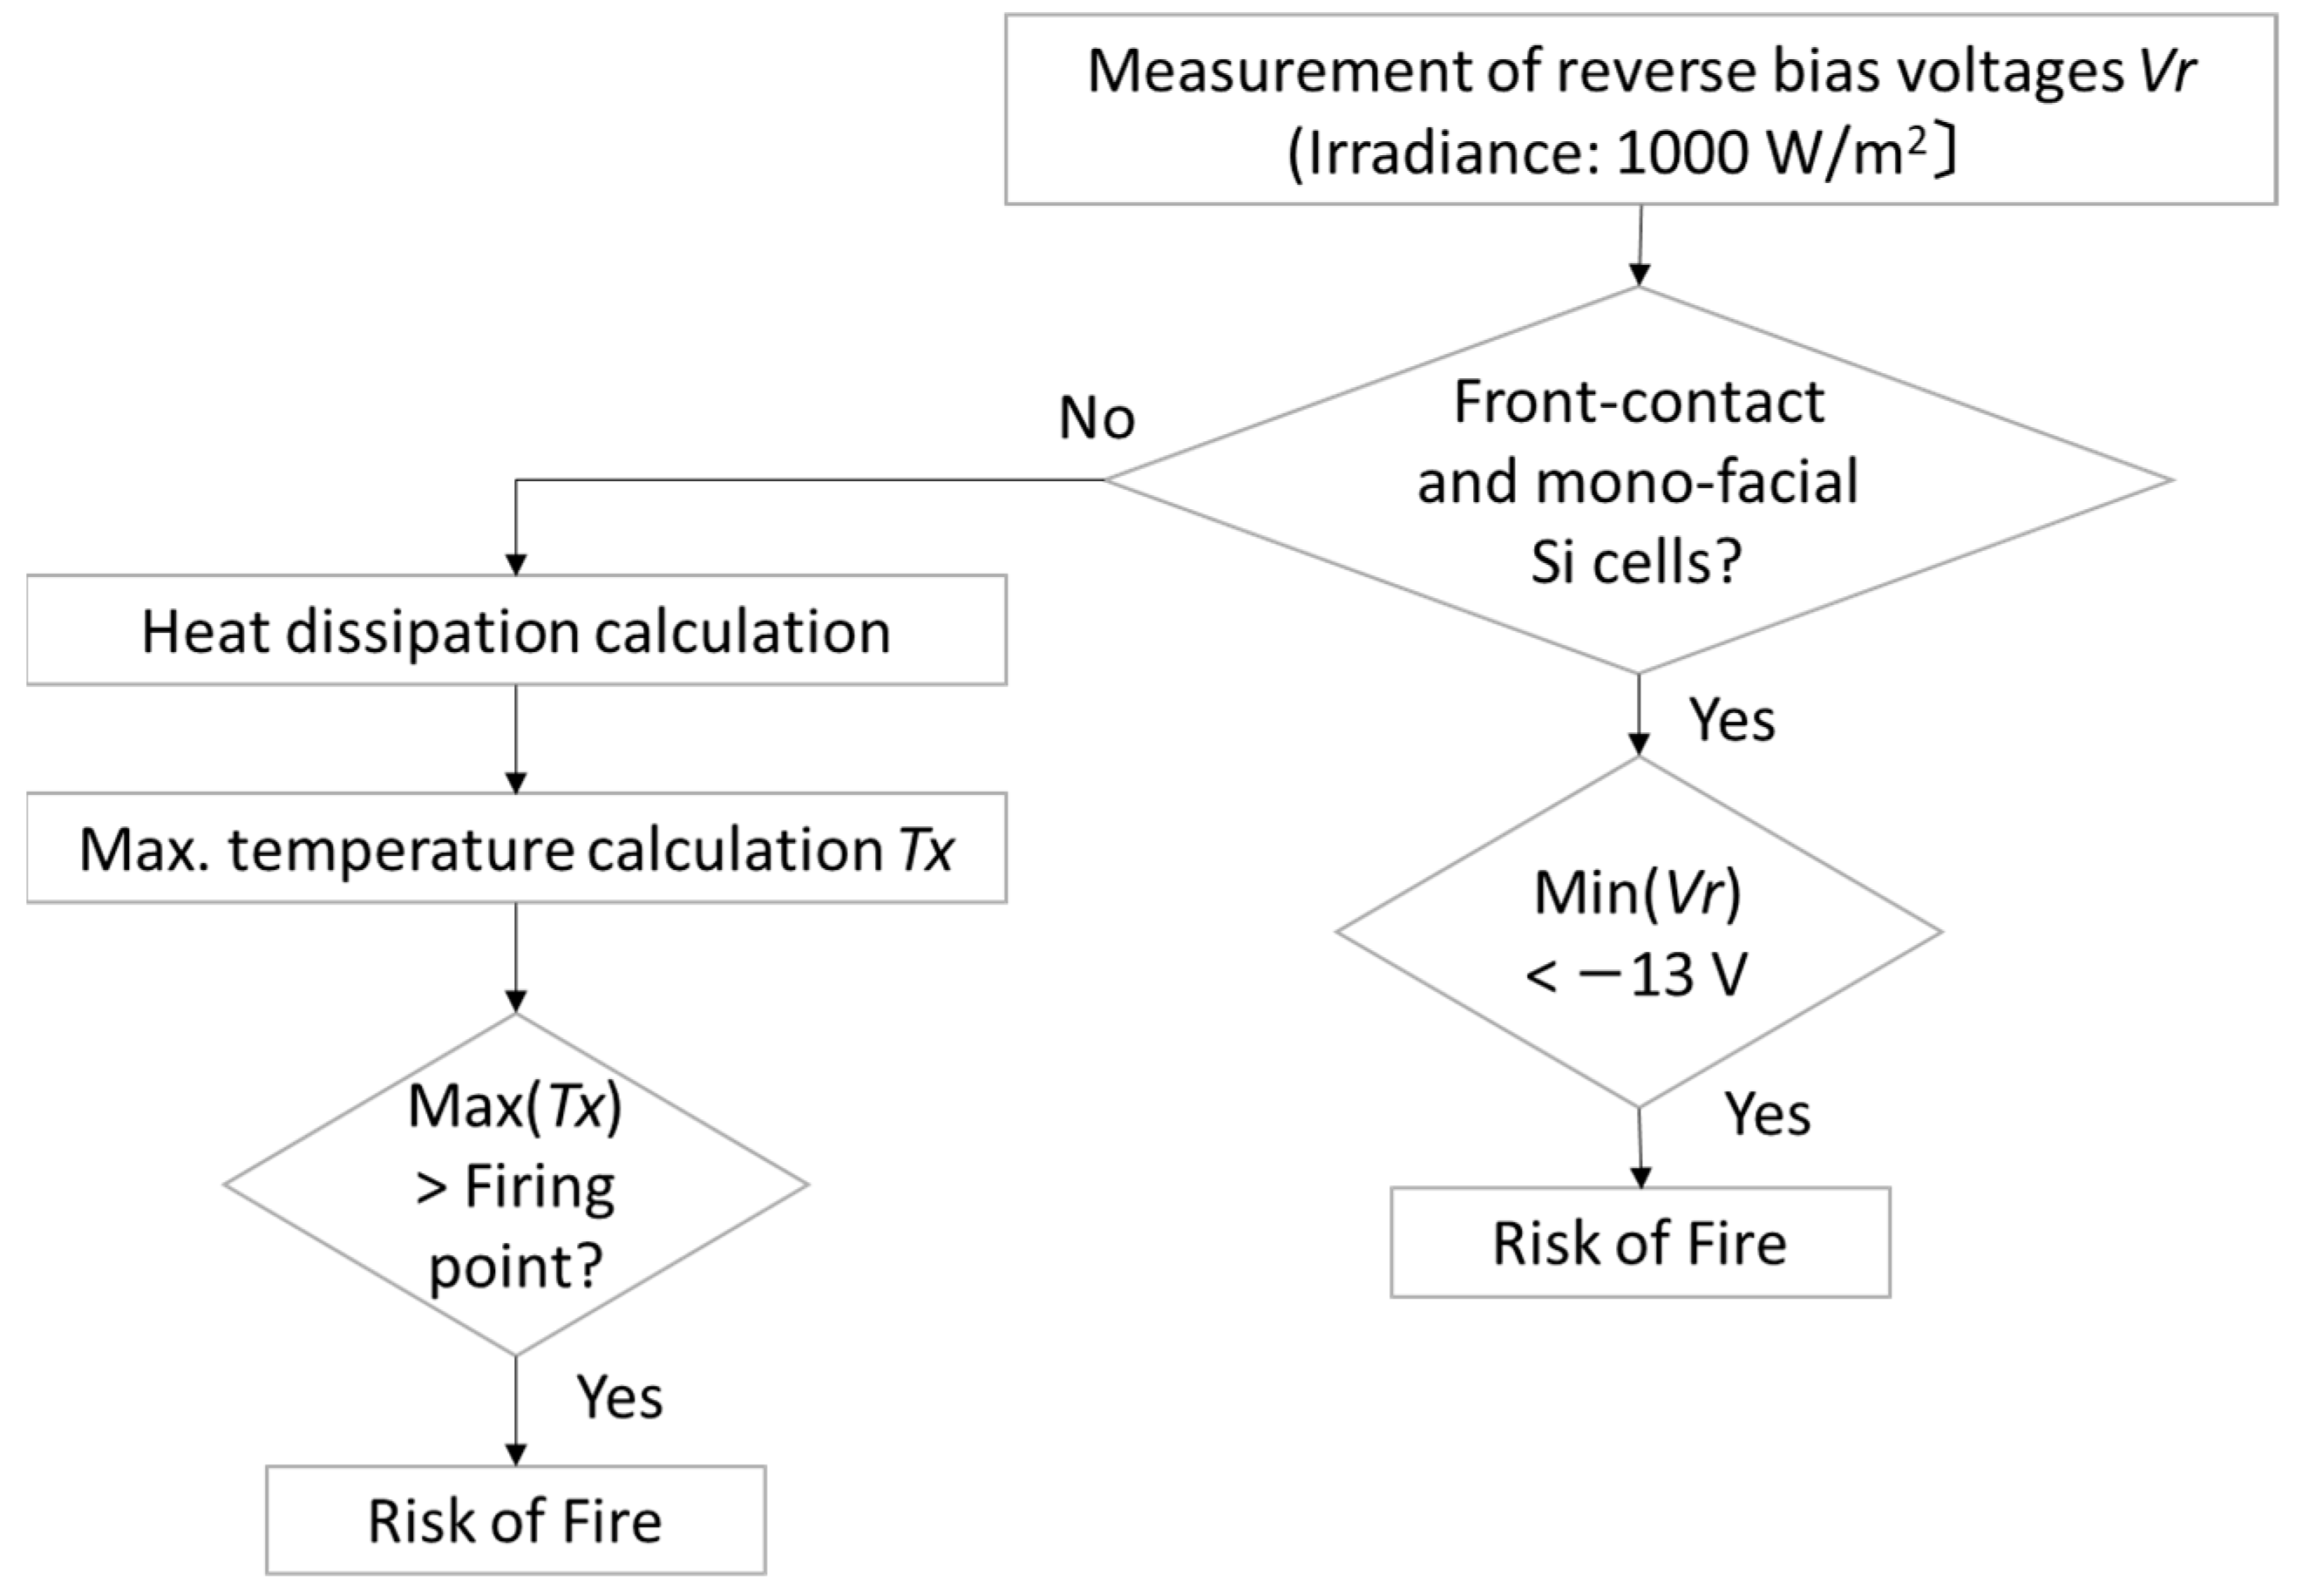
2.11. Procedure for the Risk Assessment of Fire Hazards
3. Results
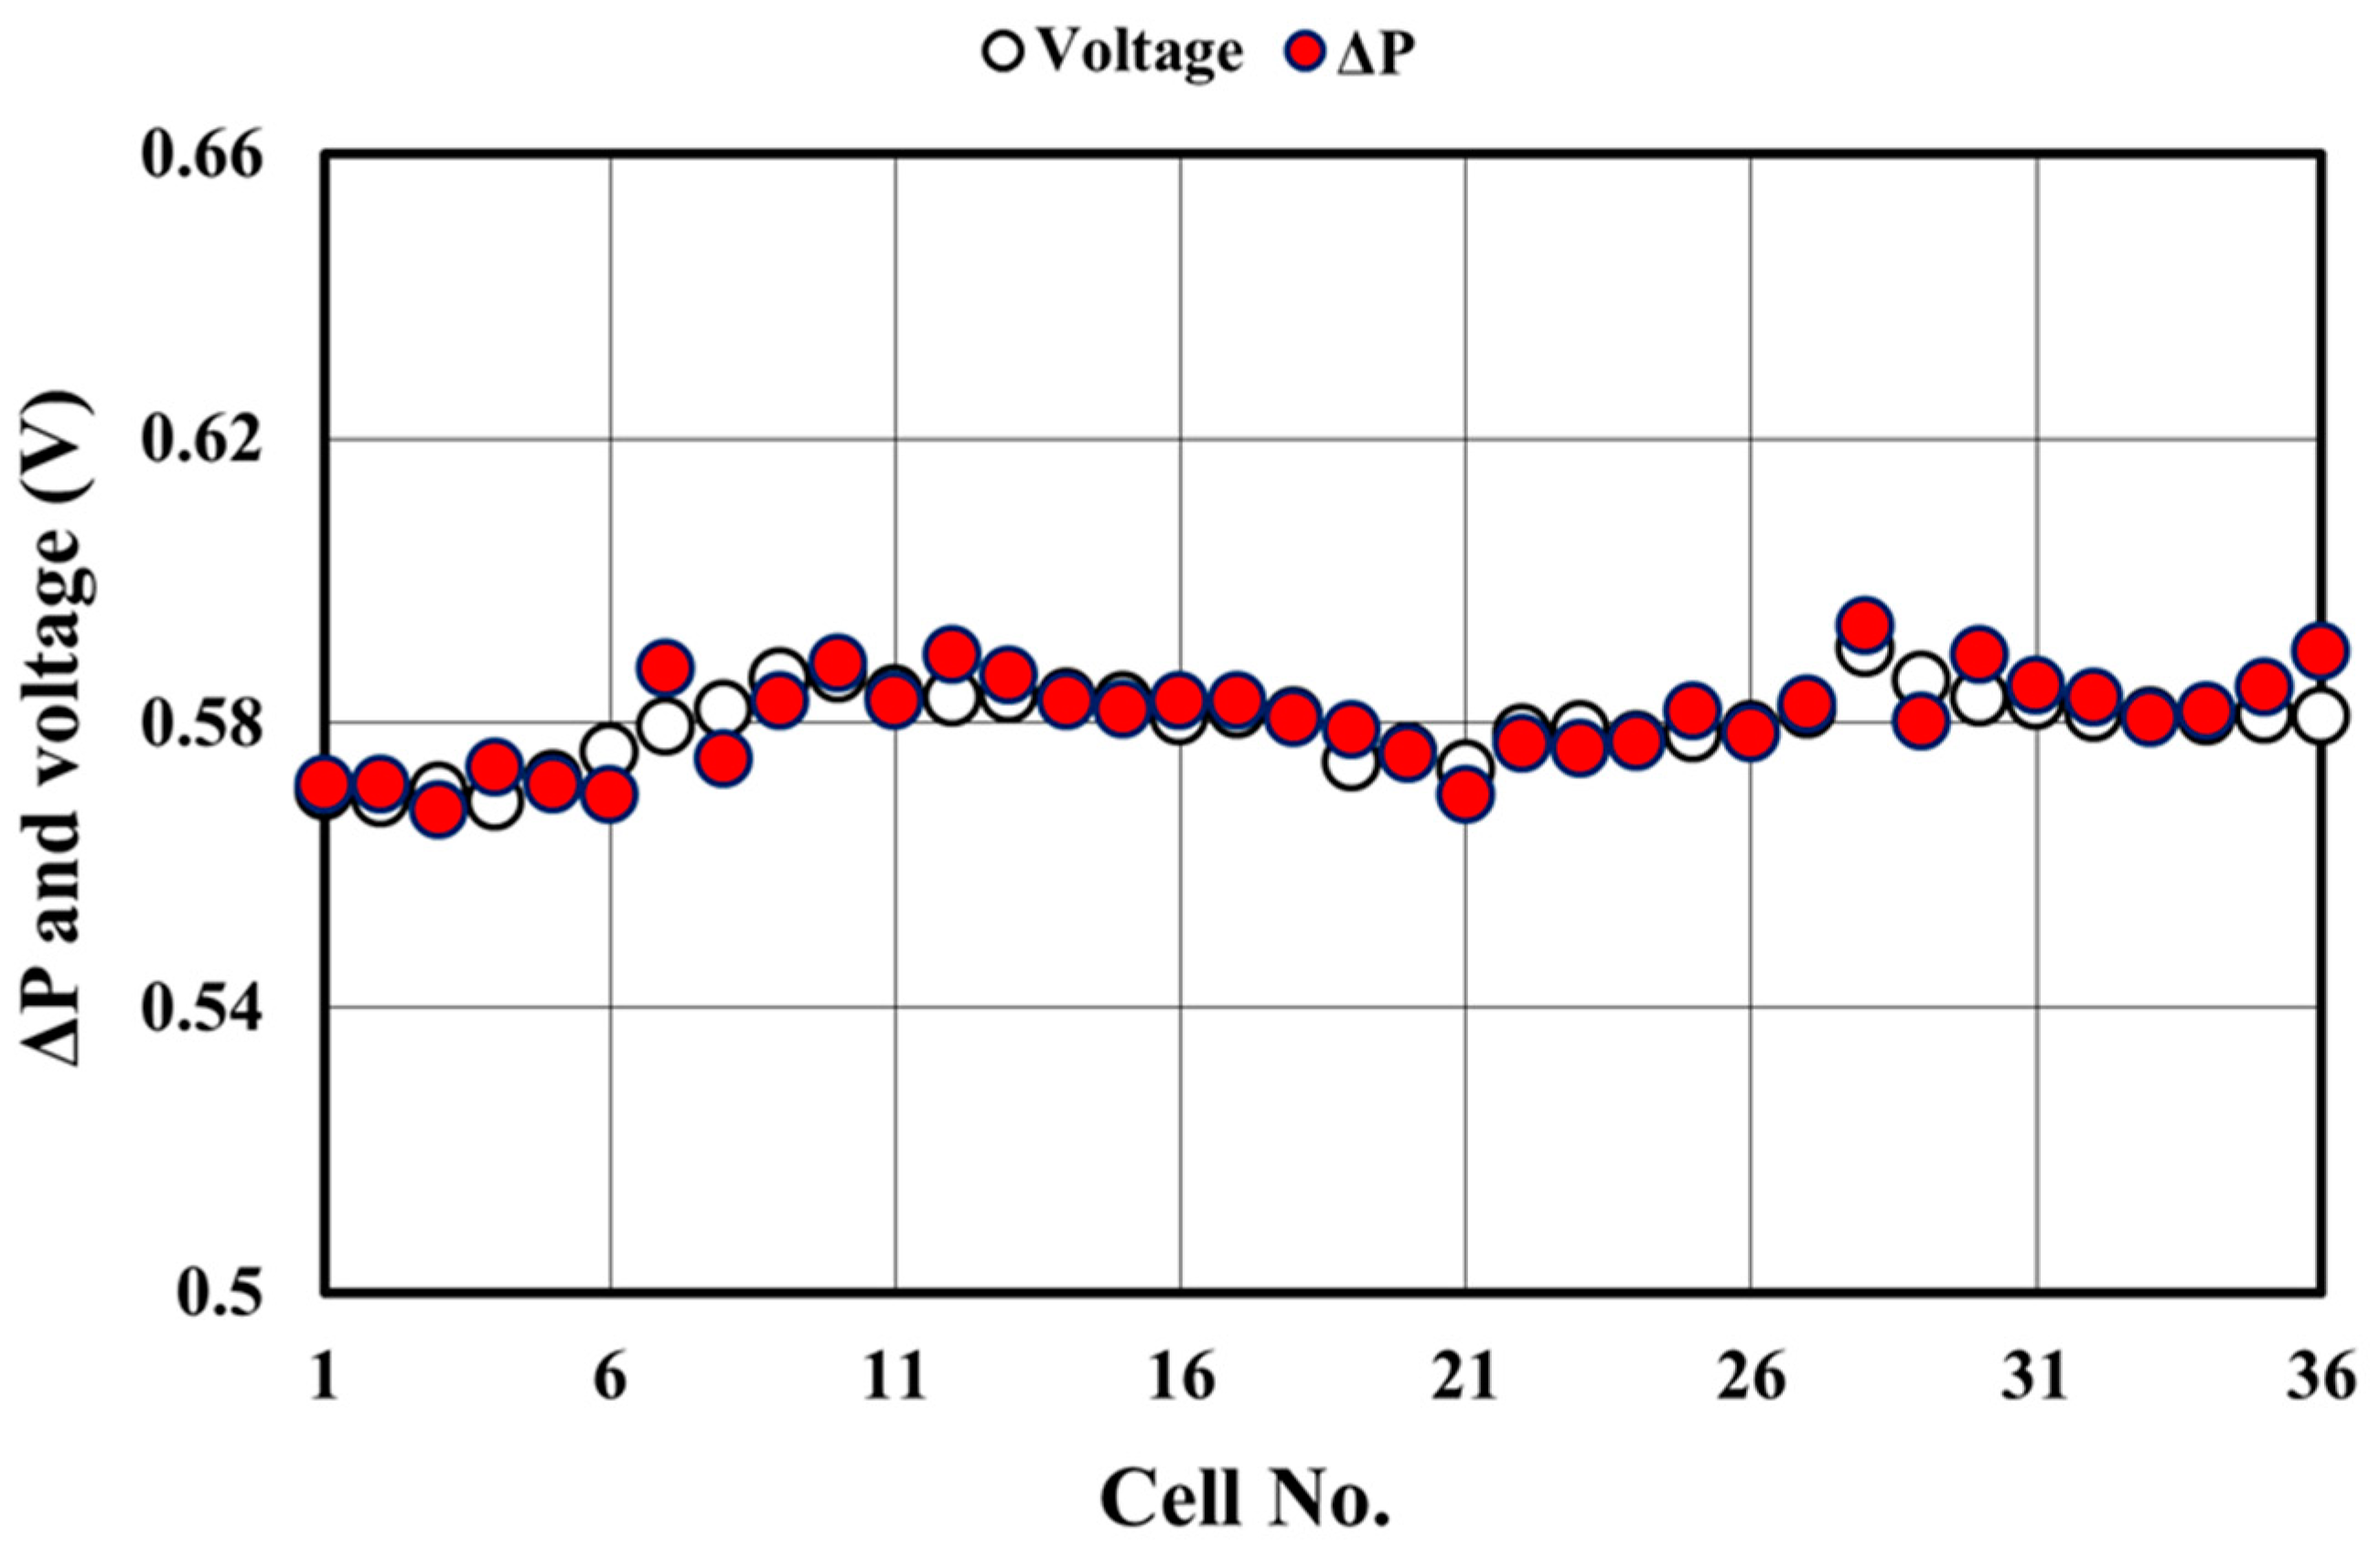
3.1. Photovoltaic Module in the Open-Circuit Condition
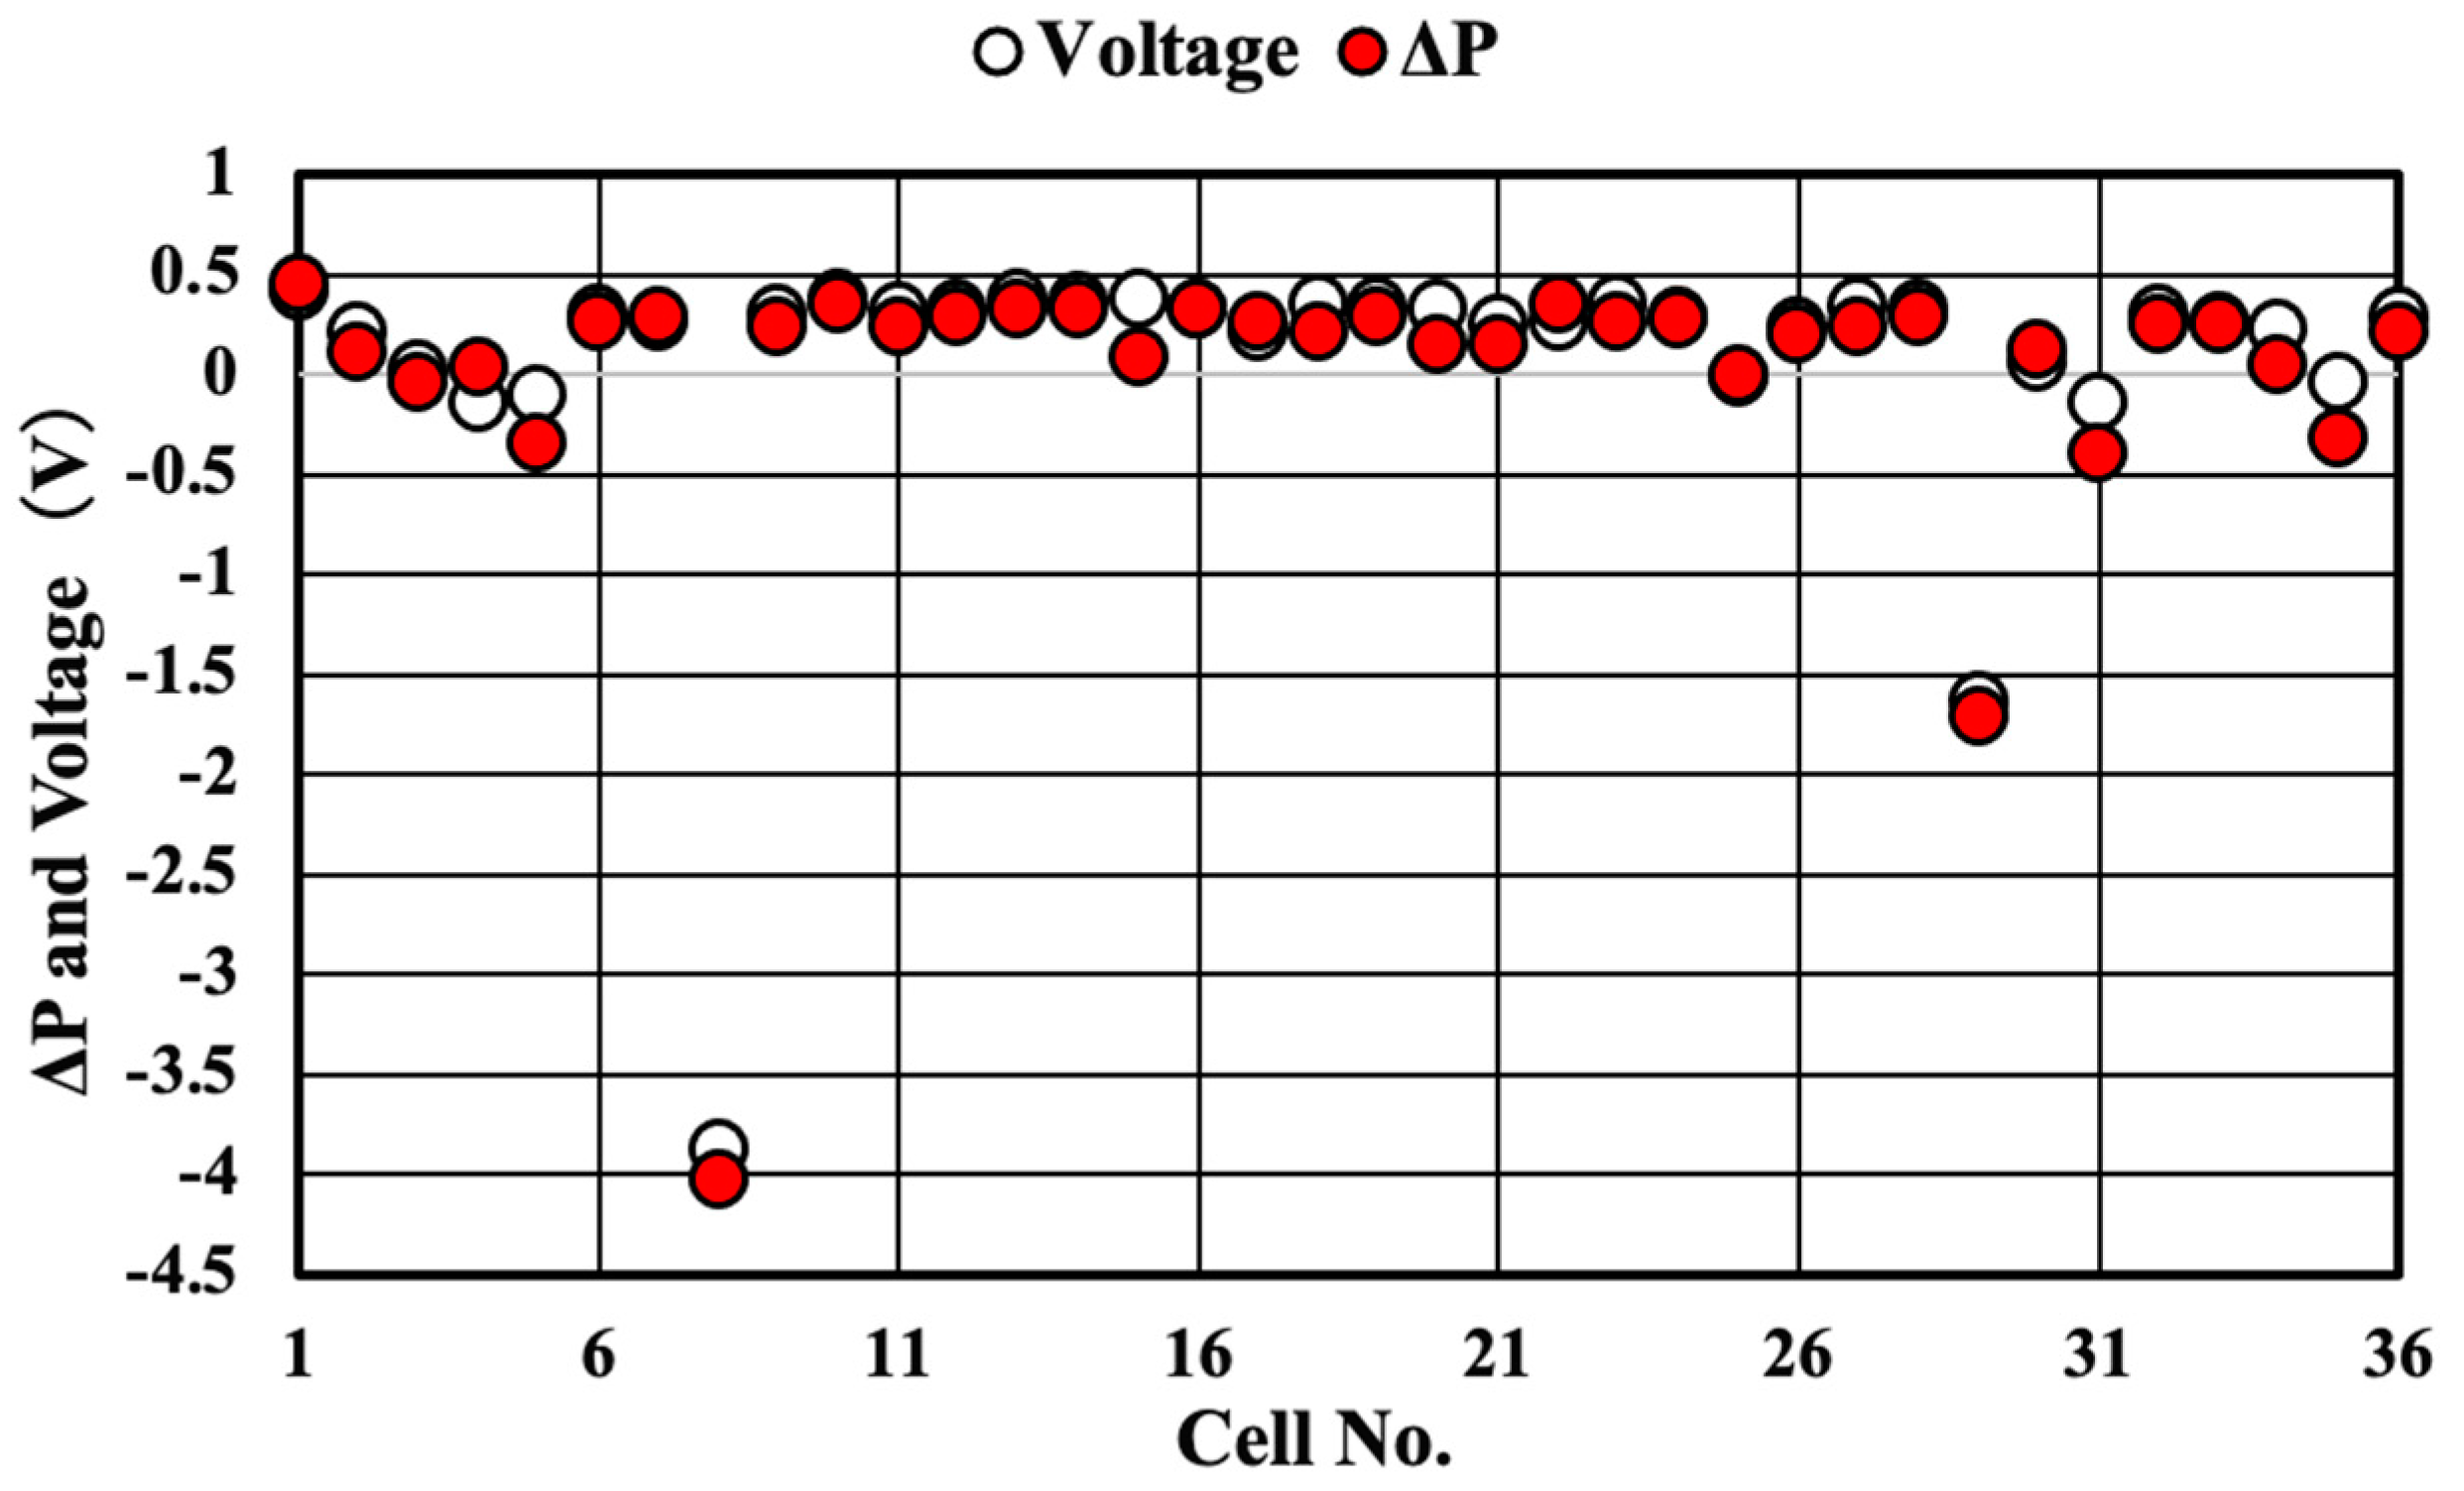
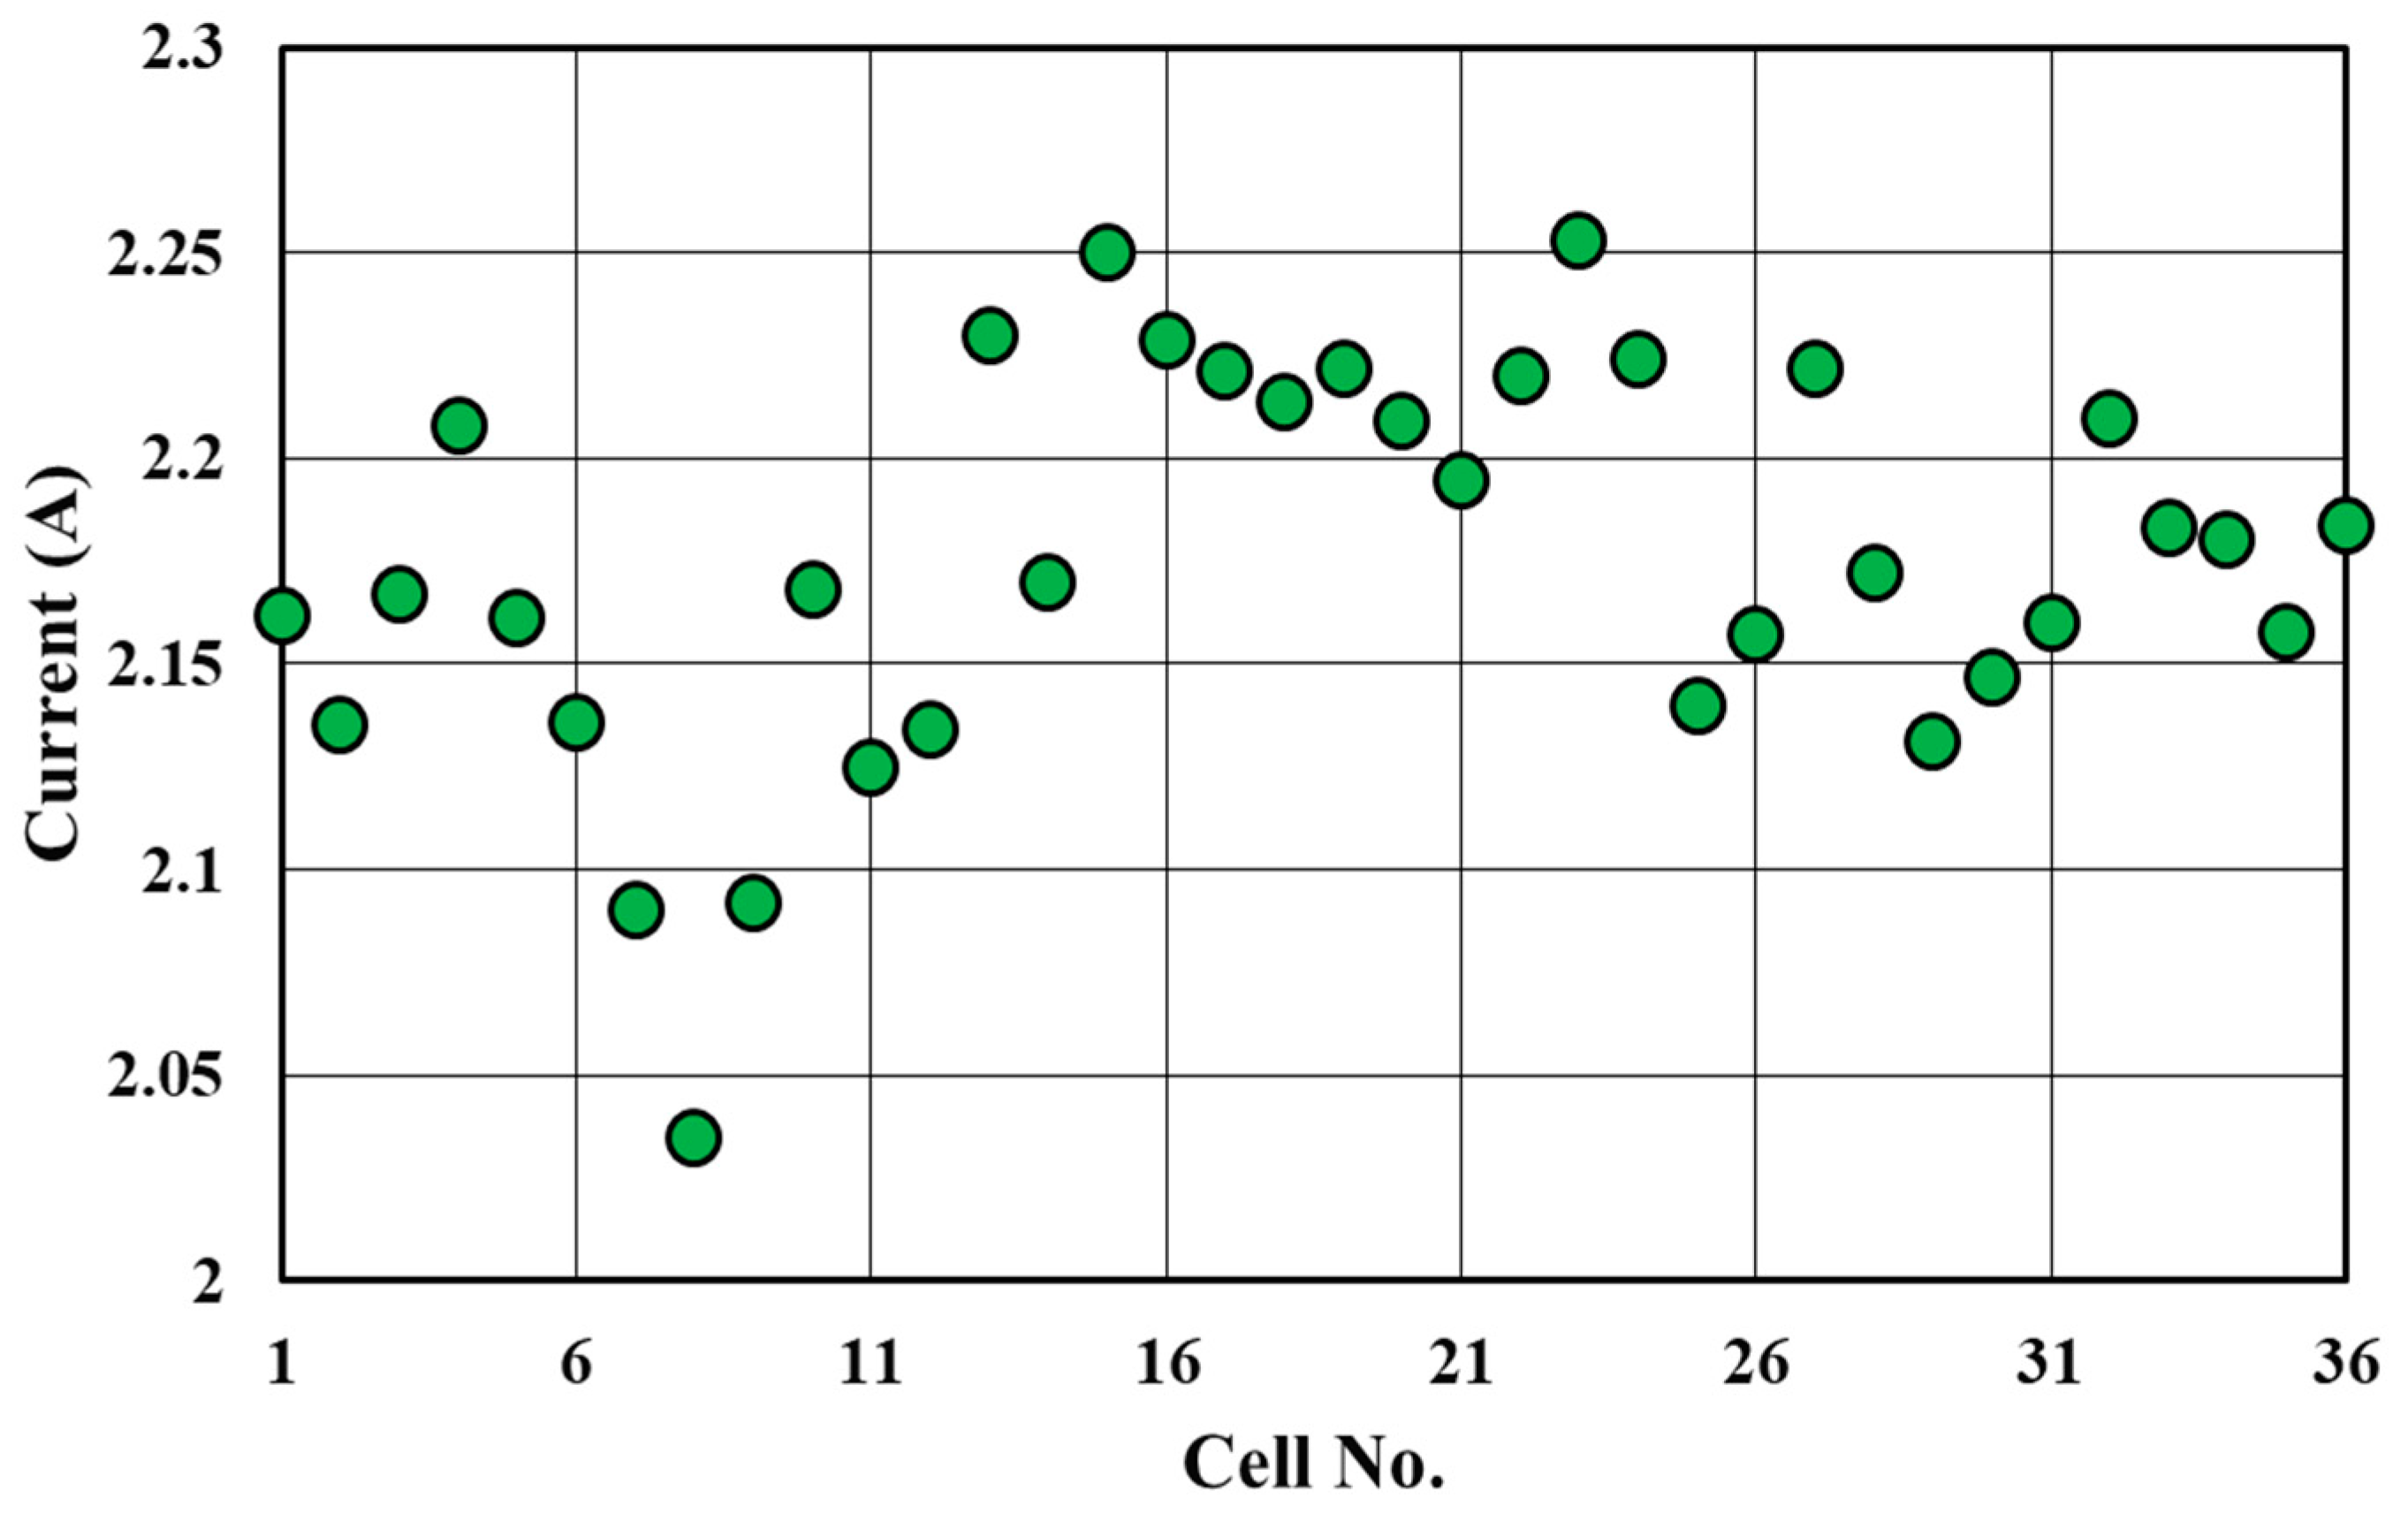
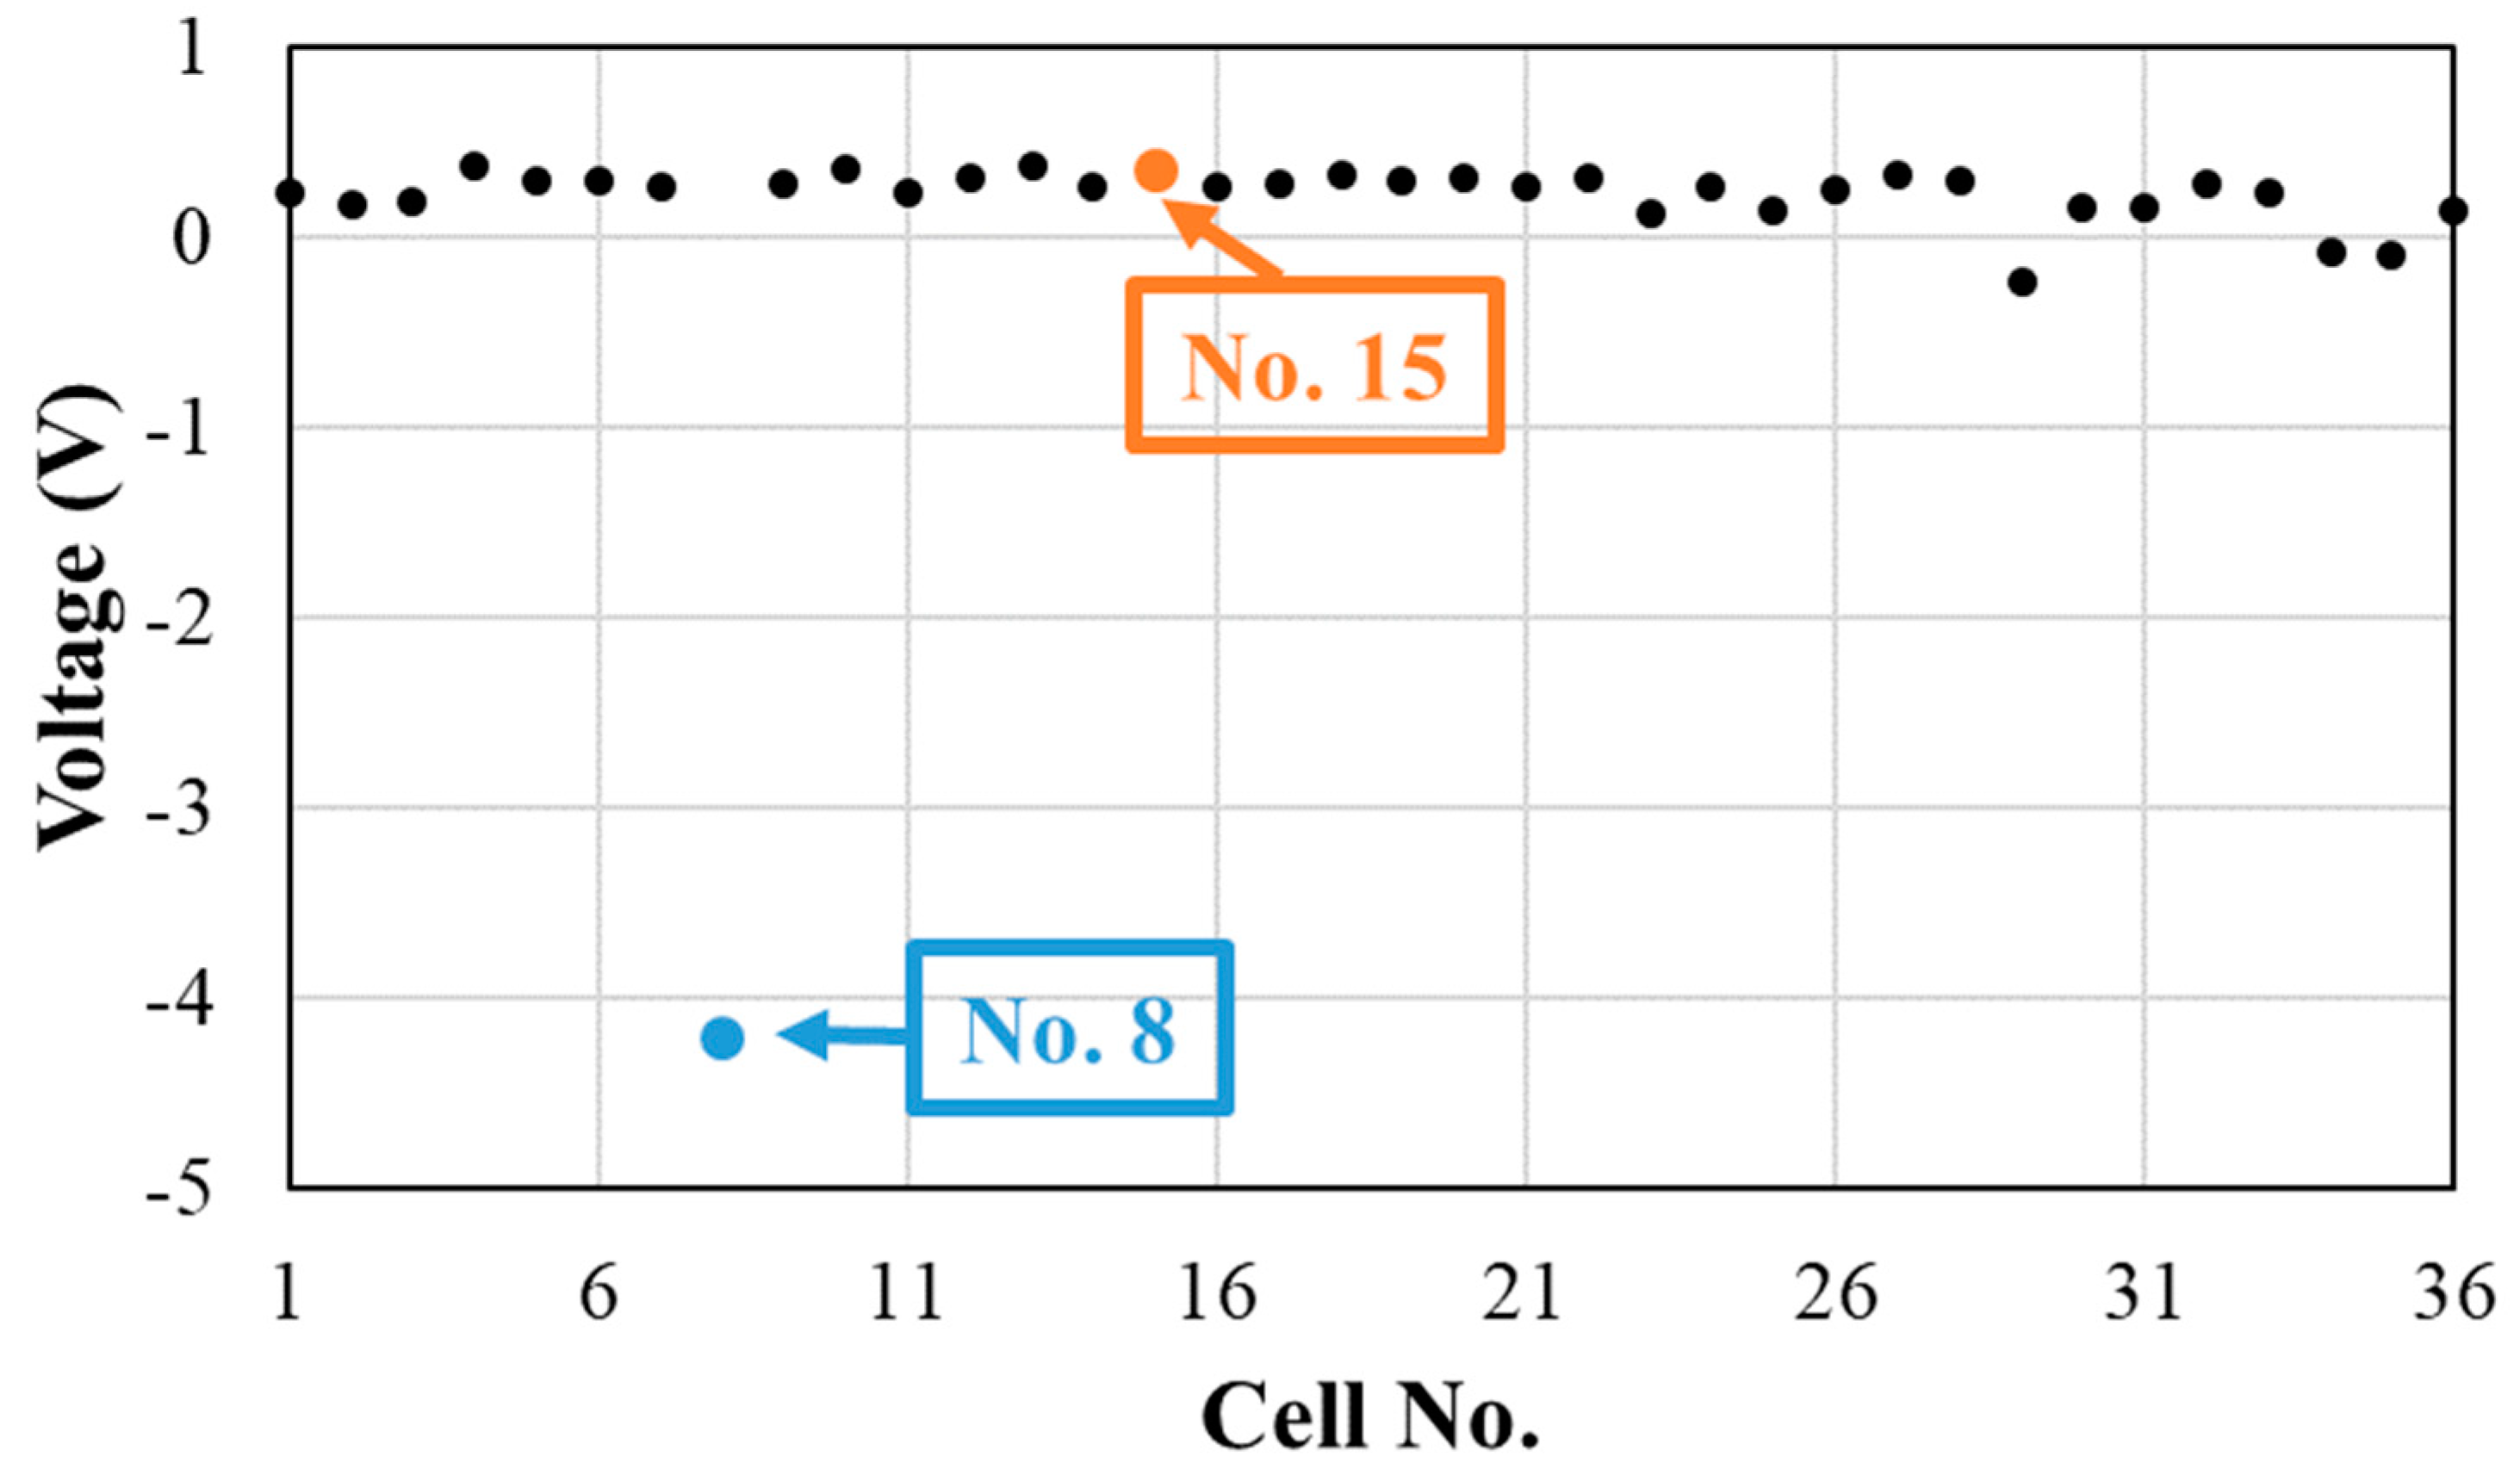
3.2. Photovoltaic Module in the Short-Circuited Condition
4. Discussion
4.1. Reverse-Bias Voltage Measurement
4.2. Accuracy and Reproducibility of Reverse-Bias Voltage
4.3. Calculation on Temperature Rise to Assess Fire Risk
4.4. Variation by the Type of Solar Cells and Module Configuration
5. Conclusions
- ♦
- We developed a non-contact measurement method by detecting the carrier movement by the electrical field generated by the surface potential of the solar cell inside the module (in between the cover glass and the back sheet). The heat dissipation of the solar cell leading to a fire hazard is quantitatively calculated by the product of the circuit current and the detected reverse-bias voltage.
- ♦
- The above method was validated by measuring each cell’s reverse-bias voltage without cutting the circuit in the module. The error range was sufficiently small for the fire risk assessment.
- ♦
- Demonstration of the fire-risk assessment by the non-contact measurement by the following steps:
- Non-contact measurement of the reverse-bias voltage under the controlled operating condition.
- Calculate each solar cell’s heat dissipation per area (W/cm2) by multiplying the reverse-bias voltage and output current by the load resistance.
- Estimation of the maximum temperature of each cell under a given condition. The worst-case solar irradiance may be 1400 W/m2, and the maximum temperature is proportional to the solar irradiance level. The typical calculation of the worst-case temperature with typical values follows:(261 °C: Worst-case temperature)= (13 V: Reverse-bias voltage tested at 1000 W/m2)× (38 mA/cm2: Short-circuit current density of the cells per area, under standard testing condition, 1000 W/m2)× (280 Kcm2/W: Temperature rise per unit heat dissipation)× (1.38: Current correction on solar irradiance correction for the worst-case)+ (70 °C: Operating temperature of the solar cell under worst-case solar irradiance)> (250 °C: Firing point of woods)
Author Contributions
Funding
Institutional Review Board Statement
Informed Consent Statement
Data Availability Statement
Acknowledgments
Conflicts of Interest
References
- 2018—Japa’s Energy Problems. Available online: http://www.enecho.meti.go.jp/about/special/johoteikyo/energyissue2018.html (accessed on 4 July 2023).
- BP Statistical Review of World Energy. 2016. Available online: https://www.bp.com/content/dam/bp/business-sites/en/global/corporate/pdfs/news-and-insights/speeches/bp-statistical-review-of-world-energy-2016-spencer-dale-presentation.pdf (accessed on 4 July 2023).
- Ayompe, L.M.; Duffy, A.; McCormack, S.J.; Conlon, M. Measured performance of a 1.72-kW rooftop grid connected photovoltaic system in Ireland. Energy Convers. Manag. 2011, 52, 816–825. [Google Scholar] [CrossRef]
- Myong, S.Y.; Park, Y.C.; Jeon, S.W. Performance of Si-based PV rooftop systems operated under distinct four seasons. Renew. Energy 2015, 81, 482–489. [Google Scholar] [CrossRef]
- Razykov, T.M.; Ferekides, C.S.; Morel, D.; Stefanakos, E.; Ullal, H.S.; Upadhyaya, H.M. Solar photovoltaic electricity: Current status and future prospects. Sol. Energy 2011, 85, 1580–1608. [Google Scholar] [CrossRef]
- Kazmerski, L.L. Photovoltaics: A review of cell and module technologies. Renew. Sustain. Energy Rev. 1997, 1, 71–170. [Google Scholar] [CrossRef]
- Kumar, A.; Kumar, K.; Kaushik, N.; Sharma, S.; Mishra, S. Renewable energy in India: Current status and future potentials. Renew. Sustain. Energy Rev. 2010, 14, 2434–2442. [Google Scholar] [CrossRef]
- Hart, E.K.; Jacobson, M.Z. A Monte Carlo approach to generator portfolio planning and carbon emissions assessments of systems with large penetrations of variable renewables. Renew. Energy 2011, 36, 2278–2286. [Google Scholar] [CrossRef]
- Aliprandi, F.; Stoppato, A.; Mirandola, A. Estimating CO2 emissions reduction from renewable energy use in Italy. Renew. Energy 2016, 96, 220–232. [Google Scholar] [CrossRef]
- Sharma, V.; Chandel, S.S. Performance and degradation analysis for long term reliability of solar photovoltaic systems: A review. Renew. Sustain. Energy Rev. 2013, 27, 753–767. [Google Scholar] [CrossRef]
- Emery, K.; Osterwald, C. Measurement of photovoltaic device current as a function of voltage, temperature, intensity and spectrum. Sol. Cells 1987, 21, 313–327. [Google Scholar] [CrossRef]
- Dirnberger, D.; Kräling, U.; Müllejans, H.; Salis, E.; Emery, K.; Hishikawa, Y.; Kiefer, K. Progress in photovoltaic module calibration: Results of a worldwide intercomparison between four reference laboratories. Meas. Sci. Technol. 2014, 25, 105005. [Google Scholar] [CrossRef]
- Munoz, M.A.; Alonso-García, M.C.; Vela, N.; Chenlo, F. Early degradation of silicon PV modules and guaranty conditions. Sol. Energy 2011, 85, 2264–2274. [Google Scholar] [CrossRef]
- Alonsogarcia, M.C.; Ruiz, J.M.; Chenlo, F. Experimental study of mismatch and shading effects in the—Characteristic of a photovoltaic module. Sol. Energy Mater. Sol. Cells 2006, 90, 329–340. [Google Scholar] [CrossRef]
- Wang, J.C.; Su, Y.L.; Shieh, J.C.; Jiang, J.A. High-accuracy maximum power point estimation for photovoltaic arrays. Sol. Energy Mater. Sol. Cells 2011, 95, 843–851. [Google Scholar] [CrossRef]
- Verma, D.; Nema, S.; Shandilya, A.M.; Dash, S.K. Maximum power point tracking (MPPT) techniques: Recapitulation in solar photovoltaic systems. Renew. Sustain. Energy Rev. 2016, 54, 1018–1034. [Google Scholar] [CrossRef]
- Breitenstein, O.; Bauer, J.; Bothe, K.; Hinken, D.; Müller, J.; Kwapil, W.; Schubert, M.C.; Warta, W. Luminescence imaging versus lock-in thermography on solar cells and wafers. In Proceedings of the 26th European Photovoltaic Solar Energy Conference and Exhibition, Hamburg, Germany, 5–9 September 2011; Volume 1. [Google Scholar]
- Juarez-Lopez, J.M.; Franco, J.A.; Hernandez-Escobedo, Q.; Muñoz-Rodríguez, D.; Perea-Moreno, A.-J. Analysis of a novel proposal using temperature and efficiency to prevent fires in photovoltaic energy systems. Fire 2023, 6, 196. [Google Scholar] [CrossRef]
- Aram, M.; Zhang, X.; Qi, D.; Ko, Y. A state-of-the-art review of fire safety of photovoltaic systems in buildings. J. Cleaner Prod. 2021, 308, 127239. [Google Scholar] [CrossRef]
- Ravindra, N.; Lin, L.; Bora, B.; Prasad, B.; Sastry, O.; Mondal, S. Influence of outdoor conditions on PV module performance—An overview. Mater. Sci. Eng. Int. J. 2023, 7, 88–101. [Google Scholar] [CrossRef]
- Cipriani, G.; D’Amico, A.; Guarino, S.; Manno, D.; Traverso, M.; Di Dio, V. Convolutional Neural Network for Dust and Hotspot Classification in PV Modules. Energies 2020, 13, 6357. [Google Scholar] [CrossRef]
- Goudelis, G.; Lazaridis, P.I.; Dhimish, M. A review of models for photovoltaic crack and hot-spot prediction. Energies 2022, 15, 4303. [Google Scholar] [CrossRef]
- Niazi, K.A.K.; Akhtar, W.; Khan, H.A.; Yang, Y.; Athar, S. Hot-spot diagnosis for solar photovoltaic modules using aIe Bayes classifier. Sol. Energy 2019, 190, 34–43. [Google Scholar] [CrossRef]
- Dhimish, M.; Tyrrell, A.M. Power loss and hot-spot analysis for photovoltaic modules affected by potential induced degradation. npj Mater. Degrad. 2022, 6, 11. [Google Scholar] [CrossRef]
- Bharadwaj, P.; Karnataki, K.; John, V. Formation of hot-spots on healthy PV modules and their effect on output performance. In Proceedings of the 2018 IEEE 7th World Conference on Photovoltaic Energy Conversion (WCPEC) (A Joint Conference of 45th IEEE PVSC, 28th PVSEC & 34th EU PVSEC), Waikoloa, HI, USA, 10–15 June 2018; pp. 676–680. [Google Scholar] [CrossRef]
- Yuan, Z.; Xiong, G.; Fu, X. Artificial Neural Network for Fault Diagnosis of Solar Photovoltaic Systems: A survey. Energies 2022, 15, 8693. [Google Scholar] [CrossRef]
- Parikh, H.R.; Buratti, Y.; Spataru, S.; Villebro, F.; Reis Benatto, G.A.D.; Poulsen, P.B.; Wendlandt, S.; Kerekes, T.; Sera, D.; Hameiri, Z. Solar cell cracks and finger failure detection using statistical parameters of electroluminescence images and machine learning. Appl. Sci. 2020, 10, 8834. [Google Scholar] [CrossRef]
- Fernández, A.; Usamentiaga, R.; de Arquer, P.; Fernández, M.Á.; Fernández, D.; Carús, J.L.; Fernández, M. Robust detection, classification and localization of defects in large photovoltaic plants based on unmanned aerial vehicles and infrared thermography. Appl. Sci. 2020, 10, 5948. [Google Scholar] [CrossRef]
- Kim, B.; Serfa Juan, R.O.; Lee, D.-E.; Chen, Z. Importance of image enhancement and CDF for fault assessment of photovoltaic module using IR thermal image. Appl. Sci. 2021, 11, 8388. [Google Scholar] [CrossRef]
- Ballestín-Fuertes, J.; Muñoz-Cruzado-Alba, J.; Sanz-Osorio, J.F.; Hernández-Callejo, L.; Alonso-Gómez, V.; Morales-Aragones, J.I.; Gallardo-Saavedra, S.; Martínez-Sacristan, O.; Moretón-Fernández, Á. Novel utility-scale photovoltaic plant electroluminescence maintenance technique by means of bidirectional power inverter controller. Appl. Sci. 2020, 10, 3084. [Google Scholar] [CrossRef]
- Henry, C.; Poudel, S.; Lee, S.-W.; Jeong, H. Automatic detection system of deteriorated PV modules using drone with thermal camera. Appl. Sci. 2020, 10, 3802. [Google Scholar] [CrossRef]
- Hwang, M.-H.; Kim, Y.-G.; Lee, H.-S.; Kim, Y.-D.; Cha, H.-R. A study on the improvement of efficiency by detection solar module faults in deteriorated photovoltaic power plants. Appl. Sci. 2021, 11, 727. [Google Scholar] [CrossRef]
- Liao, K.-C.; Lu, J.-H. Using UAV to detect solar module fault conditions of a solar power farm with IR and visual image analysis. Appl. Sci. 2021, 11, 1835. [Google Scholar] [CrossRef]
- Hammami, M.; Torretti, S.; Grimaccia, F.; Grandi, G. Thermal and performance analysis of a photovoltaic module with an integrated energy storage system. Appl. Sci. 2017, 7, 1107. [Google Scholar] [CrossRef]
- Kesavan, A.; Khanum, K.; Subbiahraj, S.; Ramamurthy, P. Evaluation of Polymer Solar Cell Efficiency To Understand the Burn-in Loss. J. Phys. Chem. C 2019, 123, 22699–22705. [Google Scholar] [CrossRef]
- Hishikawa, Y.; Yamagoe, K.; Onuma, T. Non-contact measurement of electric potential of photovoltaic cells in a module and novel characterization technologies. Jpn. J. Appl. Phys. 2015, 54, 08KG05. [Google Scholar] [CrossRef]
- Yasuda, S.; Okamoto, C.; Hishikawa, Y.; Negami, T.; Kawano, Y.; Minemoto, T. Hot-spot heat analysis on single crystalline Si based solar cell modules under partial shading, 21st “Next Generation Solar Power Generation System” Symposium. In Proceedings of the 4th Japan Photovoltaic Society Academic Conference, Kyoto, Japan, 29 June 2023. [Google Scholar]
- Breitenstein, O.; Bauer, J.; Bothe, K.; Kwapil, W.; Lausch, D.; Rau, U.; Schmidt, J.; Schneemann, M.; Schubert, M.C.; Wagner, J.-M.; et al. Understanding junction breakdown in multicrystalline solar cells. J. Appl. Phys. 2011, 109, 71101. [Google Scholar] [CrossRef]
- Wendlandt, S.; Giese, A.; Drobisch, A.; Tornow, D.; Hanusch, M.; Berghold, J.; Krauter, S.; Grunow, P. The temperature as the real hot spot risk factor at PV-modules. In Proceedings of the 27th European Photovoltaic Solar Energy Conference, Frankfurt, Germany, 24–28 September 2012. [Google Scholar]
- Vieira, R.G.; De Araújo, F.M.; Dhimish, M.; Guerra, M.I. A Comprehensive Review on Bypass Diode Application on Photovoltaic Modules. Energies 2019, 13, 2472. [Google Scholar] [CrossRef]
- Philipp, D.; Manuel, H.; Fokuhl, E.; Muelhoefer, G. Hot-spot endurance test—Modifications for bifacial photovoltaic modules. In Proceedings of the 35th European PV Solar Energy Conference and Exhibition, Brussels, Belgium, 24–28 September 2018; pp. 1029–1033. [Google Scholar]
- Klasen, N.; Weisser, D.; Rößler, T.; Neuhaus, D.H.; Kraft, A. Performance of shingled solar modules under partial shading. Prog. Photovolt. Res. Appl. 2022, 30, 325–338. [Google Scholar] [CrossRef]
- Bogachuk, D.; Saddedine, K.; Martineau, D.; Narbey, S.; Verma, A.; Gebhardt, P.; Herterich, J.P.; Glissmann, N.; Zouhair, S.; Markert, J.; et al. Perovskite Photovoltaic Devices with Carbon-Based Electrodes Withstanding Reverse-Bias Voltages up to –9 V and Surpassing IEC 61215:2016 International Standard. Solar RRL 2022, 6, 2100527. [Google Scholar] [CrossRef]
- SunPower Performance Panel Technology for Large-Scale Installations, Maxeon Solar Technologies. Available online: https://sunpower.maxeon.com/int/sites/default/files/2022-03/COLLAT-100_Performance_Power_White_Paper_P6_Launch_FEB22_V15_FINAL.pdf (accessed on 3 September 2023).
- International Electrotechnical Commission (IEC), IEC 61215-2:2016: Terrestrial Photovoltaic (PV) Moules-Design Qualification and Type Appoval-Part 2: Test Procedures. Available online: https://webstore.iec.ch/publication/61350 (accessed on 3 September 2023).
- International Electrotechnical Commission (IEC), IEC 61730-2:2023 Photovoltaic (PV) Module Safety Qualification-Part 2: Requirements for Testing. Available online: https://webstore.iec.ch/publication/63895 (accessed on 3 September 2023).


| Item | IR Camera | This Method |
|---|---|---|
| Visual presentation | Yes | No |
| Indicator | Temperature | Heat |
| Sensing | IR radiation | Electric field |
| Scaling to the worst-case | Not applicable | Applicable |
| Measurement error | 1 °C | 1% of the fire risk threshold |
| Item | Output Value | Performance |
|---|---|---|
| Nominal maximum power (Pm) | 90 (W) | >90% |
| Nominal maximum output operating current (Ipm) | 5.06 (A) | |
| Nominal maximum output operating voltage (Vpm) | 17.8 (V) | |
| Nominal short-circuit current (Isc) | 5.4 (A) | >90% |
| Nominal open-circuit voltage (Voc) | 22.4 (V) | ±10% |
| Condition | Irradiance (W/m2) |
|---|---|
| No processing | 152.4 |
| Cover cut | 185.7 |
| +Aluminum tape attached | 218.5 |
| Condition | Irradiance (W/m2) |
|---|---|
| Response time | about 17 s |
| Viewing angle | 2π (sr) |
| Operating temperature range | 10 to +50 °C (accuracy guaranteed range) −40 to +80 °C (operating temperature range) |
| Temperature characteristics | ±2% or less (rate of response change when ambient temperature changes by 50 °C) |
| Condition | Values |
|---|---|
| Voltage measurement range | ±1 mV to ±100 V 1–5 V |
| Resolution | 500 nV |
| Recording interval | 10 ms to 50 ms, 100 ms to 1 h |
| Dimensions | 272 W × 182.4 H × 66.5 D mm |
| Functions | Real-time saving to USB memory, Numerical value/waveform calculation, etc. |
Disclaimer/Publisher’s Note: The statements, opinions and data contained in all publications are solely those of the individual author(s) and contributor(s) and not of MDPI and/or the editor(s). MDPI and/or the editor(s) disclaim responsibility for any injury to people or property resulting from any ideas, methods, instructions or products referred to in the content. |
© 2023 by the authors. Licensee MDPI, Basel, Switzerland. This article is an open access article distributed under the terms and conditions of the Creative Commons Attribution (CC BY) license (https://creativecommons.org/licenses/by/4.0/).
Share and Cite
Shimizu, R.; Ota, Y.; Nagaoka, A.; Araki, K.; Nishioka, K. Non-Contact Monitoring of Operating Conditions for Solar Cells in a Photovoltaic Module Using a Surface Potential Meter for Detecting the Risk of Fire. Appl. Sci. 2023, 13, 10391. https://doi.org/10.3390/app131810391
Shimizu R, Ota Y, Nagaoka A, Araki K, Nishioka K. Non-Contact Monitoring of Operating Conditions for Solar Cells in a Photovoltaic Module Using a Surface Potential Meter for Detecting the Risk of Fire. Applied Sciences. 2023; 13(18):10391. https://doi.org/10.3390/app131810391
Chicago/Turabian StyleShimizu, Ryo, Yasuyuki Ota, Akira Nagaoka, Kenji Araki, and Kensuke Nishioka. 2023. "Non-Contact Monitoring of Operating Conditions for Solar Cells in a Photovoltaic Module Using a Surface Potential Meter for Detecting the Risk of Fire" Applied Sciences 13, no. 18: 10391. https://doi.org/10.3390/app131810391
APA StyleShimizu, R., Ota, Y., Nagaoka, A., Araki, K., & Nishioka, K. (2023). Non-Contact Monitoring of Operating Conditions for Solar Cells in a Photovoltaic Module Using a Surface Potential Meter for Detecting the Risk of Fire. Applied Sciences, 13(18), 10391. https://doi.org/10.3390/app131810391