Abstract
In recent years, trimarans have been used in high-speed transport and in warships, but studies of them have made little progress. We designed a trimaran model and used it to perform a water-entry experiment to find a way to reduce the slamming pressure. The process of the model entering the water was divided into several steps, and different theoretical models were designed for each step, together with their force analysis. Relying on our experimental platform, we designed three flexible coating thicknesses and six drop heights as the different working conditions. With an analysis of the results under these experimental conditions, the experiment clearly indicates that the flexible cladding on the model can decrease the impact force when the model slams into water. Furthermore, the theoretical models and their corresponding force analyses are validated by the experimental results.
1. Introduction
Trimarans have excellent stability, seakeeping, and rapidity and are widely used in high-speed transport and in warships. Compared to the mono-hull ship, it has the advantages of better overall arrangement for the wider flight deck, stronger survivability as a kind of warship, and smaller resistance as a type of transport. In adverse sea conditions, trimarans’ sheaves will move due to strong wind and a high wave load. Although the duration of the impact pressure is relatively short, its peak value is very large. The mild impact pressure will cause the deformation of or fatigue damage to the hull structure, and the serious impact pressure will even be a threat to the safety of the hull and may result in serious marine accidents. For military ships, the bang will affect the ship’s electronic equipment, and for civilian ships, the bang will affect the passengers’ experience and cause unnecessary panic. To date, many trimaran accidents have been caused by water slamming, and thus, the prediction of the slamming load due to water has received much attention. For example, the Onomichi maru, weighing 66,874 tons, sank due to water slamming in the early 1980s. It is therefore necessary to find a way to reduce the water-slamming pressure.
Research on water slamming dates back to Von Karman in 1929. It involves potential flow theory [1], the conservation of momentum [2], and elastomer angles, as well as the changes in elastic effect when a wedge-shaped body enters the water [3]. The model structure for water-slamming experiments can be a sphere or cone [4], structures with different sections [5], a flat bottom [6], a V shape with an areal ship profile [7], a large wedge plate frame with different stiffnesses [8], or a wedge [9]. In the last decade, the research on the slamming force has focused on simulation [10,11]. For example, using CFD-FEA is a possible way to simulate the slamming and the green water loads on a sailing ship, and it is a method that combines computational fluid dynamics (CFD) and finite element analysis (FEA) solvers [12]. Furthermore, the simulation of green water and the slamming loads of ships shows that high-frequency components of the freak waves have a significant impact on the frequencies of peak pressure in the bow and deck area [13]. After finding ways to perform the simulation, people were able to predict water-slamming loads in different situations. Arbitrary Lagrangian–Eulerian (ALE) finite element method is one of the ways to perform the prediction, and it was used to study the impact between the flat panel and calm water [14]. However, by comparing the results from the experiment and the simulation, it was found that the numerical results might be larger than the experimental results by as high as 21% [15]. As the accuracy of the prediction of the slamming pressure was unacceptable, the fully coupled ALE algorithm was used to improve the accuracy [16]. However, the discretization of ALE will cause uncertainty in the simulation [17]. Another approach to the prediction of the slamming loads was presented by combining the seakeeping theory and CFD technology [18].
Some recent studies on trimarans are available. The peak pressure value was found to increase when the heel angle enlarges on the lower side of the trimaran [19].
There are many articles on simulations of the slamming pressure and the factors that influence the slamming pressure in the literature. However, little progress has been made in the field of reducing water slamming [20]. One of the possible ways to reduce the slamming pressure is to use the air-cushion effect [21]. In this paper, flexible cladding is placed in certain places where the peak water-slamming load is huge in order to decrease its influence on the ship.
2. Experiment Model Design
In order to ensure the similarity of the trimaran model and a real ship, the model came from the profile data of the cross-section at one-fourth of the whole length to the theback-end of the ship, but at a ratio of 1:100. The photos of the trimaran model are shown in Figure 1.
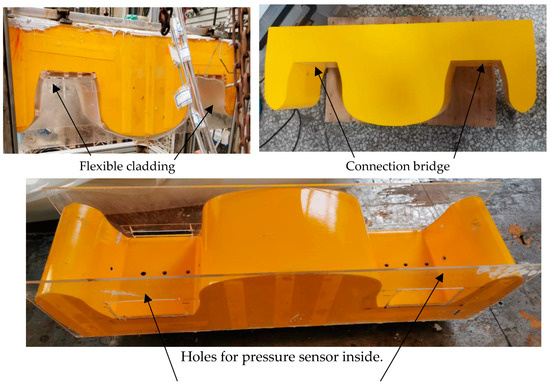
Figure 1.
Photos of the trimaran model.
The model is symmetrical. It can be simplified to a two-dimensional parametric model, as illustrated in Figure 2. The thickness of the model is 20 cm, and the yellow points in the figure are the positions of the measuring points for the slamming pressure. A1 and A2 are two positions of fixtures, and S1 is the center point, where the speed is measured. The curved parts of the model are approximated by straight segments, shown as the blue lines in Figure 2, for computational purposes. The calculations in the theoretical analysis section verify that these simplifications are reasonable by comparing the results from te experiment and the theoretical calculation.
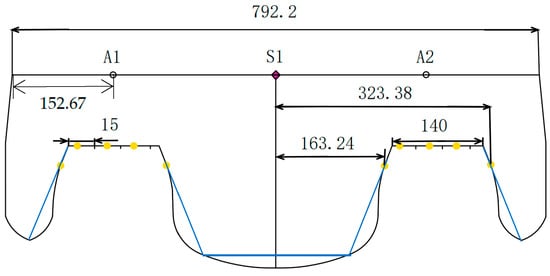
Figure 2.
Two-dimensional parametric model of the trimaran model (in mm). The simplified model is identified by blue lines.
3. Force Analysis of the Trimaran Model
The process of the model entering the water can be divided into four stages, and a force analysis for each stage is given in this section.
Stage 1: Free fall in the air
At this stage, three forces are exerted on the model, namely air resistance , gravity , and guide rail friction resistance . The schematic of force analysis is shown in Figure 3.
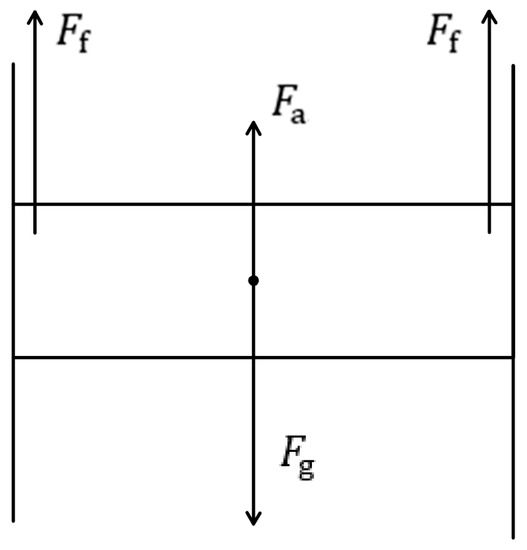
Figure 3.
The schematic of force analysis for stage 1.
The resultant force is given by
which determines the speed of the model when it touches water.
The air resistance can be estimated by
where is air dragging coefficient, considered to be slightly smaller than 1 due to the shape of the model; is density of air and normally kg/; is the windward area of the object and approximately ; and is the motion speed of the model relative to the air, and m/s according to [8]. The air resistance is considered N and is negligible compared to gravity (240 N) [8].
By the law of conservation of energy, we have
where is the height of the trimaran model relative to the water surface, and is the mass.
Stage 2: Main hull entering the water
When the bottom of the model enters the water, it will receive a reaction force from the water. At this stage, seven forces are applied to the model, namely, air resistance , gravity , guide-rail friction resistance , the buoyancy of water , the water’s impact force on the main hull , the impact force on auxiliary hulls , and the impact force on the connection bridge by splatter water . The schematic of force analysis is shown in Figure 4.
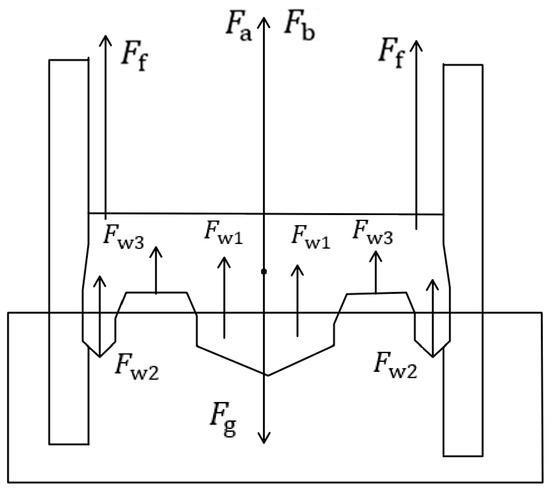
Figure 4.
The schematic of force analysis for stage 2.
The resultant force is given by
is hard to calculate, and it was obtained experimentally.
In order to calculate the buoyancy of water , the main hull and the auxiliary hulls are approximated by three cubes. The bottom areas of the auxiliary hulls are approximately , and that of the main hull is approximately .
- (i)
- Slamming the flat plate into the water
The impact force is given by
where is the water density, is the slamming coefficient, is the water-contacting area , and is the speed of the flat plate relative to water.
Equation (5) is used to calculate the slamming force when the main hull enters the water.
- (ii)
- Wagner’s theoretical model
Wagner’s theoretical model is illustrated in Figure 5. The impact force is given as [2]
where is water density, is the speed of an object relative to water, is the width of one side, and is the angle between the tangent of the model and the water.
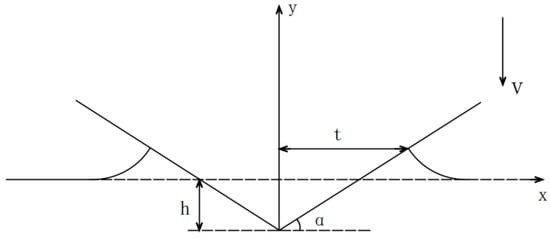
Figure 5.
Wagner’s theoretical model.
Equation (6) is used to calculate the slamming force when the auxiliary hulls enter the water. In order to use (6), the measuring points on the side of the trimaran model, as shown in Figure 1 and Figure 2, need to be simplified.
Stage 3: Connection bridge entering the water
The connection bridge entering water means that the largest sectional area of the trimaran model submerges into the water and will receive a reaction force . At this stage, force on the trimaran model is , which is the result of air resistance , gravity , buoyancy of water , the impact force on the connection bridge part , and the guide rail friction resistance , given by
The schematic of force analysis is shown in Figure 6.
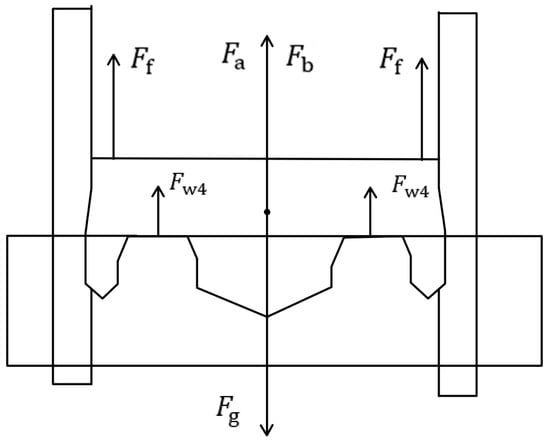
Figure 6.
The schematic of force analysis for stage 3.
Stage 4: Trimaran model sinking to the bottom of the water tank
At this stage, three forces are applied to the model, namely gravity , the buoyancy of water , and the guide-rail friction resistance . The model falls to the bottom of the water tank at a decreasing speed.
4. Experiment Design
4.1. Layout of Measuring Points
This experiment was planned to raise the model to a specified height and then release it. In this process, the pressure on the measuring points was measured, and the speed of the model could be calculated by taking the derivative of the displacement of the model.
The layout of measuring points is shown in Figure 7.
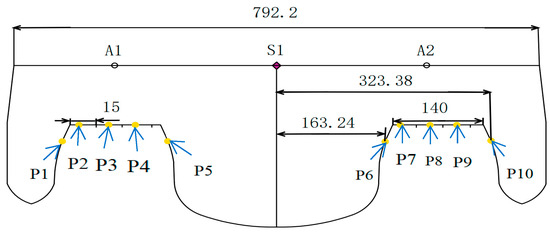
Figure 7.
Layout of measuring points.
4.2. Experiment Procedure
The falling body’s experiment platform was our laboratory’s own design. It is 3.5 m high, and it can be used to perform a slamming experiment on a falling body from a height of 2.5 m, as shown in Figure 8. The platform is composed of supporting frames, guide-rail frames, sliding frames, and a limiting device for raising and releasing the trimaran model. During the experiment, the sliding frame and the model went into the water together. By fixing a weight on the frame, the model can always go into the water completely despite the large buoyancy force relative to the weight of the model.
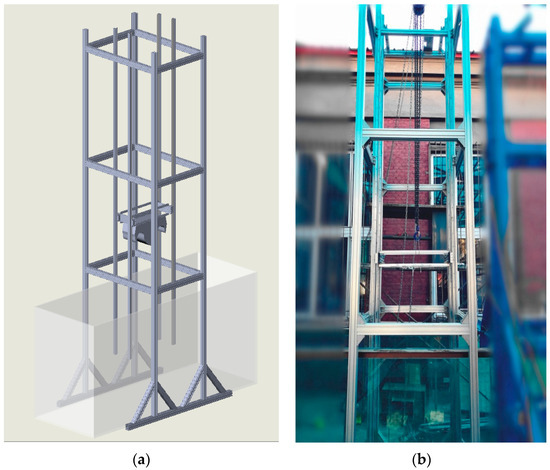
Figure 8.
Falling experiment frame: (a) 3D picture, (b) the platform.
In addition to the frame, other instruments were used, including a glass tank, pressure transducers, displacement transducers, data acquisition instruments, high-speed cameras, and other auxiliary test equipment.
The principle of the experiment is to lift the model to a preset height and then release it. The model moved into the water at a certain speed after the falling motion, and thumping occurred. Throughout the process of water slamming, the slamming pressure at the measuring points on the model and the overall displacement curve could be obtained through the devices withy pressure sensors. By taking the derivative of the displacement curve, the speed of the model when entering the water could be obtained. The experiment process was divided into the following steps.
- (i)
- Calibration of sensors
Ten pressure sensors and one displacement sensor were used in this experiment. To ensure the accuracy of calibration, each pressure sensor matches a signal amplifier, and it can measure the pressure of a 100 m water column. A pressure calibrator was used to calibrate them to an accuracy with an error margin under 1%.
- (ii)
- Installation, release, and data collection
The pressure sensors were installed on the model, and the model was fixed at the sliding frame using some fixtures. The hook on the frame was connected to a decoupling device, and the drop height was changed by raising or lowering the sliding frame. One side of all the sensors was linked to the data-acquisition device DH5902N, which was connected to a computer. When system installation was completed, the model was raised to a proper height, according to a prespecified working condition. After the Balance Clearing button on the software interface was pressed, the experiment setup was ready.
- (iii)
- Setting of the working conditions
To decrease the influence of data-acquisition errors, guide rail friction, and model burr, a diverse set of experiment heights were set. Due to limited space, five of them are shown in Table 1.

Table 1.
Setting of the working conditions.
The flexible cladding and how it was used are shown in Figure 9.
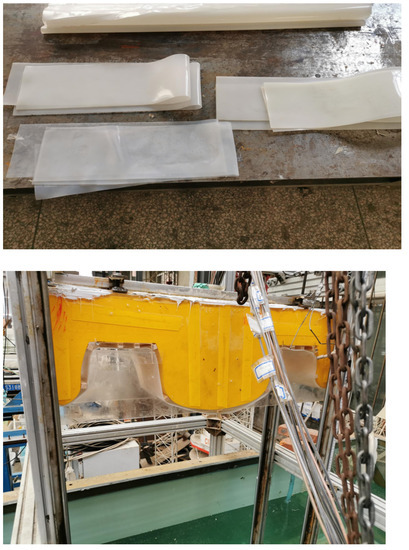
Figure 9.
Flexible cladding.
Processing methods 1–4 were designed to explore the effect of flexible cladding with different thicknesses, and processing method 5 was used to verify the effect of flexible cladding on reducing slamming pressure.
5. Water-Slamming Experiment and Force Analysis
5.1. Data Processing
The data of slamming pressure and displacement were collected through DH5902N, and then the data were processed as follows.
- (1)
- The data were cleaned by filtering the noisy data arising from the unstable power supply and human-made movement.
- (2)
- The actual speed was derived from the data measured using the displacement sensors. Due to the friction on the guide rail, the water-entry speed calculated from the drop height is inaccurate.
- (3)
- The peak value of the data measured by the pressure sensors was recorded and the displacement data were differentiated to obtain the speed. Then, the slamming coefficient could be derived from the speed and pressure data.
5.2. Slamming Experiment When the Trimaran Entered the Water
The experiment data include ten slamming pressure signals, two acceleration signals, and one displacement signal. The working conditions needed to be repeated several times to ensure the accuracy of the data. The data from the same conditions have similar trends and peak values.
5.2.1. Experiment without Flexible Cladding
For this group, the results of all the processed curves for a certain drop height are listed here as an example, and the subsequent data are only listed in Table 2. The processed data curves under the H16 working conditions are shown in Figure 10. Figure 11 gives the raw data.
Table 2.
Experiment without flexible cladding.
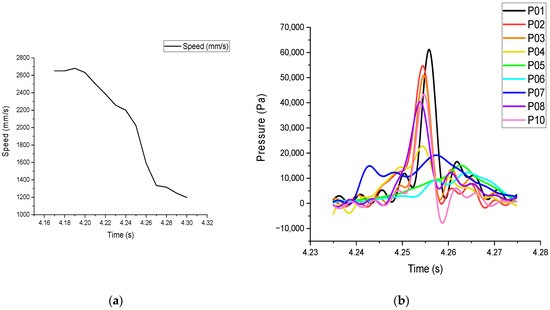
Figure 10.
Speed and pressure versus time. (a) Speed versus time, (b) pressure versus time.
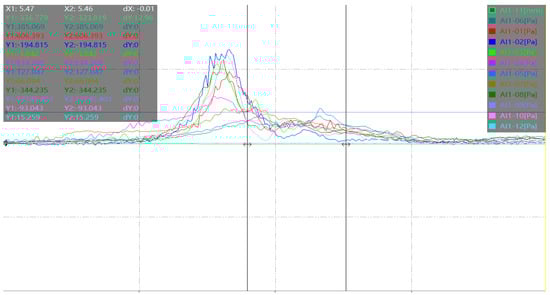
Figure 11.
Raw data.
The test data and the calculated slamming-pressure coefficients for each working condition are listed in Table 2.
The slamming-pressure coefficient is calculated by
where is the peak slamming pressure, is the fluid density, and is the velocity of the model when the peak slamming pressure is achieved.
As observed in Figure 10, the trimaran model slowed down during this period, especially after the slamming pressure reached the peak.
The slamming-pressure coefficient from the falling experiment without flexible cladding at six different heights (H11–H16)is shown in Figure 12.
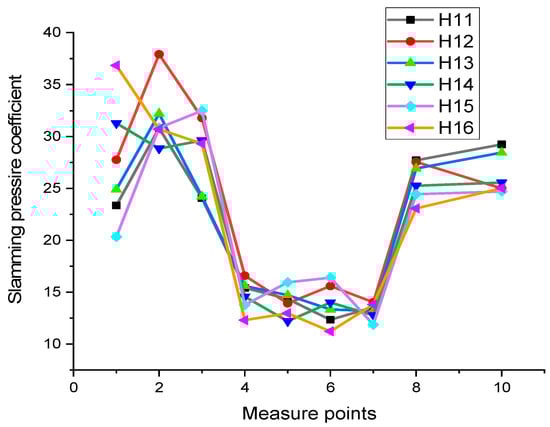
Figure 12.
Slamming-pressure coefficient in the case without flexible cladding.
In Figure 7, P2, P9 and P3, P8 are two pairs of measuring points that are symmetrical, and the slamming pressures measured at these points are high. In contrast, while P4, P7 and P5, P6 are also symmetrical, the corresponding slamming pressures are low.
For H11–H16, the obtained slamming-pressure coefficients have a similar varying trend. As the drop height increased, the water-entry speed increased, while the slamming pressure dropped slightly. This is due to the fact that air entered the water when the model entered the water quickly, leading to a decrease in the slamming pressure and its coefficient.
5.2.2. Experiment in the Case of Flexible Cladding with a 1 mm Thick Silica Gel Plate
The test data and the calculated slamming-pressure coefficients for each working condition are listed in Table 3.
Table 3.
Experiment with 1 mm silica gel sheet.
For the relationships of speed and pressure versus time, we chose height H16 as an example. The characteristic curves of speed and pressure versus time are shown in Figure 13.
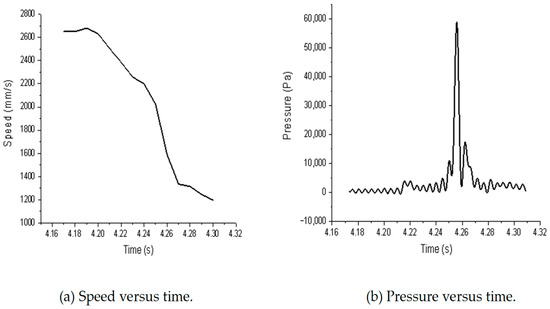
Figure 13.
Speed and pressure versus time in the case of 1 mm thick flexible cladding.
As observed from Figure 13, the trimaran model slowed down gradually, especially after the slamming pressure reached the peak. At 4.18 s, the model entered the water and began to slow down. And at around 4.245 s, the connection bridge hit the water.
The data from falling experiment are shown in Figure 14 for six different heights (H11–H16).
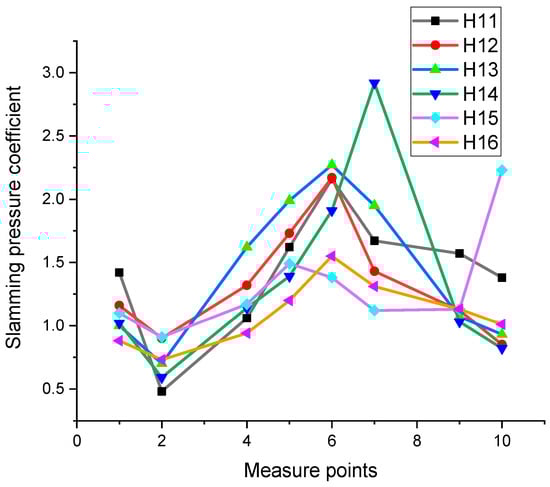
Figure 14.
Slamming-pressure coefficient in the case of 1 mm thick flexible cladding.
5.2.3. Experiment in the Case of Flexible Cladding with a 2 mm Thick Silica Gel Plate
The test data and the calculated slamming-pressure coefficients for each working condition are listed in Table 4.
Table 4.
Experiment with 2 mm silica gel sheet.
To study the relationships of speed and pressure versus time, we choose height H16 as an example. The characteristic curves of speed and pressure versus time are shown in Figure 15.
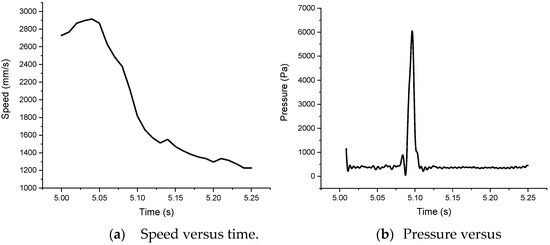
Figure 15.
Speed and pressure versus time in the case of 2 mm thick flexible cladding.
As observed in Figure 15, the trimaran model slowed down during this period, especially after the slamming pressure reached its peak.
The data collected for six different heights (H11–H16) are shown in Figure 16. As observed in Figure 16, with an increase in drop height, the coefficient of slamming pressure dropped.
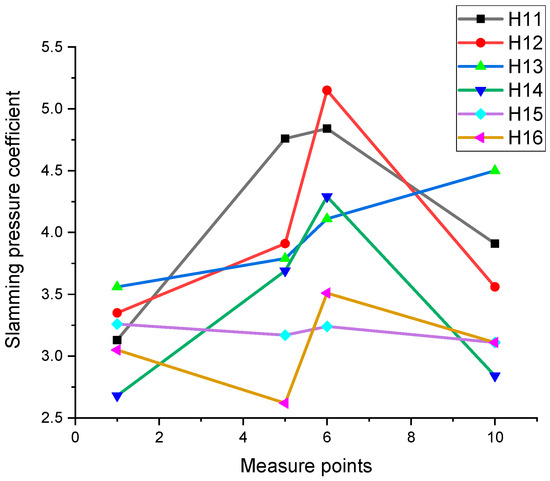
Figure 16.
Slamming-pressure coefficient with 2 mm thick flexible cladding.
5.2.4. Experiment in the Case of Flexible Cladding with a 4 mm Thick Silica Gel Plate
The test data and the calculated slamming-pressure coefficients for each working condition are listed in Table 5.
Table 5.
Experiment with 4 mm silica gel sheet.
To study the relationships of speed and pressure versus time, we chose height H16. The characteristic curves of speed and pressure versus time are shown in Figure 17.
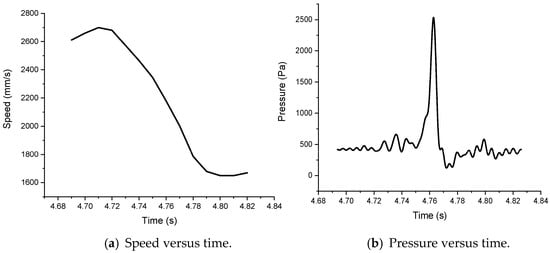
Figure 17.
Speed and pressure versus time in the case of 4 mm thick flexible cladding.
As observed in Figure 17, the trimaran model slowed down during this period, especially after the slamming pressure reached the peak.
The data collected for six different heights (H11–H16) are shown in Figure 18. As shown in Figure 18, with an increase in drop height, the coefficient of slamming pressure again dropped. This verifies that the data are reasonable.
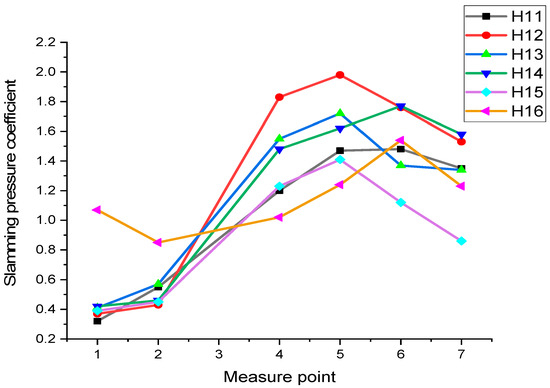
Figure 18.
Slamming-pressure coefficient for 4 mm thick flexible cladding.
5.2.5. Experiment in the Case of Flexible Cladding with 1 mm Thickness, Opening at the Positions of Pressure Sensors
The test data and the calculated slamming-pressure coefficients for each working condition are listed in Table 6.
Table 6.
Experiment with 1 mm silica gel sheet, opening at the positions of pressure sensors.
The data collected for six different heights (H11–H16) are shown in Figure 19. As shown in Figure 19, with an increase in drop height, the coefficient of slamming pressure again dropped. This verifies that the data are reasonable.
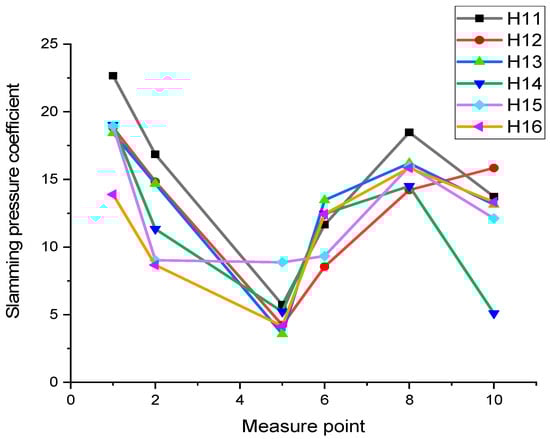
Figure 19.
Slamming-pressure coefficient for a 1 mm thick flexible cladding, opening at positions of pressure sensors.
5.3. Summary and Analysis of Experimental Results
Experimental data, including the slamming-pressure coefficients and measuring points, are summarized in Table 7.
Table 7.
Experiment data.
As seen in Table 7, compared to the data obtained from the model without flexible cladding, the slamming-pressure coefficient obtained from the group covered with a 2 mm thickness is very small; however, the measured slamming-pressure coefficients are several times larger than those obtained from the group covered with a 1 mm thickness. This may be because the thickness of 1 mm is very small, resulting in the silicone sheet being pasted on the wooden stick (shown in Figure 1) too tightly so that there was an air cushion between the pressure sensor and the water. In such a case, although the thickness is small, the reduction in slamming pressure is quite obvious. This shows that if there is space (an air cushion) between the surface flexible cladding and the trimaran model, the reduction in slamming pressure is obvious.
By comparing the 2 mm and 4 mm thickness, we find that as the thickness increases, the slamming-pressure coefficient becomes smaller and smaller until it approaches a constant when the thickness is big enough.
In order to reduce the influence of the air cushion, processing method 5 was designed. The experimental data, including the slamming-pressure coefficients and measuring points, are summarized in Table 8.
Table 8.
Experimental data of coefficients of the model without flexible cladding and the model with a 1 mm thickness silica gel plate, opening at the positions of the pressure sensors.
For the same working conditions and the same measuring point, the measured and calculated slamming-pressure coefficients of the original model are almost always larger than the measured and calculated bang-pressure coefficients of the original model covered with a 1 mm open-cell silica gel sheet. Thus, we can draw the conclusion that surface flexible cladding (silica gel plate) can reduce the slamming pressure.
6. Theoretical Analysis of the Experiments
- (i)
- Pressure measured at the side measuring points
At the falling stage, as the four measuring points P1, P5, P6, and P10 are on the side, we can use (6) to calculate the slamming pressure. Since they are bilaterally symmetrical, only the pressures on P1 and P5 are calculated using (6), where = 1003 kg/ and is set to 2 m/s, which is the average speed for H16. For P1, m, and , we have N. We can obtain the result that the pressure on P1 is Pa, which is very close to the actually measured pressure (57,849.5 Pa).
Similarly, at P5, kg/, m/s, m, and . We have N and Pa, which is very close to the pressure actually measured (15,017.5 Pa).
- (ii)
- Pressure of the main hull when entering the water
Water entry at the main hull can be regarded as the plate’s water slamming, and we use (5) for flat water slamming to estimate the slamming pressure, where kg/, for the flat, m2, and m/s according to the data. We have N and Pa.
- (iii)
- Pressure of auxiliary hulls when entering water
Due to the left–right symmetry of the trimaran model, only the left side needs to be calculated. The force is calculated using (6), where = 1003 kg/m3; = 2 m/s, which is the average speed for H16; t = 0.073 m; and , according to Figure 2. As a result, N and Pa
- (iv)
- Pressure of trimaran when connection bridge entering water
The connection bridge entering water resembles the plate’s water slamming. Thus, we can use (5) to estimate the slamming force. Furthermore, as the model is in left–right symmetry, only values for one side need to be calculated. If we only consider the connection bridge, the slamming force is calculated using (5). As a result, by calculating P07 as an example, we have N and Pa, which is close to the pressure actually measured (19,016.0 Pa).
7. Conclusions
This article aims to find a possible way to reduce the slamming pressure, in order to improve the safety of trimarans during navigation. In the model shown in Figure 1, the data measured for the two pairs of symmetrical measuring points on the outer connection bridges are large. On the contrary, the data measured for the two other pairs of symmetrical measuring points on the inner connection bridges are small. As the height changed, the slamming-pressure coefficient changed in a similar way. With an increase in the drop height, the slamming-pressure coefficient dropped slightly. The falling speed of the model decreased rapidly due to the force from the water. This was the most prominent after the slamming force reached its peak.
When flexible claddings of 1 mm, 2 mm, or 4 mm thick silica gel plate were coated on the model, it was obvious that they could reduce the slamming force significantly, especially when there was air between the model and the flexible cladding. Meanwhile, a thicker surface of flexible cladding could reduce the force more significantly. However, this led to a blunt effect. In the same working conditions, when the thickness was increased from 1 mm to 4 mm, the change in the measured slamming pressure was small. When the thickness was increased from 0 mm to 2 mm, the slamming-pressure coefficient decreased by around 75–80%. However, from 0 mm to 4 mm, it only decreased by around 80–90%. The thickness increased a lot, but the effect did not actually improve much.
The results from the force model and the main hull’s force-prediction model are in close agreement with those obtained from the experiment. Thus, our experiment confirms that the theoretical model is effective. For the same working conditions, the model with flexible cladding will reduce the pressure by nearly 50%. And our experiment validates that it is possible to reduce the slamming pressure of the trimaran to improve security by using flexible cladding.
Author Contributions
Writing—original draft, J.L.; Supervision, S.S. All authors have read and agreed to the published version of the manuscript.
Funding
This research received no external funding.
Institutional Review Board Statement
Not applicable.
Informed Consent Statement
Not applicable.
Data Availability Statement
[dataset] J.L. 2023. Experiment Data.Zip; Figshare; https://figshare.com/articles/dataset/dx_doi_org_10_6084_m9_figshare_6025748/6025748, accessed on 13 September 2023.
Conflicts of Interest
The authors declare no conflict of interest.
References
- Von Karman, T. The Impact of Seaplane Floats during Landing; NACA TN 321; National Advisory Committee for Aeronautics: Washington, DC, USA, 1929; pp. 1–8.
- Wagner, H. Uber stoss-und gleitvorgange undder oberflache von flussigkeiten. ZAMM 1932, 12, 193–215. [Google Scholar] [CrossRef]
- Ren, Z.; Javaherian, M.J.; Ikeda-Gilbert, C. Kinematic and inertial hydro-elastic effects caused by vertical slamming of a flexible V-shaped wedge. J. Fluids Struct. 2021, 103, 103257. [Google Scholar]
- Chuang, S.L. Experiments on slamming of wedge-shaped bodies. J. Ship Res. 1967, 12, 190–198. [Google Scholar] [CrossRef]
- Greenhow, M.; Lin, W.M. Nonlinear-Free Surface Effects: Experiments and Theory; Massachusetts Inst of Tech Cambridge Dept of Ocean Engineering: Cambridge, MA, USA, 1983. [Google Scholar]
- Truong, D.D.; Jiang, B.S.; Ju, H.-B.; Han, S.W.; Han, S. A study on dynamic response of flat stiffened plates to slamming loads considering fluid-structure interaction. In Practical Design of Ships and Other Floating Structures, Proceedings of the 14th International Symposium, PRADS 2019, Yokohama, Japan, 22–26 September 2019; Lecture Notes in Civil Engineering; Springer: Singapore, 2021; Volume 64, pp. 75–99. [Google Scholar]
- Zhao, R.; Faltinsen, O.M.; Aarsnes, J.V. Water entry of arbitrary two-dimensional sections with and without flow separation. In Proceedings of the 21st Symposium on Naval Hydrodynamics; National Academies Press: Trondheim, Norway, 1996; pp. 408–423. [Google Scholar]
- Ren, Z.; Javaherian, M.J.; Gilbert, C. Vertical wedge drop experiments as a model for slamming. J. Ship Res. 2021, 66, 297–314. [Google Scholar] [CrossRef]
- Seo, B.; Shin, H. Experimental study of slamming effects on wedge and cylindrical surfaces. Appl. Sci. 2020, 10, 1503. [Google Scholar] [CrossRef]
- Jiao, J.; Huang, S. CFD simulation of ship sea keeping performance and slamming loads in bi-directional cross wave. J. Mar. Sci. Eng. 2020, 8, 312. [Google Scholar] [CrossRef]
- Wang, Y.; Zheng, C.; Wu, W. On slamming load and structural response of a flexible wedge via analytical methods and numerical simulations. Explos. Shock Waves 2021, 41, 97–112. (In Chinese) [Google Scholar]
- Jiao, J.; Huang, S.; Tezdogan, T.; Terziev, M.; Soares, C.G. Slamming and green water loads on a ship sailing in regular waves predicted by a coupled CFD–FEA approach. Ocean Eng. 2021, 241, 110107. [Google Scholar] [CrossRef]
- Liu, D.; Li, F.; Liang, X. Numerical study on green water and slamming loads of ship advancing in freaking wave. Ocean Eng. 2022, 261, 111768. [Google Scholar] [CrossRef]
- Cheon, J.S.; Jang, B.S.; Yim, K.H.; Lee, H.D.; Koo, B.-Y.; Ju, H. A study on slamming pressure on a flat stiffened plate considering fluid–structure interaction. J. Mar. Sci. Technol. 2016, 21, 309–324. [Google Scholar] [CrossRef]
- Liu, X.; Liu, F.; Ren, H.; Chen, X.; Xie, H. Experimental investigation on the slamming loads of a truncated 3D stern model entering into water. Ocean Eng. 2022, 252, 110873. [Google Scholar] [CrossRef]
- Wang, S.; Soares, C.G. A numerical investigation on water slamming of stiffened panels. In Proceedings of the ASME 2018 37th International Conference on Ocean, Offshore and Arctic Engineering, Madrid, Spain, 17–22 June 2018. [Google Scholar]
- Wang, S.; Islam, H.; Soares, C.G. Uncertainty due to discretization on the ALE algorithm for predicting water slamming loads. Mar. Struct. 2021, 80, 103086. [Google Scholar] [CrossRef]
- Li, P.; Xie, H.; Liu, F.; Yu, P.; Liu, X. Numerical approach for predicting the slamming loads in oblique long waves considering the wave-body interface. Ocean Eng. 2022, 262, 112089. [Google Scholar] [CrossRef]
- Duan, W.-Y.; Liu, J.-Y.; Liao, K.-P.; Ma, S. Experimental study of slamming pressure for a trimaran section with different drop heights and heel angles. Ocean Eng. 2022, 263, 112400. [Google Scholar] [CrossRef]
- Sun, Z.; Sui, X.; Deng, Y.; Zou, L.; Korobkin, A.; Xu, L.; Jiang, Y. Characteristics of slamming pressure and force for trimaran hull. J. Mar. Sci. Eng. 2021, 9, 563. [Google Scholar] [CrossRef]
- Ma, S.; Duan, W.; Cao, Z.; Liu, J.; Zhang, M.; Li, X.; Liu, D. Experimental study on the drop test on wet deck slamming for a SWATH segment model. Ocean Eng. 2023, 285, 115377. [Google Scholar] [CrossRef]
Disclaimer/Publisher’s Note: The statements, opinions and data contained in all publications are solely those of the individual author(s) and contributor(s) and not of MDPI and/or the editor(s). MDPI and/or the editor(s) disclaim responsibility for any injury to people or property resulting from any ideas, methods, instructions or products referred to in the content. |
© 2023 by the authors. Licensee MDPI, Basel, Switzerland. This article is an open access article distributed under the terms and conditions of the Creative Commons Attribution (CC BY) license (https://creativecommons.org/licenses/by/4.0/).