Abstract
The purpose of this study was to analyze the effects of fatigue and tension on the physical characteristics and abilities of air traffic controllers (ATCOs) and determine their influence mechanisms. A simulated experiment was designed to evaluate the responses of ATCOs in four states: alertness, fatigue, tension, and fatigue and tension. Thirty young male ATCOs participated in the experiment. Fifteen parameters of their physical characteristics and abilities were collected and analyzed to estimate the effects and the decreasing order of influence of fatigue and tension on the indicators. The results showed that most of the parameters of the ATCOs were significantly affected by fatigue and tension. The attention, perception, reaction time, decision-making ability, and comprehensive performance of the ATCOs were adversely affected by fatigue, and tension had negative effects on their attention, decision-making ability, and comprehensive performance. Fatigue and tension impair the physical characteristics and abilities of ATCOs. Both states initially affected the physical characteristics of the ATCOs and then impaired their abilities. However, the influence mechanisms involved were different. The primary effect of the fatigue state was slowing down, whereas the effect of the tense state was instability. These results provide a reference for the evaluation and management of fatigue and tension states in ATCOs.
1. Introduction
1.1. Background
Being an air traffic controller (ATCO) has been considered as one of the most stressful and difficult professions because of the significant responsibilities involved [1]. Air traffic controllers (ATCOs) prevent the collision of aircraft and ensure the required separation intervals between aircraft [2,3]. Hundreds of passengers’ lives are at risk if ATCOs make incorrect decisions. ATCOs should be in good physical condition to ensure a high quality of work. However, some ATCOs perform their duties in fatigue and tension states, increasing their potential for human error and threatening aviation safety. Fatigue is one of the most common high-risk states and significantly impairs the performance of ATCOs. A survey conducted by National Aeronautics and Space Administration (NASA) in 2010 indicated that 18% of respondents reported that they had a proximity event, operational deviation, or operational error in the last year, and 56% of the respondents attributed these operational events to fatigue [4]. Fatigue in ATCOs has been proven to be a hazard closely associated with aviation accidents or incidents [5]. Tension is another frequent at-risk state for ATCOs because of their occupational characteristics. A study of ATCOs in North and Southwest China indicated that 77.4% of ATCOs had experienced job tension which impaired their performance [6]. Another survey of at-risk states in ATCOs in China indicated that 82.5% of respondents had experienced fatigue while on duty, and 50.7% had experienced job tension [7]. Fatigue and tension are closely related to the physical characteristics of ATCOs and affect their abilities [6,8], which is why the two degraded performance states will reduce the safety level of air traffic control [7]. It is essential to analyze the relationship between the physical characteristics and abilities of ATCOs and the two at-risk states. A better understanding of this relationship will result in improved regulations for ATCOs to prevent fatigue and tension while on duty.
1.2. Literature Review of the Studies on Fatigue in ATCOs
Existing research on fatigue has primarily focused on the effects of fatigue on performance, the factors influencing fatigue, and countermeasures. There is no univocal accepted definition of fatigue [9] because the concept is used in many fields. In simple terms, a person’s fatigue means feeling sleepy, tired, or exhausted [10,11]. In the civil aviation field, fatigue has been researched extensively because it is an at-risk state and impairs a person’s working performance. The International Civil Aviation Organization (ICAO) defines crewmember fatigue as “[a] physiological state of reduced mental or physical performance capability resulting from sleep loss, extended wakefulness, circadian phase, and/or workload (mental and/or physical activity) that can impair a person’s alertness and ability to perform safety-related operational duties” [12]. The definitions reveal that fatigue is a state of diminished performance and capability. The effects of fatigue generally tend to be a continuum ranging from mild to severe and disabling manifestations such as exhaustion, overstrain, and chronic fatigue syndrome [13]. Under the influence of fatigue, people’s alertness, motor skills, reflex ability, judgment, cognitive performance and decision-making will be impaired [1,14]. It has been proven that heart rate and heart rate variability were also highly correlated with fatigue [15,16].
The fatigue of ATCOs is related to numerous factors, including physiological features, circadian rhythmicity, homeostatic factors, and work tasks. Cruz et al. [17,18] found that people in the age range of 31–45 had the highest chronic fatigue levels, poorest sleep quality, and shortest sleep time before a morning shift, and females had higher chronic fatigue levels and longer sleep times than males. Nesthus et al. [19] reported that less sleep generally leads to low sleep quality and higher levels of fatigue. A number of studies summarized that circadian rhythmicity produced by sleep habit and the homeostatic drive to sleep produced by reduction in the quantity or quality of sleep, or the extension of time awake, were the main causes of fatigue [20,21,22]. It was stated that fatigue was caused by a lack of sleep and prolonged wakefulness or change in sleep–wake schedule [23]. Fatigue levels were significantly different between day and night shifts, time periods, and various work schedules [24]. Fatigue has been recognized as a major consequence of increased work intensity [25]. Duty cycles and short breaks during working hours were also considered factors that influence fatigue [26]. The ICAO [12] listed four scientific principles for fatigue management: the need for sleep, sleep loss and recovery, circadian effects on sleep and performance, and the influence of the workload, revealing the primary factor areas influencing fatigue. It can be summarized that the common form of ATCOs’ fatigue includes the drive to sleep [27,28], produced by circadian rhythmicity or sleep loss and meaning the need to sleep, and the biological drive for recuperative rest [22], produced by continuous or intense work and meaning the need to stop work to have a rest. In this study, we mainly focused on the drive to sleep.
Several studies have focused on modeling fatigue and developing countermeasures to prevent fatigue in ATCOs during occupational activities. Modeling fatigue has potential uses on estimating fatigue on the basis of working hours, detecting fatigue, and warning and managing risk mitigation strategies [28]. A number of biomathematical models of fatigue such as a three-process model of alertness, a system for aircrew fatigue evaluation and sleep, activity, fatigue, and a task effectiveness model [21,29,30,31] have been developed, providing theoretical references to predict fatigue and minimize the adverse impact of fatigue and develop countermeasures. The most common countermeasures for ATCOs are fatigue management. It reduces the probability of reoccurrence of fatigue through management regulations and fatigue assessment, which is used to identify fatigue in time during the work shift. The influencing fatigue factors mentioned above are the primary basis for developing countermeasures. The ICAO [12] included the factors influencing fatigue in the concept of Fatigue Risk Management (FRM) and provided suggestions to reduce fatigue. The fatigue and workload measurement of ATCOs has been studied extensively. The workload of ATCOs is usually assessed with the NASA Task Load Index (NASA-TLX) [32], which belongs to subjective measurement. Objective methods such as using a complexity network [33] or conformalized dynamical graph learning [34] have also been validated. The most common method of fatigue assessment is self-reports based on questionnaires [4,35]. ATCOs report their subjective fatigue levels according to a scale, such as the Karolinska Sleepiness Scale (KSS) [36] and the Stanford Sleepiness Scale (SSS) [37]. Validated tools to measure fatigue also include the Brief Fatigue Inventory [38], the Chalder Fatigue Scale [39], and the Fatigue Severity Scale [40], which are usually used to evaluate the severity of fatigue in fatiguing illnesses. The method is implemented easily and is valuable for summarizing fatigue symptoms and identifying fatigue. However, subjective fatigue may be imprecise due to different motivations and personal factors [41]. Several objective indicators, such as the electroencephalogram [42], eye movements [43], facial features [44], and voice [45], have been used to determine fatigue levels. In summary, occupational fatigue has been investigated extensively in different aspects, and the results have provided guidance for the management and prevention of fatigue.
1.3. Literature Review of the Studies on Tension in ATCOs
A review of the research on air traffic controllers and tension was conducted in Google Scholar. In contrast, relatively few studies have investigated tension in ATCOs, and most of these studies have focused on the underlying factors and the effects on performance. Job tension is similar to the concept of pressures experienced while performing required tasks, as defined by House and Rizzo [46], including resultant feelings of anxiety or nervousness while at work and relief when leaving the workplace [47]. In some studies, the tension state at work is similar to job stress. Jamal [48] considered job stress as a response of an individual when threats emerge in the workplace. In this study, job tension refers to an abnormal or at-risk state of ATCOs while performing their duties or a psychological state characterized by feeling nervous and being unable to relax and calmly cope with air traffic operations. It was indicated that ATCOs may become tense while on duty, especially during the decision-making process [49]. In terms of the causal factors, Lyons [50] found that job tension was experienced by employees when they were worried about work-related factors. Job tension has also been defined as the physiological, psychological, and behavioral response by individuals when they experience an imbalance between their workplace demands and their ability to fulfill these demands [51]. In other words, difficult air traffic control tasks or lower professional ability easily cause job tension in ATCOs. Grandjean et al. [52] also indicated that most controllers felt nervous or tense in challenging situations. It was demonstrated that abusive supervision increased the probability of job tension [53]. Job tension in ATCOs has a negative effect on performance. ATCOs may provide incorrect instructions to pilots when they experience tension [6]. Most ATCOs who responded to surveys reported that they commonly made errors and forgot some flights when they were tense [7].
1.4. Research Objectives
The aforementioned studies indicate the characteristics of fatigue and tension in various aspects. The impairment process of ATCOs resulting from fatigue and tension and the effects on air traffic safety may be as follows: first, the fatigue state or tense state of ATCOs occurs due to the work environment or personal factors; second, since the ATCOs are in an at-risk state, their physical characteristics change, and their abilities are impaired; finally, their working performance decreases, adversely affecting air traffic safety. Studies on the causal factors can provide guidance for reducing fatigue and tension by managing these factors. Research on the effects of the states on physical characteristics and abilities provides a clear understanding of how these states cause high-risk situations in air traffic control, and an analysis of the relationship between the states and the working performance would help to develop timely countermeasures to maintain air traffic safety.
The focus of this study is on the effects of fatigue and tension on the physical characteristics and abilities of ATCOs. Although the effects have been analyzed in some studies, most only considered a single aspect of the characteristics and did not determine the influence mechanisms of fatigue and tension on abilities clearly. In this study, the physical characteristics and abilities of ATCOs were both considered, and multiple indicators were investigated simultaneously to analyze the effects of fatigue and tension and their influence mechanisms. Influence mechanisms refer to the influence process and mode of the states on physical characteristics and abilities, which are helpful to clearly understanding how the two states impair safety performance of air traffic controllers. Because of the high risk of fatigue and tension states on actual work conditions, it was impractical to design an experiment and collect data in a real work setting. Fortunately, air traffic control simulators can provide a simulated environment. In simulated experiments, almost every factor can be designed and the interference of undesired factors is minimized. Air traffic control simulators have frequently been used and validated in a variety of applied and basic research programs [54]. They have played an important role in some studies about ATCOs [55,56]. In addition, young ATCOs are the primary members of the frontline staff in China [7]. Compared with older controllers, they may show worse work performance under the impairment of fatigue or tension because of less work experience. It was also demonstrated that young ATCOs were more likely to be tense than older ATCOs [7]. Furthermore, almost all controllers in China are male. Therefore, young male ATCOs were recruited to conduct simulated control tasks in a simulated environment under the influence of different states, and their physical characteristics and abilities were evaluated in a laboratory. The objectives of this study are the following: to (1) analyze the effects of fatigue and tension on the physical characteristics and abilities of ATCOs and (2) explore the influence mechanisms of the two at-risk states on the abilities of ATCOs. The results of this study are expected to provide useful references for the assessment of fatigue and tension states in ATCOs, development of management methods for at-risk states, and quantification of the effects of fatigue and tension on the behavior and ability of ATCOs.
2. Methods
2.1. Participants
In this study, 30 healthy, young male ATCOs ranging from 23 to 26 years old (avg. = 24) were recruited. All of them possessed a valid controller’s license and their work experience in air traffic control service ranged from 1 to 2 years (avg. = 1.3). The sleep rhythm and drug use of the subjects were investigated before recruitment with a subjective questionnaire, and the ATCOs without a regular circadian rhythm or with drug use were excluded. The ATCOs needed to complete a training program and a test to be familiar with the air traffic control simulator. At the same time, four experimenters who were familiar with the operational rules of the simulator participated in the experiment. They were responsible for controlling the operation of the aircraft according to the ATCOs’ instructions. All participants agreed and signed an informed consent form and were paid.
2.2. Independent Variables
In order to study the effects of fatigue and tension, the states of ATCOs were considered as the independent variables. Four different states, i.e., the alertness (AL), fatigue (FA), tension (TE), and fatigue and tension (FT) states, were designed in this study. The ATCOs were required to complete air traffic control tasks under the influence of each state. The group in the AL state was the control group, and the groups in the other states were the treatment groups.
However, most parameters of the physical characteristics and abilities needed to be measured at some point and could not be tested during the simulated experiments. Participants especially had to spend several minutes completing the tests. Therefore, we defined eight situations in which to perform the measurements: before the AL experiment (BAL), after the AL experiment (AAL), before the FA experiment (BFA), after the FA experiment (AFA), before the TE experiment (BTE), after the TE experiment (ATE), before the FT experiment (BFT), and after the FT experiment (AFT). These were used to represent different expected states, where, for example, AFA represented fatigue, ATE meant tension, and AFT represented fatigue and tension. The parameters in the eight situations could be used to analyze the effects of fatigue and tension.
2.3. Dependent Variables
According to the purpose of this study, the parameters of the physical characteristics and abilities of the ATCOs were considered as the dependent variables. The duties of ATCOs include staying focused, high visual and auditory perception, assessing air traffic conditions, making decisions, and issuing instructions. The physical states of ATCOs have crucial influences on these tasks. It has been shown that ATCOs need to pay high mental workloads to complete the tasks of perception, attention, information processing, and decision-making [57,58,59]. Therefore, the parameters in this study were selected according to these aspects. The parameters, equipment, and measurement methods are shown in Table 1.

Table 1.
Equipment and measurement methods used to obtain the parameters.
In Table 1, the parameters of HR, SBP, DBP, and DHR were used to represent physical characteristics, which indicate the basic physical state during work, and the other parameters explain the abilities of ATCOs. All the parameters indicating abilities were used to evaluate the ability levels of the ATCOs during the training, selection, and testing process in China. We also validated the relation between them and the states in the ATCOs through a subjective questionnaire [7]. The STT, NDFO, and ROA represented the characteristics of attention. Reaction ability was represented by the RTS and RTL. The TDSA is a measure of the accuracy of perceiving movement and is closely related to control timeliness. The LSPWB indicates the number of tests the ATCO was required to detect the correct spatial configuration. This parameter was used to measure the ability of quick perception and learning. The ART was the time required for the ATCOs to respond correctly after receiving messages in different situations; it represented the decision-making ability of making accurate choices quickly. The DHR is an indicator of the dynamic change in the physical characteristics of the ATCO. A voice recorder was used to record the speech and determine the reaction time of speech (RTOS) of the ATCOs and pilot, defined as the time interval between the request of the pilot and the response of the participant. There was a discrete data sequence for the DHR and RTOS in each experiment on the four states. The average and standard deviation of the data sequence were calculated, producing four dynamic parameters: the average of the DHR (DHR_AVG), the standard deviation of the DHR (DHR_SD), the average of the RTOS (RTOS _AVG), and the standard deviation of the RTOS (RTOS _SD). They can be considered as four dependent variables. The DHR_AVG represents the characteristics of the physical state, and the DHR_SD explains the stability of the characteristics during the experiments. The RTOS_AVG represents the speed of an ATCO’s response to a pilot’s request, and the RTOS_SD represents the stability of the response speed.
2.4. Experimental Design
In this study, a tower air traffic control simulator was used to provide an air traffic control environment to collect data. The simulator provided a virtual take-off, landing, and taxi scenario of an airport. The simulator and the layout of the simulated airport are shown in Figure 1 and Figure 2, respectively. In the simulator, nine network computers were used to simulate the control system, approach radar, airport surveillance radar, and scenarios. Two radio communication devices were used to provide communication between the controller and pilot. The airport scenario was shown on five large displayers, providing a 120° field of view. Flights were simulated in the control system during the experiment. The ATCOs provided instructions to the virtual pilots through the radio according to the radar and airport view and the virtual pilots executed the instructions to operate all the virtual planes. The simulator has been used in ATCO training and license assessment for many years, which was helpful to make the ATCOs immerse in the simulated environment of air traffic control under a similar psychological state to their actual work.
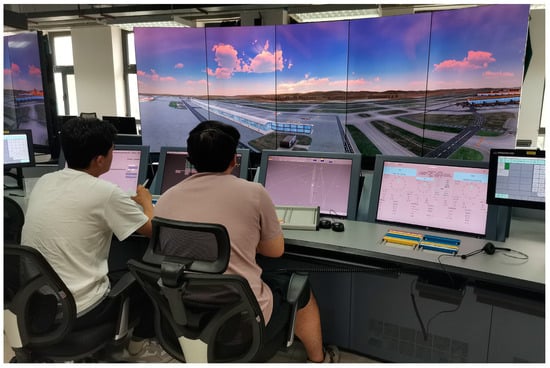
Figure 1.
The air traffic control simulator.
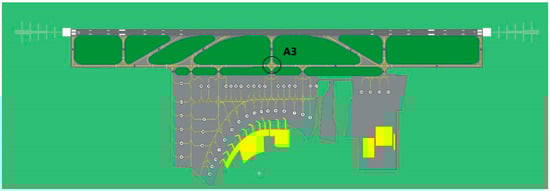
Figure 2.
The layout of the simulated airport (the A3 is a hot point in taxi way).
The primary objective of the experimental design was to induce fatigue and tense states and support data collection. The FA state was designed through the experiment time on the basis of the ATCOs’ circadian rhythm in sleep and the TE state, by performing complex tasks according to the relation between tension and tasks. The recruitment survey of the ATCOs indicated that they generally slept from 11 pm to 7 am, had a noon break between 11:30 am and 1:00 pm, and began working again at 1:30 pm. It was also found that fatigue or sleepiness was especially common in connection with early morning and night shifts, and fatigue levels were highest during the night shift [7,12,60]. Therefore, the AL and TE state experiments were completed at 9–11 am or 3–5 pm, and the subjects were asked to sleep well more than three days before each visit to reduce the effects of fatigue. The FA and FT state experiments were conducted between 1 am and 3 am to make the participants become fatigued easily. Meanwhile, they were required to sleep for less than 6 h, get up before 8 am on the previous day, and not sleep before the FA and FT state experiments.
ATCOs are more likely to become tense when control task demands exceed their abilities. It was also reported that most ATCOs felt nervous or tense in challenging situations [52]. The TE state was designed through complex control tasks. During the experiment, the participants were required to control the flights to complete the arrival or departure procedures with high efficiency. The tasks were designed based on actual traffic flow. The control tasks in the AL and FA states were similar but different to minimize the influences of repetitive tasks, as well as the tasks in the TE and FT states. In order to avoid tense states in the AL and FA experiments, the tasks were performed for six departure flights and six arrival flights in about 35 min, where the intervals of the flight plan were relatively long and the participants could easily complete the task without a TE state. By contrast, in the TE and FT experiments, the traffic throughput was increased to 10 departure flights and 10 arrival flights during about 55 min; the A3 hot point (as shown in Figure 2) was closed; and the surveillance radar was not operational. The intervals of the flights were relatively shorter and there might have been air traffic jams. All these designs were helpful to simulate complex and challenging situations for the participants to induce a tension state. During the experimental process, an experienced ATCO was responsible for recording all the operational characteristics of the aircraft and subjects, such as conflicts and ATCOs’ signs of fatigue or tension.
2.5. Experimental Procedure
Each participant was required to take part in the four state experiments during four visits with a random order on four independent days to reduce learning effects. Considering the 24 random orders because of the four visits, we randomly divided the 30 participants into 24 groups; six groups had two persons each, and the other groups had one person each. The experiments were conducted at intervals of at least 3 days to avoid residual effects from the previous visits. The procedure is shown in Table 2.
Table 2.
Experimental procedure.
In this study, we mainly focused on fatigue because of the drive to sleep. The SSS was adopted in the questionnaire to collect subjective fatigue degree data. The following seven levels were evaluated: (1) feeling active, vital, or alert; (2) functioning at high levels but not at peak, unable to concentrate; (3) somewhat foggy, let down; (4) slowed down, foggy, losing interest in remaining awake; (5) sleepy, woozy, fighting sleep, preferring to lie down; (6) having dream-like thoughts, sleep onset soon; and (7) asleep. Similarly, tension was also assessed with seven levels: (1) very calm, performed the control tasks with ease; (2) calm and completed the task smoothly; (3) a little tense; (4) slightly tense and not able to judge calmly; (5) tense but able to accomplish the task; (6) very tense, only able to complete the task partially; (7) very tense and not able to work.
In all the experiments, the participants were required to avoid eating any stimulating beverages or food, such as alcohol, coffee, drugs, and energy drinks. The questionnaire completed before each experiment focused on the subjective fatigue level and the physical state at the moment. Only ATCOs who met the requirements could participate in the experiment. For visits 1 and 3, only the ATCOs whose fatigue levels were at level 1 or 2 before the experiment were allowed to start the task to avoid the influence of a high level of fatigue before the experiment. For visits 2 and 4, the ATCOs were only allowed to perform the experiment until their fatigue levels reached level 4. Otherwise, the participants were asked not to sleep until their fatigue levels met the criterion. The questionnaire completed after each experiment was used to determine the tension level during the experiment and the subjective fatigue level at the moment. In each experiment, the experimenters were asked to communicate with the ATCOs using the same criteria to minimize influences on speech.
2.6. Data Collection and Analysis
In the experiment, BAL and BTE were similar situations and were not affected by fatigue or tension. They are both control groups, and the others are treatment groups. BFA and BFT were similar and were the basic or initial fatigue states before the ATCOs performed any night shift tasks. AFA represented the fatigue state during work, ATE represented the tension state, and AFT represented the fatigue and tension state. Data on the 11 static parameters (SBP, DBP, HR, STT, NDFO, RTS, RTL, ROA, TDSA, LSPWB, and ART) were measured in the eight situations. Four dynamic parameters (DHR_AVG, DHR_SD, RTOS_AVG, and RTOS_SD) were collected during the experiments of the four states. According to the measurement time of the data, “situation” and “state” were used to explain the static parameters and the dynamic parameters, respectively. The data of the 27 participants were collected successfully, and the data of the other three participants were excluded due to incomplete experiments.
According to the questionnaire results, subjective fatigue levels were investigated in the eight situations, whereas tension levels were based on the subjective feelings during the experiments of the four states. The results show that the fatigue levels were obviously higher in the BFA (AVG = 4.37, SD = 0.75), AFA (AVG = 4.74, SD = 0.81), BFT (AVG = 4.35, SD = 0.81), and AFT (AVG = 4.28, SD = 0.87) situations than in the BAL (AVG = 1.91, SD = 0.32), AAL (AVG = 2.06, SD = 0.41), BTE (AVG = 1.94, SD = 0.35), and ATE (AVG = 2.17, SD = 0.43) situations. The tension levels were higher in the TE (AVG = 4.38, SD = 0.42) and FT (AVG = 4.25, SD = 0.46) states than in the AL (AVG = 2.13, SD = 0.34) and FA (AVG = 2.26, SD = 0.39) states. The results indicate that the expected states were achieved and the experimental data can be used to analyze the effects of fatigue and tension.
In this study, we firstly used analysis of variance (ANOVA) with repeated measures to determine the differences in the parameters for the eight situations and four states and the post hoc pairwise tests were performed to assess the effect details. Then, the decreasing orders of influence of fatigue and tension on the indicators were determined according to the results of a paired t-test between typical situations and states.
3. Results
3.1. Analysis of the Effects
According to the experiment design, the eight situations can be considered as eight different states of the participants under the effects of various factors. One-way ANOVA with repeated measures was used to analyze the effects of the eight situations and the four states on the physical characteristics and abilities of the ATCOs. Post hoc pairwise tests were used to assess the effects of each key factor under certain conditions. In the analysis of the eight situations, the following pairwise comparisons were made: BAL vs. AAL to check the influence of the simple task; BAL vs. BFA to determine the effects of the initial fatigue state; BAL vs. AFA to assess the effects of the fatigue state during work; BAL vs. ATE to evaluate the effects of the tension state; BFA vs. AFA to determine the effects of the simple task at the basis of the initial fatigue state; AFT vs. AFA and AFT vs. ATE to evaluate the effects of tension and fatigue, respectively, when they occurred together; and AFT vs. BAL to assess the combined effects of fatigue and tension. In the analysis of the four states, the following pairwise comparisons were made: AL vs. FA, AL vs. TE, and AL vs. FT to evaluate the effects of fatigue, tension, and their combination, respectively, and FT vs. FA and FT vs. TE to assess the effects of fatigue and tension.
The analysis was performed in IBM SPSS Statistics 20.0 software and the ANOVA results and the significance of the pairwise comparisons are shown in Table 3, where the / represents unnecessary results because of the nonsignificance in the ANOVA analysis. The results show that no statistically significant differences were found between the situations for the parameters SBP, DBP, NDFO, and LSPWB. The other parameters were all significantly affected by the situations or states. Figure 3, Figure 4, Figure 5, Figure 6, Figure 7 and Figure 8 show the means and 95% confidence intervals (as error bars) of the seven static parameters which were significantly different in the eight situations. Figure 9 and Figure 10 show the means and 95% confidence intervals (as error bars) of the four dynamic parameters in the four states. The pairwise comparisons and the figures explain the effect details and trends of the parameters under the influence of fatigue or tension.
Table 3.
Results of the ANOVA.
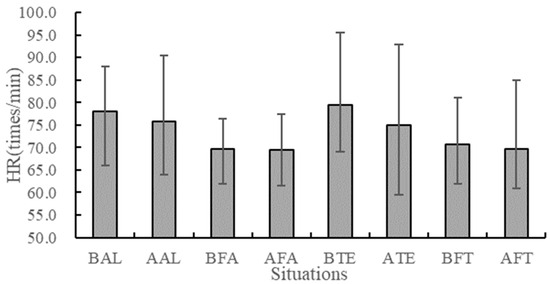
Figure 3.
Means and 95% confidence intervals of the HR.
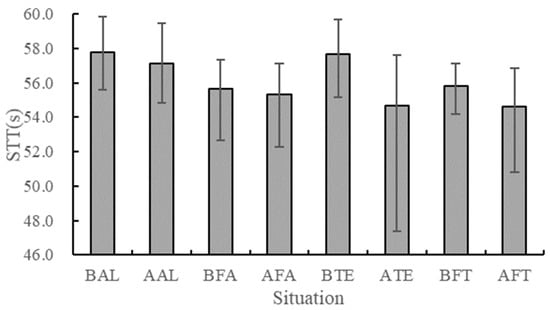
Figure 4.
Means and 95% confidence intervals of the STT.
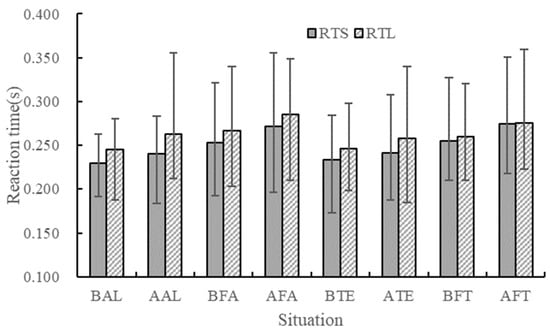
Figure 5.
Means and 95% confidence intervals of the RTL and RTS.

Figure 6.
Means and 95% confidence intervals of the ROA.

Figure 7.
Means and 95% confidence intervals of the TDSA.

Figure 8.
Means and 95% confidence intervals of the ART.

Figure 9.
Means and 95% confidence intervals of the DHR_AVG and DHR_SD.
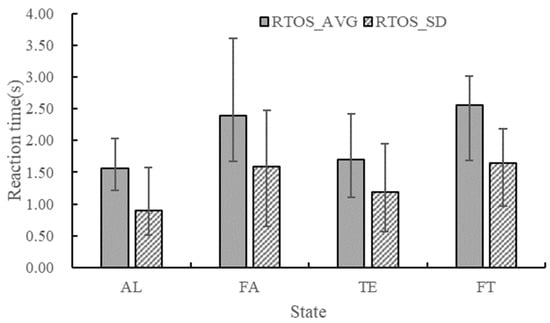
Figure 10.
Means and 95% confidence intervals of the RTOS_AVG and RTOS_SD.
3.2. Analysis of the Decreasing Orders of Influence
The effects of fatigue are a continuum with different degrees [13]. It is supposed that higher levels of fatigue are associated with severer effects and contribute to assessing the effects of fatigue more clearly. The subjective fatigue levels and the analysis results (comparison between BAL and AAL) showed that no obvious post-work fatigue was induced by the simple task. It is believed that the key component of fatigue in the AFA situation was the drive to sleep. Among the eight situations, the subjective fatigues level in the AFA situation were the highest. Therefore, the AFA was used to analyze the effects of the fatigue state during work in depth. The ATE was selected to represent the tension state during work. According to the results of the pairwise comparison of BAL vs. AFA and AL vs. FA (Table 3), ten indicators were selected for investigating the effects of fatigue: HR, STT, RTL, RTS, ROA, TDSA, ART, DHR_AVG, RTOS_AVG, and RTOS_SD. According to the results of the pairwise comparison of BAL vs. ATE and AL vs. TE, five parameters were selected to analyze the effects of tension: STT, ART, DHR_AVG, DHR_SD, and RTOS_SD. The objective was to determine the decreasing order of these indicators that were affected by fatigue and tension, respectively, to discuss their influence mechanisms. We used repeated measures and a paired t-test was used to estimate the levels of the effects. Comparisons of the BSO and AFA situations and the SO and FA states were performed for fatigue and comparisons of the BSO and ATE situations and the SO and TE states were conducted for tension. A higher Cohen’s d obtained from the analysis means a bigger effect size. The results of the indicators are shown in Table 4, indicating that the indicators affected by fatigue in decreasing order were HR, RTOS_AVG, STT, RTOS_SD, DHR_AVG, RTL, ROA, RTS, ART, and TDSA, and the indicators affected by tension were DHR_AVG, STT, DHR_SD, RTOS_SD, and ART.
Table 4.
Results of the paired t-test.
4. Discussion
The results indicate that most of the parameters of the physical characteristics and abilities were significantly affected by the situations or states. Fatigue had an adverse influence on many characteristics and abilities. Similarly to the findings reported by Patel et al. [16], the results of the HR and DHR_AVG show that the ATCOs’ HR was lower in the fatigue state. ATCOs’ work requires a high mental workload in several aspects, including perception, attention, information processing, and decision-making [51,52]. The effects of fatigue on abilities during work could be analyzed according to the analysis results. Compared with the previous research [1,14], this study showed the effect of fatigue on abilities with new indicators. All the research revealed the adverse effects of fatigue on ATCOs. The lower STT and ROA under the influence of fatigue indicate impaired tracking ability and a lower attention range, respectively. This means that ATCOs may lose their concentration on the status of flights or miss flights. The higher RTL and RTS indicate a decrease in the reaction speed and longer time to perceive information. The lower TDSA indicates that ATCOs may issue instructions later than the right moment. The higher ART demonstrates that ATCOs require more time to make correct decisions in different situations. The changes in these parameters imply the reduction in attention, perception, reaction time, and decision-making ability. The higher RTOS_AVG and higher RTOS_SD also indicate a decrease in comprehensive performance. Though the simple task did not induce obvious post-work fatigue, the significant differences in STT, RTL, RTS, ART, and ROA between the BFA and AFA situations clearly indicate that the ATCOs’ abilities tended to be worse if they continued to work while being sleepy. It is recommended that if an ATCO feels sleepy, he/she should stop working immediately rather than insist a little longer even for simple tasks.
The imbalance between ability and task demand is one of the main factors of job tension [51]. The tense states of the young male participants were induced successfully by designing complex tasks in this study. It was found from the results that some physical characteristics or abilities of the participants were significantly affected by tension. Compared with the previous research on the effects of tension with a subjective survey [6,7], this study reveals it in more detail with objective parameters. The lower STT and higher ART indicate that the ATCOs’ abilities to track moving objects and decision-making were degraded. The higher DHR_AVG and DHR_SD imply that the ATCOs’ heart rate tended to increase, and the stability of their physical status decreased during work in the tense state. Although the RTOS_AVG showed no significant differences, the RTOS_SD was significantly lower in the tense state, indicating a decrease in the stability of responding to the pilot’s request and the reduction in overall performance. Considering the short job experience and relative low ability of young ATCOs, it is suggested to evaluate the complexities of tasks and each young ATCO’s ability firstly and avoid the imbalance between the task demands and ability in the shift arrangement of ATCOs.
The ranking of the indicators of fatigue shows that fatigue had the strongest influence on HR, followed by RTOS_AVG, STT, RTOS_SD, DHR_AVG, RTL, ROA, RTS, ART, and TDSA. The decreasing order of indicators provides an understanding of the effect levels of fatigue on the characteristics. Since the HR represents the physical state, the results indicate that in the fatigue state, the ATCOs’ physiological characteristics were affected firstly, and their attention, reaction speed, perception, and decision-making were all impaired to varying degrees; subsequently, their working performance was degraded. The paired comparison of AFT vs. ATE, AFT vs. AFA, FT vs. FA, and FT vs. TE also showed that fatigue had more significant effects on heart rate and reaction ability than tension. In this study, fatigue refers to the sleepiness resulting from the drive to sleep [27]. It is supposed that when ATCOs feel sleepy, their physical subconscious tends to require them to sleep rather than allocate enough energy to support their work, resulting in the disabling manifestations on some of their abilities [13], a reduction in alertness, judgement, and reflex ability [1], and the impairment of their cognitive functions [61]. According to these results, the main influence mechanisms may have been that the ATCOs’ fatigue caused a lack of motivation and slowed down physiological and cognitive functions, as well as their working performance.
The order of the indicators of tension shows that tension has the strongest influence on DHR_AVG, followed by STT, DHR_SD, RTOS_SD, and ART, also indicating that physiological characteristics are affected first, followed by physical abilities. The results show that the DHR of the ATCOs was higher when they were tense in the workplace, but there were no significant differences in the HR between the BAL and ATE situations. The likely reason is that tension is a transitory state which occurs when complex task demand exceeds an ATCO’s ability [51], and the level of tension decreases after leaving the workplace [47]. Therefore, tension occurs primarily during working hours, resulting in no significant differences in most of the indicators between the ATE and BAL situations. The lower STT and higher ART may show the residual or continuous effects of tension on concentration and decision-making abilities. Meanwhile, the comparison analysis of FT vs. FA and FT vs. TE indicated that tension had a dominant effect on the stability of heart rate. The participants stated that they were occasionally tense only when the control task was complex in the tension experiments, rather than during the entire experiment. Their heart rates were higher only in these situations and resulted in a higher DHR_SD. The response speed to the pilot’s requests was highly variable, leading to a higher ROTS_SD. It was also reported that ATCOs might make some temporary decision errors [6] and forget flights [7] when they are tense. Based on these results, it is inferred that tension is a transitory state during working hours and causes instability in the ATCOs’ physiological function and mistakes in working performance.
The results of this study reveal the effect characteristics of fatigue and tension on ATCOs, especially the effect orders and the influence mechanisms of them. It provides references for improving the safety of air traffic control in practical applications. On the one hand, the results facilitate the evaluation of fatigue and tension so that management strategies or countermeasures can be developed. For example, in order to decrease the fatigue and tense state, circadian rhythmicity, sleep duration, ability, and task complexity should be considered in the shift arrangement. Tension should be closely monitored in high traffic flow conditions or complex control task scenarios. In state assessment and management, the ranking of the indicators indicated that physiological parameters should take priority as the measurement indicators. The influence mechanisms could also provide a reference for state assessment based on the performance of air traffic control. On the other hand, several key parameters correlated with at-risk states and work performance were proposed and validated in this study. They can be used to analyze the suitability of ATCOs for certain tasks.
This study has certain limitations. First, the TE state occurs primarily during working hours, and it was challenging to ensure that the ATCOs remained tense until the end of the tension experiments. Therefore, in the ATE situation, the ATCOs may not have been as tense as under actual working conditions, and the parameters may not have fully represented the characteristics of tension. Second, only a tower control environment was considered in the experiment. The results may not be applicable to the approach and en route control environment. Third, this study did not include all possible parameters that are affected by fatigue or tension, especially some characteristics that are only observable under actual working conditions. Lastly, the data were collected in simulated experiments, which may differ from the real environments. In a future study, more extensive experiments, including real air traffic control environments, should be performed, and more parameters applicable to actual working conditions should be collected for a more in-depth study. The correlations between the indicators should also be analyzed to explain the links among the characteristics.
5. Conclusions
In summary, we performed a simulated control tower experiment and measured fifteen parameters representing the physical characteristics and abilities of ATCOs in this study. Eleven static parameters were measured in the eight situations, and four dynamic parameters were quantified during the experiments of the four states. The effects of fatigue and tension on the physical characteristics and abilities of ATCOs and the influence mechanisms were investigated. The following conclusions were drawn:
- (1)
- Both fatigue and tension affected the performance of the physical characteristics or abilities of the ATCOs. The indicators of fatigue in decreasing order of influence were HR, RTOS_AVG, STT, RTOS_SD, DHR_AVG, RTL, ROA, RTS, ART, and TDSA. In the FA state, the HR, DHR_AVG, STT, ROA, and TDSA were lower, and the RTL, RTS, ART, RTOS_AVG, and RTOS_SD were higher than those in the AL state. The attention, perception, reaction time, decision-making abilities, and comprehensive performance of the ATCOs were adversely affected by fatigue.
- (2)
- The indicators of tension in decreasing order of influence were DHR_AVG, STT, DHR_SD, RTOS_SD, and ART. Tension decreased the STT and increased the ART, DHR_AVG, DHR_SD, and RTOS_SD. The attention, decision-making abilities, and comprehensive performance of the ATCOs were adversely affected by tension.
- (3)
- Both fatigue and tension initially affected the ATCOs’ physiological characteristics, which, in turn, impaired their physical abilities. However, the influence mechanisms were different. The dominant effect of fatigue was slowing down, whereas the primary effect of tension was instability.
These results are helpful in assessing and managing the fatigue and tension states of ATCOs, quantifying the effects of fatigue and tension on their behavior and ability, and ultimately, improving the safety of air traffic control.
Author Contributions
Methodology, writing, and editing, X.Z.; investigation, M.L.; experiment design, P.B.; project administration, Y.Z. All authors have read and agreed to the published version of the manuscript.
Funding
This work was supported by the Joint Fund of Civil Aviation Research of National Natural Science Foundation of China (No. U1933122 and No. U1533117) and the National Key Research and Development Program of China (No. 2022YFB4300904).
Institutional Review Board Statement
All subjects gave their informed consent for inclusion before they participated in this study. This study was conducted according to the guidelines of the Declaration of Helsinki and approved by the Institutional Review Board of Civil Aviation University of China (Protocol code E2019012, 1 March 2019).
Informed Consent Statement
Informed consent was obtained from all subjects involved in the study.
Data Availability Statement
The data presented in this study are available upon request from the corresponding author. The data are not publicly available due to privacy.
Conflicts of Interest
The authors declare no conflict of interest.
References
- Chen, M.-L.; Lu, S.-Y.; Mao, I.-F. Subjective symptoms and physiological measures of fatigue in air traffic controllers. Int. J. Ind. Ergon. 2019, 70, 1–8. [Google Scholar] [CrossRef]
- Jou, R.-C.; Kuo, C.-W.; Tang, M.-L. A study of job stress and turnover tendency among air traffic controllers: The mediating effects of job satisfaction. Transp. Res. Part E Logist. Transp. Rev. 2013, 57, 95–104. [Google Scholar] [CrossRef]
- Xiong, R.; Wang, Y.; Tang, P.; Cooke, N.J.; Ligda, S.V.; Lieber, C.S.; Liu, Y. Predicting separation errors of air traffic controllers through integrated sequence analysis of multimodal behaviour indicators. Adv. Eng. Inform. 2023, 55, 101894. [Google Scholar] [CrossRef]
- Orasanu, J.; Parke, B.; Kraft, N.; Tada, Y.; Hobbs, A.; Anderson, B.; McDonnell, L.; Dulchinos, V. Evaluating the Effectiveness of Schedule Changes for Air Traffic Secrvice (ATS) Providers: Controller Alertness and Fatigue Monitoring Study (No. DOT/FAA/HFD-13/001); US Department of Transportation, Federal Aviation Administration: Washington, DC, USA, 2012. Available online: https://human-factors.arc.nasa.gov/publications/Orasanu_et_al_Controller_Alertness_Fatigue_Monitoring.pdf (accessed on 1 September 2019).
- Li, W.; Kearney, P.; Zhang, J.; Hsu, Y.; Braithwaite, G. The analysis of occurrences associated with air traffic volume and air traffic controllers’ alertness for fatigue risk management. Risk Anal. 2021, 41, 1004–1018. [Google Scholar] [CrossRef]
- Xu, H.J. Study on Job Stress and Burnout of Air Traffic Controller. Master’s Thesis, North China University of Science and Technology, Tanshan, China, 2016. [Google Scholar]
- Zhang, X.J.; Bai, P. Bad working state characteristics of air traffic controller. J. Civ. Aviat. Univ. China 2018, 36, 21–26. [Google Scholar]
- Bongo, M.; Seva, R. Effect of Fatigue in Air Traffic Controllers’ Workload, Situation Awareness, and Control Strategy. Int. J. Aerosp. Psychol. 2022, 32, 1–23. [Google Scholar] [CrossRef]
- Noy, Y.I.; Horrey, W.J.; Popkin, S.M.; Folkard, S.; Howarth, H.D.; Courtney, T.K. Future directions in fatigue and safety research. Accid. Anal. Prev. 2011, 43, 495–497. [Google Scholar] [CrossRef] [PubMed]
- Workplace Safety and Health Council. Workplace Safety and Health Guidelines: Fatigue Management. 2010. Available online: https://www.wshc.sg/files/wshc/upload/cms/file/2014/Fatigue_Management.pdf (accessed on 12 September 2019).
- Staal, M.A. Stress, Cognition, and Human Performance: A Literature Review and Conceptual Framework. 2004. Available online: https://ntrs.nasa.gov/archive/nasa/casi.ntrs.nasa.gov/20060017835.pdf (accessed on 12 September 2019).
- International Civil Aviation Organization (ICAO). Doc 9966 Manual for the Oversight of Fatigue Management Approaches, 2nd ed.; International Civil Aviation Organization: Montreal, QC, Canada, 2016; Available online: https://www.icao.int/safety/fatiguemanagement/FRMS%20Tools/Doc%209966.FRMS.2016%20Edition.en.pdf (accessed on 8 September 2019).
- Mohren, D.C.L.; Jansen, N.; van Amelsvoort, L.; Kant, I. An Epidemiological Approach of Fatigue and Work: Experiences from the Maastricht Cohort Study; Programma Epidemiologie van Arbeid en Gezondheid: Amersfoort, The Netherlands, 2007. [Google Scholar]
- Rosa, E.; Lyskov, E.; Grönkvist, M.; Kölegård, R.; Dahlström, N.; Knez, I.; Ljung, R.; Willander, J. Cognitive performance, fatigue, emotional, and physiological strains in simulated long-duration flight missions. Mil. Psychol. 2022, 34, 224–236. [Google Scholar] [CrossRef]
- Oron-Gilad, T.; Rone, A. Road characteristics and driver fatigue: A simulator study. Traffic Inj. Prev. 2007, 8, 281–289. [Google Scholar] [CrossRef]
- Patel, M.; Lal, S.; Kavanagh, D.; Rossiter, P. Applying neural network analysis on heart rate variability data to assess driver fatigue. Expert Syst. Appl. 2011, 38, 7235–7242. [Google Scholar] [CrossRef]
- Cruz, C.E.; Boquet, A.J.; Hackworth, C.; Holcomb, K.; Nesthus, T.E. Gender and Family Responsibilities as They Relate to Sleep and Fatigue Responses on the FAA Air Traffic Control Shiftwork Survey; Aviation, Space, and Environmental Medicine: Alexandria, VA, USA, 2004. [Google Scholar]
- Cruz, C.E.; Schroeder, D.J.; Boquet, A.J. The relationship of age and shiftwork to sleep, fatigue and coping strategies in air traffic controllers. In Proceedings of the 76th Scientific Meeting of the Aerospace Medical Association, Kansas City, MO, USA, 9–12 May 2005. [Google Scholar]
- Nesthus, T.E.; Dobbins, L.; Becker, J.T.; Della Rocco, P. Shiftwork-related changes in subjective fatigue and mood for a sample of air traffic control specialists. In Proceedings of the Briefing Presented at the Aerospace Medical Association 72nd Annual Scientific Meeting, Reno, NV, USA, 6–10 May 2001. [Google Scholar]
- Åkerstedt, T. Work hours, sleepiness and the underlying mechanism. J. Sleep Res. 1995, 4 (Suppl. S2), 15–22. [Google Scholar] [CrossRef] [PubMed]
- Akerstedt, T.; Folkard, S.; Portin, C. Predictions from the Three-Process Model of Alertness. Aviat. Space Environ. Med. 2004, 75, A75–A83. [Google Scholar]
- Williamson, A.; Lombardi, D.A.; Folkard, S.; Stutts, J.; Courtney, T.K.; Connor, J.L. The link between fatigue and safety. Accid. Anal. Prev. 2011, 43, 498–515. [Google Scholar] [CrossRef]
- EUROCONTROL. Fatigue and Sleep Management: Personal Strategies for Decreasing the Effects of Fatigue in air Traffic Control. European Organisation for the Safety of Air Navigation. 2018. Available online: https://www.eurocontrol.int/sites/default/files/publication/files/sleep-mgnt-online-13032018.pdf (accessed on 20 January 2020).
- Chang, Y.-H.; Yang, H.-H.; Hsu, W.-J. Effects of work shifts on fatigue levels of air traffic controllers. J. Air Transp. Manag. 2019, 76, 1–9. [Google Scholar] [CrossRef]
- Härmä, M.; Kompier, M.A.; Vahtera, J. Work-related stress and health-risks, mechanisms and countermeasures. Scand. J. Work Environ. Health 2006, 32, 413–419. [Google Scholar] [CrossRef]
- Cabon, P. Fatigue in air traffic control. Hindsight 2011, 13, 55–59. [Google Scholar]
- Dinges, D. An overview of sleepiness and accidents. J. Sleep Res. 1995, 4, 4–14. [Google Scholar] [CrossRef]
- Dawson, D.; Noy, Y.I.; Härmä, M.; Åkerstedt, T.; Belenky, G. Modelling fatigue and the use of fatigue models in work settings. Accid. Anal. Prev. 2011, 43, 549–564. [Google Scholar] [CrossRef] [PubMed]
- Mallis, M.M.; Mejdal, S.; Nguyen, T.T.; Dinges, D.F. Summary of the key features of seven biomathematical models of human fatigue and performance. Aviat. Space Environ. Med. 2004, 75, A4–A14. [Google Scholar] [PubMed]
- Belyavin, A.J.; Spencer, M.B. Modeling performance and alertness: The QinetiQ approach. Aviat. Space Environ. Med. 2004, 75 (Suppl. S3), A93–A103. [Google Scholar] [PubMed]
- Hursh, S.R.; Redmond, D.P.; Johnson, M.L.; Thorne, D.R.; Belenky, G.; Balkin, T.J.; Storm, W.F.; Miller, J.; Eddy, D.R. Fatigue models for applied research in warfighting. Aviat. Space Environ. Med. 2004, 75, A44–A60. [Google Scholar]
- Hart, S.G. NASA-task load index (NASA-TLX); 20 years later. Proc. Hum. Factors Ergon. Soc. Annu. Meet. 2006, 50, 904–908. [Google Scholar] [CrossRef]
- Zhang, J.; Du, F. Relational complexity network and air traffic controllers’ workload and performance. In Proceedings of the Engineering Psychology and Cognitive Ergonomics: 12th International Conference, EPCE 2015, Held as Part of HCI International 2015, Los Angeles, CA, USA, 2–7 August 2015; Proceedings 12. Springer International Publishing: Cham, Switzerland, 2015; pp. 513–522. [Google Scholar]
- Pang, Y.; Hu, J.; Lieber, C.S.; Cooke, N.J.; Liu, Y. Air traffic controller workload level prediction using conformalized dynamical graph learning. Adv. Eng. Inform. 2023, 57, 102–113. [Google Scholar] [CrossRef]
- Lassen, C.F.; Mikkelsen, S.; Kryger, A.I.; Brandt, L.P.; Overgaard, E.; Vilstrup, I.; Andersen, J.H.; Mikkelsen, D.M.S.; Thomsen, J.F.; Msc, I.V. Elbow and wrist/hand symptoms among 6943 computer operators: A 1-year follow-up study (the NUDATA Study). Am. J. Ind. Med. 2004, 46, 521–533. [Google Scholar] [CrossRef]
- Smets, E.M.A.; Garssen, B.; Bonke, B.; De Haes, J.C.J.M. The Multidimensional Fatigue Inventory (MFI) psychometric qualities of an instrument to assess fatigue. J. Psychosom. Res. 1995, 39, 315–325. [Google Scholar] [CrossRef]
- Lee, K.A.; Hicks, G.; Nino-Murcia, G. Validity and reliability of a scale to assess fatigue. Psychiatry Res. 1991, 36, 291–298. [Google Scholar] [CrossRef]
- Radbruch, L.; Sabatowski, R.; Elsner, F.; Everts, J.; Mendoza, T.; Cleeland, C. Validation of the German version of the brief fatigue inventory. J. Pain Symptom Manag. 2003, 25, 449–458. [Google Scholar] [CrossRef] [PubMed]
- Chalder, T.; Berelowitz, G.; Pawlikowska, T.; Watts, L.; Wessely, S.; Wright, D.; Wallace, E.P. Development of a fatigue scale. J. Psychosom. Res. 1993, 37, 147–153. [Google Scholar] [CrossRef] [PubMed]
- Learmonth, Y.; Dlugonski, D.; Pilutti, L.; Sandroff, B.; Klaren, R.; Motl, R. Psychometric properties of the fatigue severity scale and the modified fatigue impact scale. J. Neurol. Sci. 2013, 331, 102–107. [Google Scholar] [CrossRef]
- Morad, Y.; Azaria, B.; Avni, I.; Barkana, Y.; Zadok, D.; Kohen-Raz, R.; Barenboim, E. Posturography as an indicator of fatigue due to sleep deprivation. Aviat. Space Environ. Med. 2007, 78, 859–863. [Google Scholar] [PubMed]
- Jap, B.T.; Lal, S.; Fischer, P.; Bekiaris, E. Using EEG spectral components to assess algorithms for detecting fatigue. Expert Syst. Appl. 2009, 36, 2352–2359. [Google Scholar] [CrossRef]
- Bu, J.; Liu, Y.X.; Wang, Y.J. Relationship between air traffic controllers’ eye movement and fatigue. Acta Aeronaut. Astronaut. Sin. 2017, 38 (Suppl. S1), 56–61. [Google Scholar]
- Wang, L.; Sun, R.S. Study on face feature recognition-based fatigue monitoring method for air traffic controller. China Saf. Sci. J. 2012, 22, 66–71. [Google Scholar]
- Kouba, P.; Šmotek, M.; Tichý, T.; Kopřivová, J. Detection of air traffic controllers’ fatigue using voice analysis-An EEG validation study. Int. J. Ind. Ergon. 2023, 95, 103442. [Google Scholar] [CrossRef]
- Kouba, P.; Šmotek, M.; Tichý, T.; Kopřivová, J. Role conflict and ambiguity as critical variables in a model of organizational behavior. Organ. Behav. Hum. Perform. 1972, 7, 467–505. [Google Scholar] [CrossRef]
- Taylor, J.A. A personality scale of manifest anxiety. J. Abnorm. Soc. Psychol. 1953, 48, 285–290. [Google Scholar] [CrossRef]
- Jamal, M. Relationship of job stress and Type-A behavior to employees, job satisfaction, organization commitment, psychosomatic health problems and turnover motivation. J. Hum. Relat. 1990, 43, 727–738. [Google Scholar] [CrossRef]
- Trapsilawati, F.; Herliansyah, M.K.; Nugraheni, A.S.A.N.S.; Fatikasari, M.P.; Tissamodie, G. EEG-based analysis of air traffic conflict: Investigating controllers’ situation awareness, stress level and brain activity during conflict resolution. J. Navig. 2020, 73, 678–696. [Google Scholar] [CrossRef]
- Lyons, T.F. Role clarity, need for clarity, satisfaction, tension, and withdrawal. Organ. Behav. Hum. Perform. 1971, 6, 99–110. [Google Scholar] [CrossRef]
- Tomic, I.; Liu, J. Strategies to Overcome Fatigue in Air Traffic Control Based on Stress Management. Int. J. Eng. Sci. 2017, 6, 48–57. [Google Scholar] [CrossRef]
- Grandjean, E.P.; Wotzka, G.; Schaad, R.; Gilgen, A. Fatigue and Stress in Air Traffic Controllers. Ergonomics 1971, 14, 159–165. [Google Scholar] [CrossRef]
- Fakhar, F.B. Impact of abusive supervision on organizational citizenship behavior: Mediating role of job tension, emotional exhaustion and turnover intention. IOSR J. Bus. Manag. 2014, 16, 70–74. [Google Scholar] [CrossRef]
- Fothergill, S.; Loft, S.; Neal, A. ATC-lab Advanced: An air traffic control simulator with realism and control. Behav. Res. Methods 2009, 41, 118–127. [Google Scholar] [CrossRef]
- Visintini, A.L.; Glover, W.; Lygeros, J.; Maciejowski, J. Monte Carlo Optimization for Conflict Resolution in Air Traffic Control. IEEE Trans. Intell. Transp. Syst. 2006, 7, 470–482. [Google Scholar] [CrossRef]
- Malakis, S.; Kontogiannis, T.; Kirwan, B. Managing emergencies and abnormal situations in air traffic control (part I): Taskwork strategies. Appl. Ergon. 2010, 41, 620–627. [Google Scholar] [CrossRef] [PubMed]
- Arvidsson, I.; Hansson, G.; Mathiassen, S.E.; Skerfving, S. Changes in physical workload with implementation of mouse-based information technology in air traffic control. Int. J. Ind. Ergon. 2006, 36, 613–622. [Google Scholar] [CrossRef]
- Imbert, J.-P.; Hodgetts, H.M.; Parise, R.; Vachon, F.; Dehais, F.; Tremblay, S. Attentional costs and failures in air traffic control notifications. Ergonomics 2014, 57, 1817–1832. [Google Scholar] [CrossRef]
- Trapsilawati, F.; Qu, X.; Wickens, C.D.; Chen, C.-H. Human factors assessment of conflict resolution aid reliability and time pressure in future air traffic control. Ergonomics 2015, 58, 897–908. [Google Scholar] [CrossRef]
- Nealley, M.A.; Gawron, V.J. The Effect of Fatigue on Air Traffic Controllers. Int. J. Aviat. Psychol. 2015, 25, 14–47. [Google Scholar] [CrossRef]
- Muzur, A.; Pace-Schott, E.F.; Hobson, J. The prefrontal cortex in sleep. Trends Cogn. Sci. 2002, 6, 475–481. [Google Scholar] [CrossRef]
Disclaimer/Publisher’s Note: The statements, opinions and data contained in all publications are solely those of the individual author(s) and contributor(s) and not of MDPI and/or the editor(s). MDPI and/or the editor(s) disclaim responsibility for any injury to people or property resulting from any ideas, methods, instructions or products referred to in the content. |
© 2023 by the authors. Licensee MDPI, Basel, Switzerland. This article is an open access article distributed under the terms and conditions of the Creative Commons Attribution (CC BY) license (https://creativecommons.org/licenses/by/4.0/).