Article

Fatigue Assessment of Cable-Girder Anchorage Zone in a Low Ambient Temperature Environment Based on Extended Finite Element Method

1
Faculty of Urban Construction, Beijing University of Technology, Beijing 100124, China
2
Technology Centre, China Communications Construction Co., Ltd., Beijing 100088, China
*
Author to whom correspondence should be addressed.
Appl. Sci. 2023, 13(17), 9990; https://doi.org/10.3390/app13179990
Submission received: 23 July 2023 / Revised: 31 August 2023 / Accepted: 2 September 2023 / Published: 4 September 2023
(This article belongs to the Special Issue Bridge Structural Analysis)

Abstract

:
The fatigue safety of cable-girder anchorage structures in cable-stayed bridges under long-term service has attracted much attention. For bridges located in seasonally cold regions, the effect of low-temperature environments should be considered when evaluating fatigue performance. Using the Heilongjiang Bridge in China as a case study, a room-temperature fatigue test with a numerical simulation that considers the low-temperature effect on both load effect and fatigue resistance was proposed. A fatigue test with increased testing load amplitude was performed on a 1:3.75 ratio specimen. After 3.2 million loading cycles and using an acoustic emission technique, no fatigue crack was observed in the anchorage structure. The extended finite element method was then adopted to analyze the anchorage zone’s fatigue crack initiation position and propagation path. Finally, based on the fatigue characteristics of bridge steel, the fatigue resistance to the crack propagation of the vulnerable area was evaluated under three different service conditions. The results show that the fatigue performance of the anchorage zone at low temperatures is sufficient. Moreover, this paper provides a more widely applicable and cost-effective approach for the fatigue evaluation of steel bridges.

1. Introduction

The cable-girder anchorage structure of a steel cable-stayed bridge is prone to fatigue damage under long-term cyclic loading because the area is subject to a large, fluctuating cable force, and the complicated structural details are composed of numerous plates and weldments [1,2]. In the engineering practice of large-span bridges, the fatigue performance of such anchorage structures is preferably and usually verified through an experimental investigation of a few large-scale specimens [3,4]. A corrosive environment, low temperature, and other factors may affect fatigue performance during service.
In China, more and more bridges located in seasonally cold regions with a high latitude are under construction. During service, these bridges need to operate in a low-temperature environment, with an extreme minimum temperature as low as −50 °C. Since steel becomes brittle as the temperature drops [5,6,7], this factor leads to concerns that these bridges may be at a higher risk of fatigue cracking and fracture. Furthermore, attention is warranted because higher temperature variations will cause an additional cable force in the anchorage structure.
Conducting comparative fatigue tests at both room temperature and low temperature is a straightforward method to study the influence of low temperature on the fatigue characteristics of structural details. However, conducting fatigue tests at low temperatures faces significant obstacles, especially for large-scale structural components. Such difficulties include environment chamber design, temperature control, strain measurement, cracking observation, and data acquisition [8,9,10].
Thus, research on the fatigue performance of structural details in steel bridges at low temperatures is scarce, and relevant fatigue test data for anchorage structural details have not yet been reported. Moreover, the fatigue evaluation of steel bridges in a low ambient temperature environment lacks guidance from governing standards [11,12].
Nevertheless, relatively plentiful fatigue tests have been conducted at low temperatures for structural steel and small-scale welded joints. Different types of bridge steel, such as 14MnNbq, Q345qD, Q370qE, Q420, and S460, have been tested for their fatigue and fracture properties at low temperatures [13,14,15,16,17,18]. Although the related mechanism for the influence of low temperature on structural fatigue is still not well understood [18], available experimental data on fatigue material properties provide a promising opportunity.
To evaluate the low-temperature fatigue performance of a cable-girder anchorage structure beyond the room temperature fatigue test, in this paper, we adopt an analytical method using the characteristic fatigue parameters of bridge steel at a low temperature. Since it is generally accepted that low temperature has a beneficial effect on the fatigue initiation of structural steel [5,6], this evaluation focuses on the resistance of the anchorage zone in a low ambient temperature environment against the fatigue crack propagation.
With the standard finite element method, a sharp crack is traditionally represented by two sets of separate nodes along the crack length, and specialized collapsed elements with refined-focused mesh are required to approximate a singular stress field at the crack tip. The simulation process of the crack propagation is potentially cumbersome since, at each step of crack growth, it is necessary to redefine the node sets representing the crack and divide the crack tip mesh in elaborate detail [19].
With the extended finite element method (XFEM) proposed by Belytschko and Black [20], the mesh and structure are independent; therefore, this method overcomes the drawbacks of repeated meshing and reduces the computational cost. When dealing with a crack problem, XFEM can simulate crack propagation along an arbitrary path, model a crack with any complex shape, obtain a relatively high accuracy solution on regular mesh, and solve geometric nonlinearity and contact nonlinearity problems [20].
XFEM has been successfully adopted to model cracks in structural steel and small welded joints [21,22,23,24]. Nevertheless, partly because of the simulation uncertainties associated with the enrichment radius and mesh refinement [23], the application of XFEM in complex structure and bridge engineering is not widespread.
This paper uses a fatigue test and numerical analysis to present a comprehensive fatigue performance evaluation for an anchorage structure at low temperatures. First, a room temperature fatigue test of the cable-girder anchorage zone considering the load effect of low temperature was carried out. Then the fatigue crack initiation position and fatigue crack propagation path were analyzed by XFEM. Finally, the fatigue crack propagation life of the anchorage structure in a low-temperature service environment was evaluated according to the characteristic fatigue parameters of bridge steel and the linear elastic fracture mechanics (LEFM) method. Since the fatigue resistance of structural details can be predicted with the well-known theory of LEFM, relatively easily obtainable material properties, and an innovative XFEM, this paper provides a more widely applicable and cost-effective approach for the fatigue evaluation of steel bridges. The selection of critical parameters in the ABAQUS software (https://en.wikipedia.org/wiki/Abaqus) for XFEM applications will also be detailed.

2. Materials and Methods

2.1. Overall Description

A case study cable-stayed bridge in northern China containing cable-girder anchorage structures is introduced first. Details of the fatigue test program at room temperature are then presented. The test results and observations could directly verify the fatigue performance of the anchorage structure and serve as a basis for validating finite element analysis and fatigue crack pattern analysis. The analytical methods adopted to evaluate the cable-girder anchorage structure’s fatigue performance are followed. The numerical investigation includes XFEM crack simulation and an LEFM estimation of fatigue crack propagation life. XFEM is an innovative and convenient method for crack simulation that can achieve satisfying accuracy without remeshing. Because the application of XFEM to bridge engineering is still uncommon, the basic theory of XFEM and its realization in finite element software are presented following the experimental investigation. Given the importance of fatigue material parameters, such as fracture toughness, SIF threshold, and crack growth rate for fatigue assessment, a separate section introduces how these parameters were collected from the literature.

2.2. Bridge Information

We take the Heilongjiang Bridge, a cross-border signature structure connecting the border city of Heihe in China and the city of Blagoveshchensk in Russia, as the case study project. The bridge has a total span of 1072.5 m and an 18.3 m wide deck carrying pedestrian and vehicle traffic, and it needs to operate under an extreme minimum temperature of −44.5 °C. The main load-bearing components of the bridge are made from Q420qFNH steel with a specified yield strength of 420 MPa, tensile strength of 540 MPa, and Charpy V notch impact energy of 47 J at −60 °C.
Heilongjiang Bridge is a cable-stayed bridge with six pylons and double cable planes. The bridge’s elevation and typical cross section are shown in Figure 1 and Figure 2, respectively. Structural analysis shows that the maximum cable force upon bridge completion is 6620 kN, and the maximum cable force range due to live load is 1905 kN. An anchor box type of anchorage structure is used to anchor the stay cables; the cable force is transferred to the box girder through welds between the anchor box support plates and girder webs. The anchor box, the box girder, and their relative positions are shown in Figure 3 (the outer girder web is omitted for clarity). The cable-girder anchorage structure differs from the typical design in that two support plates are connected to girder webs through four weldments to minimize eccentric loading. Arc transition of support plates at their connection to girder webs towards the bearing plate is provided; weldments are specified to be transitioned and grounded smoothly to minimize stress concentration.

2.3. Test Program

2.3.1. Specimen Preparation

The fatigue test specimen was designed to represent the stress state of the original bridge at vulnerable fatigue details. The effect of the cable force was simulated by pressure added to the anchor plate. For the application of vertical fatigue loading, the test specimen was required to rotate at a certain angle. Due to the limitations of floor space and the loading capacity of the fatigue test machine, a 1:1 scale prototype was impossible. The choice of specimen scale should consider the available floor space (2 m × 2 m in plane and 3 m in height) and loading capacity (a maximum capacity of 500 kN and a suggested range of 50~400 kN). The specimen must provide sufficient space for the movement of the loading actuator with a diameter of 0.4 m. The actual supply of plate thickness and instrumentation limits should also be considered. Through a series of model comparisons, shown in Figure 4, the most stressed B17 anchor box was selected as the object of study, and a cable-girder anchorage zone specimen with a scale of 1:3.75 satisfying all laboratory restrictions was obtained. An auxiliary base was added to facilitate the installation of the test specimen, and an extra stiffener was welded to the inner web to improve local stress distribution.
The fatigue specimen was produced with a fabrication process similar to the original bridge except for a slight difference in the type of steel. Heilongjiang Bridge was made of Q420qFNH steel, which is the first ultra-low temperature grade F weathering steel for bridges in China, whereas the test specimen was manufactured with the available Q420qC steel, which is of the same grade but has a lower toughness requirement.
The cable-girder anchoring structure and base component were transported separately to the structural laboratory at the Beijing University of Technology. The base was fixed with anchor bolts to a strong floor within the full extent of the loading frame of the fatigue test machine. The anchorage structure was then carefully positioned and field-welded to the base. Two flexible cable bracings were installed on the girder webs to restrain the lateral displacement of the test specimen. The test setup is shown in Figure 5.

2.3.2. Loading Procedure

A fatigue test was then conducted at room temperature. Nevertheless, the applied fatigue load had been increased to take the structural response at low temperatures into account. The maximum cable force range of the B17 anchor box under the most unfavorable load combination is calculated from structural analysis as 1905 kN, which considers vehicle load, pedestrian load, overall temperature change, the temperature gradient in the girder, and the temperature difference between the cable, girder, and pylon. Based on the principle of similarity and scale ratio, the specimen load range was determined as 135 kN. The test was conducted in a PMW-500 closed-loop servo-controlled universal testing machine, and a minimum fatigue load of 50 kN was maintained during the fatigue test to ensure the stabilization of oil pressure.
A static load test was carried out before fatigue testing to ensure that test equipment and instrumentations were working properly, and the specimen was loaded without eccentricity. The test specimen was loaded monotonically up to design maximum fatigue load and then unloaded to its initial status. The loading and unloading process was repeated several times until a stable structural response was achieved.
Fatigue testing was divided into two stages: confirmatory test and destructive test. The fatigue verification test aims to confirm the safety of the cable-girder anchorage structure under the design cable force range. Should the specimen not suffer apparent damage after 2 million cycles of constant amplitude loading, a destructive fatigue test would then continue to explore the safety margin of the anchor box in terms of fatigue performance. At the fatigue failure test phase, the fatigue load range was gradually increased until the test specimen was damaged or the testing was deemed unsafe. For collecting strain data and checking possible fatigue cracking, the testing machine was shut down temporarily at pre-set intervals. Details of the specimen loading procedure are summarized in Table 1.

2.3.3. Test Instrumentation

Load, displacement, and the number of cycles of the actuator were recorded by the fatigue testing machine, and a real-time load versus time curve was displayed to facilitate test monitoring. Strains were measured to capture the stress distribution of the test specimen. Altogether, 25 strain gauges, including nine strain rosettes and 16 unidirectional strain gauges, were mounted on specimen plate surfaces. To avoid any possible damage from welding and transportation, we mounted all of the strain gauges after the completion of the specimen installation. Because of limited operation space inside the box specimen, most of the measuring points were distributed on the outside surface of the girder webs. The arrangement of strain gauges is schematically shown in Figure 6; designations in brackets are for the lower support plate.
For observing possible fatigue cracking, conventional methods such as visual inspections and digital images were used for crack detection during the test. In addition, acoustic emission technology was employed in real time to monitor possible crack initiation and propagation during cyclic loading. A photo of the acoustic emission system is presented in Figure 7. Four acoustic emission sensors were installed on the surfaces of the test specimen, with monitoring points 3 and 4 mounted on the bottom plate of the box girder, as shown in Figure 5, and monitoring points 1 and 2 inside the box girder, as shown in Figure 6. Each sensor is capable of monitoring an area within a radius of 30 cm near the measurement point.

2.4. Numerical Investigation

2.4.1. Fundamental Theory of XFEM

XFEM adds additional degrees of freedom to the nodes near the crack surface and the crack tip, and an enhancement function (a shape function satisfying appropriate properties) is used to construct nonlinearity and capture a singular stress field at the crack tip. The asymptotic displacement function is as follows [20]:
u = i = 1 N N i ( x ) [ u i + H ( x ) a i + α = 1 4 F α ( x ) b i α
where Ni(x) is the standard shape function of nodal displacements, usually a continuous interpolating polynomial; ui stands for the displacement vector of the standard finite element method nodes; ai and H(x) are the enriched nodal degrees of freedom vector and the discontinuous step function for element nodes across the crack surface and biα and Fα(x) are the enriched crack tip nodal degrees of freedom vector and the elastic asymptotic crack tip function, respectively.
As illustrated in Figure 8a, the first part in square brackets of Equation (1) applies to all standard nodes for the continuous part of the finite element model, the second part applies to nodes in elements divided by the crack, and the third part applies to nodes in elements intersected by the crack tip. When there is no crack, the equation is reduced to the displacement function of the standard finite element method.
In Equation (1), the Heaviside enhancement function is 1 on one side of the crack surface and −1 on the other side, and H(x) is expressed as [24]:
H ( x ) = 1                   ( x x * ) · n 0 1             otherwise
where x is a Gaussian integration point; x* stands for the point on the crack surface nearest to x and n is the outward unit normal vector perpendicular to the crack at point x*. The normal and tangential coordinates of the crack are illustrated in Figure 8b.
In Equation (1), the crack tip enhancement function is a set of linearly independent bases extracted from the analytical solution of the crack tip displacement field based on LEFM. For isotropic materials, the expression of Fα(x) is as follows [20]:
F α ( x ) = [ r sin θ 2 , r cos θ 2 , r sin θ sin θ 2 , r sin θ cos θ 2 ]
where, as shown in Figure 8b, (r, θ) are the coordinates in a polar coordinate system with the origin located at the crack tip, and θ = 0 indicates the direction tangential to the crack.

2.4.2. Crack Growth Path Analysis

The latest versions of the commercial software platform ABAQUS provide XFEM functions. These functions, however, have limitations. For example, only one crack is allowed to exist in each enriched element (an element strengthened with an XFEM shape function). Also, the crack tip is only allowed to stay inside an element, which indicates that crack tip mesh should still be of concern [21]. The automatic propagation of a dynamic crack under high cycle fatigue cannot be realized either [25].
When analyzing the crack propagation path in ABAQUS, it is unnecessary to specify the crack surface in advance. After setting the crack initiation criterion and damage evolution parameter and designating plates with high principal tensile stress as enrichment areas, a crack can initiate and grow automatically. It is necessary to turn on the “Consider geometric nonlinearity” option in the analysis step module and the “Allow crack growth” option in the interaction module [25].
A crack initiation criterion is used to control the damage initiation, and the maximum principal stress criterion is recommended for bridge steel. The maximum allowable principal stress or the limit that fatigue crack initiates is a material property related to the steel’s fatigue limit or the threshold SIF range. In this study, the purpose of crack growth pattern analysis is to obtain the most likely crack path, considering initial imperfections inevitably exist from manufacturing, upon which SIF and fatigue crack propagation life are calculated. Thus, the limit of maximum principal stress should be set based on the stress magnitude in the structure. If the limit is set too high, there will be no cracks; if the limit is too low, there will be multiple cracks, which is not conducive for observing the main cracking pattern. Based on trial and error, the maximum principal stress limit was selected as 20 MPa in our work.
A damage evolution parameter is adopted to control the damage development, and an energy type parameter is often employed. Similarly, for observing further crack growth, it is necessary to set an appropriate limit value for the fracture energy, which should be neither too large nor too small. As a lower bound limit, the fracture energy limit was calculated based on the fracture toughness test results at low temperatures [12]. In this paper, for all three modes of fatigue cracking, the fracture energy limit was 147.42 N/mm (Jc = σsΔm = 384.9 × 0.383), as explained later in Section 2.5.2.
A damage stability coefficient is used to improve convergence. To ensure convergence in analysis, the recommended value for the damage stability parameter is (1~5) × 10−5. In this study, the damage stabilization cohesive in the attribute module was set as 1 × 10⁻⁵.

2.4.3. Fatigue Crack Propagation Life Calculation

Crack growth in a high cycle fatigue region is not yet accommodated by ABAQUS’s XFEM functions. Thus, numerical integration of the Paris formula in LEFM remains the primary method for calculating fatigue crack propagation life. The stable fatigue crack growth rate da/dN is related to the stress intensity factor (SIF) range through material properties C and m as follows [26]:
d a / d N = C · ( Δ K ) m
The fatigue crack propagation life can then be obtained by integrating the Paris formula described in Equation (4) from initial crack size a0 to critical crack size ac.
As stated, SIF is the critical parameter in LEFM for evaluating crack resistance and crack growth life [26]. A numerical method is usually adopted to obtain accurate SIF values for structures with intricate geometries and multi-axial loadings [23]. XFEM was employed in this study to calculate SIFs corresponding to various crack lengths in the anchorage structure, as detailed in Section 3.3.
An analysis for the SIF and contour integral with XFEM in ABAQUS can only be performed for a specific static crack. Consequently, the crack surface must be defined in advance and assembled with other parts of the model, and the “Consider geometric nonlinearity” option in the analysis step module and the “Allow crack growth” option in the interaction module should be turned off [25].

2.5. Fatigue Material Properties

2.5.1. Approximations of Material Properties

One unique feature of this study is to predict structural components’ fatigue performance based on material properties. Ideally, such properties should be obtained under conditions as close as possible to the actual service conditions of the bridge steel in terms of the type of steel, plate thickness, and temperature. The main load-bearing components of the bridge are made from Q420qFNH steel, with a plate thickness of 20 mm in the fatigue-sensitive part of the anchorage structure and the lowest service temperature of −44.5 °C. However, the fatigue material properties of the new Q420qFNH bridge steel are lacking in the literature. Those from Q345 steel plates of a similar thickness under similar temperature conditions were used instead because of availability. Such conservative fatigue parameters are deemed acceptable for a fatigue evaluation of bridges [26]. To directly investigate the difference in the fatigue performance of an anchorage structure between room temperature and low temperature, corresponding material properties at room temperature were also gathered, and how the material fatigue parameters change with temperature was summarized.

2.5.2. Fatigue Crack Fracture Resistance

Because bridge steel usually shows sufficient ductility, the crack tip opening displacement Δm corresponding to the maximum load or starting point of the maximum loading plateau is often adopted for fracture toughness characterization. Experimental values of Δm of 16Mn (Q345) at a room temperature of 20 °C and a low temperature of −50 °C [12] are listed in Table 2. As ductility decreases with lower temperatures, the fracture toughness of Q345 steel at low temperatures is about one-third of that at room temperature.

2.5.3. Fatigue Crack Propagation Threshold

The threshold SIF range ΔKth is a material parameter that reflects the starting point of whether a fatigue crack propagates and LEFM applies [25]. Test results of ΔKth corresponding to a crack growth rate lower than 10−10 m/cycle for Q345qD steel C(T) coupons at room temperature (20 °C) and low temperature (−60 °C) [16] are listed in Table 2 as well. As the temperature drops, ΔKth at low temperature is slightly higher than that at room temperature, indicating that low temperature tends to enhance the resistance of a small fatigue crack extension.

2.5.4. Fatigue Crack Growth Rate

Fatigue crack growth rate da/dN reflects how fast a fatigue crack propagates, and stable crack growth in the medium rate region is usually expressed by the Paris formula, as in Equation (4). Relevant test results of the fatigue crack growth rate of Q345qD steel at room temperature and −60 °C using standard C(T) specimens [16] are listed in the last two columns of Table 2.
Table 2 shows that constant C under low temperature is only one-fifth of that at room temperature, the intercept of the da/dNK curve on the da/dN axis decreasing significantly with a decrease in temperature. Therefore, for a given ΔK action, the fatigue crack growth rate at low temperature is lower than that at room temperature. However, the slope m of the low-temperature crack growth rate curve is slightly larger than that of room temperature. With an increase in ΔK, the low-temperature crack growth rate curve tends to approach the room temperature curve [16].

3. Results and Discussion

3.1. Test Results

3.1.1. Strain and Stress

The load-strain curve at each strain measuring point was derived from the static load test. Representative curves for the strain gauge (W2 and W9) and strain rosette (W5 and W12) are shown in Figure 9, where W2 and W9, W12, and W5 reflect the strain status of the outer web at the top end, middle range, and bottom end of the anchor box-support plate weldment, respectively. For the strain rosette, ε0, ε45, 90 are the measured strains in the horizontal, oblique, and vertical directions. Figure 9 shows that the relationship between measured strains and test load is essentially linear, and data dispersion is within a reasonable range, demonstrating that the specimen was in a linear elastic stage during the test.
Figure 10 shows the time history of maximum stress at representative measuring points on girder webs during the fatigue verification test. Because of improper storage, test results for 40 × 104 cycles were lost. For the strain rosette, the maximum principal stress calculated from the measured strain components is used. The results from finite element analysis are also shown in the figure, indicated by the suffix “FE” added to the series names in the figure legend.
We can observe from Figure 10 that the maximum stress at various measuring points is maintained at a reasonably stable level as the number of loading cycles increases with fluctuations within 3 MPa. For most measuring points, the difference between the analytical results and the average of the experimental results is not significant. However, a higher discrepancy exists at point N3, mostly likely because of the more severe local stress concentration caused by the unexpected welding discontinuity of the nearby stiffener in the test specimen. In general, the experimental data agree well with the results from finite element analysis, indicating the reliability of the numerical simulation of stress distribution.

3.1.2. Cracking Pattern

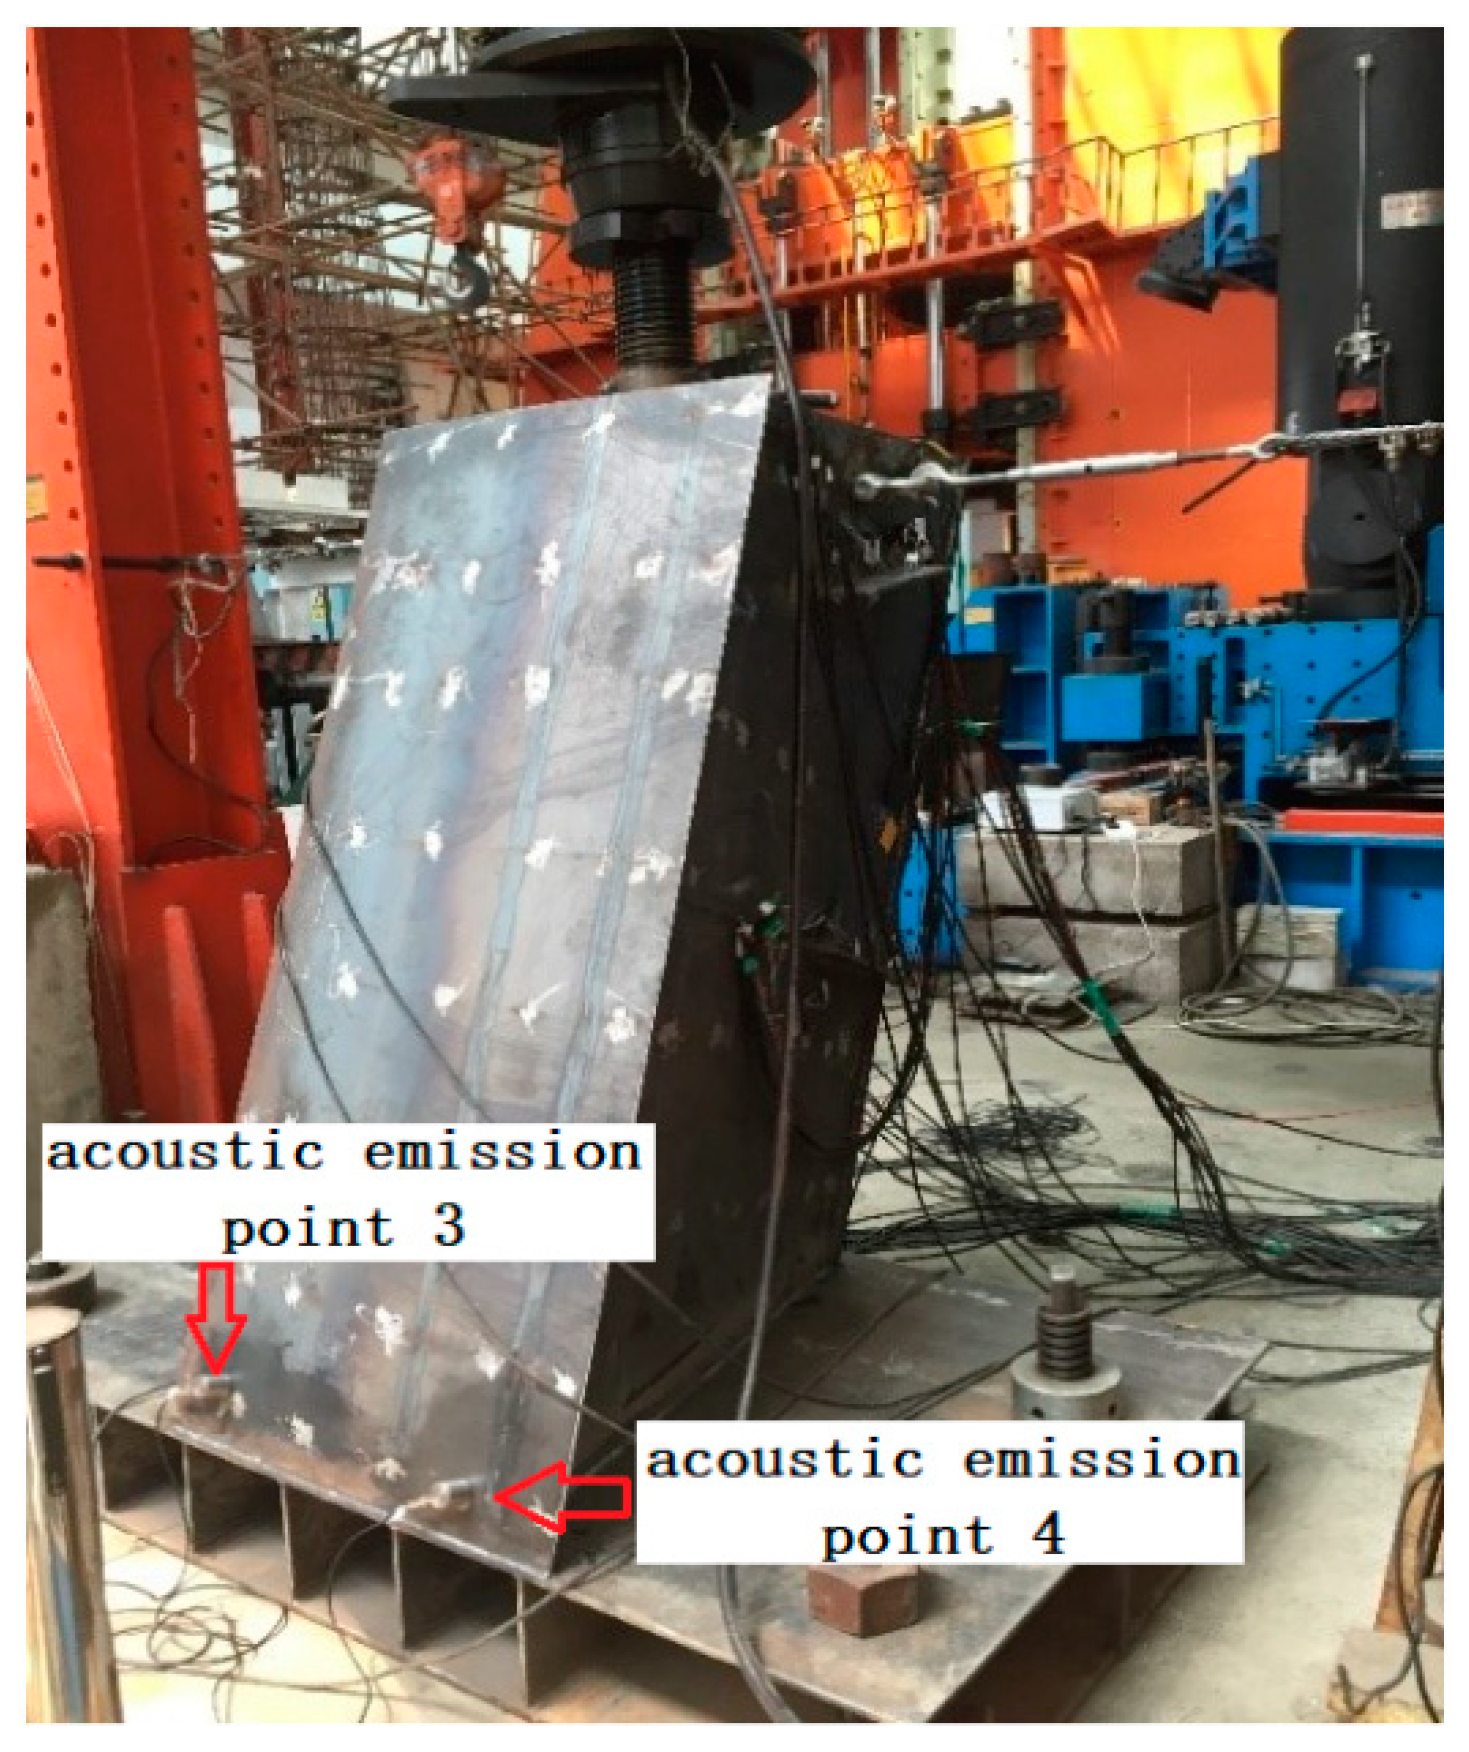
Two measures of energy data generated by acoustic emission technology were analyzed to reveal the fatigue cracking process. “Cumulative energy value” refers to the cumulative value of energy data monitored since the fatigue test started. Since a substantial increase in the proportion of observed high energy values indicates that a macroscopic crack is about to appear in the steel plate [27], the percentage of an energy value higher than 500 PJ per day was calculated for each monitoring point. The daily high energy proportion and cumulative energy at each monitoring point during the fatigue test versus the number of loading cycles are shown in Figure 11.
Before the fatigue test was loaded to 1 million cycles, no cracks or abnormal phenomena were found by visual inspection or acoustic emission monitoring. When the number of cycles was 1.1 million, both the daily high energy proportion and accumulated energy value at measuring point 1 increased significantly, as shown in Figure 11, indicating possible fatigue crack initiation in the specimen. The fatigue test resumed because a crack could not be identified either at the weldment between the anchor box and box girder or in the neighboring plates. Energy monitoring results were stable during subsequent loadings. After 2.6 million loading cycles, the energy parameters at four monitoring points increased significantly again. A visual inspection revealed that, within the range of monitoring point 1, there was an approximately 6 cm long crack on the box girder inner web’s outside surface at the end of the extra stiffener. After 3 million loading cycles, the two parameters at all monitoring points again showed an increasing trend, the growth of point 1 being the most obvious. Meanwhile, it was observed that the crack at the stiffener end had propagated another 1 cm upward during the past 40 × 104 cycles. Because of the severe vibration of the specimen, the fatigue test was terminated at 3.2 million cycles. The observed macroscopic crack and its propagation process during the fatigue test are shown in Figure 12. Upon finishing the test, no other cracks were observed from a thorough examination of the test specimen.
The finite element analysis results of the test specimen are shown in Figure 13. As shown, an apparent stress concentration exists at the end of the web stiffener where the crack occurred. A discontinuous stiffener weldment in the test specimen may have led to a deterioration in the stress state, which eventually caused a premature cracking in the vicinity of the extra stiffener. The position of the maximum tensile stress point from analysis coincides with the location of the crack observed, demonstrating the effectiveness of the finite element model adopted.

3.2. Crack Growth Trend Simulation

3.2.1. Test Specimen

ABAQUS software with XFEM functions was employed to reveal the crack initiation position and crack growth trend in the test specimen. The results are shown in Figure 14. Figure 14a describes the location of the fatigue crack initiation, and the crack growth patterns at different step times are displayed in Figure 14b.
At Step −1.9, a crack emerges in the girder’s inner web at its junction with the extra stiffener, which is of relatively small size and stays within the stiffener plate thickness. As the analysis time increases, two other small cracks appear on both sides of the stiffener, and eventually, multiple small cracks merge into a large continuous one. At Step −4.0, the crack propagates quickly in the web toward the other web stiffener at a slight inclination.
We speculate that the crack that appeared on the girder’s inner web at the end of the extra stiffener is caused by severe stress concentration from the abrupt geometric change and poor welding process. Compared to the fatigue test results shown in Figure 12, the crack location and general growth pattern at the inner web stiffener are close to each other, demonstrating the effectiveness and advantage of XFEM in projecting the crack propagation path.

3.2.2. Bridge Segment

The constraint from cable bracings installed on the top of the specimen during fatigue testing is relatively weak. In reality, both ends of an anchorage segment can be deemed fixed because of the constraints from adjacent segments. Also, the type of extra stiffener added to the test specimen does not exist in the actual bridge. Therefore, a similar crack growth pattern analysis was performed for a more realistic bridge simulation. Analysis results of the crack propagation evolution are shown in Figure 15.
As shown in Figure 15, a crack appears in the girder’s outer web at its connection with the upper support plate on the side of the anchor plate, where the stress distribution is most unfavorable under bridge operation conditions. At Step −1.5, the crack is symmetric around the center of the upper support plate in the thickness direction, with a half crack size of 4 mm. As the analysis time increases, the crack gradually propagates along the path approximately perpendicular to the support plate toward the web stiffeners, symmetrically on both sides. Starting at Step −2.75, as the upper tip approaches the neighboring stiffener, the growth of the lower crack tip accelerates. At Step −3.8, because of continuous stress redistribution and damage accumulation, the crack propagates quickly toward the lower stiffener in the web.

3.3. Stress Intensity Factor Calculation

After a fatigue crack initiates in the outer web at its anchor side connection with the upper support plate, the crack expands in a direction approximately perpendicular to the support plate, as shown in detail in Figure 16.
As seen in Figure 16, web stiffeners will effectively prevent the crack from extending further. Crack propagation is hence assumed to be bounded by upper and lower web stiffeners. The allowable propagation length of the upper and lower crack tip in the bridge segment is 238.1 mm and 408.8 mm, respectively. In this paper, SIFs for through-thickness cracks of different sizes were calculated by an XFEM contour integral. Within the range of the crack tip propagation, a total of 34 different crack length combinations were considered—17 cases for the upper crack tip SIF calculation and 17 for the lower crack tip.
It has been verified that the numerical stability of the SIF for cracks in a complex structure such as a cable-girder anchorage zone can be guaranteed when there are ten contour integrals and the mesh density is sufficiently fine. The J-integral values of the first two contours are usually not stable and should be omitted. Calculated SIFs from the 3~10 contours tend to be stable, with fluctuations of less than 5%, the average of which is thus taken as the calculated SIF at a given crack front location. The SIF on the inner surface of the web was obtained by fitting SIF values at other crack front locations.
In LEFM, the basic formula of the SIF can be expressed as follows [5]:
K = Y σ π a
where shape function Y depends on location, the shape and size of the crack, and stress condition, as well as structural detail; σ stands for nominal stress, which was computed as the cable force divided by the cross-sectional area of two girder webs and a is the half crack size.
With available SIFs of different crack lengths, the corresponding Y values were calculated from Equation (5), and an expression of shape function Y(a) for the upper and lower crack tip was obtained by data fitting. The determination coefficient R2 for the curve fitting of the upper and lower crack tip shape function is 0.7425 and 0.7272, respectively. Among 34 crack cases calculated, the average value of Y is 0.90, and the maximum is 1.48. To simplify calculations, Y is conservatively taken as a constant of 1.5 in the subsequent evaluation of fatigue crack propagation performance.

3.4. Crack Propagation Life Analysis

3.4.1. Analysis Cases

Three different working conditions were considered for a fatigue performance evaluation of the anchorage structure: a room temperature load combined with room temperature material property, a low-temperature load effect with room temperature material property, and a low-temperature load with low-temperature material property. In this section, these conditions are referred to as operating case I, case II, and case III, respectively.
Low-temperature or room-temperature load refers to whether the fatigue load range takes into consideration the extra ambient cable force beyond that caused by vehicular live load and pedestrian load. Room or low-temperature material properties refer to the characteristic fatigue parameters of bridge steel at room or low temperature.
In operating case I, the influence of low temperature is completely ignored; in operating case III, the load effect and fatigue resistance of low temperature are considered simultaneously, corresponding to a bridge serviced in a low-temperature environment. In case II, only the load effect but not the fatigue resistance of low temperature is considered. This case is similar to the fatigue test described in Section 2, which was carried out at room temperature despite the increased load range.
In short, operating cases I, II, and III correspond to the fatigue performance of the anchorage structure under room-temperature operation, fatigue testing, and low-temperature operation, respectively.

3.4.2. Critical Crack Size

Critical crack size ac is determined by the size acf calculated from fracture toughness and the crack propagation range constrained by plate width or detail geometry. For the anchorage structure studied, the boundary of the web stiffeners determines the propagation range in which a crack would grow, as shown in Figure 16.
Crack size acf related to fracture toughness was calculated as follows:
a c f = K c 2 / π ( Y σ max ) 2
where shape function Y of the upper and lower crack tips is taken as a constant of 1.5; σmax is the maximum stress at the part in consideration (assuming stress ratio R = 0).
Fracture toughness Kc, crack tip opening displacement Δm, fracture energy Gc, and J-integral Jc are related as follows in LEFM [5]:
K c 2 = E σ s δ m = E G c = E J c
Crack size acf of the anchorage zone was calculated according to Equations (6) and (7) and Δm in Table 2 and is listed in the fourth column of Table 3. The modulus of elasticity E is 2.05 × 10⁵ MPa, and yield strength σs of Q345qD is 353.2 MPa at room temperature (20 °C) and 384.9 MPa at low temperature (–60 °C) [17].
As can be seen in Table 3 for operating cases I and II, when the temperature effect is taken into account for the cable force range, the stress range increases by 19%, and acf decreases by 29%. A comparison of operating cases II and III in Table 3 reveals that since the Kc of steel decreases significantly as the temperature drops, the acf at low temperature is only one-third of that at room temperature.
Considering the effect of low temperature on both the load response and fatigue resistance, the acf at low temperature is only one-quarter of that at room temperature. The resistance of the anchorage structure to fracture instability at low temperatures is poorer than that in normal operating conditions. However, even for case III, the acf is as large as 1.875 m, indicating that the bridge steel has excellent toughness and that the risk of a brittle fracture is small.
Considering the geometric limits of crack propagation, the critical crack size is ac = 238.1 mm for the upper crack tip and ac = 408.8 mm for the lower crack tip, as listed in the fifth and sixth columns of Table 3.

3.4.3. Initial Crack Size

Initial crack size a0 is determined by the larger of the engineering-detectable crack size and the size a0f calculated from crack propagation threshold value ΔKth.
The maximum allowable non-propagating crack size a0f was calculated following Equation (8):
a 0 f = Δ K t h 2 / π ( Y Δ σ ) 2
where shape function Y is 1.5; Δσ stands for the nominal stress range at the far field, and the maximum stress range at the critical position was conservatively taken for the calculation.
When a0f is compared with detectable crack size, the possibility of crack detection can be evaluated. Currently, the detectable crack size of most non-destructive testing technology in engineering applications is 0.5 mm [7]. If a0f determined by ΔKth is larger than the detectable crack size, the maximum non-propagating crack size is very likely to be detected.
The maximum allowable non-propagating crack size a0f of the anchorage zone was calculated according to Equation (8) and the ΔKth value in Table 2. Crack size a0f and initial crack size a0 are listed in the last two columns of Table 3. For the anchorage structure studied, the a0f for operating cases I, II, and III is 0.85 mm, 0.60 mm, and 0.94 mm, respectively.
According to Table 3 for operating cases I and II, when the temperature effect is taken into account for the cable force range, the stress range increases by 19% and a0f decreases by 29%. For operating cases II and III in Table 3, as the ΔKth value increases by 25% at low temperatures, a0f increases by 56% accordingly.
Considering the effect of low temperature on both the load response and fatigue resistance, a0f at low temperature is slightly larger than the room temperature counterpart. Therefore, the non-propagating fatigue crack performance of the anchorage structure at low temperatures is equivalent to that in normal operating conditions.

3.4.4. Calculated Crack Propagation Life

The fatigue crack propagation life of the cable-girder anchorage zone of Heilongjiang Bridge was obtained through integration of the Paris formula as described in Equation (4), from initial crack size a0 to critical crack size ac.
The calculated results of crack propagation life in an anchorage structure under different service conditions are listed in Table 4. The critical crack size of the upper crack tip ac,upper is smaller than that of the lower crack tip, so the crack propagation life of the upper crack tip Nupper is thus conservatively taken as the N of the cable-girder anchorage zone.
As shown in Table 4, when we compare operating cases I and II both serviced under room temperature, we can see that the higher the stress level is, the shorter the fatigue crack propagation life becomes. When the low-temperature effect is taken into account for the cable force range, the stress range increases by 19% and the fatigue crack propagation life of the structural detail is reduced by 27% accordingly. A comparison of operating cases II and III in Table 4, which are serviced under the same load magnitude, reveals that low temperature is beneficial in terms of the fatigue crack growth rate, and the fatigue crack propagation life of the structural detail increases to 2.1 times that at room temperature. Considering the effect of low temperature on both load response and fatigue resistance, the fatigue crack propagation life of the anchorage structure at low temperature is about 1.6 times that in normal operating conditions. Low temperature shows no adverse effect on crack propagation life, and operating case II corresponding to the fatigue test yields the most unfavorable results.
It is worth emphasizing that steel tends to become brittle at low temperatures, and the above conclusion might seem counterintuitive. Fracture toughness at low temperatures is smaller than at room temperature, as shown in Table 2 and Table 3. However, bridge steel toughness is high even at low temperatures, and brittle fracture potential is small (Section 3.4.2). Fracture toughness mainly determines the crack size acf, considering fracture instability. The critical crack size ac is controlled by geometry boundaries and plays little role in fatigue propagation life (discussed further in Section 3.4.5).
On the contrary, the crack grows much slower at lower temperatures, as shown in Table 2 and Table 4. Even with a slightly larger initial crack size of a0, the calculated fatigue crack propagation life is longer. Therefore, low temperature has a beneficial effect on crack propagation life as opposed to room temperature. Nevertheless, the conclusion is only valid for the structure and loading considered; cautions must be exercised beyond the scope of the conducted work.
When dividing N by the yearly stress cycles of the anchor box, its fatigue crack propagation life can be expressed in years. As the standard cable distance of the Heilongjiang Bridge is 12 m, only one stress cycle is caused by the passing of one fatigue vehicle [28]. Based on Chinese technical standards [29], the number of stress cycles experienced by a single lane in 100 years of service is 100 × 365 × 15,000/2 = 2.74 × 10⁸. When computed according to the predicted traffic volume in engineering drawings of the bridge, the number of stress cycles becomes 100 × 365 × 3738/2 = 6.9 × 10⁷. Fatigue crack propagation life in years is listed in the last column of Table 4, with data before and after “/” being calculations from stipulated and forecasted traffic volume, respectively. For all three cases, the remaining fatigue life is in the order of 1~10 years.

3.4.5. Sensitivity Analysis of a0 and ac

A sensitivity analysis of initial crack size a0 and critical crack size ac was conducted, as shown in Figure 17. When the detectable crack size increases to 1.0 mm, the crack growth life under three operating cases decreases by 2.10 × 10⁵, 4.38 × 10⁵, and 1.77 × 10⁵ cycles, respectively, although the initial crack size increases by only 0.15 mm, 0.40 mm, and 0.06 mm. Since initial crack size has a significant influence on the fatigue crack propagation life, it is necessary to ensure that crack detection technology can meet the accuracy requirement of 0.5 mm to ensure the early detection of an initial crack and to avoid sudden fracture.
Conversely, a sensitivity analysis of ac in Figure 17b shows that, even if the critical crack size is increased by 1.43 m to seven times the original value, the crack propagation life under three operating cases increases by only 5.30 × 10⁵, 3.46 × 10⁵, and 3.97 × 10⁵ cycles, respectively. Therefore, for assessing fatigue crack growth life, critical crack size or fracture toughness has little effect.

3.5. Study Limitations and Future Research Needs

Numerical methods were employed to investigate possible crack initiation locations and crack propagation life in the cable-girder anchorage zone. Although the finite element model was validated against experimental investigation to prove its effectiveness concerning stresses, strains, and crack growth patterns, the fatigue life of the inclined crack initiated from the extra stiffener was not validated with experimental observation. Although the calculation of fatigue crack propagation life with the Paris equation is well established [2,11], comparing analytical results with two crack front positions observed at 2.6 million and 3 million loading cycles in Figure 12 would be interesting.
Although mode I crack is dominant for the cable-girder anchorage zone in the case study bridge, mixed mode cracks similar to the inclined crack observed in the fatigue test could occur under the combination of complex geometry details, stress concentration, welding residue stress, and fatigue load. A mixed mode consideration is undoubtedly more desirable to evaluate the potential fatigue cracking and brittle fracture failure risk of anchorage structures in a low ambient temperature environment.
This study did not consider the details of welding residual stresses and their effect on the fatigue crack initiation and propagation simulation. Instead, while keeping the stress range the same, a higher stress ratio (R = 0.5) was assumed when obtaining material properties such as the fatigue crack growth rate. If the welding residual stress field is known from measurement or analysis, it should be superimposed to the stress caused by alternating fatigue load when appropriate.
Our work demonstrates that XFEM can effectively simulate crack growth trends and significantly simplify crack modeling. However, SIF calculation for complicated structural details still needs to be improved regarding computation cost and accuracy. A tool capable of analyzing three-dimensional crack propagation, considering the coupling effect of multiple cracks, and modeling the dynamic extension of fatigue cracks needs to be developed.
Finally, it should be pointed out that fatigue assessment in this paper was based on a deterministic approach. Nevertheless, factors affecting fatigue performance, such as material properties, residual stresses, loads, temperatures, and plate thicknesses, are random variables. The probabilistic fracture mechanics method is warranted to evaluate fatigue performance accurately.

4. Conclusions

This paper presented a fatigue performance evaluation of the cable-girder anchorage zone of the Heilongjiang Bridge. As this bridge is located in the northernmost region of China, with the lowest service temperature of −44.5 °C, the influence of low temperature was examined in terms of fatigue load effect and fatigue resistance. Combining a room temperature fatigue test with a numerical analysis of the crack growth pattern and crack propagation life, a fatigue assessment of the anchorage structure at low temperatures was conducted. The following conclusions were drawn:
(1)
A room temperature fatigue test loaded up to 3.2 million cycles was performed on a 1:3.75 scale specimen of the most stressed anchor box B17. After 2 million cycles of design cable force loading that took the low-temperature load effect into account (load range of 135 kN in the specimen, representing 1905 kN in the actual bridge), and after an additional 1.2 million cycles of incremental loading up to twice of the design cable force, no crack was found in the anchor box and adjacent plates.
(2)
An extended finite element method was adopted to analyze the crack initiation location and crack propagation path of the anchorage structure. A fatigue crack is most likely to appear in the outer girder web at the anchor end of its connection with the upper support plate. As illustrated in Figure 15, it probably will propagate to both sides along the direction that is perpendicular to the support plate and be arrested by the web stiffeners.
(3)
Based on the characteristic fatigue parameters of bridge steel at low temperatures, the resistance of an anchorage structure to fatigue crack propagation in a low ambient temperature environment was evaluated. Although the resistance of the anchorage structure to fatigue crack instability decreases and fractural critical crack size acf is reduced to 1/4 of that at room temperature, the risk of a brittle fracture at low temperature is small with the acf as large as 1.875 m. The fatigue crack propagation life of an anchorage structure at low temperature is 1.6 times that at room temperature thanks to a slower crack growth rate. Nevertheless, tough structural steel and anchor box structures with a smooth transition of geometries are recommended to further safeguard the cable-girder anchorage zone in a low ambient temperature environment.

Author Contributions

Conceptualization, H.C. and W.B.; methodology, H.C. and Y.J.; software, Y.Z.; validation, H.C., W.B. and Y.J.; formal analysis, Y.Z. and H.C.; investigation, H.C. and Y.Z.; resources, H.C., W.B. and Y.J.; data curation, Y.Z.; writing—original draft preparation, H.C.; writing—review and editing, H.C., Y.Z., Y.J. and W.B.; visualization, Y.Z.; supervision, H.C.; project administration, H.C.; funding acquisition, H.C. and W.B. All authors have read and agreed to the published version of the manuscript.

Funding

This research was funded by NATIONAL NATURAL SCIENCE FOUNDATION OF CHINA, grant number 51008006, 52278137. The APC was funded by the open access program of Beijing University of Technology.

Institutional Review Board Statement

Not applicable.

Informed Consent Statement

Not applicable.

Data Availability Statement

Details of the experimental data and the analytical model presented in this study are available on request from the corresponding author. The data are not publicly available due to privacy.

Acknowledgments

The authors appreciate the help from graduate students (Rui Zhao, Wei Wang, Dewang Li, Lidong Zhang, Yao Zhang) and technical staff (Lihui Wang, Hongyu Zhou) during fatigue testing. Bridge technical documentation from Heilongjiang Bridge Engineering Management Co., Ltd. and the China Communications Construction Co., Ltd. is also acknowledged.

Conflicts of Interest

The authors declare no conflict of interest. The funders had no role in the design of the study; in the collection, analyses, or interpretation of data; in the writing of the manuscript; or in the decision to publish the results.

References

  1. Wei, X.; Xiao, L.; Wang, Z.J. Full-scale specimen testing and parametric studies on tensile-plate cable-girder anchorages in cable-stayed bridges with steel girders. J. Bridge Eng. 2018, 23, 04018006. [Google Scholar] [CrossRef]
  2. Liu, Q.K.; Qiang, S.Z.; Zhang, Q. Study on fatigue behaviour of anchorage of cable and girder of long span cable-stayed bridge. J. Southwest Jiaotong Univ. 2001, 1, 42–49. [Google Scholar]
  3. Zhang, Q.H.; Cui, C.; Li, Q.; Bai, B. Study on fatigue features of box-shaped cable-girder anchorage for cable-stayed bridges with steel box girders by model test. Appl. Mech. Mater. 2013, 423–426, 1259–1267. [Google Scholar] [CrossRef]
  4. Shi, Z.; Sun, Z.T.; Yang, S.L.; Zhou, K.X. Fatigue performance of butt-welded tensile plate cable-girder anchorages of long-span cable-stayed steel box girder railway bridges. J. Bridge Eng. 2021, 26, 04020108. [Google Scholar] [CrossRef]
  5. Barsom, J.M.; Rolfe, S.T. Fracture and Fatigue Control in Structures: Application of Fracture Mechanics, 3rd ed.; ASTM: West Conshohocken, PA, USA, 1999. [Google Scholar]
  6. Chen, H.T.; Grondin, G.Y.; Driver, R.G. Characterization of fatigue properties of ASTM A709 high performance steel. J. Constr. Steel Res. 2007, 63, 838–848. [Google Scholar] [CrossRef]
  7. Fisher, J.W. Fatigue and Fracture in Steel Bridge: Case Studies; John Wiley: New York, NY, USA, 1994. [Google Scholar]
  8. Shul’ginov, B.S.; Matveyev, V.V. Impact fatigue of low-alloy steels and their welded joints at low temperature. Int. J. Fatigue 1997, 19, 621–627. [Google Scholar] [CrossRef]
  9. Bridges, R.; Zhang, S.; Shaposhnikov, V. Experimental investigation on the effect of low temperatures on the fatigue strength of welded steel joints. Ships Offshore Struct. 2012, 7, 311–319. [Google Scholar] [CrossRef]
  10. Zhou, H.; Wang, Y.Q.; Shi, Y.J.; Wu, Y.M. Experimental study on fracture resistant design method for steel structural components at low temperature. Int. J. Steel Struct. 2015, 15, 319–333. [Google Scholar] [CrossRef]
  11. Tao, X.Y.; Zhang, Y.L. Service life evaluation experience for existing railway steel bridge in China. Adv. Steel Constr. 2015, 11, 347–358. [Google Scholar]
  12. Wu, Y.M.; Wang, Y.Q.; Shi, Y.J.; Jiang, J.J. Effects of low temperature on properties of structural steels. J. Univ. Sci. Technol. Beijing 2004, 11, 442–448. [Google Scholar]
  13. Braun, M.; Ehlers, S. Review of methods for the high-cycle fatigue strength assessment of steel structures subjected to sub-zero temperature. Mar. Struct. 2022, 82, 103153. [Google Scholar] [CrossRef]
  14. Walters, C.L.; Alvaro, A.; Maljaars, J. The effect of low temperatures on the fatigue crack growth of S460 structural steel. Int. J. Fatigue 2016, 82, 110–118. [Google Scholar] [CrossRef]
  15. Li, Z.R.; Zhang, D.C.; Wu, H.Y.; Huang, F.H.; Hong, W.; Zang, X.S. Fatigue properties of welded Q420 high strength steel at room and low temperatures. Constr. Build. Mater. 2018, 189, 955–966. [Google Scholar] [CrossRef]
  16. Liao, X.W.; Wang, Y.Q.; Qian, X.D.; Shi, Y.J. Fatigue crack propagation for Q345qD bridge steel and its butt welds at low temperatures. Fatigue Fract. Eng. Mater. Struct. 2018, 41, 675–687. [Google Scholar] [CrossRef]
  17. Liao, X.W.; Wang, Y.Q.; Wang, Z.Y.; Feng, L.Y.; Shi, Y.J. Effect of low temperatures on constant amplitude fatigue properties of Q345qD steel butt-welded joints. Eng. Fail. Anal. 2019, 105, 597–609. [Google Scholar] [CrossRef]
  18. Liao, X.W.; Wang, Y.Q.; Feng, L.Y.; Shi, Y.J. Investigation on fatigue crack resistance of Q370qE bridge steel at a low ambient temperature. Constr. Build. Mater. 2020, 236, 117566. [Google Scholar] [CrossRef]
  19. Min, J.B.; Bass, J.M.; Spradley, L.W. Adaptive finite element methods for two-dimensional problems in computational fracture mechanics. Comput. Struct. 1994, 50, 433–445. [Google Scholar] [CrossRef]
  20. Belytschko, T.; Black, T. Elastic crack growth in finite elements with minimal remeshing. Int. J. Numer. Methods Eng. 1999, 45, 601–620. [Google Scholar] [CrossRef]
  21. Shi, J.X.; Chopp, D.; Lua, J.; Sukumar, N.; Belytschko, T. Abaqus implementation of extended finite element method using a level set representation for three-dimensional fatigue crack growth and life predictions. Eng. Fract. Mech. 2010, 77, 2840–2863. [Google Scholar] [CrossRef]
  22. Cao, B.Y.; Cheng, S.W.; Li, A.Q.; Deng, Y.; Fang, Z. Fatigue crack propagation study of bridge steel Q345qD based on XFEM considering the influence of the stress ratio. Appl. Sci. 2022, 12, 12782. [Google Scholar] [CrossRef]
  23. da Silva, A.L.L.; Correia, J.A.F.O.; de Jesus, A.M.P.; Lesiuk, G.; Fernandes, A.A.; Calçada, R.; Berto, F. Influence of fillet end geometry on fatigue behaviour of welded joints. Int. J. Fatigue 2019, 123, 196–212. [Google Scholar] [CrossRef]
  24. Xin, H.H.; Correia, J.A.F.O.; Veljkovic, M. Three-dimensional fatigue crack propagation simulation using extended finite element methods for steel grades S355 and S690 considering mean stress effects. Eng. Struct. 2021, 227, 111414. [Google Scholar] [CrossRef]
  25. Dassault Systemes Simulia Corp. ABAQUS Analysis User’s Manual; Dassault Systemes Simulia Corp.: Providence, RI, USA, 2019. [Google Scholar]
  26. Broek, D. The Practical Use of Fracture Mechanics; Kluwer Academic Publishers: Boston, MA, USA, 1989. [Google Scholar]
  27. Nair, A.; Cai, C.S. Acoustic emission monitoring of bridges: Review and case studies. Eng. Struct. 2010, 32, 1704–1714. [Google Scholar] [CrossRef]
  28. JTG D64-2015(E); Ministry of Transport of the People’s Republic of China. Specifications for Design of Highway Steel Bridges. China Communications Press: Beijing, China, 2018.
  29. JTG B01-2014(E); Ministry of Transport of the People’s Republic of China. Technical Standards for Highway Engineering. China Communications Press: Beijing, China, 2018.
Figure 1. Bridge elevation layout (only one-quarter of the bridge structure shown due to symmetry, dimensions in m).
Applsci 13 09990 g001
Figure 2. Typical cross section of the bridge (dimensions in mm).
Applsci 13 09990 g002
Figure 3. Anchor box type cable-girder anchorage structure.
Applsci 13 09990 g003
Figure 4. Design of fatigue test specimen.
Applsci 13 09990 g004
Figure 5. Fatigue test setup.
Applsci 13 09990 g005
Figure 6. Schematic diagram of strain gauge position: (a) Support plates; (b) Girder outer web; (c) Girder inner web.
Applsci 13 09990 g006
Figure 7. Acoustic emission instrument and sensors.
Applsci 13 09990 g007
Figure 8. Illustration of nodal enhancement and crack coordinates: (a) Nodal enhancement due to a crack; (b) Normal and tangential coordinates of a crack.
Applsci 13 09990 g008
Figure 9. Load-strain diagram from static load test: (a) Measuring point W2; (b) Measuring point W9; (c) Measuring point W5; (d) Measuring point W12.
Applsci 13 09990 g009aApplsci 13 09990 g009b
Figure 10. Stress time history during fatigue verification test: (a) Girder inner web; (b) Girder outer web.
Applsci 13 09990 g010
Figure 11. Variation of monitored energy data during fatigue test: (a) Percentage of energy greater than 500 PJ; (b) Cumulative energy value.
Applsci 13 09990 g011
Figure 12. Crack evolution of test specimen.
Applsci 13 09990 g012
Figure 13. Stress distribution of inner web.
Applsci 13 09990 g013
Figure 14. Crack propagation path of the test specimen: (a) Location of fatigue crack initiation; (b) Crack growth under different analysis stages.
Applsci 13 09990 g014
Figure 15. Simulation of crack propagation path in bridge segment: (a) Location of fatigue crack initiation; (b) Crack growth under different analysis stages.
Applsci 13 09990 g015aApplsci 13 09990 g015b
Figure 16. Crack location and propagation boundary.
Applsci 13 09990 g016
Figure 17. Sensitivity analysis of initial crack size and critical crack size: (a) Influence of initial crack size; (b) Influence of critical crack size.
Applsci 13 09990 g017
Table 1. Loading procedure.
Test PhaseNumber of
Cycles
(104)
Shutdown
Interval
(104)
Loading
Frequency
(Hz)
Pmin
(kN)
Pmax
(kN)
ΔP
(kN)
Static load test0180
Fatigue verification test0–200203.850185135
Fatigue failure test200–210103.850195145
210–240103.850245195
240–270103.850270220
270–280103.850285235
280–290103.850300250
290–320103.850320270
Table 2. Fracture parameters and crack growth rate of Q345 steel under different temperatures.
Temperature (°C)Δm (mm) Δ K th   ( M P a · m ) C (mm/cycle)m
201.1723.113.99 × 10−82.472
−50 or −600.3833.897.18 × 10−92.818
Table 3. acf, ac, a0f, and a0 of anchorage structure under different operating cases.
Operating CaseKc
( M P a · m )
σmax or Δσ
(MPa)
acf
(m)
ac,upper
(mm)
ac,lower
(mm)
ΔKth ( M P a · m ) a0f
(mm)
a0
(mm)
I291.3140.217.429238.1408.83.110.850.85
II291.3147.765.266238.1408.83.110.600.60
III173.8447.761.875238.1408.83.890.940.94
Table 4. Crack propagation life of anchorage structure under different operating cases.
Operating CaseC (mm/cycle)mΔσ
(MPa)
a0
(mm)
ac,upper
(mm)
ac,lower
(mm)
Nupper
(cycle)
Nlower
(cycle)
N
(year)
I3.99 × 10−82.47240.210.85238.1408.84.00 × 1064.18 × 1061.5/5.8
II3.99 × 10−82.47247.760.60238.1408.82.92 × 1063.03 × 1061.1/4.2
III7.18 × 10−92.81847.760.94238.1408.86.23 × 1066.38 × 1062.3/9.0
Disclaimer/Publisher’s Note: The statements, opinions and data contained in all publications are solely those of the individual author(s) and contributor(s) and not of MDPI and/or the editor(s). MDPI and/or the editor(s) disclaim responsibility for any injury to people or property resulting from any ideas, methods, instructions or products referred to in the content.

