Article

Deriving Surface Water Storage and Curve Numbers from Rainfall–Runoff Relationships in Conventional and Minimum Tillage Systems in Gwanda, Zimbabwe

by
Walter Mupangwa
1,*,
Bongani Ncube
2,
Lovemore Chipindu
3,
Isaiah Nyagumbo
3 and
Clementine Denga-Mupangwa
4
1
Centre for Research and Postgraduate Studies, Marondera University of Agricultural Sciences and Technology, Marondera, Zimbabwe
2
Centre for Water and Sanitation Research, Faculty of Engineering and the Built Environment, Cape Peninsula University of Technology, Bellville, Cape Town 7535, South Africa
3
International Maize and Wheat Improvement Centre, Mount Pleasant, Harare, Zimbabwe
4
Independent Researcher, 3939 Tsuro Close, Ruwa, Harare, Zimbabwe
*
Author to whom correspondence should be addressed.
Appl. Sci. 2023, 13(17), 9623; https://doi.org/10.3390/app13179623
Submission received: 20 July 2023 / Revised: 14 August 2023 / Accepted: 23 August 2023 / Published: 25 August 2023
(This article belongs to the Special Issue Water Science Technologies for Optimising Agricultural Production)

Abstract

:
Soil water availability is one of the major constraints limiting crop productivity under semi-arid conditions in sub-Saharan Africa. Crop models are tools that can be used to explain and predict the effect of improved technologies on runoff and soil water availability, and their impact on crop productivity. The study hypothesized that minimum tillage treatments (planting basins and ripper) retain more rainwater and reduce runoff generation compared to conventional tillage treatments in maize-based cropping systems. Runoff plots were established on-farm and surface runoff was collected after each daily rainfall event. Surface water storage and curve number for each conventional and minimum tillage treatment were derived from the runoff and rainfall amounts measured over two growing seasons. Daily rainfall events of 9–76 mm generated runoff in both conventional and minimum tillage treatments. Planting basins retained more rainwater (12–19%) and reduced runoff generation (40–51%) than the conventional and ripper tillage treatments. Runoff generation in the tillage treatments varied with soil texture. Conventional and double ploughing treatments recorded more runoff (11–12%) in loamy sands than in sandy soil. Surface water storage and curve numbers from tillage treatments were consistent with runoff results and with conventional treatments, having higher curve numbers than minimum tillage practices. Conventional and ripper tillage practices have similar runoff potential as demonstrated by their curve numbers generated in this study. Curve numbers of 75–76 for conventional and 72–74 for minimum tillage systems are practical under light-textured soil and a land slope of <2% when conventional and minimum tillage practices are implemented.

1. Introduction

Rainwater capture and its storage in the soil are important for the success of semi-arid cropping systems in sub-Saharan Africa (SSA) [1,2]. Rain-fed smallholder farming systems are projected to continue contributing about 40% of growth in cereal production [3]. Various rainwater harvesting (RWH) and soil water conservation techniques have been developed and adapted for smallholder farming systems in SSA. Rainwater harvesting is the practice of collecting rainwater and storing it for future use on the farm. Zai pits, dead level contours, infiltration pits, Fanya juus, tied ridging, and potholing are some of the RWH techniques adapted to the smallholder systems of SSA [2,4,5,6]. In addition, conservation tillage and conservation agriculture practices have been developed for rain and soil water management in cropping systems on smallholder farms [7,8,9,10].
Agricultural water management in rain-fed farming systems of sub-Saharan Africa and similar environments is now paramount in the face of increasing drought and heat stresses [11]. RWH technologies, such as planting basins and ripped furrows, increase the residence time of rainwater on the soil surface, thereby promoting water infiltration into the soil. The increased water infiltration reduces surface runoff generation and promotes soil water recharge [12,13]. However, the runoff potential of the promoted RWH techniques has not been evaluated in most parts of SSA, including southern Africa. The runoff potential of these RWH techniques can be evaluated by hydrologic models and the curve number (CN) approach, which use measured runoff and daily rainfall [14,15,16].
When rainfall and runoff data are available, the runoff potential of RWH techniques can be assessed using the CN approach [15]. The CN method is a procedure used to determine the potential runoff from a rainfall event in a given land area [17]. A CN can be defined as the proportion of rainfall that gets converted into runoff in a given surface area, and its value ranges from 0 to 100 [18,19]. The soil’s hydrological conditions, soil type, antecedent soil moisture content, land use, and the treatment applied (e.g., tillage or mulching) to a given area of interest, influence the CN [20,21]. The importance of CNs in agricultural research includes the fact that CNs are an important input parameter for crop models and can be used for water-logging forecasting in cropping systems, the modification of soil water conservation techniques for increased infiltration, and a better understanding of water balance at plot or field level [15,20,22,23].
In agricultural land-use systems, CNs of 60–90 have been reported in studies conducted by the [24]. In SSA, cropping systems modelling studies used CNs of 50–90, but these were largely derived from United States Department of Agriculture (USDA)-based systems, researchers’ experience of the tillage systems, and simulated physical environments [25,26,27,28,29]. In addition, some of the CNs reported in the literature are determined from annual rainfall totals [30], which might be different from values estimated from event rainfall recorded at a given location. Curve numbers of 61–91 in row crops such as legumes, 58–88 in small grains like sorghum (Sorghum bicolor L.), and 51–89 in closely planted legumes have been reported [24]. In conventionally ploughed soils without surface cover, CNs ranging from 50 to 90 have been applied in previous crop systems modelling studies using the Agricultural Production Systems Simulator (APSIM) model [25,26,29]. In no-till and conservation-agriculture-based cropping systems, CNs for bare soil ranging from 75 to 80 have been used for simulations using the APSIM model [31,32].
Although default values may be used in crop simulations, as demonstrated by previous studies [25,26,27,29,31,32], it is in the interest of biophysical modelers in agricultural research to calibrate models more robustly with inputs that are as close as possible to the treatments and cropping systems being tested, physical environmental conditions (e.g., soil type, slope, and surface cover), rainfall characteristics of the environment, and antecedent soil conditions. The CNs used in southern Africa for simulating cropping systems using models such as APSIM are primarily default. The purpose of this study was to derive surface water storage and CNs from daily rainfall events and runoff data measured from tillage systems tested in Zimbabwe. The research questions were the following: (1) What proportion of rainfall is converted into runoff in minimum and conventional tillage systems used in Zimbabwe? (2) How is this rainfall–runoff relationship influenced by soil texture? (3) What is the effect of different tillage methods on the surface storage of rainwater? The study sought to determine (1) tillage effect on runoff generation, (2) soil texture effect on runoff generation, (3) tillage effect on surface storage after each rainfall event, and (4) CNs using measured event rainfall and runoff from four tillage treatments on smallholder farms in semi-arid south-western Zimbabwe.

2. Materials and Methods

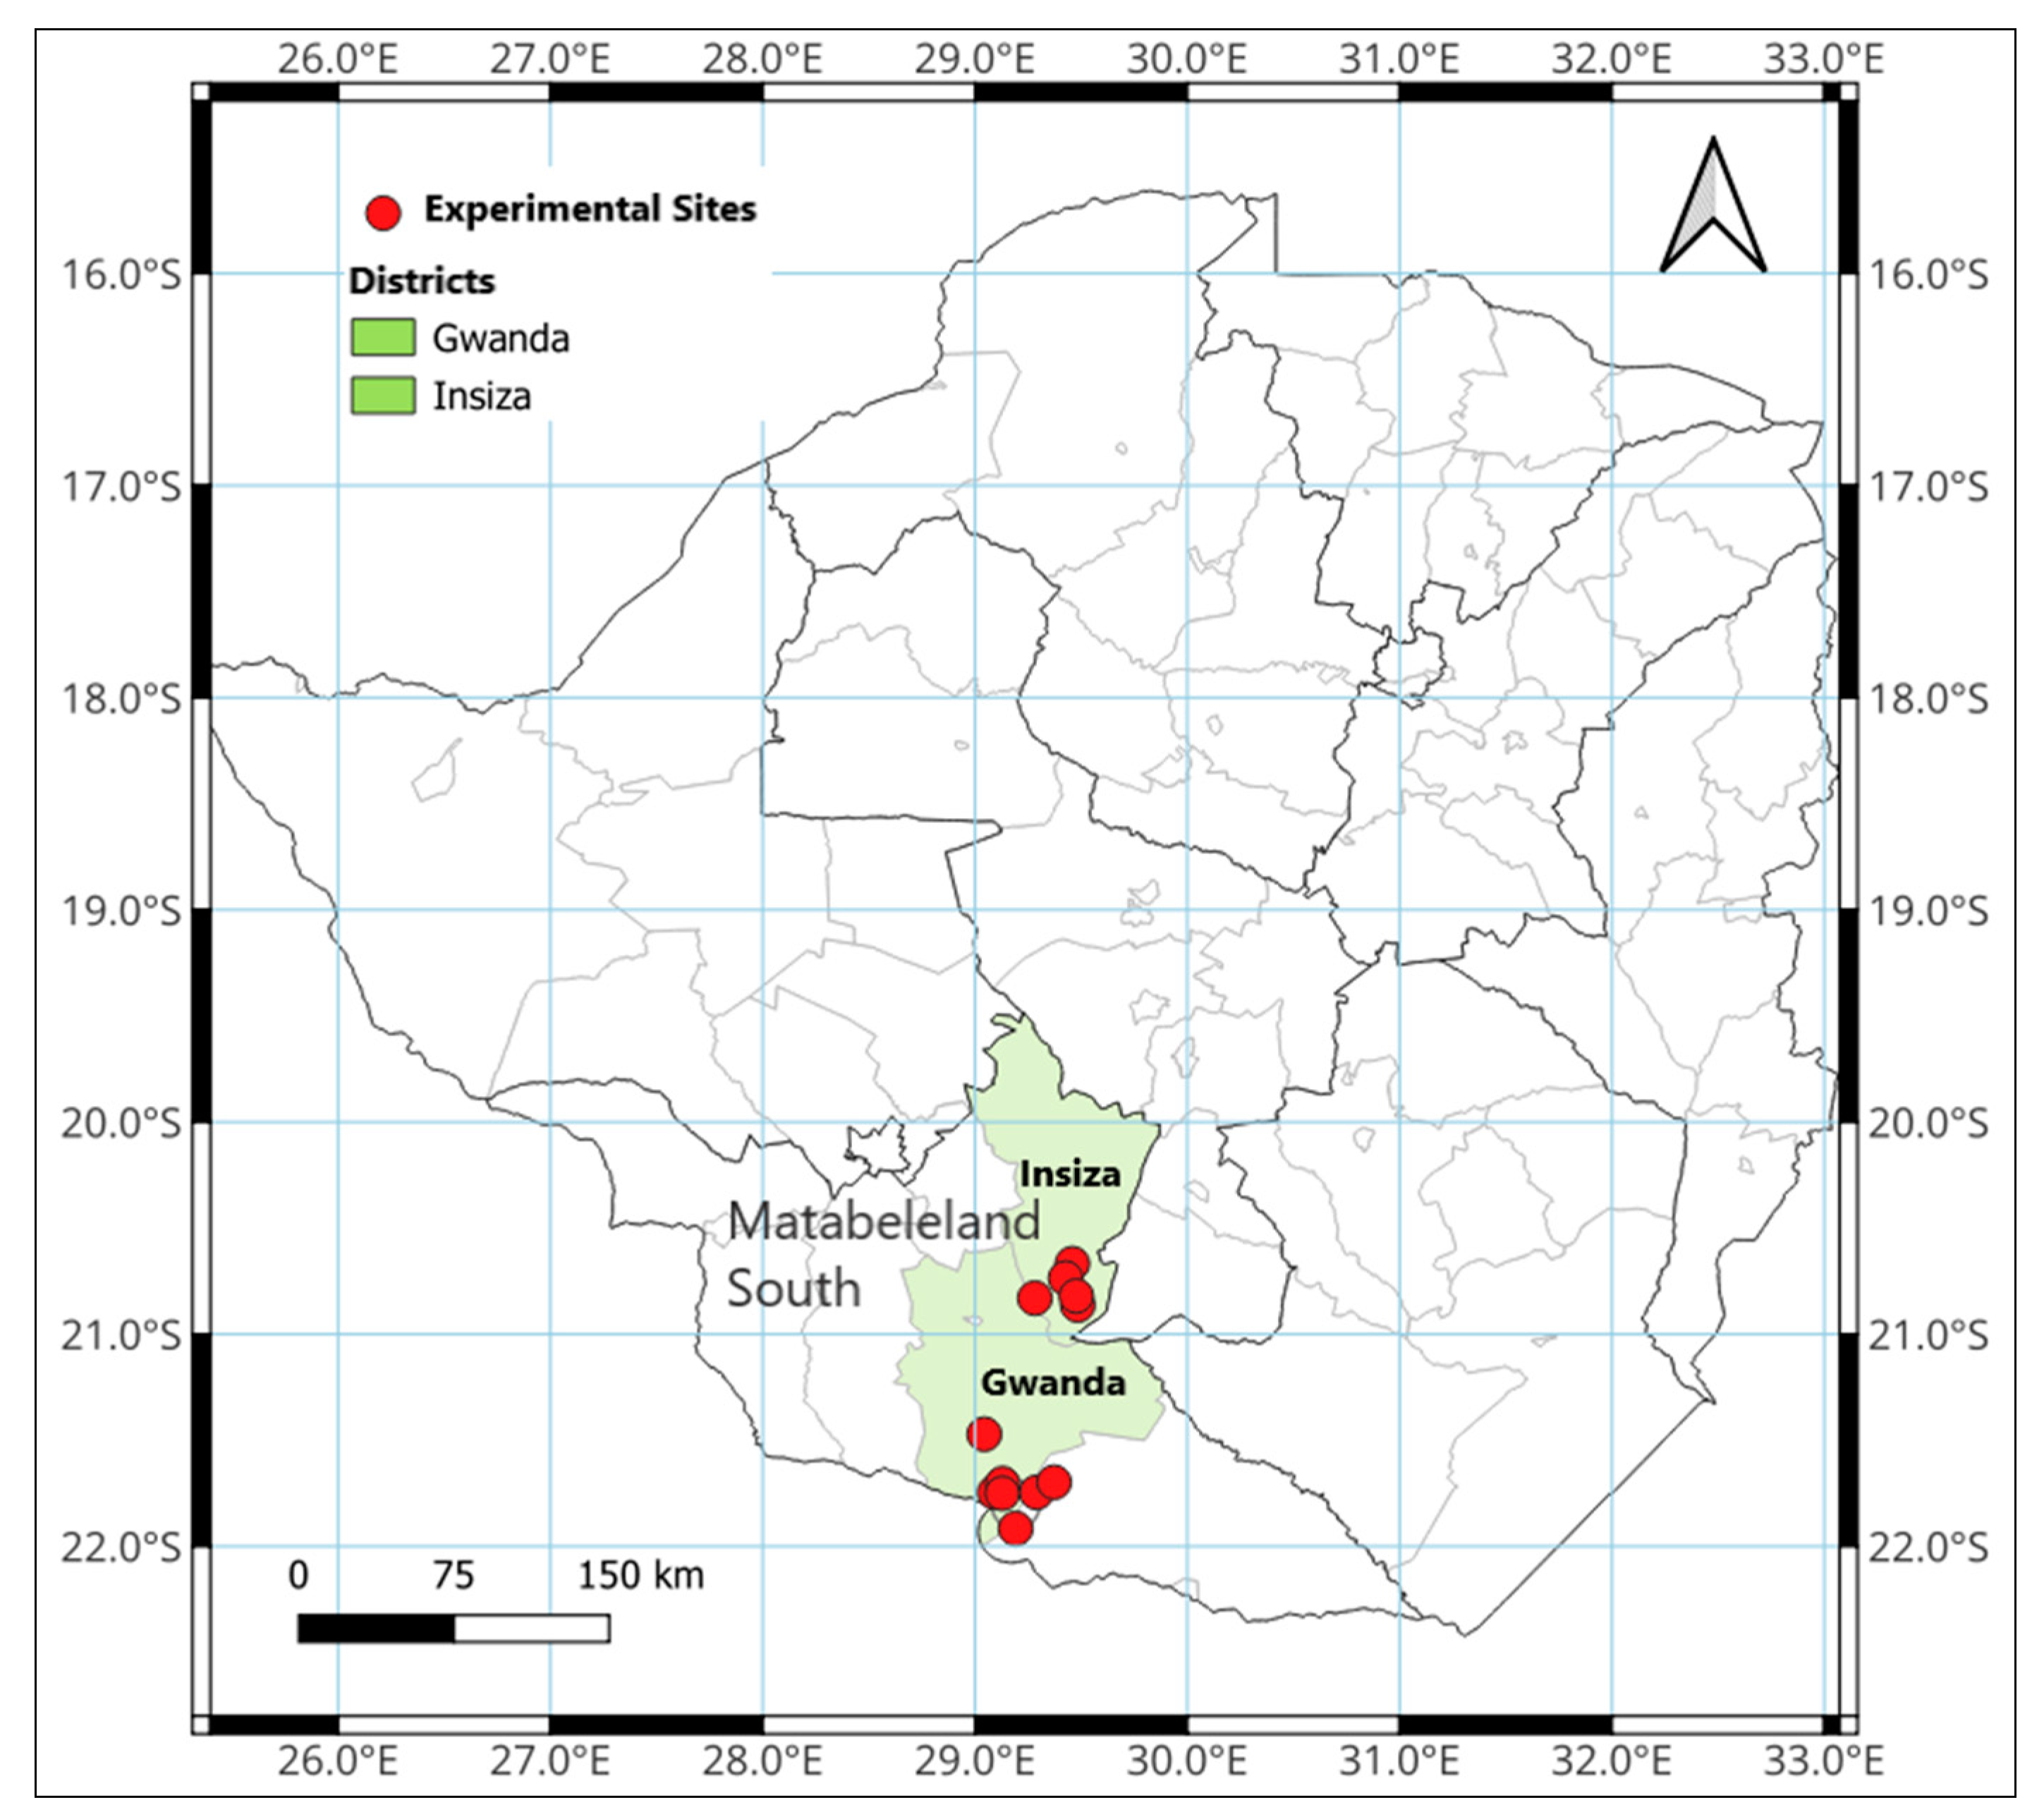
2.1. Description of Experimental Sites

The Insiza and Gwanda districts form part of the Mzingwane River catchment, which flows into the Limpopo River basin (Figure 1). The Insiza district is in the natural farming region (NR) 4, which is characterized by semi-arid climatic conditions with total annual rainfall ranging between 450 and 650 mm [33]. The Gwanda district lies in NR 5, which receives an annual rainfall of less than 450 mm. Growing season rainfall is unimodal, beginning in November and ending around March/April. Minimum and maximum temperatures average between 6 and 23 °C and 26 and 35 °C, respectively. The dominant soil types in both districts are coarse-grained sands to loamy sands, and clay loams to clay with minor occurrences of vertisols [34]. The soil types are classified as Eutric/Dystric Regosols and Chromic Luvisols (FAO/United Nations Educational, Scientific and Cultural Organization (UNESCO) classification), and as Ustalfic Haplargid and Lithic/Ustic Torriorthent (Soil Taxonomy system) [35]. The landform is almost flat to undulating pediplain with some local hills and rock outcrops.
Soil fertility varied between experimental sites depending on soil type and fertility amendments used by the different farmers (Table 1). Ten farms were selected for the research, and these farms were representative of the farming systems used in the two study districts. Smallholder farmers in the two districts use mineral fertilizer and livestock manure to improve soil fertility. The research fields were located on land with slopes of less than 2% at all farms [36,37].

2.2. Experimental Set-Up

Ten smallholder farms were selected for the experiment, and at each farm, four tillage treatments, namely planting basins (Basins), tine ripping (Ripper), single (CP), and double (DP) conventional ploughing, were established. Each farm had four experimental plots, and each tillage treatment was randomly assigned to a plot. Each tillage plot measured 30 m × 10 m, and the plots established in the 2006/07 season were maintained for use in the 2007/08 growing season. Planting basins were dug at 0.9 m × 0.6 m spacing using a hand hoe, and each basin measured 0.15 m (length) × 0.15 m (width) × 0.15 m (depth). Ripped furrows were opened at 0.9 m inter-row spacing using a ZimPlow ripper tine attached to the beam of an animal-drawn mouldboard plough. The inter-row spacing used in the basin and ripping treatments followed recommendations for semi-arid areas when maize is grown on smallholder farms [38]. The first conventional ploughing for the DP treatment was carried out in October each year. The second ploughing was performed at the same time as the CP treatment after receiving at least 20–30 mm of rainfall in November–December each year. In all experimental plots, crop residues were removed soon after harvesting and fed to livestock during the dry season as practiced by the farmers in the study communities.
Surface runoff was measured at four farms during the 2006/07 and 2007/08 growing seasons. Runoff plots measuring 10 m × 10 m were established in each tillage treatment (Supplementary Figure S1). Each farm had four runoff plots corresponding to the four tillage treatments. The boundaries of the runoff plots were constructed using a heat-resistant black polythene plastic that prevented water flow from other parts of the field onto the runoff plot. At the downslope side of each runoff plot, a triangular surface of dimensions 10 m × 1.7 m was used to receive runoff water from the plot and lead it into a 200 L drum through a polythene plastic gutter. Within each runoff plot, maize was planted at 0.9 m × 0.3 m, which is the recommended spacing for semi-arid environments, giving a plant population of 37,000 plants ha−1.

2.3. Data Collection and Calculation of Surface Water Retention and Curve Numbers

2.3.1. Daily Rainfall Measurements

Each farmer was given an ordinary plastic rain gauge for recording daily rainfall during the growing season (Supplementary Photograph S1). Trial host farmers were trained on how to record rainfall using the plastic gauges, and rainfall received over a 24 h period was recorded each morning at 8.00 as per standard procedure in Zimbabwe.

2.3.2. Runoff Generated from tillage Treatments

Runoff water collected from each tillage treatment plot was measured soon after each runoff-generating rainfall event. The height of water in the drum was measured by a staff gauge graduated from 0 to 1.5 m. The drums were emptied after each rainfall event. Runoff water depth from each treatment was calculated by subtracting the volume of water contributed by the 10 m × 1.7 m triangular receiving surface from the total water volume measured in the drum. The runoff depth, expressed in millimeters, was calculated by dividing the total runoff water volume (m3) collected in the tank by the plot area (m2).

2.3.3. Calculation of Surface Retention and Curve Numbers

Curve numbers were calculated using the Soil Conservation Service (SCS) method, now known as the Natural Resources Conservation Service (NRCS) method. The SCS CN method describes the relationship between rainfall received and the resultant surface runoff generated by the rainfall event [17] as:
  Q = ( P 0.2 S ) / ( 2 P + 0.8 S )
where Q = runoff depth (mm), P = rainfall depth (mm), and S = maximum retention storage (mm) after runoff begins. The method assumes that the initial abstraction = 0.2S. When rainfall and runoff data are available, S can be calculated using the following equation [39]:
  S = 5 P + 2 Q 4 Q 2 + 5 P Q
The maximum S value on the soil surface is related to the CN value by the following equation:
  C N = 25,400 / ( 254 + S )
The CN value is a dimensionless index and has values that range from 0 (no runoff generated) to 100 (all rainfall becomes runoff). CN = 100 represents a lower boundary of the potential retention storage, and CN = 0 denotes an upper boundary of the potential retention storage.

2.4. Statistical Analyses

The General Linear Model (GLM) was used to determine whether the means of tillage methods and soil type, which were used as covariates differed in runoff (mm) generated, surface water retention, and generated CNs. The GLM equation is given by the following formula:
y i = θ + β j x j + β k x k + β j k + ε
where
  • θ is the intercept;
  • y i is the dependent variable, and i = surface water retention, runoff, and CNs;
  • β j   a n d   β k are the weights of the independent variables tillage method and soil type, respectively, j represents the tillage method levels (CP, DP, Ripper, and Basins), whilst k represents soil type levels (loamy sand and sand);
  • β j k is the combined (interaction) weight contribution of the jth level of tillage method and the kth level of soil type;
  • x j   a n d   x k are the independent variables tillage method and soil type, respectively at different levels as specified above;
  • ε is the regression error term.
The GLM is an analysis of variance (ANOVA) procedure, in which the calculations were performed using a least squares regression approach to describe the statistical relationship between covariates (tillage methods and soil type) and continuous response variables runoff (mm), surface water retention (S), and curve numbers (CN). ANOVA was used to test whether the tillage treatments and soil type means differ from each other, and the results were presented using boxplots. The Tukey test was used to test an experimental hypothesis that the effect of tillage treatments and soil types on runoff, surface water retention, and CNs was not significantly different.
The Pearson’s correlation (r), calculated as r = ( x i x ) ¯ ( y i y ) ¯ ( x i x ) ¯ 2 ( y i y ) ¯ 2 , was presented graphically using scatter plots indicating the r, p-values, and regression equations.

3. Results and Discussion

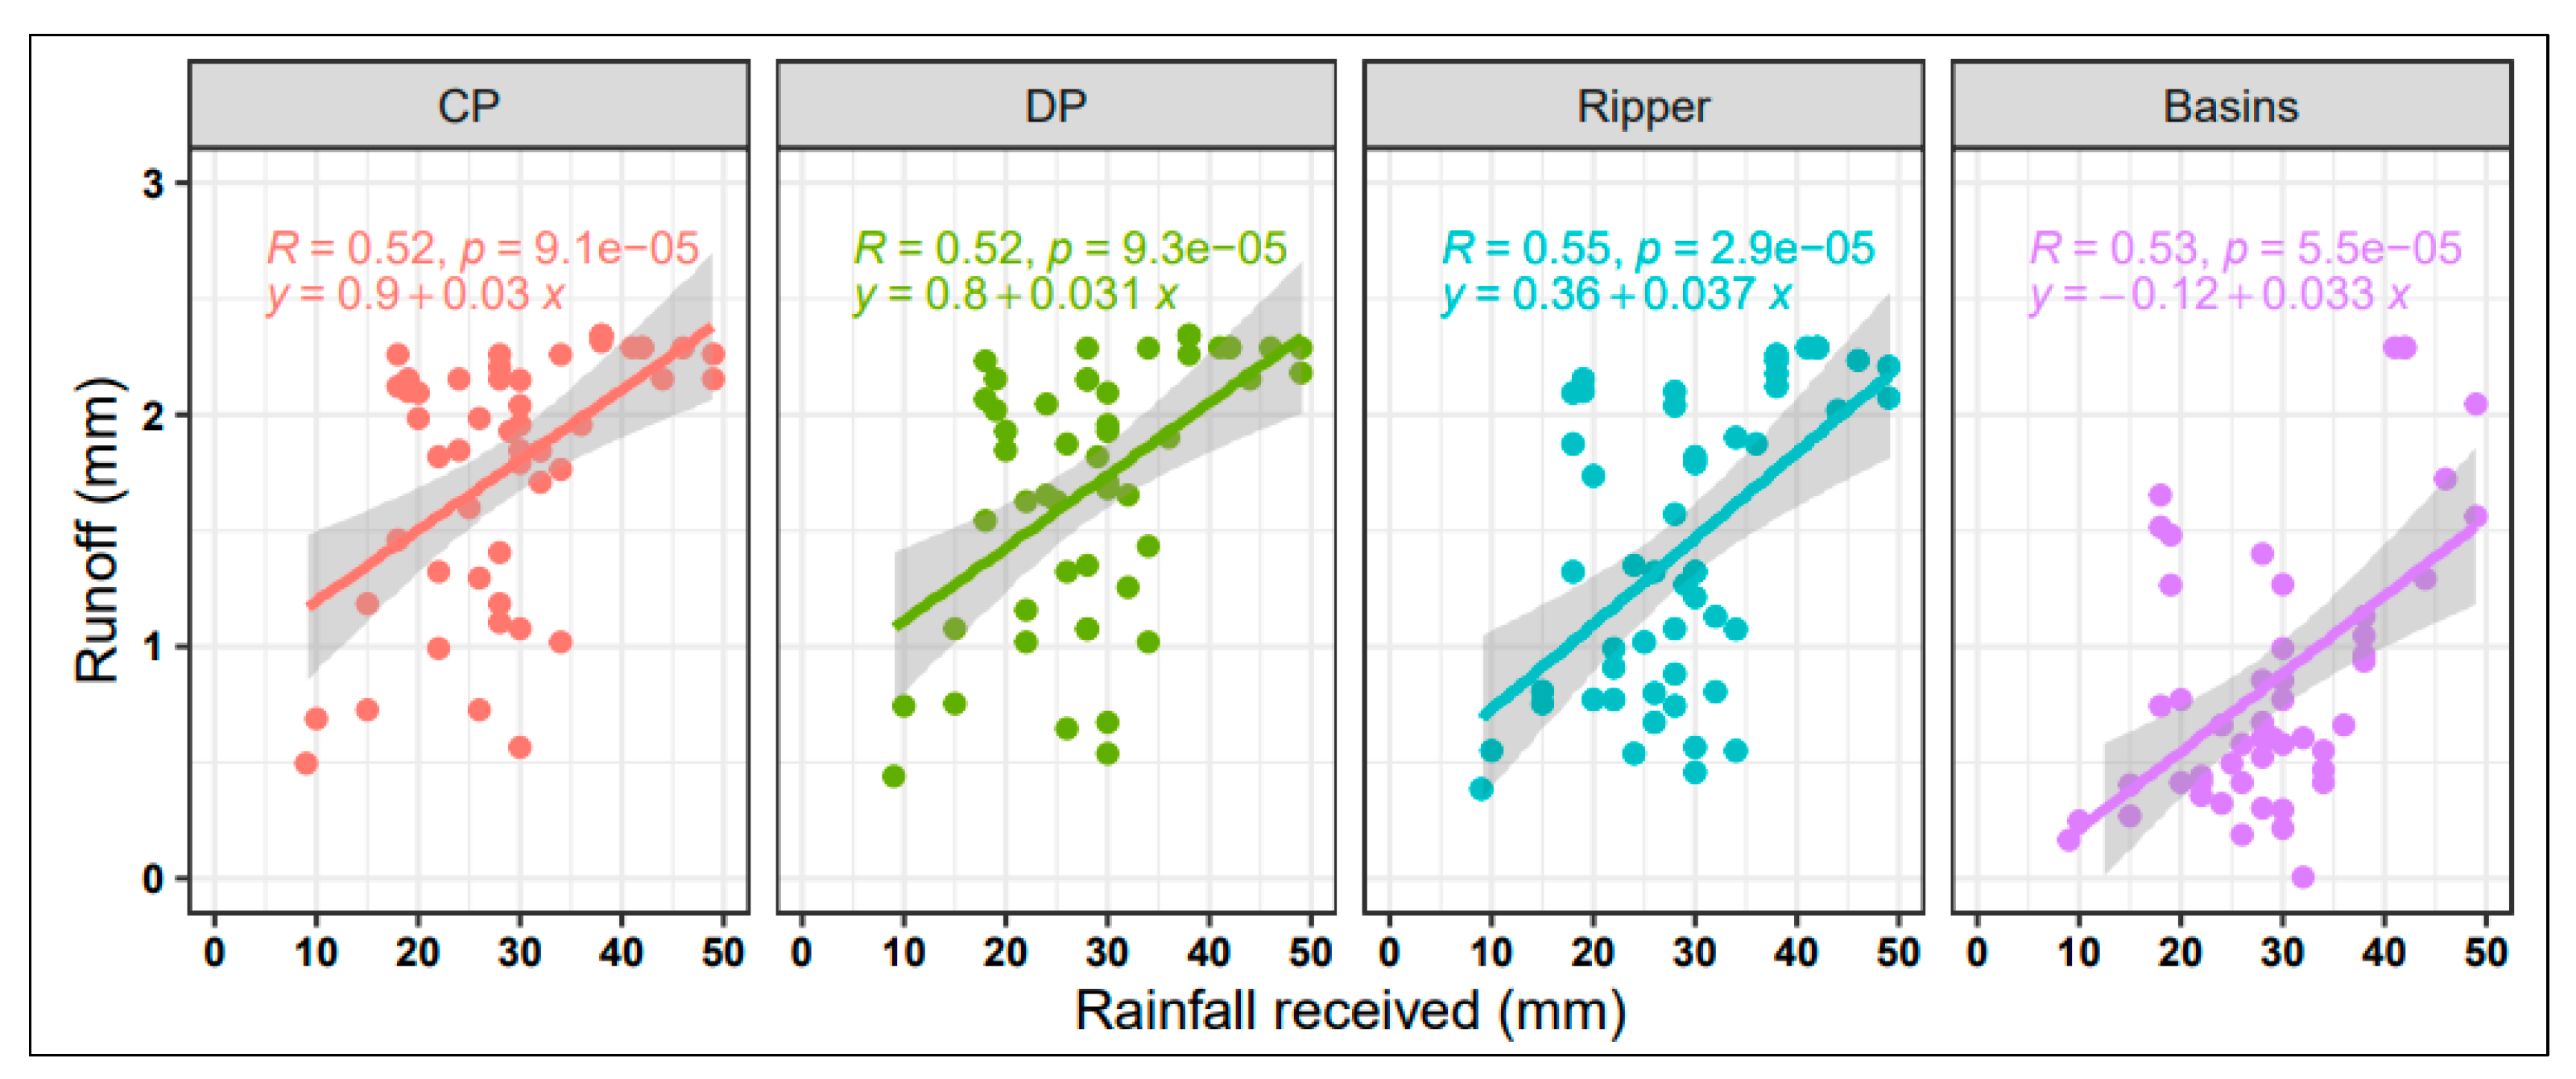
3.1. Runoff Generating Rainfall Recorded at Experimental Sites

Rainfall amounts that generated runoff from the four tillage treatments ranged from 9 mm to 76 mm across the experimental sites (Figure 2). The 53 rainfall events recorded during the growing season generated surface runoff in all four tillage treatments (Supplementary Figure S2). There was no soil cover through mulching in all treatments, hence once rainfall intensity was higher than infiltration rate, overland flow was generated on the bare soil in the four tillage systems. Furthermore, the bareness of the soil surface was promoted by a lack of weed cover because the experimental plots were kept weed free. The light-textured soils at experimental sites have low water-holding capacity, and once saturation occurred in the top soil, overland flow was generated. The rainfall amount that frequently generated runoff in all tillage treatments was 30 mm and it occurred seven times during the experimental period. The 9 mm rainfall event generated runoff in all four tillage treatments at an experimental site with sandy soil. The rainfall event occurred five days after 52 mm of rain had been accumulated over two days, hence the sandy soil could have been moist by the time the 9 mm was received. Results from [12] showed that soil water was similar and near field capacity in the tillage treatments at the experimental sites. A study by [36] in the same Zhulube Catchment revealed that daily rainfall events of up to 10 mm could generate surface runoff on smallholder farms. The average rainfall amount that generated runoff was 30 mm and the same rainfall amount occurred more frequently over the period of experimentation. A 76 mm rainfall event occurred 15 days after a 17 mm amount had been received and soil was dry at the experimental sites. Despite the soil being dry, 76 mm of rainfall generated a large runoff from all treatments and this can be attributed to the soil being saturated during the rainfall event, as illustrated by soil water results from [12]. Rainfall intensity was higher than the infiltration rate of rainwater into the soil during the rainfall event.

3.2. Runoff Generated in the Four Tillage Treatments

Tillage effects on runoff generation were significant (p < 0.001), and the planting basin treatment had the lowest runoff amount recorded (Figure 3). The grid of 0.9 m × 0.6 m spaced planting basins created a higher surface roughness than the other tillage treatments, and this facilitated more rainwater harvesting and infiltration, hence the reduced runoff generation recorded. The surface roughness created by the basin grid increased surface water storage potential, a result consistent with rainfall simulation experiments by [40]. Using the Tukey test to unravel the tillage effects on runoff amount generated, results showed that runoff amounts in CP and DP, and DP and ripper treatments were similar (Table 2, Figure 3 and Figure 4). Runoff from CP was significantly (p < 0.05) higher than that from the ripper treatment (Figure 3; Table 2). The confidence intervals for DP-CP and Ripper-DP cross the zero line, and this indicates that the runoff amounts from these two tillage treatments are not significantly different (Figure 4).
Previous studies showed that conventional ploughing temporarily increased the porosity and infiltration capacity of the surface soil layer [41,42,43]. However, these soil properties are quickly lost after a few rainfall events as the rainy season progresses. As the season progresses, soil porosity decreases, resulting in more runoff generation from conventionally ploughed treatments [12,44]. In the ripper treatment, furrows created by ripping were filled with soil as the season progressed, which resulted in reduced rainwater harvesting and hence increased runoff generation. In addition, soils in south-western Zimbabwe form surface crusts [45], which could have promoted high runoff generation, particularly in the conventionally ploughed treatments. The heavy rainfall events recorded during experimentation [12] could have promoted soil surface sealing and crusting, which in turn increased runoff generation from conventionally ploughed and ripper treatments. Wang et al. [46] found that soil crust formation reduced infiltration rates and cumulative infiltration in a Loess Plateau Soil. In this study, runoff generation increased with an increase in the amount of rainfall recorded in each event in all tillage treatments (Figure 5).
As for the proportion of average runoff-generating rainfall amounts recorded during experimentation, the runoff was 6% in CP and DP, 5% in ripper, and 3% for the planting basin treatments. It was reported that storms in excess of 50 mm of precipitation volume produced about 40% of the runoff in a 20-year period in Texas, United States, even though the storms were about 10% of the precipitation events [47,48]. The amount of runoff generated from cropping systems, however, varies with the slope of the land, soil type, soil cover, and rainfall intensity [36]. Du Plessis and Mostert [49] reported runoff amounting to 15% of annual rainfall from conventionally ploughed maize cropping systems on a loamy fine sandy soil at a 5% land slope in South Africa. The difference in our results may be attributed to the soil texture and land slope variations of the experimental sites. In addition, differences in results might also be because our study used event rainfall amounts, contrary to [49] who used annual rainfall. As a proportion of seasonal rainfall runoff from our study was less than the figures expressed from event rainfall amounts. However, runoff results from this study are consistent with the findings of [50], who noted 1–7% of annual rainfall in tilled soil.

3.3. Soil Texture Effect on Runoff Generation

Runoff generation was higher in loamy sand than in sandy soil in the CP and DP tillage treatments (Figure 6). The heavy rainfall events recorded at experimental sites could have promoted more surface sealing of the soil in loamy sand, which has more silt content. The sealing of soil pores in the surface layer slows the infiltration of rainwater, and this in turn promotes the generation of more overland flow in loamy sand than sandy soil. On the contrary, runoff was higher in sandy soil than in loamy sand in the planting basin treatment. Loamy sand had 12%, 11%, and 7% more runoff than the sandy soil under CP, DP, and Ripper, across sites, respectively. In the planting basin treatment, sandy soil had 3.4% more runoff than loamy sand across sites. Runoff generation at any given slope of land varies with soil texture [51]. Jourgholami and Labelle’s [51] study showed that clayey soil generated more runoff (1.49 mm) than loam soil (1.03 mm) at the same slope and plot size. The runoff amount increased with an increase in rainfall amount regardless of the soil texture (Figure 7). The results in Figure 6 are consistent with the findings of [51], where more surface runoff was generated in clayey than light-textured soil in the conventionally ploughed treatments. However, the runoff was similar in loamy sand and sandy soils in the minimum tillage treatments. This can be attributed to better infiltration in minimum-tillage systems arising from improved soil structure, which occurs through increased porosity and reduced bulk density [9,52].

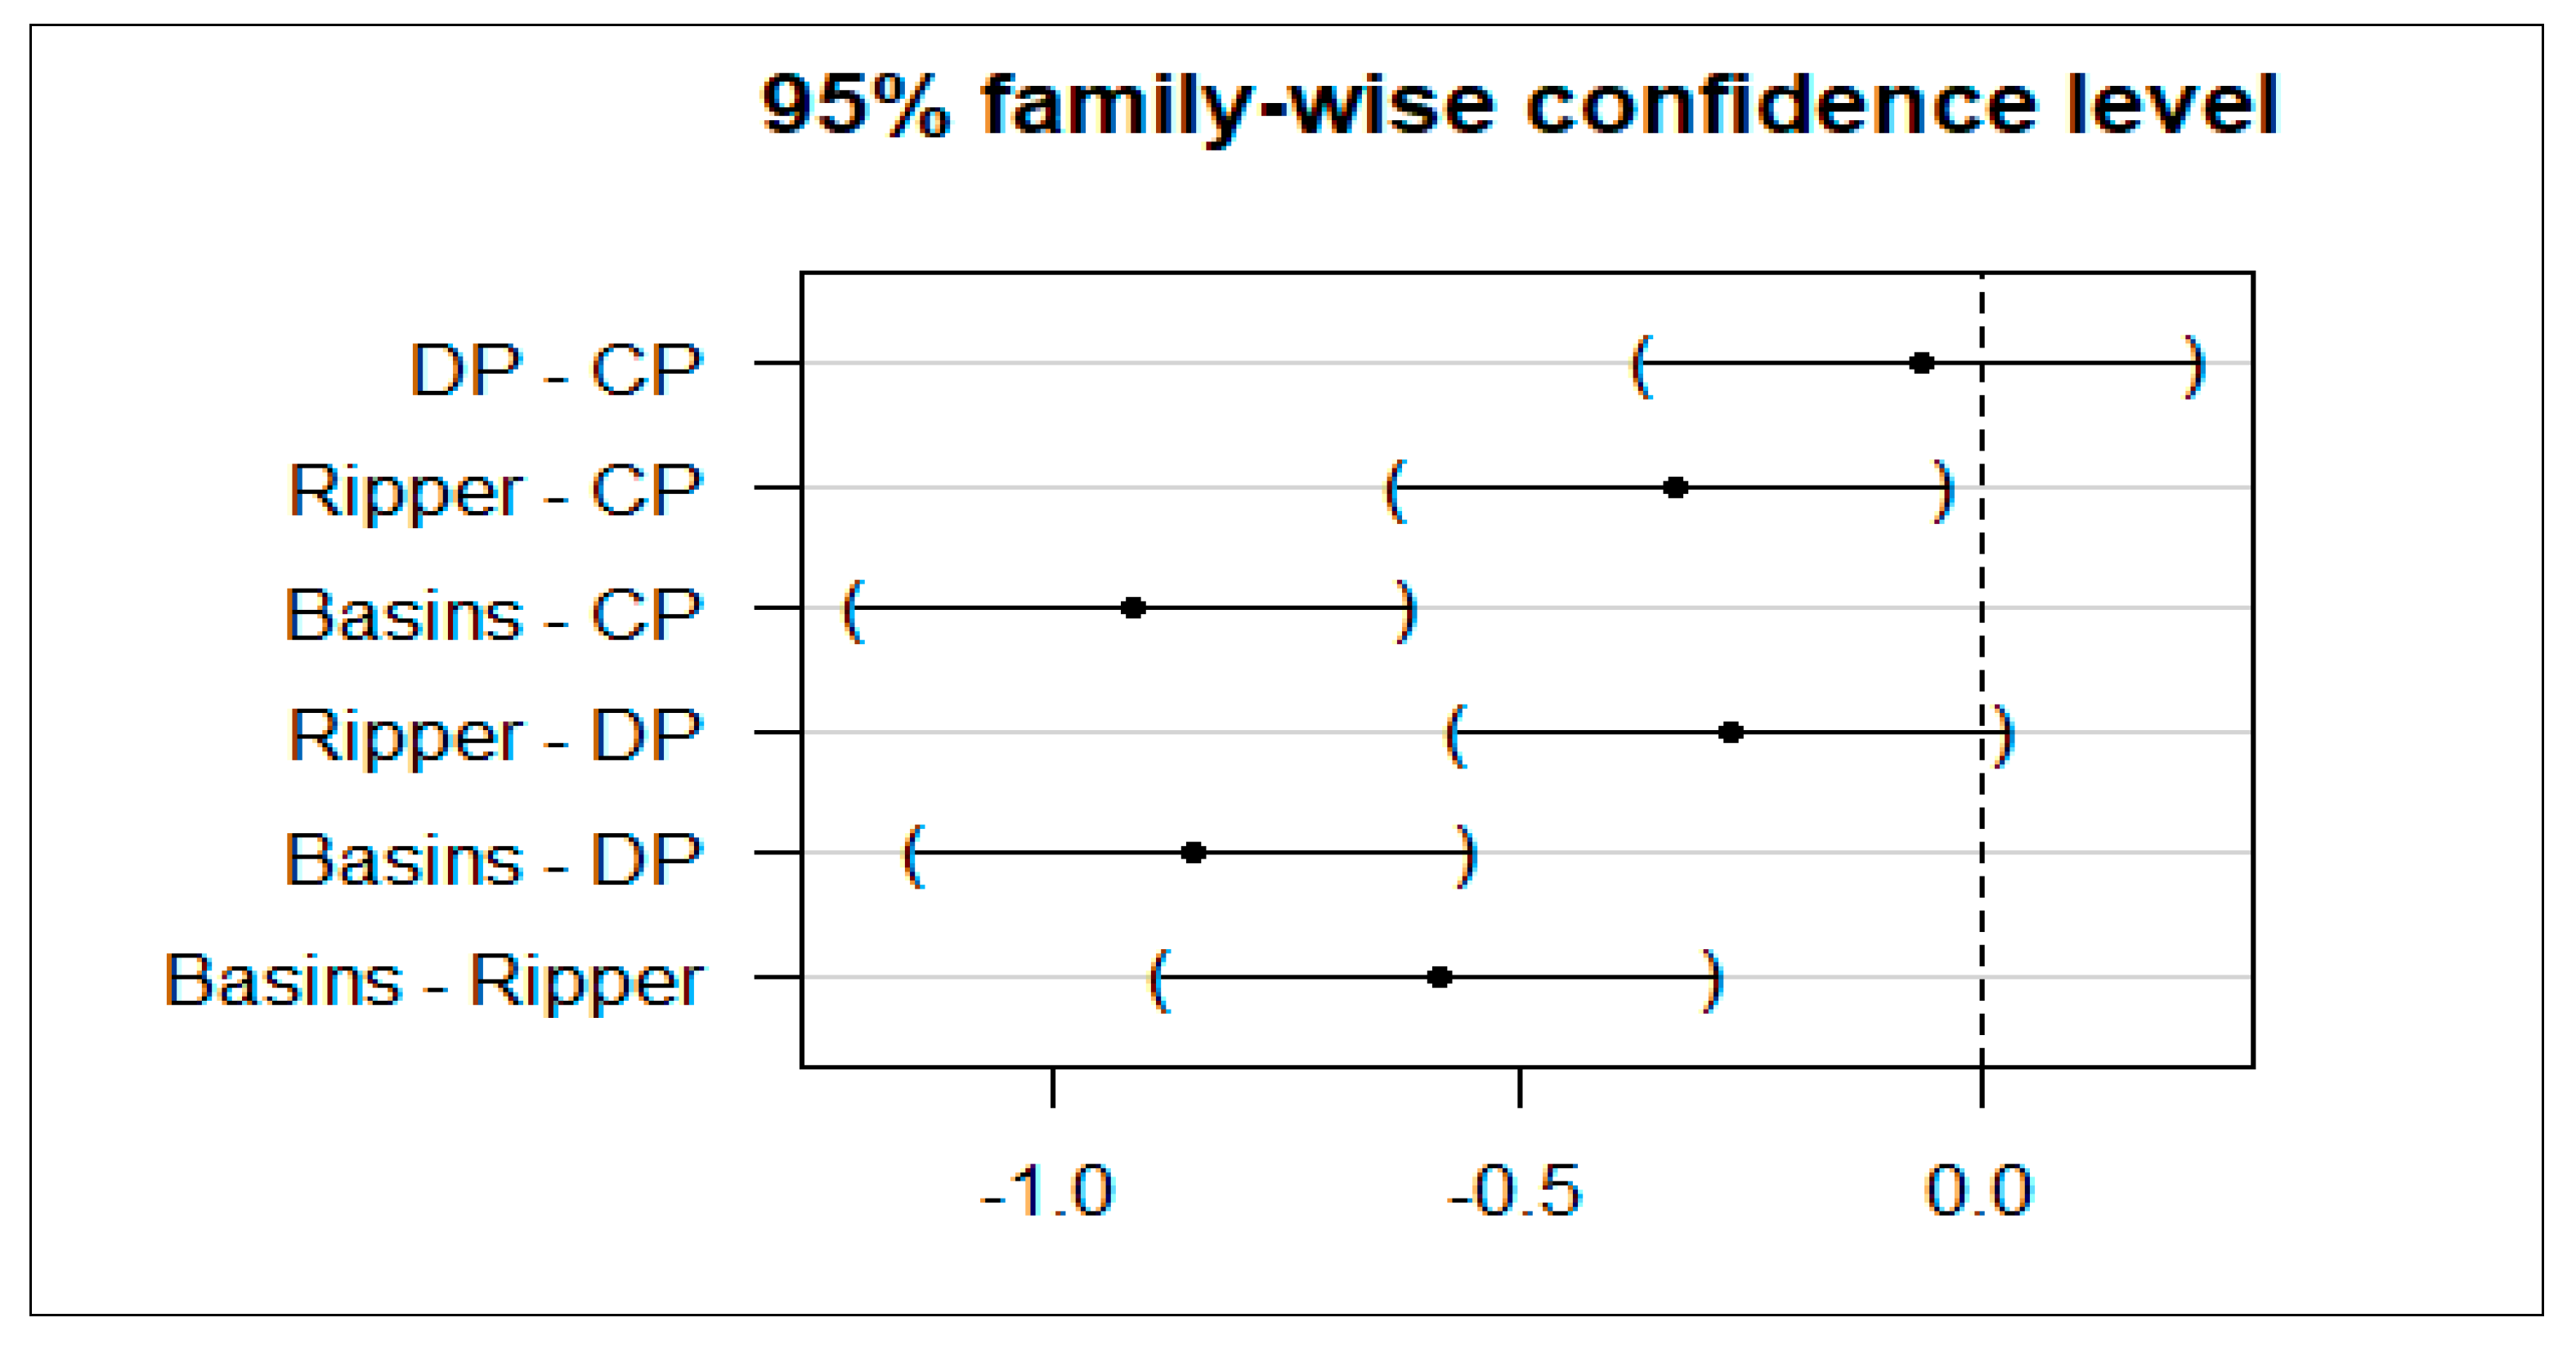
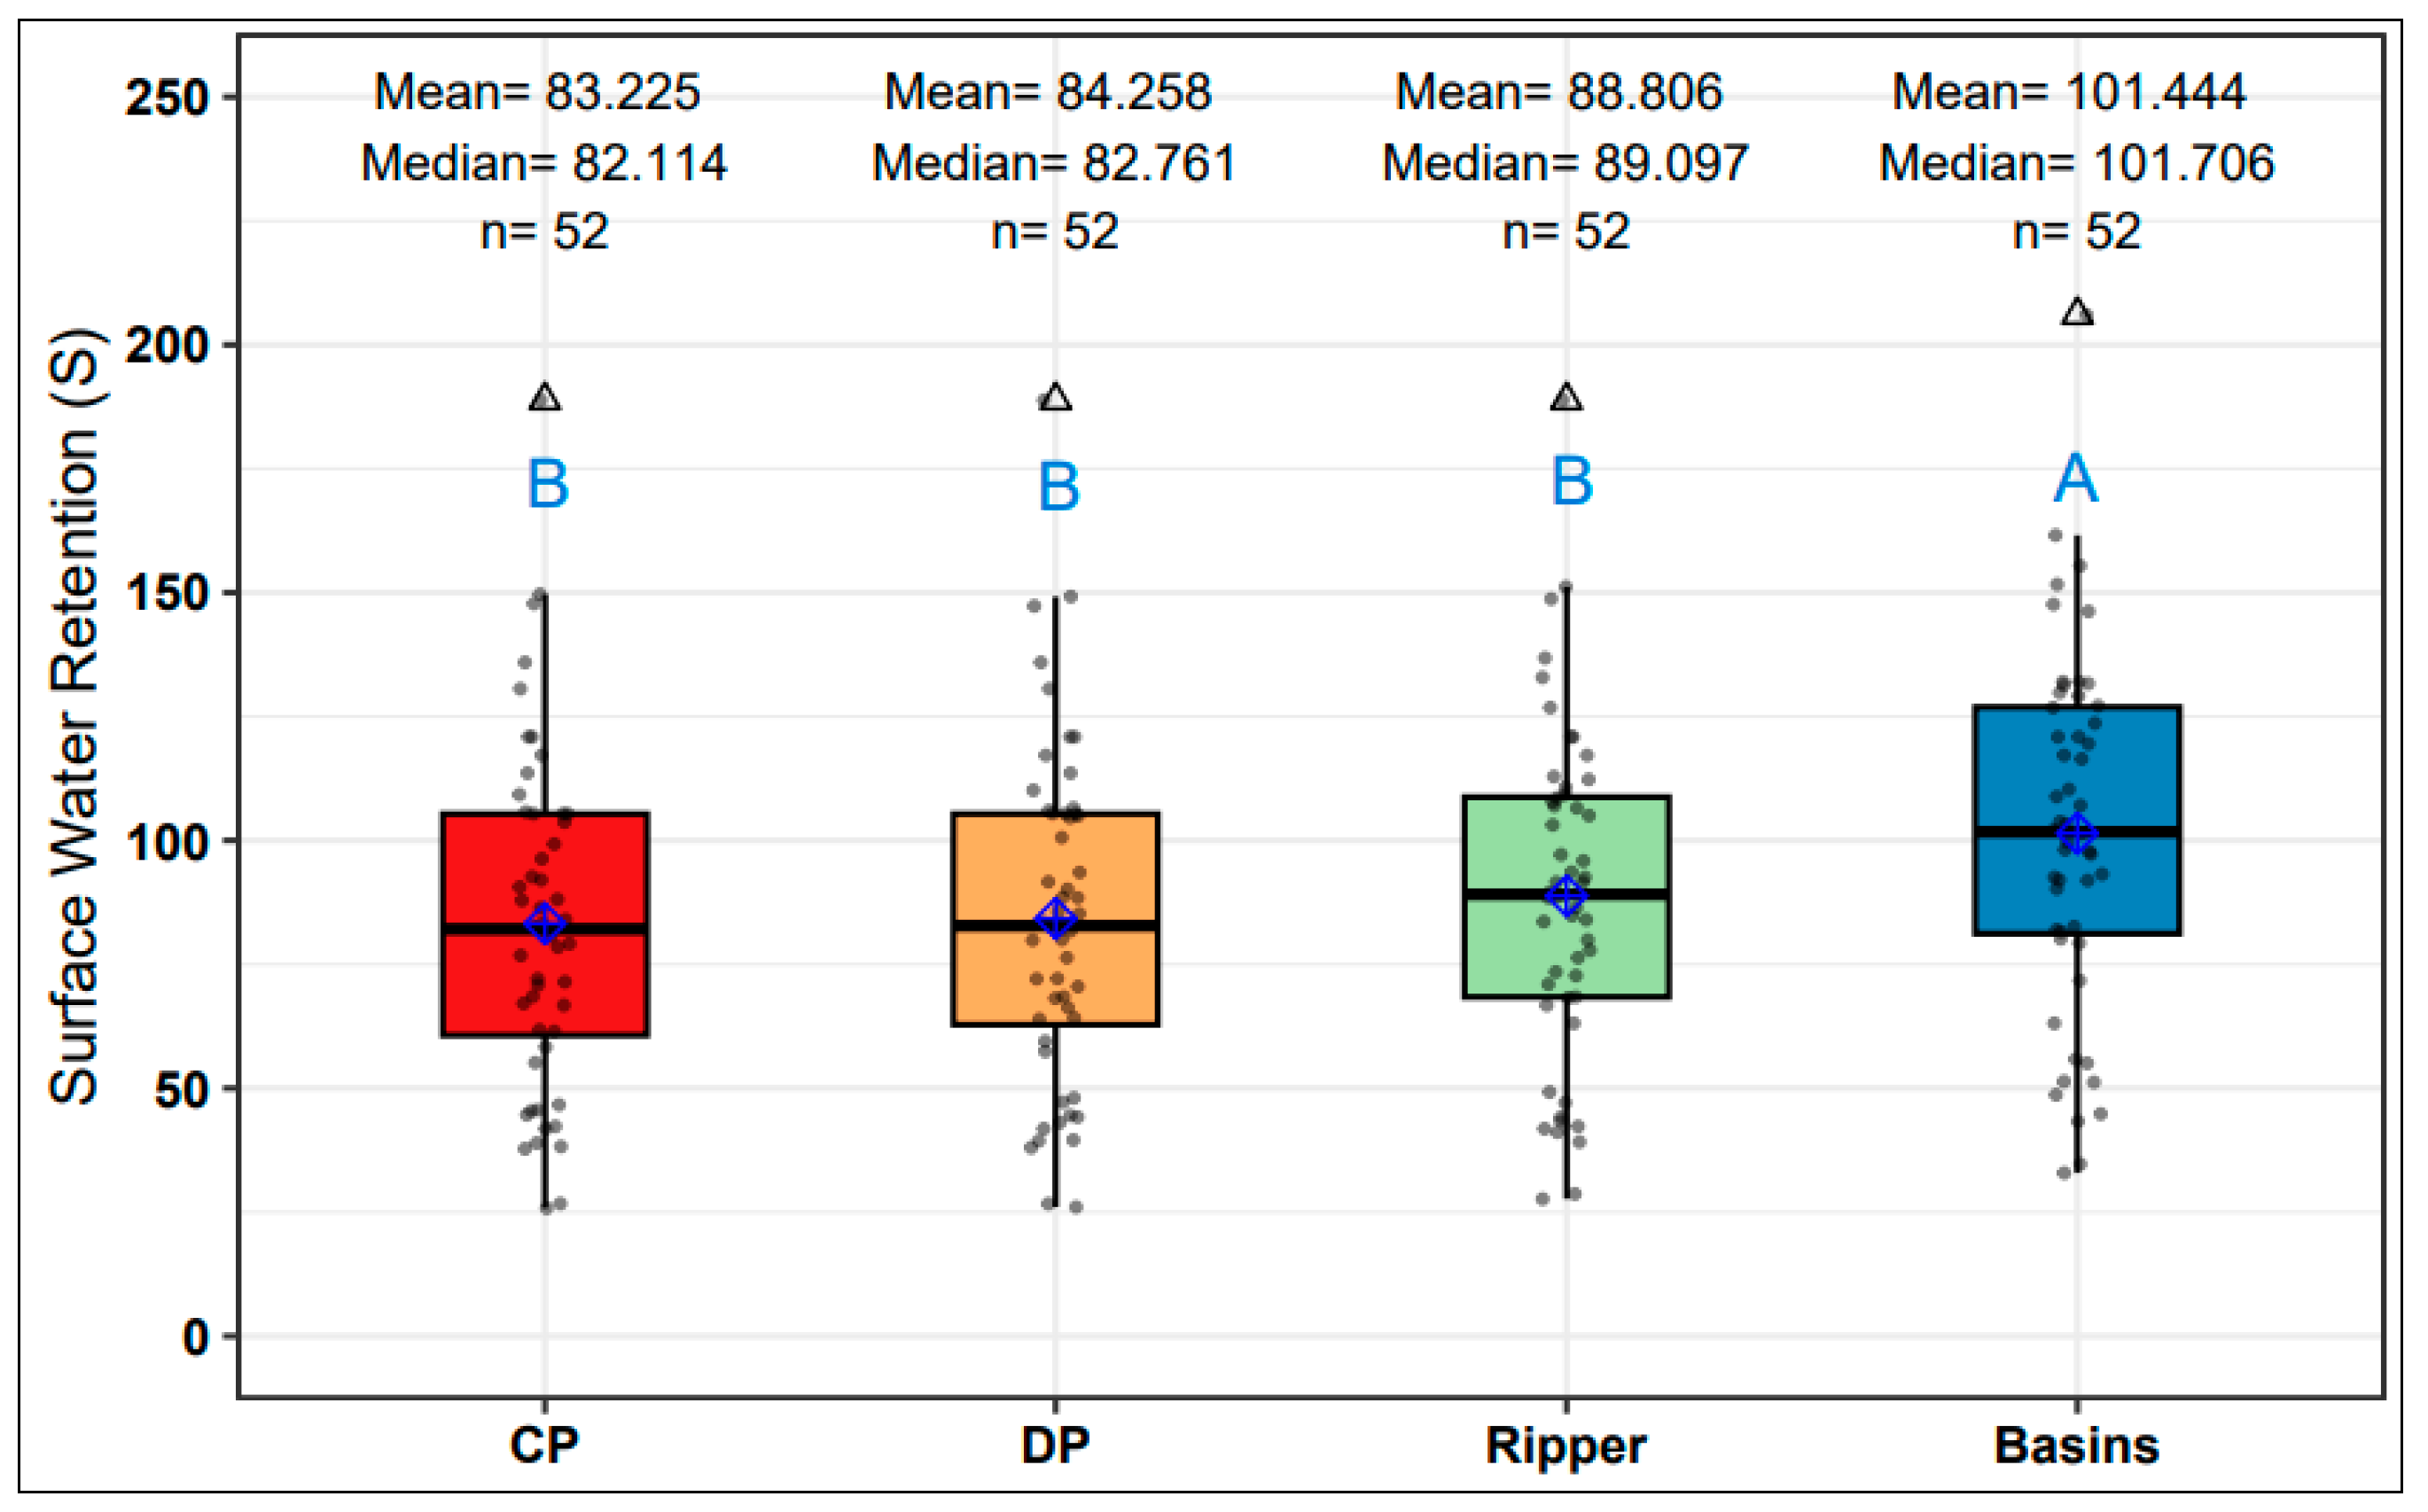
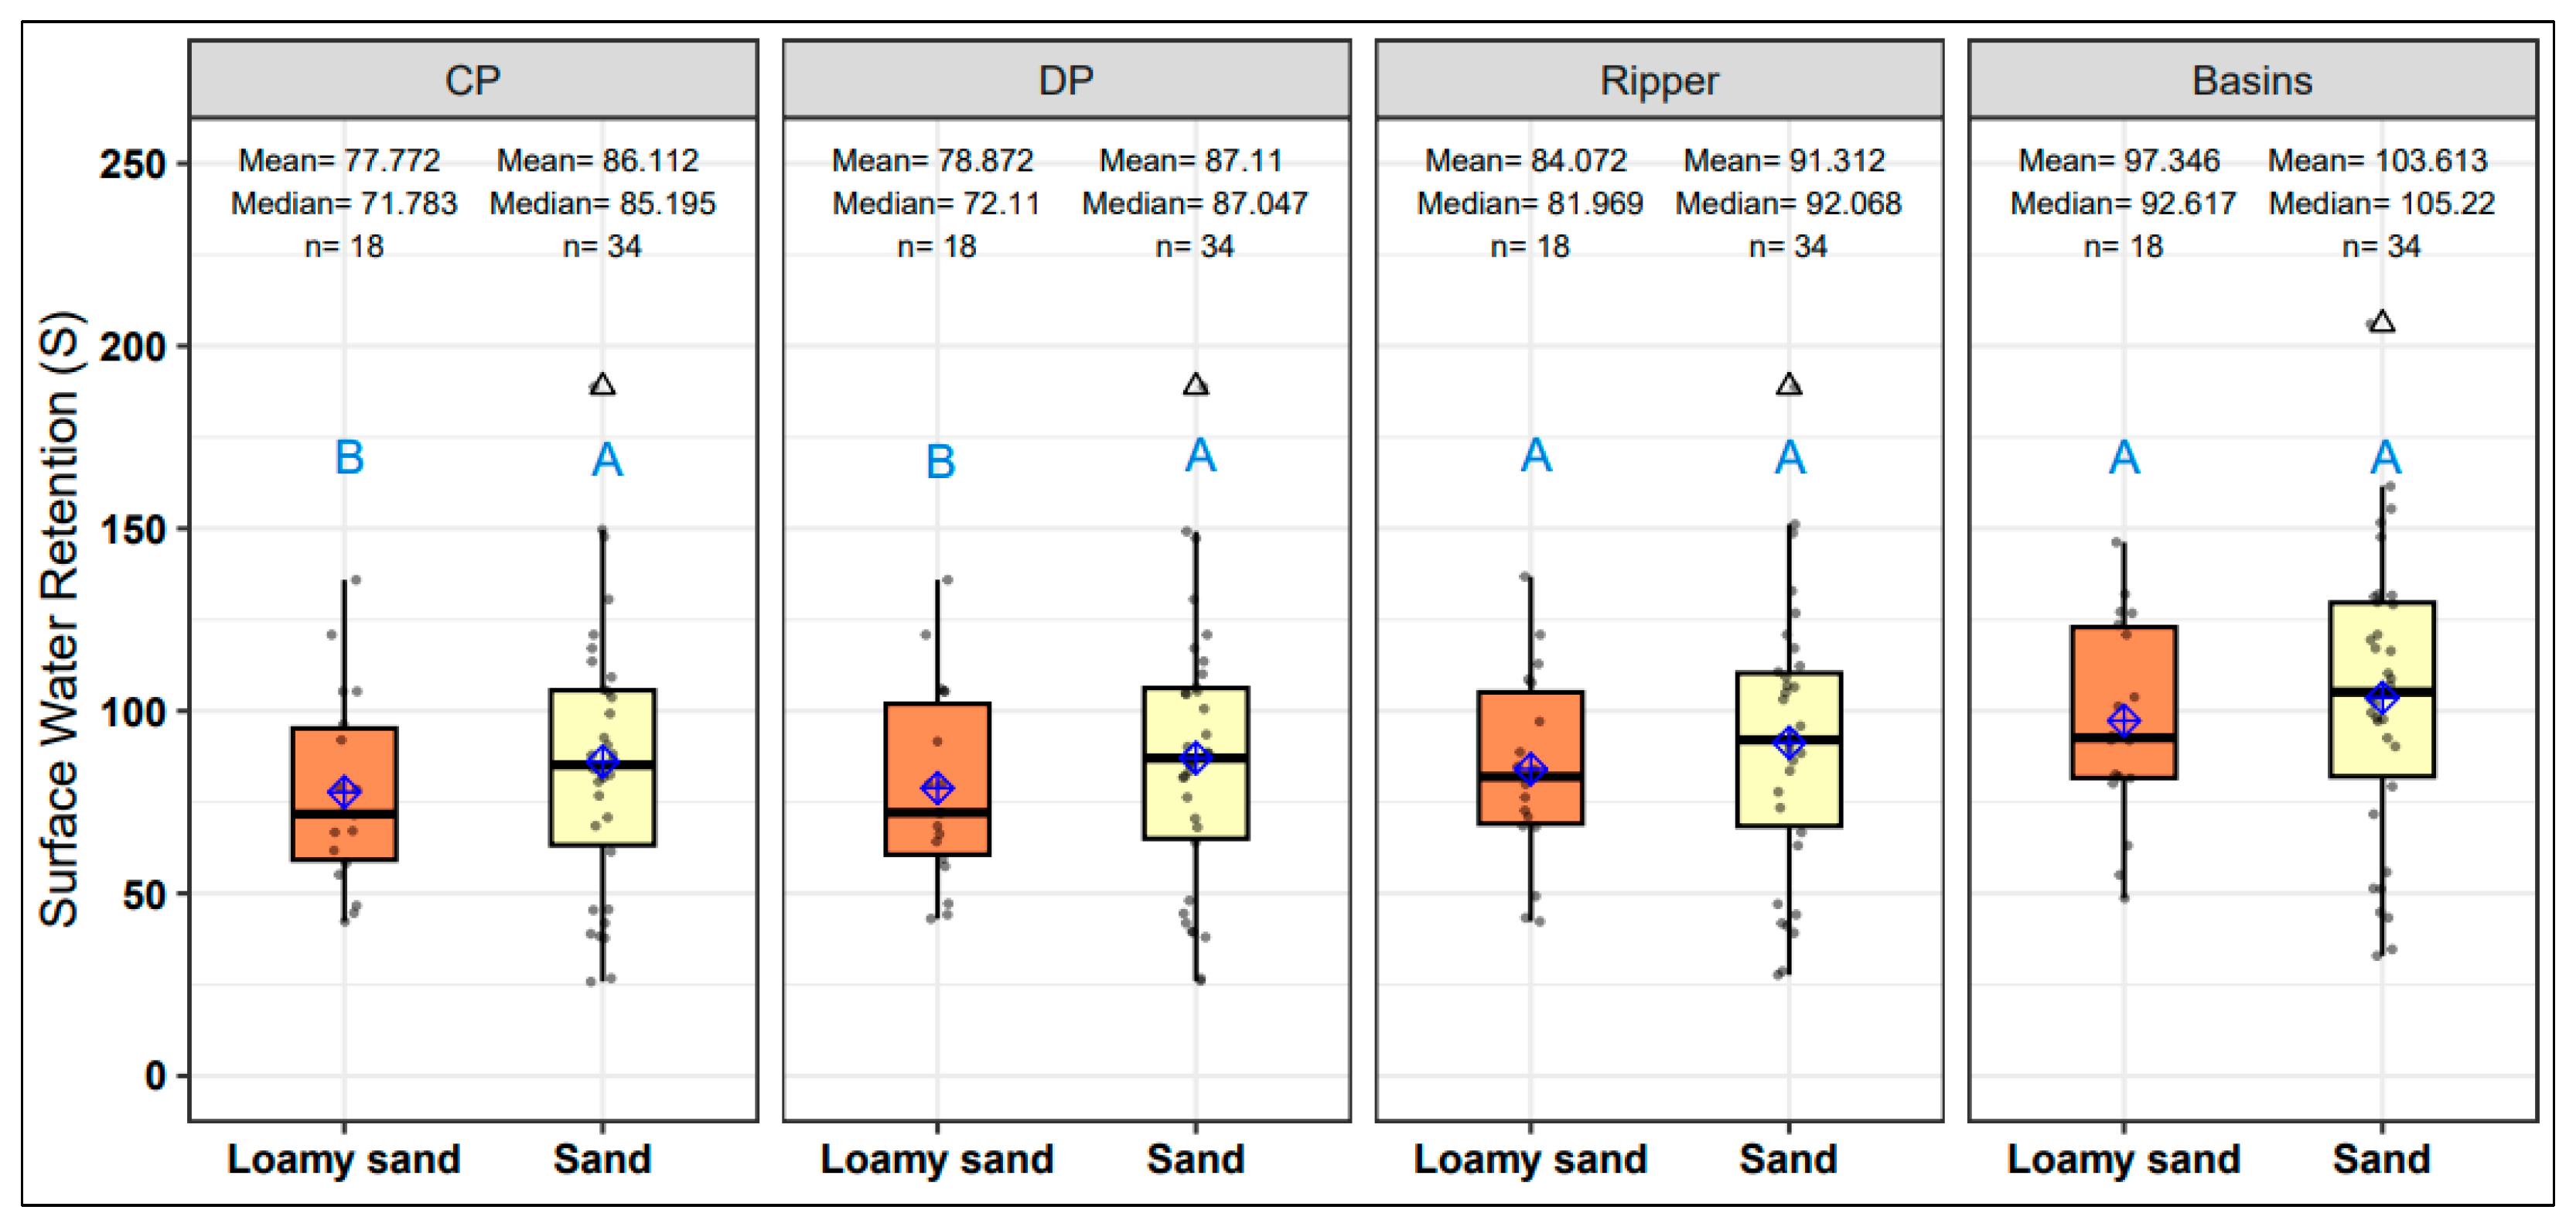
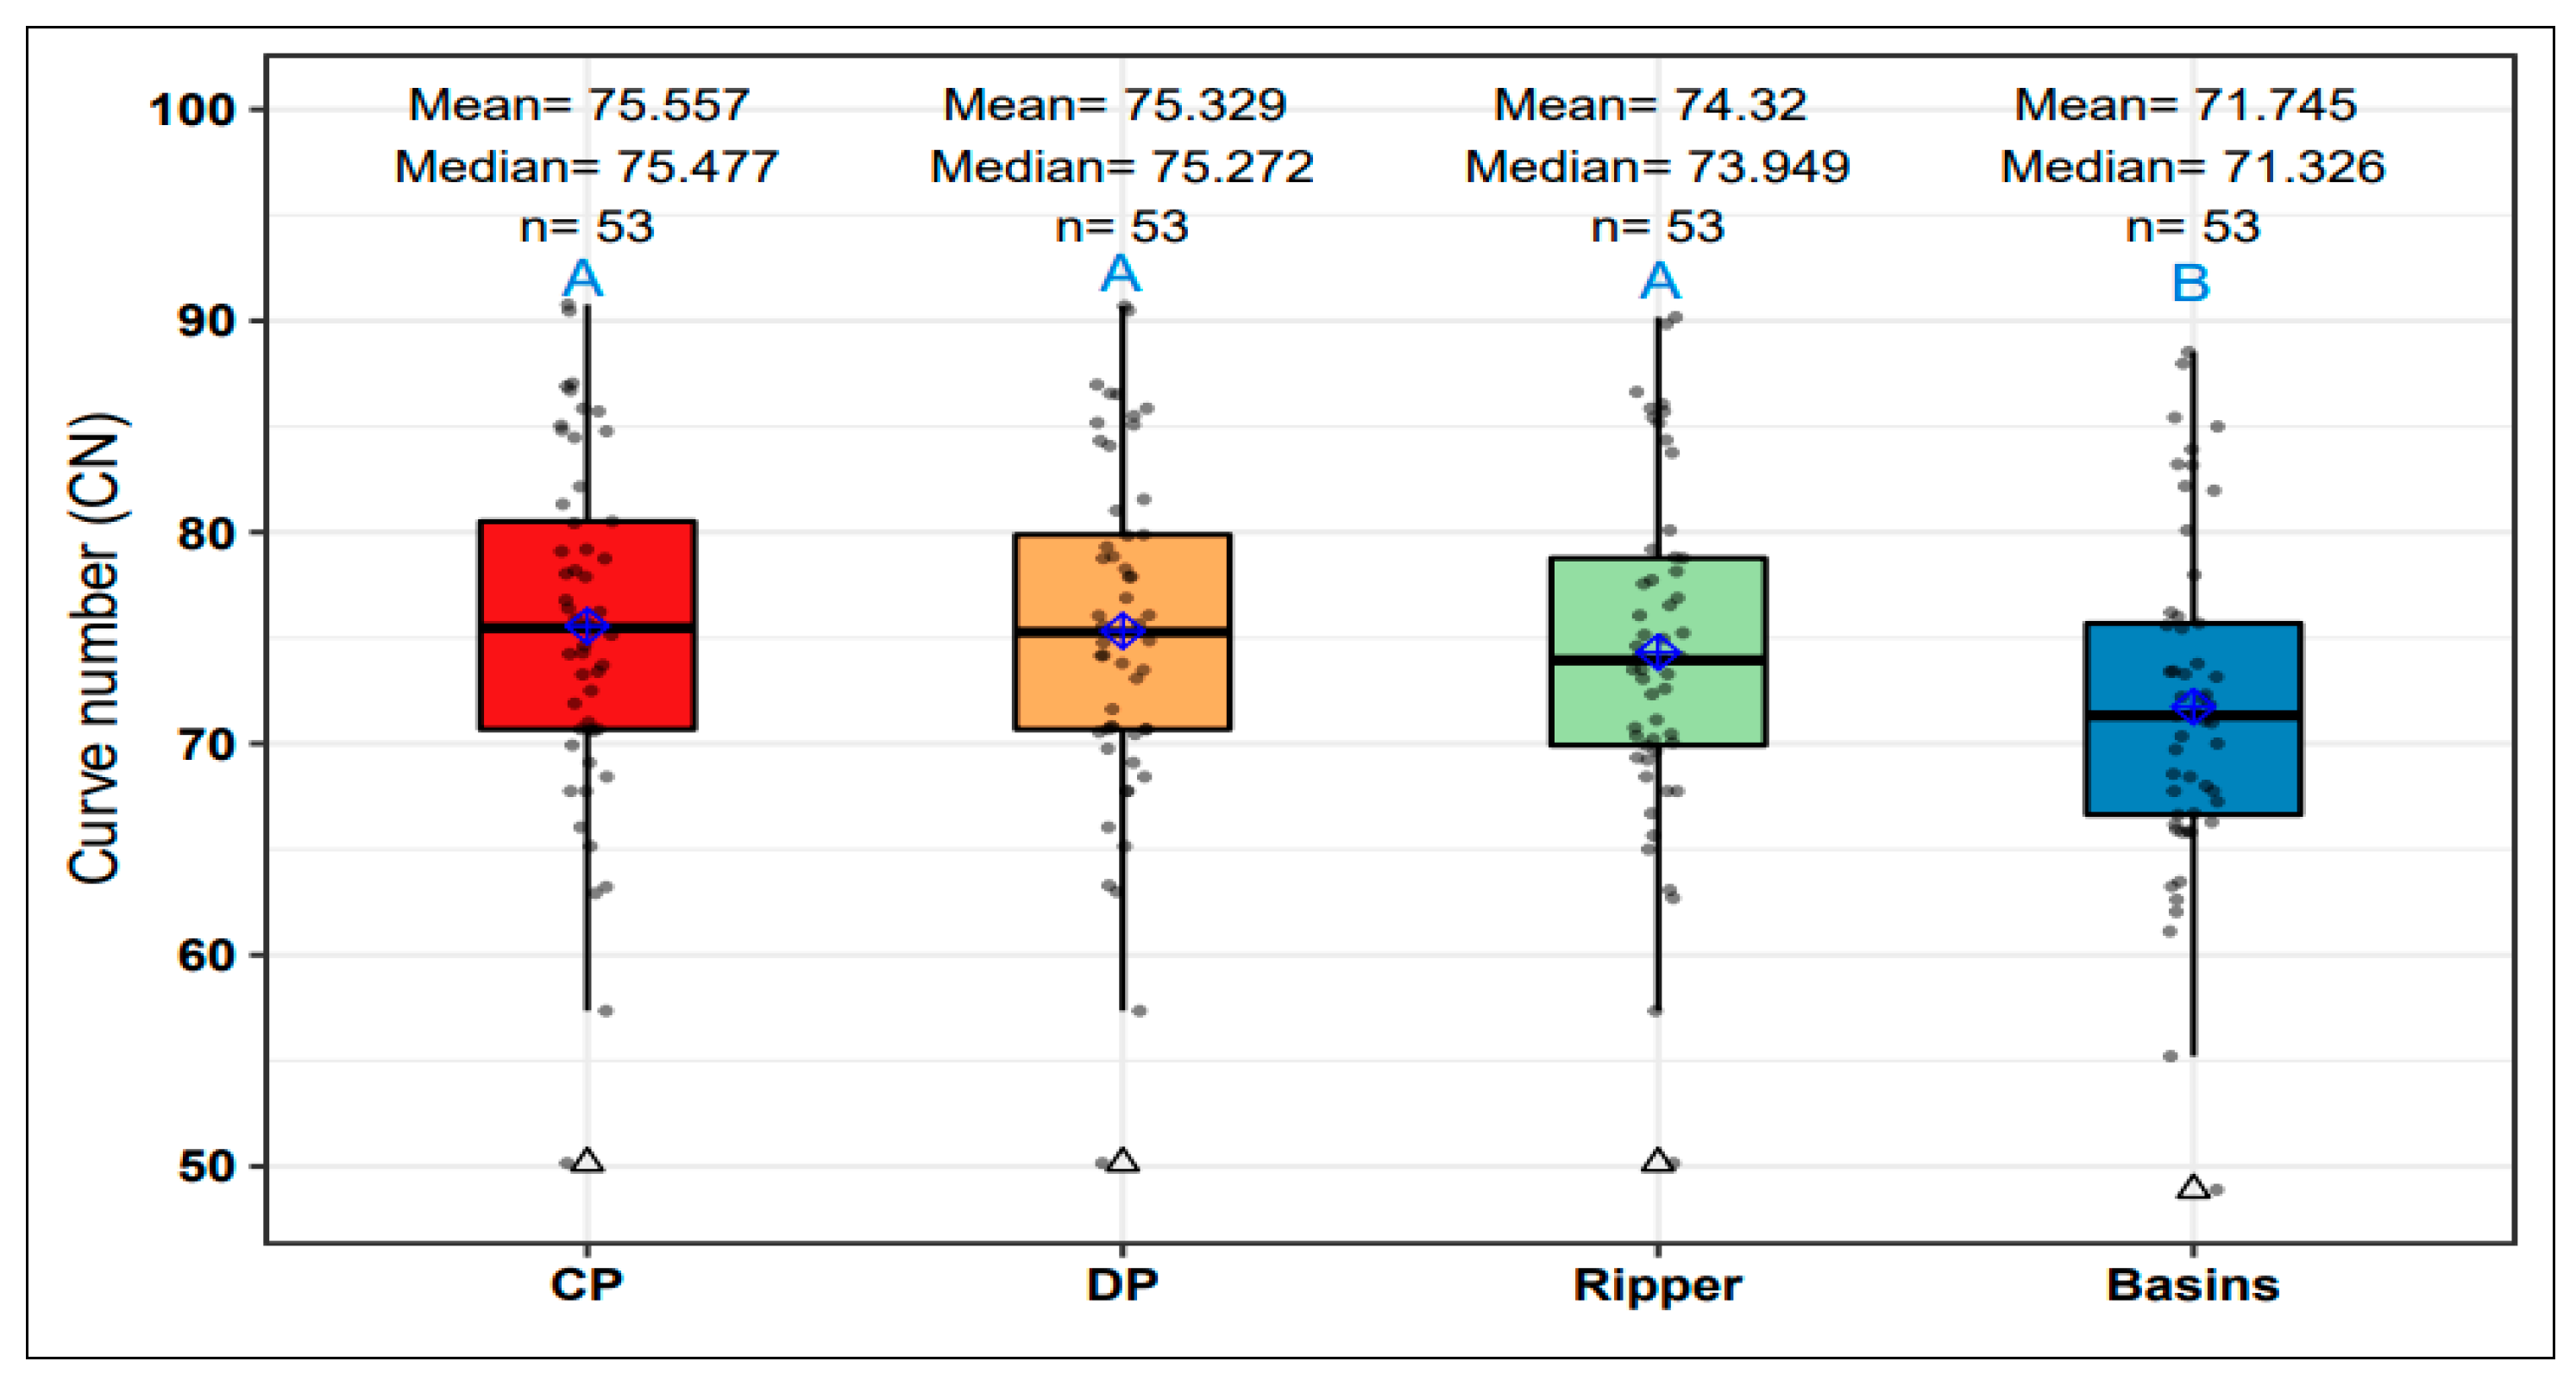
3.4. Surface Water Retention and CN in Tillage Treatments

Despite having differences in the runoff, CP, DP, and ripper tillage treatments had similar surface water retention with planting basins having higher (p = 0.090) water retention compared to the other tillage treatments (Table 3, Figure 8). This implies that infiltration in the tillage treatments varied, and planting basins had more surface depressions that collected rainwater during the growing season. In the two conventional treatments, more surface water was retained in sandy soil than in loamy sand (Figure 9). This result suggests the slower infiltration of rainwater in sandy soil than loamy sand across experimental sites. This can be attributed to poor pore connectivity or pore geometry in the top soil layer or delayed infiltration due to air entrapment in the macropores of the sandy soil in the tilled treatments. On the contrary, sand and loamy sand soils retained similar quantities of surface water under the minimum tillage treatments. The planting basin treatment had a lower CN (p = 0.0615) compared to conventional and ripper practices (Figure 10). Complementary practices, such as mulching and cover cropping, could increase surface water retention and hence reduce runoff from cropping systems in rain-fed smallholder systems.

4. Conclusions

Daily rainfall events of 9–76 mm generated runoff in both conventional and minimum tillage treatments under the semi-arid conditions of the study sites. Planting basins retained more rainwater (12–19%) and hence reduced runoff generation more (40–51%) than conventional and ripper tillage practices. Runoff generation in tillage treatments varied with soil texture, with conventional and ripper systems having more runoff in loamy sands than under sandy soil. Planting basins reduced runoff generation more in sands than loamy sand soil. Conventional and double ploughing treatments recorded more runoff (11–12%) in loamy sands than in sandy soil. Surface water storage and CN results from tillage treatments were consistent with runoff findings, further confirming that conventional and ripper practices made similar contributions toward managing runoff on smallholder farms. Conventional and ripper tillage practices had similar runoff potential, as demonstrated by their CNs generated in this study. Curve numbers of 75–76 for conventional and 72–74 for minimum tillage systems are practical under the conditions of light-textured soil and a land slope of <2%, where conventional and minimum tillage practices were implemented. We therefore conclude that the method used to derive CNs in this study gave values that are fairly consistent with previous estimates used for southern Africa.
The limitations of the study include lack of rainfall intensity measurements during each storm that generated surface runoff at the different experimental sites. The intensity that raindrops fall on the soil surface can help to explain runoff generation and surface water storage dynamics. Furthermore, infiltration, hydraulic conductivity, and sorptivity measurements could have complemented the results reported in this study. An assessment of pore geometry and the different types of pores present in the top soil will strengthen the results obtained in this study. Therefore, future study could focus on these parameters in order to gain a full understanding of runoff generation and soil water storage in the cropping systems used in this study.

Supplementary Materials

The following supporting information can be downloaded at: https://www.mdpi.com/article/10.3390/app13179623/s1.

Author Contributions

W.M. and L.C.—conceptualization and Development of the first draft. L.C. and C.D.-M.—data analysis. B.N. and I.N.—editing of the full draft of the manuscript. All authors have read and agreed to the published version of the manuscript.

Funding

This research received no external funding.

Institutional Review Board Statement

Not applicable.

Informed Consent Statement

Not applicable.

Data Availability Statement

Data are only available upon request to the authors. The code is available upon request to the authors.

Acknowledgments

This paper is a contribution to WaterNet Challenge Program Project 17 “Integrated Water Resource Management for Improved Rural Livelihoods: Managing risk, mitigating drought and improving water productivity in the water-scarce Limpopo Basin”. The cooperation of farmers and the Department of Agricultural Research and Extension Services in the Ministry of Agriculture and Rural Development (Matabeleland South Province) is gratefully acknowledged.

Conflicts of Interest

The authors declare no conflict of interest.

References

  1. Rockström, J.; Barron, J.; Fox, P. Rainwater management for increased productivity among small-holder farmers in drought prone environments. Phys. Chem. Earth Parts A/B/C 2002, 27, 949–959. [Google Scholar] [CrossRef]
  2. Biazin, B.; Sterk, G.; Temesgen, M.; Abdulkedir, A.; Stroosnijder, L. Rainwater harvesting and management in rainfed agricultural systems in sub-Saharan Africa—A review. Phys. Chem. Earth Parts A/B/C 2012, 47, 139–151. [Google Scholar] [CrossRef]
  3. Rosegrant, M.W.; Cai, X.; Cline, S.A. World Water and Food to 2025: Dealing with Scarcity; IFPRI-2020 Vision/International Water Management Institute Book; International Food Policy Research Institute: Washington, DC, USA, 2002. [Google Scholar]
  4. Nyamudeza, P. The effects of growing sorghum (Sorghum bicolor L.) in furrows and on the flat at three populations and three row widths in a semi-arid region of Zimbabwe. 1. Grain yield and yield components. Zimb. J. Agric. Res. 1993, 31, 1–10. [Google Scholar]
  5. Motsi, K.E.; Chuma, E.; Mukamuri, B.B. Rainwater harvesting for sustainable agriculture in communal lands of Zimbabwe. Phys. Chem. Earth Parts A/B/C 2004, 29, 1069–1073. [Google Scholar] [CrossRef]
  6. Mupangwa, W.; Love, D.; Twomlow, S. Soil–water conservation and rainwater harvesting strategies in the semi-arid Mzingwane Catchment, Limpopo Basin, Zimbabwe. Phys. Chem. Earth Parts A/B/C 2006, 31, 893–900. [Google Scholar] [CrossRef]
  7. Vogel, H. Tillage effects on maize yield, rooting depth and soil water content on sandy soils in Zimbabwe. Field Crops Res. 1992, 33, 376–384. [Google Scholar] [CrossRef]
  8. Nyagumbo, I. Conservation tillage for sustainable crop production systems: Experiences from on-station and on-farm research in Zimbabwe. In Conservation Tillage with Animal Traction. A Resource Book of the Animal Traction Network for Eastern and Southern Africa (ATNESA); Kambutho, P.G., Simalenga, T.E., Eds.; Animal Traction Network of Eastern and Southern Africa: Harare, Zimbabwe, 1999; pp. 108–115. Available online: http://www.atnesa.org (accessed on 22 August 2023).
  9. Thierfelder, C.; Wall, P.C. Effects of conservation agriculture techniques on infiltration and soil water content in Zambia and Zimbabwe. Soil Tillage Res. 2009, 105, 217–227. [Google Scholar] [CrossRef]
  10. Kassam, A.; Derpsch, R.; Friedrich, T. Global achievements in soil and water conservation: The case of Conservation Agriculture. Int. Soil Water Conserv. Res. 2014, 2, 5–13. [Google Scholar] [CrossRef]
  11. Mupangwa, W.; Chipindu, L.; Ncube, B.; Mkuhlani, S.; Nhantumbo, N.; Masvaya, E.; Ngwira, A.; Moeletsi, M.; Nyagumbo, I.; Liben, F. Temporal Changes in Minimum and Maximum Temperatures at Selected Locations of Southern Africa. Climate 2023, 11, 84. [Google Scholar] [CrossRef]
  12. Mupangwa, W.; Twomlow, S.; Walker, S. The influence of conservation tillage methods on soil water regimes in semi-arid southern Zimbabwe. Phys. Chem. Earth Parts A/B/C 2008, 33, 762–767. [Google Scholar] [CrossRef]
  13. Degefa, A.; Quraishi, S.; Abegaz, F. Effects of different soil management practices under maize-legume production system on rainfall-runoff and soil loss relationships in Bako, West Oromia, Ethiopia. J. Resour. Dev. Manag. 2016, 26, 27–34. [Google Scholar]
  14. Vigiak, O.; Ribolzi, O.; Pierret, A.; Sengtaheuanghoung, O.; Chaplot, V.; Valentin, C. Estimation of runoff curve number (CN) of some Laotian land use types. Lao J. Agric. For. 2008, 16, 49–60. Available online: https://hdl.handle.net/10568/40801 (accessed on 23 May 2023).
  15. Jung, J.W.; Yoon, K.S.; Choi, D.H.; Lim, S.S.; Choi, W.J.; Choi, S.M.; Lim, B.J. Water management practices and SCS curve numbers of paddy fields equipped with surface drainage pipes. Agric. Water Manag. 2012, 110, 78–83. [Google Scholar] [CrossRef]
  16. Benimana, J.C.; Wali, U.G.; Nhapi, I.; Anyemedu, F.O.K.; Gumindoga, W. Rainwater harvesting potential for crop production in the Bugesera district of Rwanda. Afr. J. Agric. Res. 2015, 10, 2020–2031. [Google Scholar] [CrossRef]
  17. Soil Conservation Service. Hydrology. In National Engineering Handbook; Department of Agriculture: Washington, DC, USA, 1972; Section 4, Chapter 21; 762p. Available online: https://directives.sc.egov.usda.gov (accessed on 14 June 2023).
  18. González-Álvarez, Á.; Temimi, M.; Khanbilvardi, R. Adjustment to the curve number (NRCS-CN) to account for the vegetation effect on hydrological processes. Hydrol. Sci. J. 2015, 60, 591–605. [Google Scholar] [CrossRef]
  19. Caletka, M.; Michalková, M.; Karásek, P.; Fučík, P. Improvement of SCS-CN Initial Abstraction Coefficient in the Czech Republic: A Study of Five Catchments. Water 2020, 12, 1964. [Google Scholar] [CrossRef]
  20. Schmidt, E.J.; Schulze, R.E.; Dent, M.C. Flood Volume and Peak Discharge from Small Catchments in Southern Africa, Based on the SCS Technique: Agricultural Catchments Research Unit Report No. 24. Water Research Commission Project No. 155. South Africa. 1987. Available online: https://www.wrc.org.za/wp-content/uploads/mdocs/TT-31-87.pdf (accessed on 14 June 2023).
  21. Govers, G.; Takken, I.; Helming, K. Soil roughness and overland flow. Agron. 2000, 20, 131–146. [Google Scholar] [CrossRef]
  22. Dimes, J.; Malherbe, J. Climate variability and simulation modeling―Challenges and opportunities. In Livelihoods in the Limpopo: CGIAR Challenge Program on Water and Food Project No. 1, Increased Food Security and Income in the Limpopo Basin through Integrated Crops, Soil Fertility and Water Management Options and Links to Markets, Proceedings of the CPWFPN 1 Inception Workshop, Polokwane, South Africa, 25–27 January 2005; Mgonja, M.A., Waddington, S., Rollin, D., Masenya, M., Eds.; Scientific Research Publishing: Wuhan, China, 2006. [Google Scholar]
  23. Chaki, A.K.; Gaydon, D.S.; Dalal, R.C.; Bellotti, W.D.; Gathala, M.K.; Hossain, A.; Menzies, N.W. How we used APSIM to simulate conservation agriculture practices in the rice-wheat system of the Eastern Gangetic Plains. Field Crops Res. 2022, 275, 108344. [Google Scholar] [CrossRef]
  24. Natural Resources Conservation Service (NRCS). Urban Hydrology for Small Watersheds; Technical Release 55, June 1986; United States Department of Agriculture: Washington, DC, USA, 1986.
  25. Shamudzarira, Z.; Robertson, M.J. Simulating Response of Maize to Nitrogen Fertilizer in Semi-Arid Zimbabwe. Exp. Agric. 2002, 38, 79–96. [Google Scholar] [CrossRef]
  26. Ncube, B.; Dimes, J.P.; van Wijk, M.T.; Twomlow, S.J.; Giller, K.E. Productivity and residual benefits of grain legumes to sorghum under semi-arid conditions in south-western Zimbabwe: Unravelling the effects of water and nitrogen using a simulation model. Field Crops Res. 2009, 110, 173–184. [Google Scholar] [CrossRef]
  27. Chikowo, R.; Corbeels, M.; Mapfumo, P.; Tittonell, P.; Vanlauwe, B.; Giller, K.E. Nitrogen and phosphorus capture and recovery efficiencies, and crop responses to a range of soil fertility management strategies in sub-Saharan Africa. In Innovations as Key to the Green Revolution in Africa; Springer: Berlin/Heidelberg, Germany, 2011; pp. 571–589. [Google Scholar] [CrossRef]
  28. Mwansa, F.B.; Munyinda, K.; Mweetwa, A.; Mupangwa, W. Assessing the Potential of Conservation Agriculture to Off-set the Effects of Climate Change on Crop Productivity using Crop Simulations Model (APSIM). Int. J. Sci. Footpr. 2017, 5, 9–32. [Google Scholar]
  29. Nezomba, H.; Mtambanengwe, F.; Rurinda, J.; Mapfumo, P. Integrated soil fertility management sequences for reducing climate risk in smallholder crop production systems in southern Africa. Field Crops Res. 2018, 224, 102–114. [Google Scholar] [CrossRef]
  30. Singh, P.; Mishra, S.K. Determination of curve number and estimation of runoff using Indian experimental rainfall and runoff data. J. Spat. Hydrol. 2017, 13, 2. Available online: https://scholarsarchive.byu.edu/josh/vol13/iss1/2 (accessed on 20 April 2023).
  31. Mupangwa, W.; Dimes, J.; Walker, S.; Twomlow, S. Measuring and simulating maize (Zea mays L.) yield responses to reduced tillage and mulching under semi-arid conditions. Agric. Sci. 2011, 2, 167–174. [Google Scholar] [CrossRef]
  32. Mupangwa, W.; Jewitt, G. Simulating the impact of no-till systems on field water fluxes and maize productivity under semi-arid conditions. Phys. Chem. Earth Parts A/B/C 2011, 36, 1004–1011. [Google Scholar] [CrossRef]
  33. Food and Agriculture Organization (FAO). Fertilizer Use by Crop in Zimbabwe. Land and Plant Nutrition Services; Land and Water Development Division, Food and Agriculture Organisation of the United Nations: Rome, Italy, 2006. [Google Scholar]
  34. Anderson, I.P.; Brinn, P.J.; Moyo, M.; Nyamwanza, B. Physical Resource Inventory of the Communal Lands of Zimbabwe—An Overview (NRI Bulletin 60); Natural Resources Institute: Madison, WI, USA, 1993. [Google Scholar]
  35. Nyamapfene, K.W. The Soils of Zimbabwe; Nehanda Publishers: Harare, Zimbabwe, 1991; Volume 1, 179p. [Google Scholar]
  36. Love, D.; Uhlenbrook, S.; Corzo-Perez, G.; Twomlow, S.; van der Zaag, P. Rainfall–interception–evaporation–runoff relationships in a semi-arid catchment, northern Limpopo basin, Zimbabwe. Hydrol. Sci. J. 2010, 55, 687–703. [Google Scholar] [CrossRef]
  37. Mhizha, A.; Ndiritu, J.G. Assessing crop yield benefits from in situ rainwater harvesting through contour ridges in semi-arid Zimbabwe. Phys. Chem. Earth Parts A/B/C 2013, 66, 123–130. [Google Scholar] [CrossRef]
  38. Twomlow, S.J.; Urolov, J.C.; Oldrieve, B.; Jenrich, M. Lessons from the field—Zimbabwe’s conservation agriculture taskforce. SAT Agric. Res. 2008, 6, 1–11. [Google Scholar]
  39. Hawkins, R.H. Improved Prediction of Storm Runoff in Mountain Watersheds. J. Irrig. Drain. Div. 1973, 99, 519–523. [Google Scholar] [CrossRef]
  40. Zhao, L.; Hou, R.; Wu, F.; Keesstra, S. Effect of soil surface roughness on infiltration water, ponding and runoff on tilled soils under rainfall simulation experiments. Soil Tillage Res. 2018, 179, 47–53. [Google Scholar] [CrossRef]
  41. Bruneau, P.; Twomlow, S. Hydrological and Physical Responses of a Semi-arid Sandy Soil to Tillage. J. Agric. Eng. Res. 1999, 72, 385–391. [Google Scholar] [CrossRef]
  42. van der Meer, F.B.W. Modelling Tropical Soil Water Regimes in Semi-Arid Environments. Ph.D. Dissertation, Loughborough University, Loughborough, UK, 2000. [Google Scholar]
  43. Haruna, S.I.; Anderson, S.H.; Nkongolo, N.V.; Zaibon, S. Soil Hydraulic Properties: Influence of Tillage and Cover Crops. Pedosphere 2018, 28, 430–442. [Google Scholar] [CrossRef]
  44. Shinde, S.S.; Magar, S.S.; Kale, S.P. Effect of soil physical conditions and initial soil moisture content on infiltration into black soil. J. Indian Soc. Soil Sci. 1982, 30, 441–446. [Google Scholar]
  45. Twomlow, S.J.; Steyn, J.T.; Du Preez, C.C.; Peterson, G.A.; Unger, P.W.; Payne, W.A. Dryland Farming in Southern Africa. Dryland Agric. 2006, 23, 769–836. [Google Scholar] [CrossRef]
  46. Wang, J.; Watts, D.B.; Meng, Q.; Zhang, Q.; Way, T.R. Influence of surface crusting on infiltration of a Loess Plateau soil. Soil Sci. Soc. Am. J. 2016, 80, 683–692. [Google Scholar] [CrossRef]
  47. Jones, O.R.; Eck, H.V.; Smith, S.J.; Coleman, G.A.; Hauser, V.L. Runoff, soil, and nutrient losses from rangeland and dry-farmed cropland in the southern High Plains. J. Soil Water Conserv. 1985, 40, 161–164. [Google Scholar]
  48. Baumhardt, R.L.; Marek, G.; Brauer, D. Trends in runoff from dryland, cropped fields on the texas high plains, and implications for their management. Front. Sustain. Food Syst. 2020, 4, 217. [Google Scholar] [CrossRef]
  49. Du Plessis, M.C.; Mostert, J.W.C. Runoff and soil losses at the Agricultural Research Centre. Glen. S. Afr. J. Agric. Sci. 1965, 8, 1051–1061. [Google Scholar]
  50. Hensley, M.; Botha, J.J.; Anderson, J.J.; Van Staden, P.P.; Du Toit, A. Optimizing Rainfall Use Efficiency for Developing Farmers with Limited Access to Irrigation Water (No. 878/1, p. 00); Water Research Commission: Pretoria, South Africa, 2000. [Google Scholar]
  51. Jourgholami, M.; Labelle, E.R. Effects of plot length and soil texture on runoff and sediment yield occurring on machine-trafficked soils in a mixed deciduous forest. Ann. For. Sci. 2020, 77, 1–11. [Google Scholar] [CrossRef]
  52. Ngwira, A.R.; Thierfelder, C.; Lambert, D.M. Conservation agriculture systems for Malawian smallholder farmers: Long-term effects on crop productivity, profitability and soil quality. Renew. Agric. Food Syst. 2013, 28, 350–363. [Google Scholar] [CrossRef]
Figure 1. Agro-ecological regions of Zimbabwe and location of experimental sites in Insiza and Gwanda districts of Matabeleland South province. Adapted from [12].
Applsci 13 09623 g001
Figure 2. Daily rainfall events that generated runoff from conventional and double ploughing, ripper, and basin tillage treatments. (SD = standard deviation).
Applsci 13 09623 g002
Figure 3. Runoff generated from the four tillage treatments across experimental sites and across growing seasons (2006/07 and 2007/08) in Gwanda and Insiza districts, Zimbabwe. Means with the same letter are not significantly different (p < 0.05). A crossed blue square in each box plot represents the treatment mean.
Applsci 13 09623 g003
Figure 4. Pairwise comparison of the effects of different tillage methods on runoff generation across soil types and experimental sites in Insiza and Gwanda districts, Zimbabwe.
Applsci 13 09623 g004
Figure 5. Rainfall–runoff relationships in each tillage treatment across sites and seasons in Gwanda and Insiza districts, Zimbabwe.
Applsci 13 09623 g005
Figure 6. Runoff amounts generated in different tillage treatments under sandy and loamy sand soils across sites and seasons in Gwanda and Insiza districts, Zimbabwe. Means with the same letter are not significantly different (5%). The crossed blue square in each box plot represents the treatment mean.
Applsci 13 09623 g006
Figure 7. Rainfall–runoff relationships in each tillage treatment under sandy and loamy sand soils across sites and seasons in Gwanda and Insiza districts, Zimbabwe.
Applsci 13 09623 g007
Figure 8. Surface water retained in different tillage treatments across sites and seasons in Gwanda and Insiza districts, Zimbabwe. Means with the same letter are not significantly different (5%). The crossed blue square in each box plot represents the treatment mean.
Applsci 13 09623 g008
Figure 9. Surface water retained in different tillage treatments under sandy and loamy sand soils across sites and seasons in Gwanda and Insiza districts, Zimbabwe. Means with the same letter are not significantly different (5%). The crossed blue square in each box plot represents the treatment mean.
Applsci 13 09623 g009
Figure 10. Curve numbers derived from runoff amounts measured in the four tillage treatments across two seasons. Means with the same letter are not significantly different (5%).
Applsci 13 09623 g010
Table 1. Initial soil chemical and physical properties (0–0.6 m) at smallholder farms used in Insiza and Gwanda districts of Zimbabwe. (Lsd = least significant difference; CV = coefficient of variation).
Experimental SitepH (Water)O.C.
(mg kg−1)
Total N
(mg kg−1)
Total P
(mg kg−1)
Bulk Density
(g cm−3)
Mguni6.05.60.50.201.50
Moyo5.95.80.60.061.49
Mpofu5.24.10.30.071.46
Nkomo5.63.60.20.061.50
Mlalazi5.53.60.20.091.52
Ncube N6.53.40.20.021.52
Nyathi6.32.90.30.081.51
Ncube J5.33.30.30.091.49
Sibanda5.64.60.30.211.51
Siziba6.17.10.60.191.56
Lsd0.050.531.80.330.070.020
CV (%)7.32940431.1
Table 2. Pair-wise comparison of runoff generated from different tillage treatments across sites and seasons. S.E. = standard error, T-values = test statistics, p value = probability value.
Tillage Pair-Wise ComparisonEstimateS.E.T-Valuep-Value
DP-CP−0.064310.11470−0.5610.9435
Ripper-CP−0.333310.11470−2.9060.0209 *
Basins-CP−0.916340.11470−7.989<0.001 ***
Ripper-DP−0.269000.11470−2.3450.0911
Basins-DP−0.852030.11470−7.428<0.001 ***
Basins-Ripper−0.583030.11470−5.083<0.001 ***
Statistical significance codes: *** = 0.001; * = 0.05.
Table 3. ANOVA for tillage effects on surface water retention (SWR) and curve numbers across experimental sites. DF = degrees of freedom, SS = sum of squares, MS = mean square due to regression, p-value = probability value, and F-value = overall significance of the regression.
ParameterTreatmentDFSSMSF-Valuep-Value
SWRTillage method311,02336742.1930.090
Residuals208348,5231676
Curve numberTillage method3485161.72.4880.0615
Residuals20813,52065.0
Disclaimer/Publisher’s Note: The statements, opinions and data contained in all publications are solely those of the individual author(s) and contributor(s) and not of MDPI and/or the editor(s). MDPI and/or the editor(s) disclaim responsibility for any injury to people or property resulting from any ideas, methods, instructions or products referred to in the content.

