1. Introduction
Surface roughness is a key parameter in many industrial devices and significantly affects the quality and equipment composed of several machined components; therefore, reliable measurement of surface roughness plays a fundamental role in ensuring the functionality and reliability of the final product. However, the measurement of surface roughness is not without problems, especially when it comes to quantifying the uncertainty associated with these measurements. This estimate of uncertainty is necessary to evaluate the reliability and comparability of the surface roughness data and, to the same extent, the measurement surface roughness data obtained.
There are several measuring methods and devices for investigating surface roughness, and generally, we can categorize them into two main groups, contact and non-contact methods and devices.
There are a number of devices available for evaluating surface roughness, and they are probably best divided according to individual methods of measuring and evaluating surface roughness.
The device for contact stylus-based contact measurements is one of the most widely used methods for measuring surface roughness, where the contact stylus profilometer is probably the only representative. The disadvantages of the contact-based measurement include mainly the stylus tip wear caused due to the contact between the sharp tip of the stylus and the surface roughness. The sample’s surface will be scratched because of the movement of the stylus tip on the surface during the measurement, and the measurement is limited to the radius of the stylus tip.
Devices for non-contact methods of assessing surface roughness are more expensive. There are many devices and methods for non-contact methods, such as laser triangulation, optical interferometry, confocal microscopy, and atomic force microscopy, which is the most accurate of these methods. The scan quality of these measuring instruments is mainly dependent on the optical properties of the materials tested.
One of the common methods for determining surface roughness is the contact pen method or stylus profilometers, which provides relatively quick measurement results at a favorable price than other methods that require relatively expensive equipment. For production practice, the contact method is thus an ideal tool for evaluating the surface of machined parts, but this contact method is associated with a number of problems because the very implementation of this method depends on the correct setting of the measurement conditions and the correct implementation of the measurement and evaluation of surface roughness values.
Experience from different experiments and work with this contact method shows that inappropriate setting of the wavelength limit, also known as cut-off, inappropriate stylus speed, and inappropriate standard for evaluation, causes diametrically different results of surface roughness assessment and thus, the whole process of surface roughness assessment is then completely devalued. Another task is to understand and quantify the uncertainty of the measurement and evaluation of surface roughness values for each instrument quality, calibration standards, measurement conditions, and the way the surface of the part is produced, which can significantly validate the results and evaluations. For common practice, it is necessary to create a methodology for the optimal process of evaluating the surface of machined parts and determining the measurement uncertainty estimate.
In this article, we will delve into the topic of surface roughness measurement with a focus on the methodology of implementing the contact method and determining the estimate and evaluation of measurement uncertainty. Investigating and understanding specific issues is important to the operator in obtaining reliable results from the surface roughness evaluation process. This issue is very extensive, so for this article, we will deal with quantities—the arithmetic mean deviation of the assessed roughness profile and the quality of the surface of the components is relevant for the assessment.
Author Whitehouse [
1] provides a definition for the term “surface metrology”, which aims to optimize the functions of the production process and its tools to support effective management. This optimization directly affects the quality of products, making surface metrology crucial in predicting outcomes within the production process.
In the paper by Vorburger [
2], a comprehensive review of various methods for measuring surface texture is presented, accompanied by a classification scheme for these methods.
Kumar’s work [
3] focuses on the measurement and uncertainty analysis of surface roughness, specifically addressing the influence of cutting conditions during turning. The study investigates the arithmetic mean deviation of surface roughness (
Ra) and Material Removal Rate (MRR).
In the study conducted by Beno [
4], a practical methodology for measuring roughness when turning with tool inserts featuring variable tool faces is introduced. The research emphasizes the importance of adopting a unified roughness measurement methodology to compare the capability of different tool inserts. The study evaluates measured data such as
Ra,
Rq,
Rz,
Rt, and
Rp.
Davinci [
5] conducts a detailed experimental study to assess the individual and combined effects of scanning speed and spacing on surface roughness parameters. The study focuses on a reference specimen, selecting profile parameters (
Ra,
Rq, and
Rz) and surface parameters (
Sa,
Sq, and
Sz) as response variables. The findings highlight the significant impact of scanning speed on
Ra,
Rz,
Sa, and
Sz measurements, while spacing affects all profile and surface measurements.
Surface roughness measurements are primarily performed using stylus roughness meters for machined surfaces. However, atomic force microscopes (AFM) are also utilized for surface roughness evaluation, including the assessment of uncertainty for surface roughness parameter
Ra [
6].
Surface topography measurements are becoming more and more popular and complement the 2D analysis of surface texture [
7,
8,
9,
10]. The selection of the measurement area is not yet included in the standards, and the size of this area affects the values of the determined parameters. The article [
11] presents the results of research on determining the measurement area based on the smooth-rough crossover scale (SCR) and mean profile element spacing (
RSm) parameters. Other works also address the measurement of the surface roughness of components [
12,
13,
14,
15,
16,
17,
18,
19,
20,
21,
22,
23,
24].
The aim of the article is to determine the uncertainty estimate of the measurement of arithmetic mean deviation of surface roughness Ra for the used measuring device of surface roughness quantities and to verify the measurement methodology from the point of view of setting the measurement parameters. The problem is that the manufacturer usually does not specify the maximum permissible error of the measuring device, and even for surface roughness standards (calibration etalon), the maximum error of determining its nominal value is not declared either, and therefore, values must be determined by calibration.
A fundamental problem in this measurement is the appropriate measurement conditions, and the measurement and evaluation of surface roughness values are characterized by the fact that it is sensitive to the correct selection of measurement conditions. Although there are recommendations that are in some available standards, they may not always take into account the actual measurement conditions, and it is advisable to verify them for specific conditions. There is no suitable methodology for the correct setting and selection of measurement conditions, which would ensure the achievement of the correct measurement result with minimal measurement uncertainty for various technologies for processing parts’ surfaces.
It is obvious from common metrological practice that one measurement is insufficient to determine the value of the measured quantity, so the unknown value of the measured quantity is approximated by the mean value (arithmetical mean deviation), determined as the arithmetic mean of repeated measurements. The question is, however, what is the sufficient number of measurements needed for determining the value of the measured quantity, and what effect does this number of measurements have on the reported measurement uncertainty? The seemingly best solution is to perform as many measurements as possible in order to minimize the measurement uncertainty. However, here it is also necessary to take into account the economic point of view, as the economic costs and the time required to carry out the measurements are also important criteria when determining the number of measurements. Therefore, it is necessary to find the optimal number of measurements so that the measurement uncertainty is sufficient, and, at the same time, it is advantageous from an economic and time point of view.
Based on the above, the research criteria are defined:
Criterion 1: Identification of suitable measurement conditions to achieve minimal measurement uncertainty.
Criterion 2: Determination of the optimal number of repeated measurements to achieve minimum measurement uncertainty.
Criterion 3: Identifying the possibility of rapid measurement uncertainty estimation.
Criterion 4: Identification or verification of the distribution law of a random measured variable.
Three main contributions of this work can be summarized as follows:
(1) Determination of the estimate of the condition of the used surface tester for assessing the surface roughness values of the parts.
(2) Proposal of a methodology for measuring surface roughness for determination of Ra when determining the optimal settings of conditions and measurement parameters for various types of technologies for processing parts’ surfaces. This is mainly the effect of the selection of the evaluation standard, the effect of the measurement speed, and the effect of setting the cut-off filter for the evaluation of the quantity Ra.
(3) Determination of the optimal number of measurements to determine the roughness of the surface of the examined part, which represents an important factor for achieving measurement results with minimal measurement uncertainties at low financial costs.
The rest of this paper is organized as follows.
Section 2 describes the methodology used in this article.
Section 3 is focused on the presentation of experiments for solving defined aspects of the surface roughness evaluation process. In the last part of the work, there is a discussion of the results in
Section 4.
Section 5 concludes this paper.
Appendix A defines the basic terminology and describes the methodology employed in this study.
Appendix B presents experiments carried out on samples with a non-periodic surface roughness profile.
Appendix C contains the results of experiments on samples with a periodic surface roughness profile.
2. Methodology
Surface roughness is a geometric property of the surface, and there are no direct methods to measure it. Surface roughness has a decisive influence on the coefficient of friction of contacting surfaces, on adhesion between surfaces, and various other properties and phenomena; it also has direct effects on the material properties of components [
25,
26,
27,
28,
29,
30,
31,
32] but also has a key role in other areas, where it significantly affects the function of various devices. Terminology according to the standards and used methods of measurement and data processing is processed in
Appendix A.
Profile curves are usually measured, and appropriate characteristics and quantities are evaluated from them, which are considered criteria for assessing surface roughness. Surface roughness parameters and values are defined in standards EN ISO 4287 and EN ISO 5436. These standards were later replaced by standards ISO 21920-1, ISO 21920-2, ISO 21920-3 [
33,
34,
35,
36,
37,
38,
39,
40].
Current engineering practice is characterized by an increase in requirements for precision and reproducibility of production in the period of production of sophisticated production. The optimal quality of the surface of the parts is one of the prerequisites for the correct function of products (machines, devices, tools) and significantly affects the service life of the parts and even the entire machines. The roughness of the surface represents a collection of irregularities with relatively small distances from a perfect and ideally smooth surface, while these irregularities arise as a result of the used production technology or wear due to use (STN ISO 4287, ISO 21920-1, ISO 21920-2, and ISO 21920-3) [
33,
34,
35,
36].
In the following sections, we will distinguish the so-called periodic and non-periodic surface roughness profiles (for more details, see
Appendix A).
The ISO 21920-3 [
39] standard introduces no distinction between periodic and non-periodic profiles compared to the edition of ISO 4288:1996 [
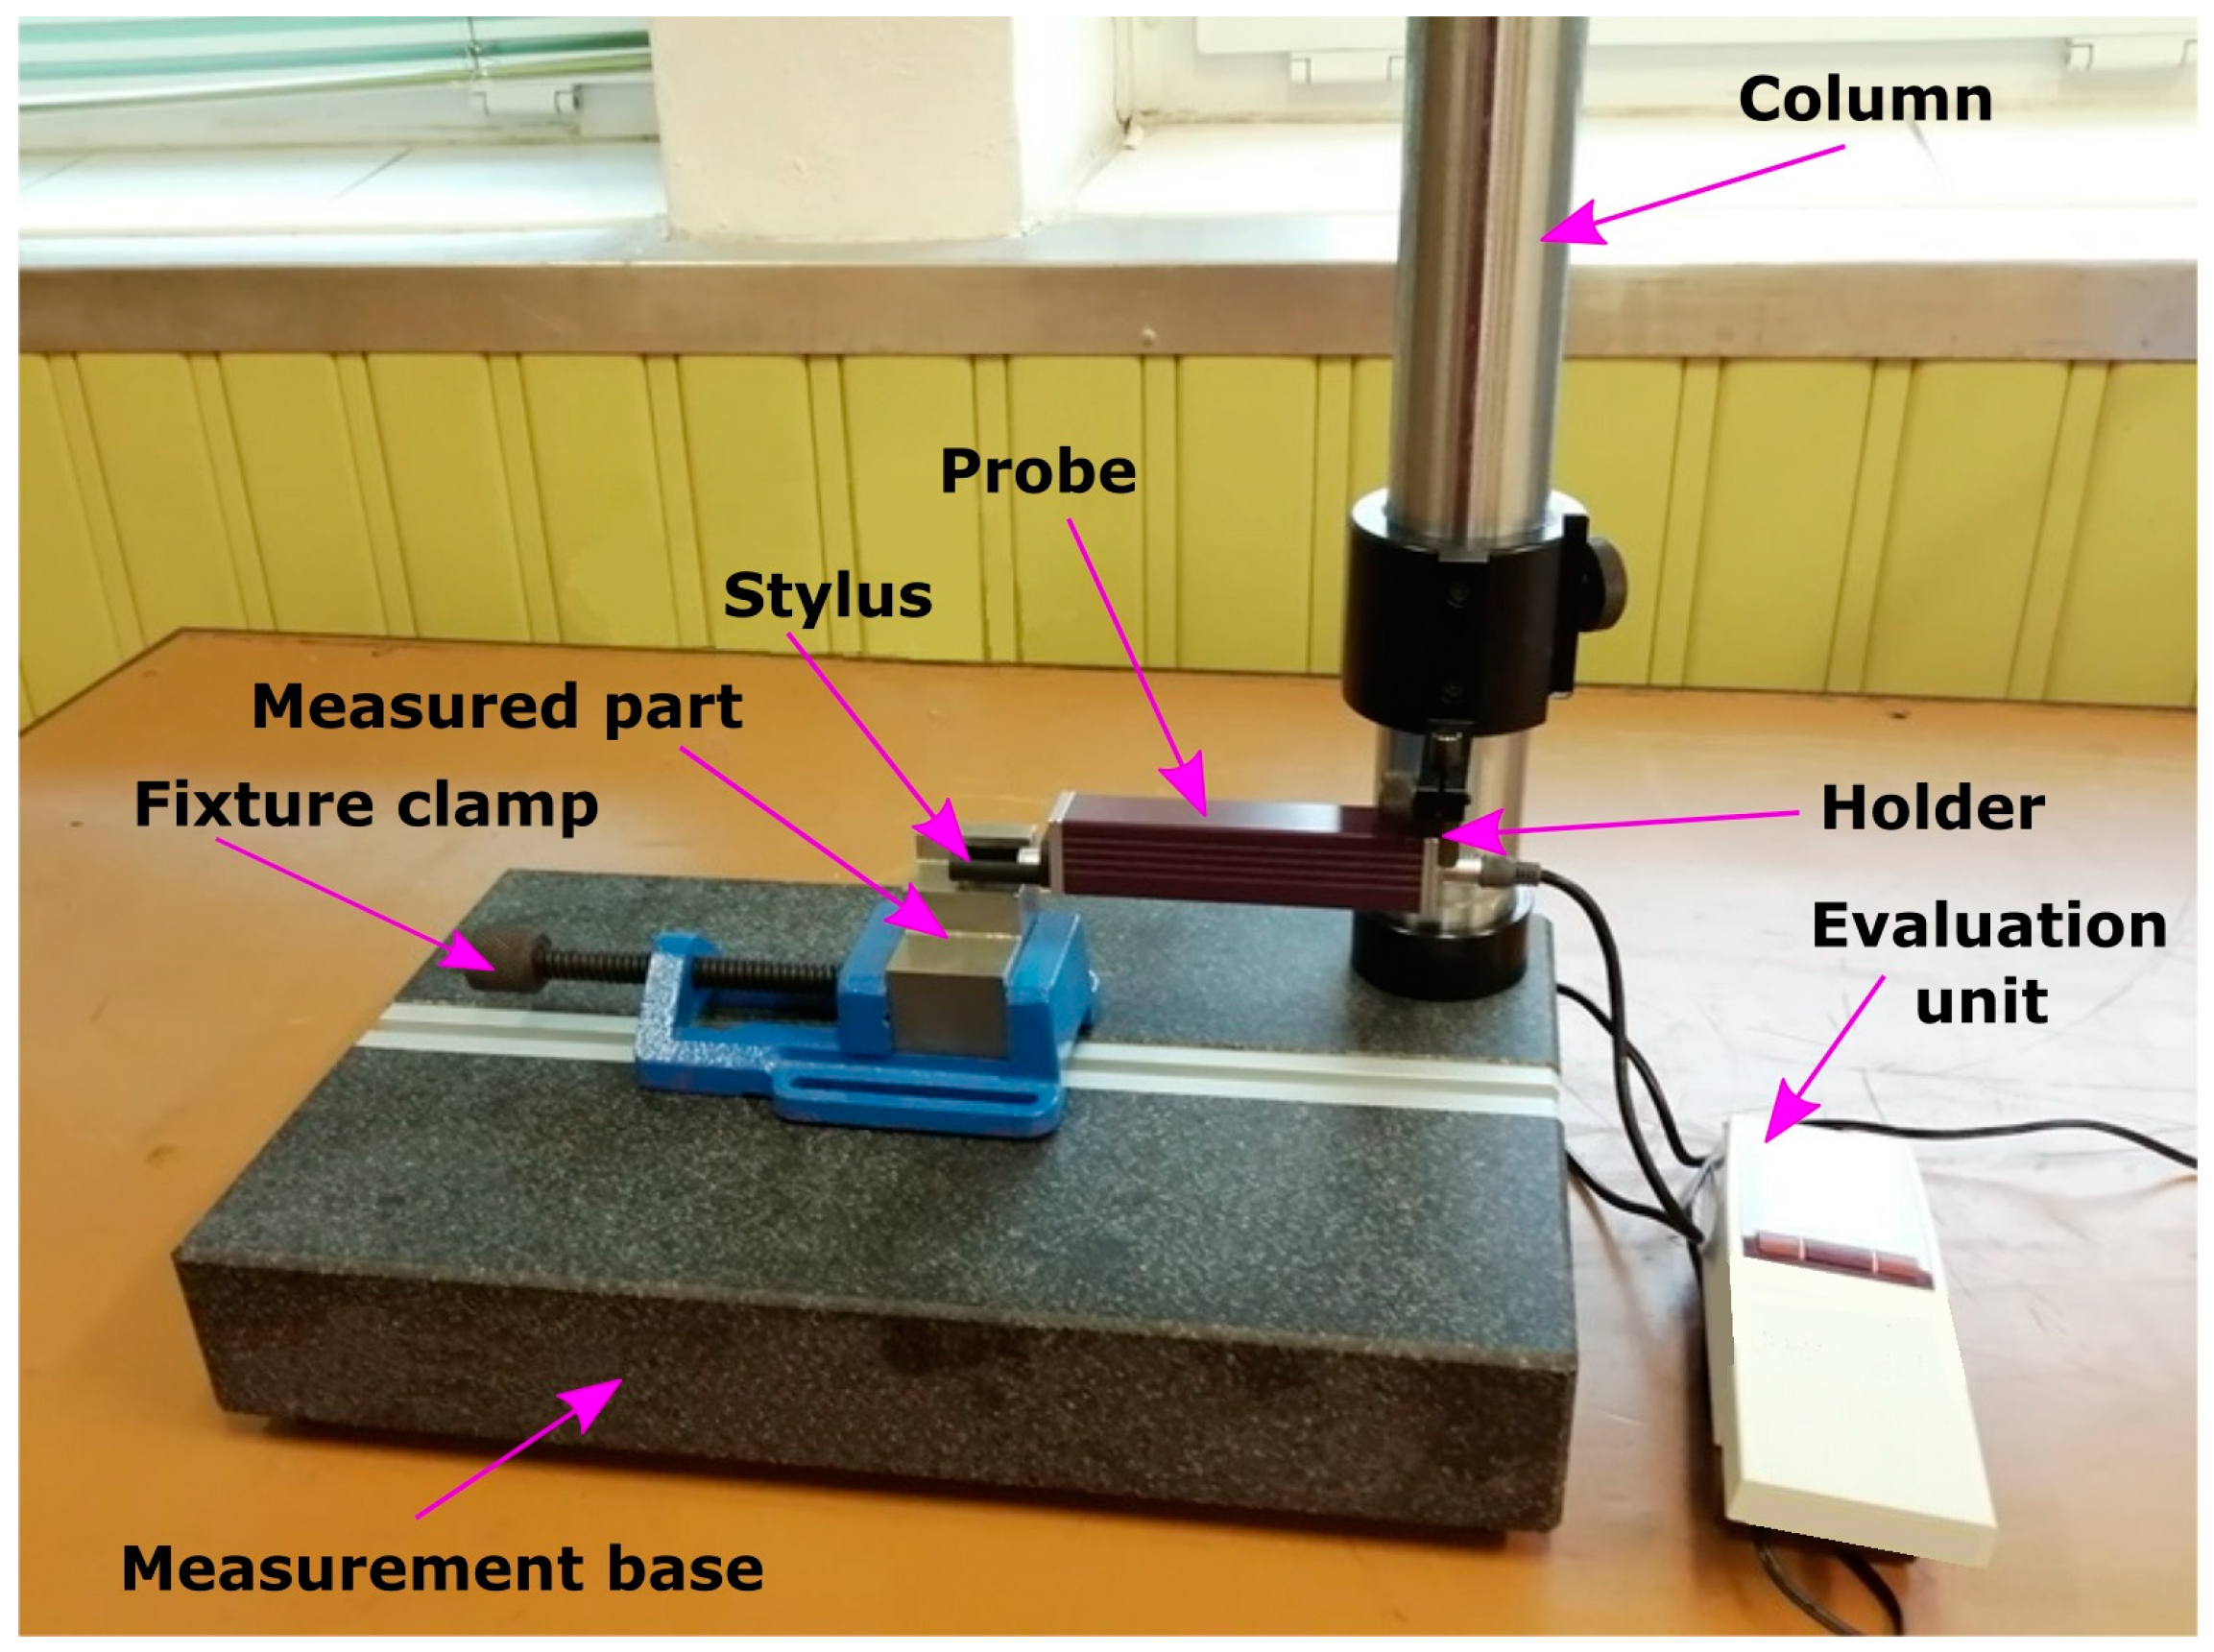
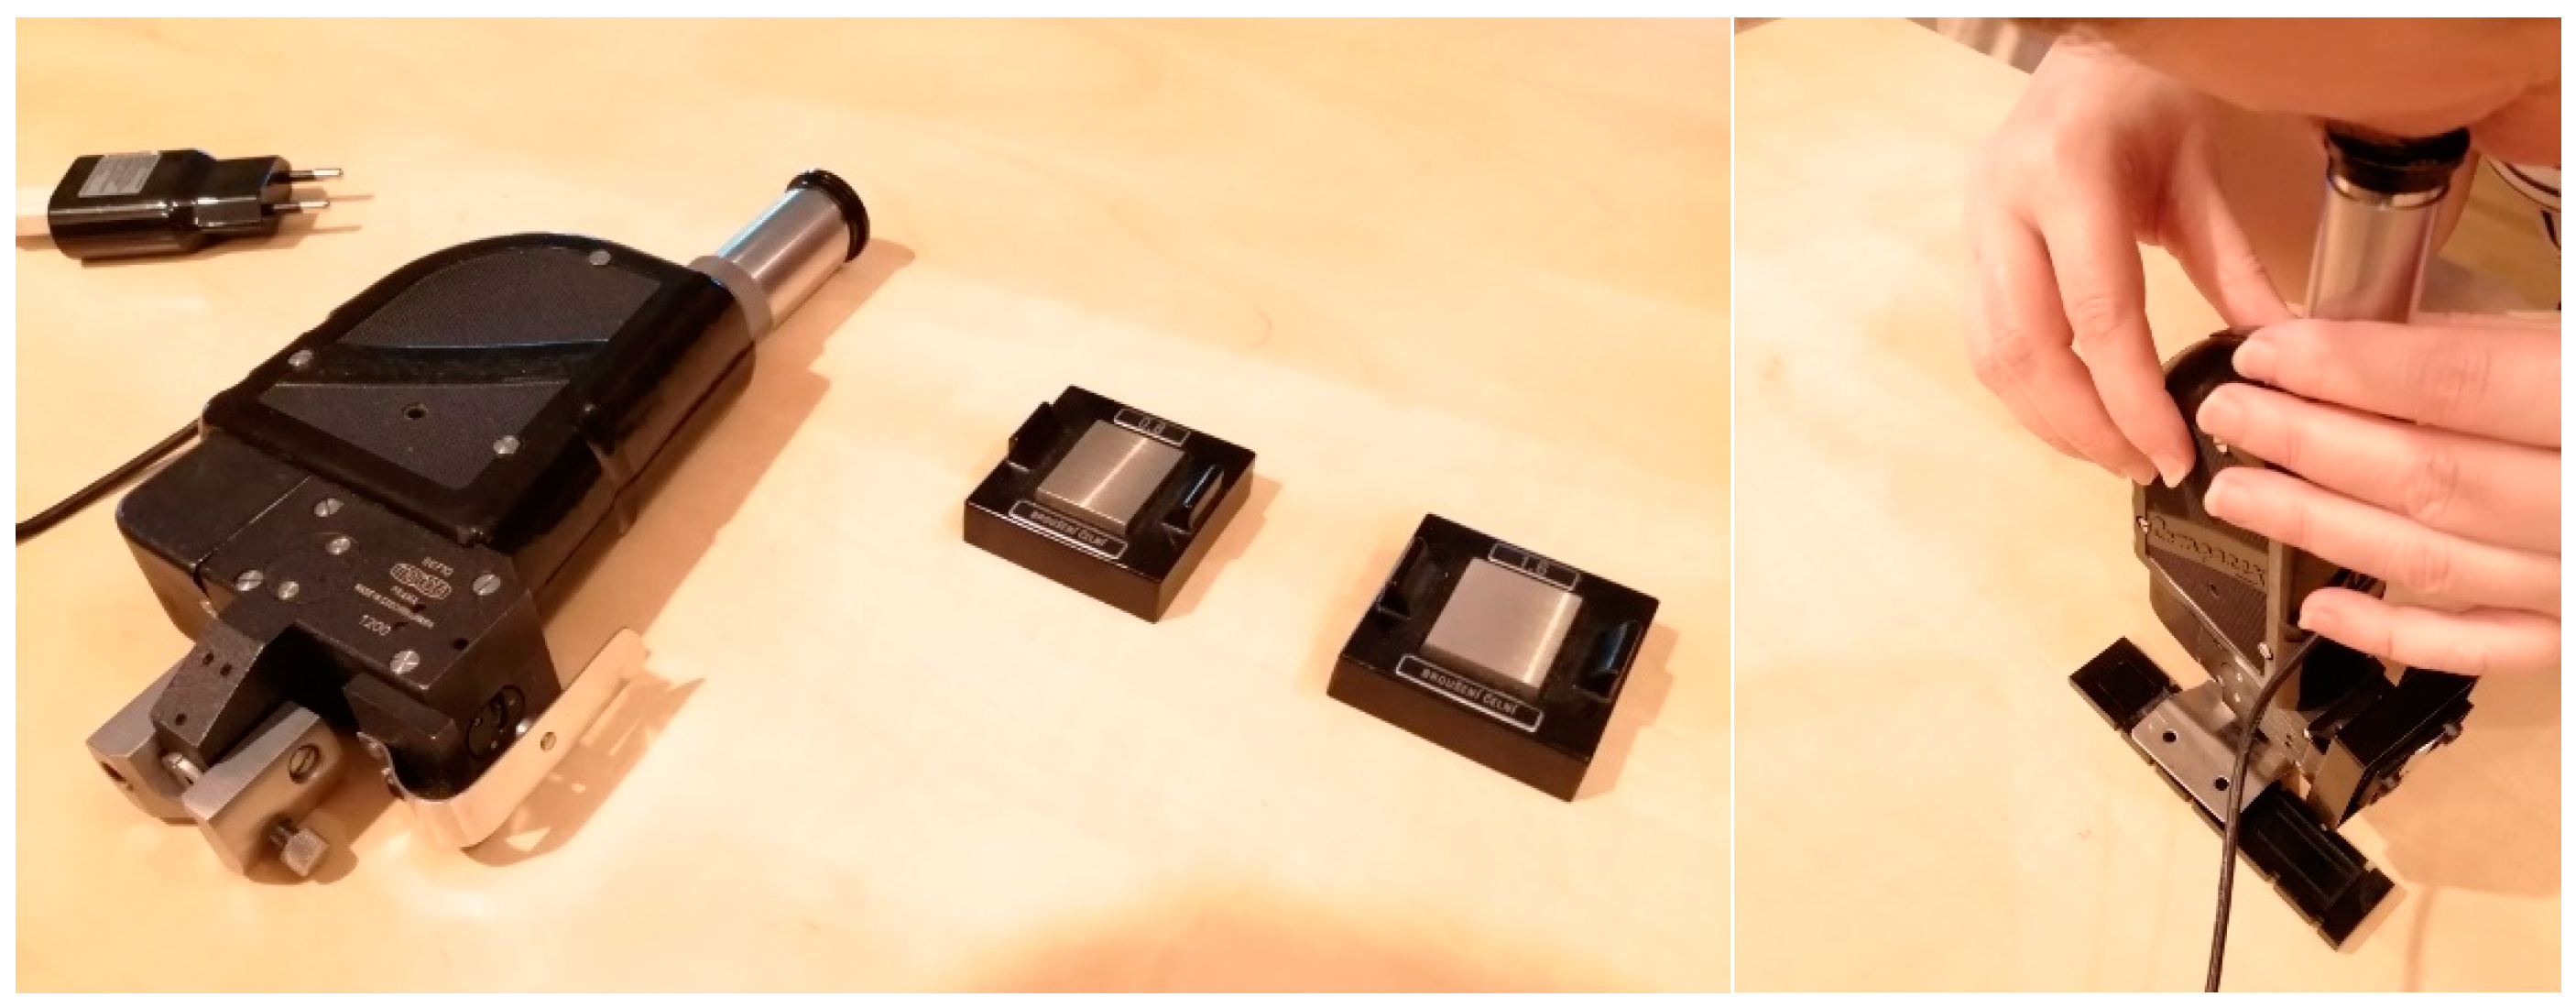
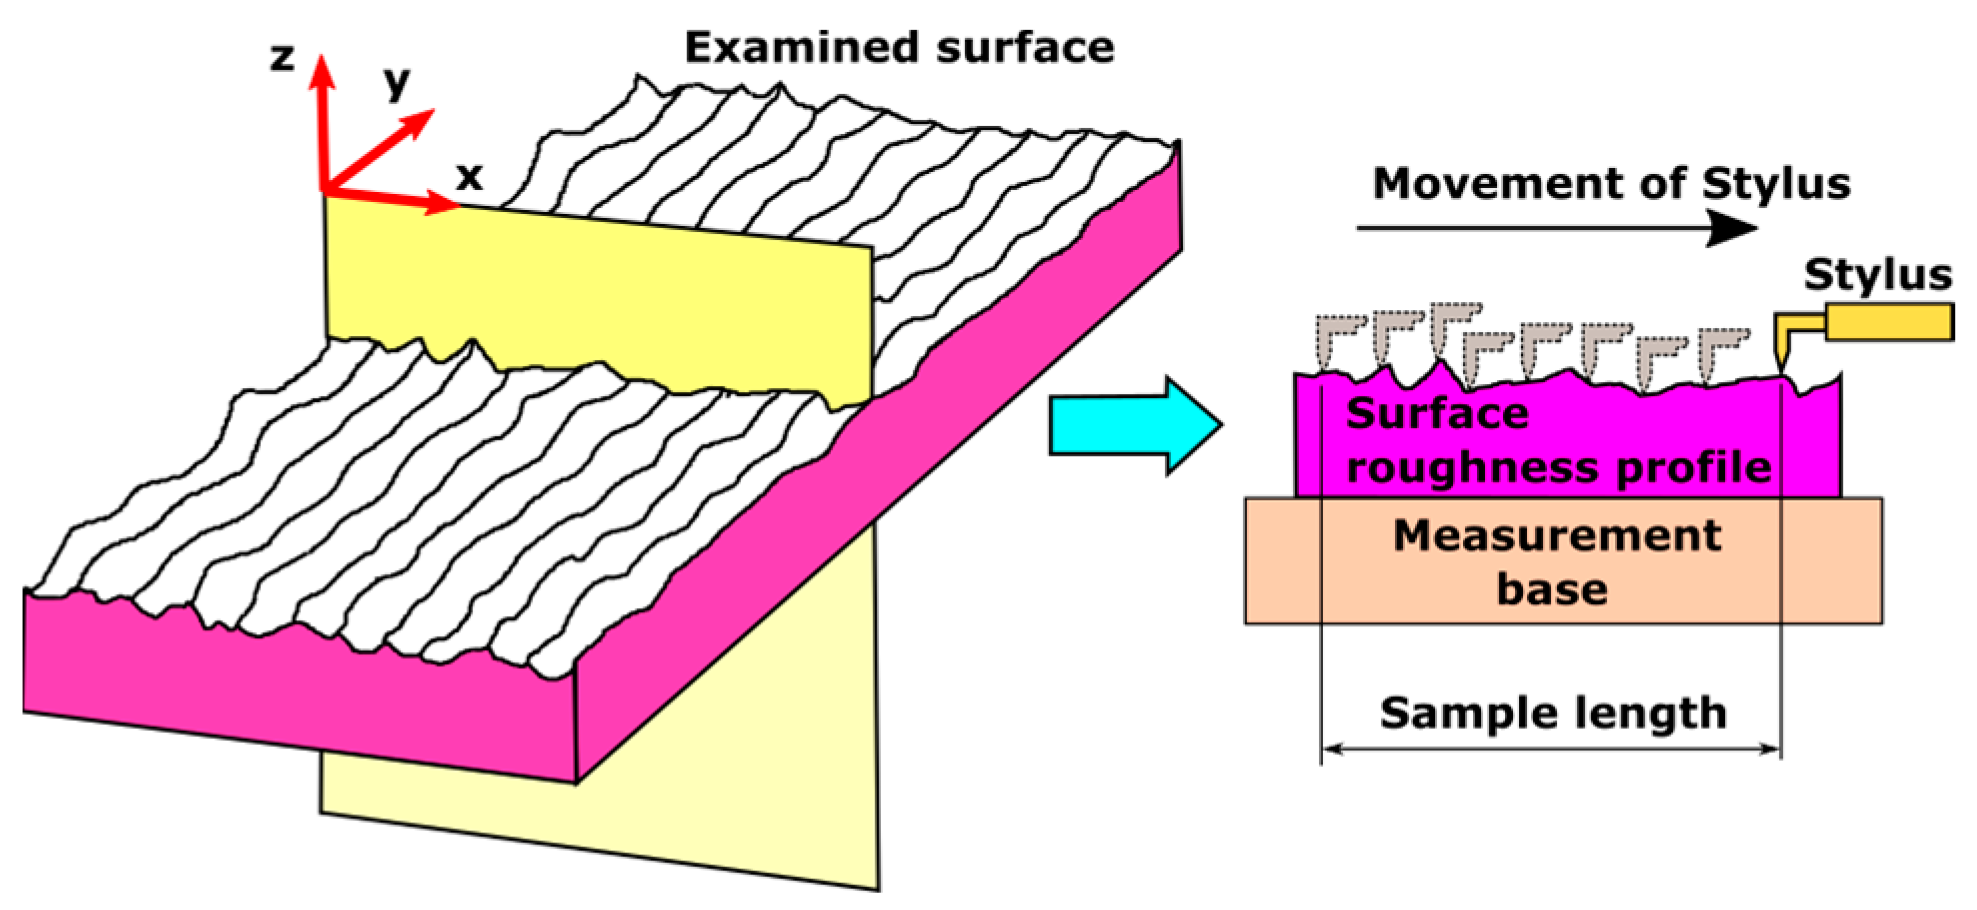
34]. Nevertheless, the following part is focused on the analysis in the course of the choice of cut-off filter for individual technologies, which were used to produce individual samples. Just like the other methods, the stylus-based method encounters a whole range of limiting factors that result mostly from the requirements of its specific implementation, and sometimes there are conflicting requirements that require a compromise solution. This method makes it possible to determine the numerical values of normalized and non-normalized characteristics of surface roughness and then use them for the most modern statistical and spectral assessment of surface unevenness. The implementation of this method is ensured by the stylus-based surface roughness tester, which consists of a mechanical and electronic part (
Figure 1), while the mechanical deflection, generated by the sensing tip, which monitors the surface irregularities of the measured surface, is transformed into an electrical signal in the induction position transducer, which it is further processed and interpreted as a numerical value of the selected surface roughness characteristic, or as a graphic record of the profile of surface roughness.
A touch profilometer is a contact profilometer that brings the stylus tip into direct contact with the measuring surface and tracks or moves along a desired path to determine the topography of the surface. The working principle of a touch profilometer is to analyze the topography of a surface using a probe that physically moves over the surface to obtain surface properties such as height.
An unspecified (due to commercial reasons) stylus-based surface roughness tester was used for experimental measurements. The device allows you to set four different values of the cut-off filter parameter (0.08 mm; 0.25 mm; 0.8 mm; 2.5 mm). However, the manufacturer of the surface tester does not define the maximum permissible error or measurement uncertainty, so it is necessary to determine this uncertainty in some way for measurement purposes.
The surface tester used has a manufacturer-defined resolution for the Z-axis, i.e., for measuring height characteristics with a value of 0.02 µm. This data applies to the largest measurement range that this device has available. Since the device has an automatic selection of the measurement range, for reporting measurement uncertainty, we will consider this resolution value as a potential source of measurement uncertainty.
The resolution is not defined for the
X-axis, but this data can be determined from the sampling that the device performs at individual settings (
Table 1). For individual setting values of the cut-off filter parameter, the sampling for the
X-axis also changes.
This device for evaluating individual quantities uses the course of the surface roughness profile curve with resolution values for individual measurement axes (
X-axis in the horizontal plane and
Z-axis in the vertical plane). These are longitudinal measurements, from which the values of individual surface roughness values are then indirectly determined by calculation in accordance with the relevant standards. Thus, determining the measurement uncertainty for
Ra, for example, is a rather complicated task beyond the scope of this article. In this article, we will attempt at least an approximate estimation of the measurement uncertainty because, in our opinion, each measurement must have an associated measurement uncertainty in order to be able to evaluate the reliability of the mentioned experimental measurements [
41,
42,
43,
44,
45,
46,
47,
48,
49].
Therefore, if we consider the differences in measurement in both directions as a significant source of uncertainty, then we can state them as the standard uncertainty determined by method B:
If we consider that the digital device and the measured quantities follow the uniform distribution law of random values, then we will consider the extended measurement uncertainty with a coverage coefficient with a value of √3 at the significance level of 0.95. Then we will consider the expanded uncertainties of the displacement measurement:
It should be emphasized that this is only a very rough estimate, and for a more precise determination of the measurement uncertainty, it is also necessary to consider the uncertainty resulting from the geometry of the measuring tip, the uncertainty resulting from its elastic deformation during measurement, the uncertainty resulting from lateral movements during measurement, the uncertainty resulting from the noise of the device. It is very complicated to identify all components of measurement uncertainty when using such a complex device.
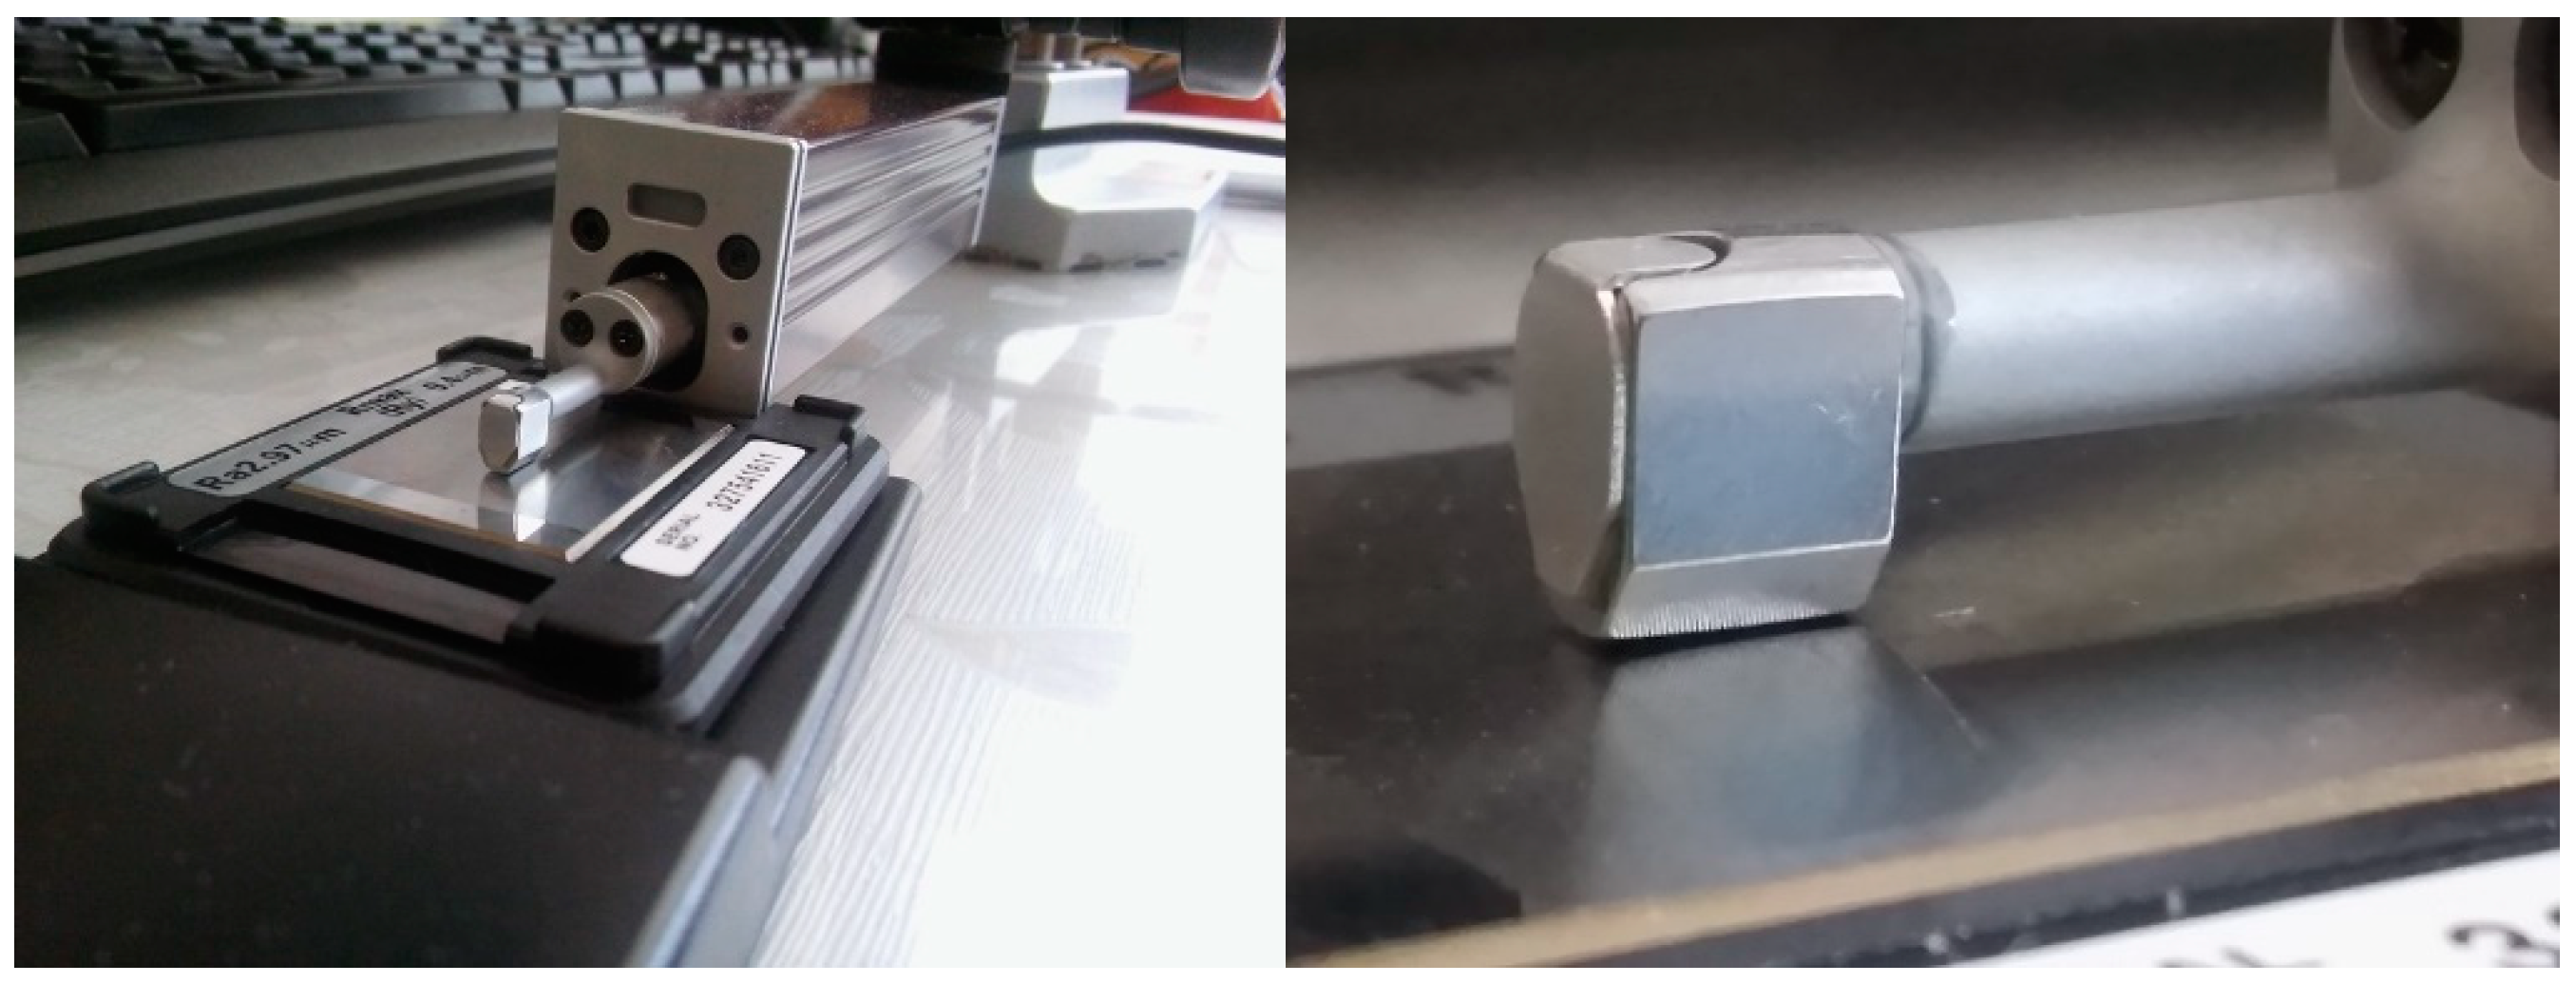
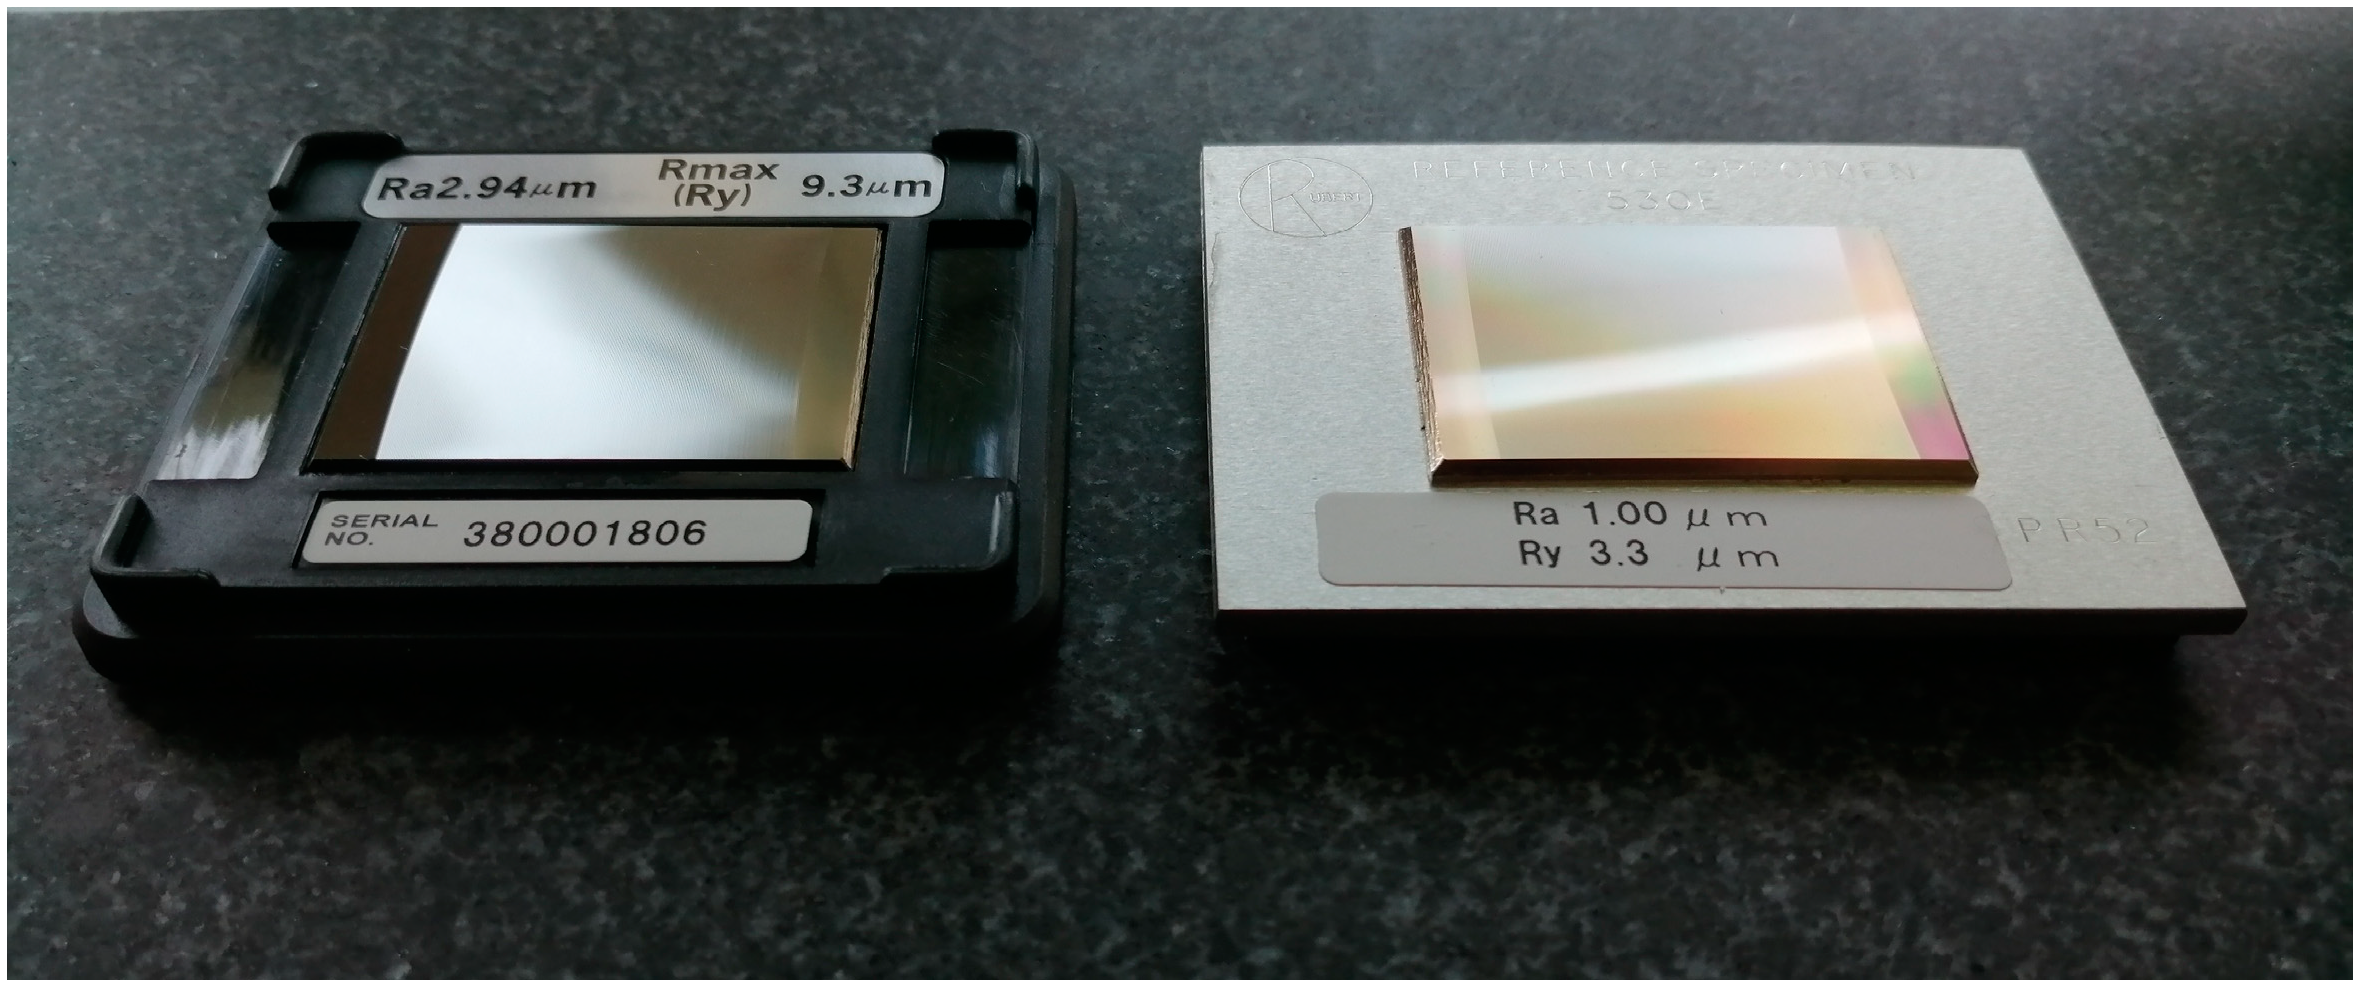
The surface tester used has the function of automatic calibration using secondary surface roughness standards. Secondary surface roughness standards for surface roughness testers, which is a calibration etalon artifact with unidirectional irregular profile of type D1 (according to ISO 5436-1:2000) [
36], is recommended for the calibration of the gauge. For this artifact, the value of
Ra and
Rz is defined. In this work, this function was used, and the calibration process was started before each batch of measurements; after the calibrations, a control measurement was always carried out to verify the calibration process. Likewise, at the end of the measuring dose, a control measurement was carried out to verify the stability of the surface tester calibration. Secondary surface roughness standards for surface roughness testers (
Figure 2) were verified by a superior standard in a certified laboratory, and the uncertainty of this used calibration specimen was determined.
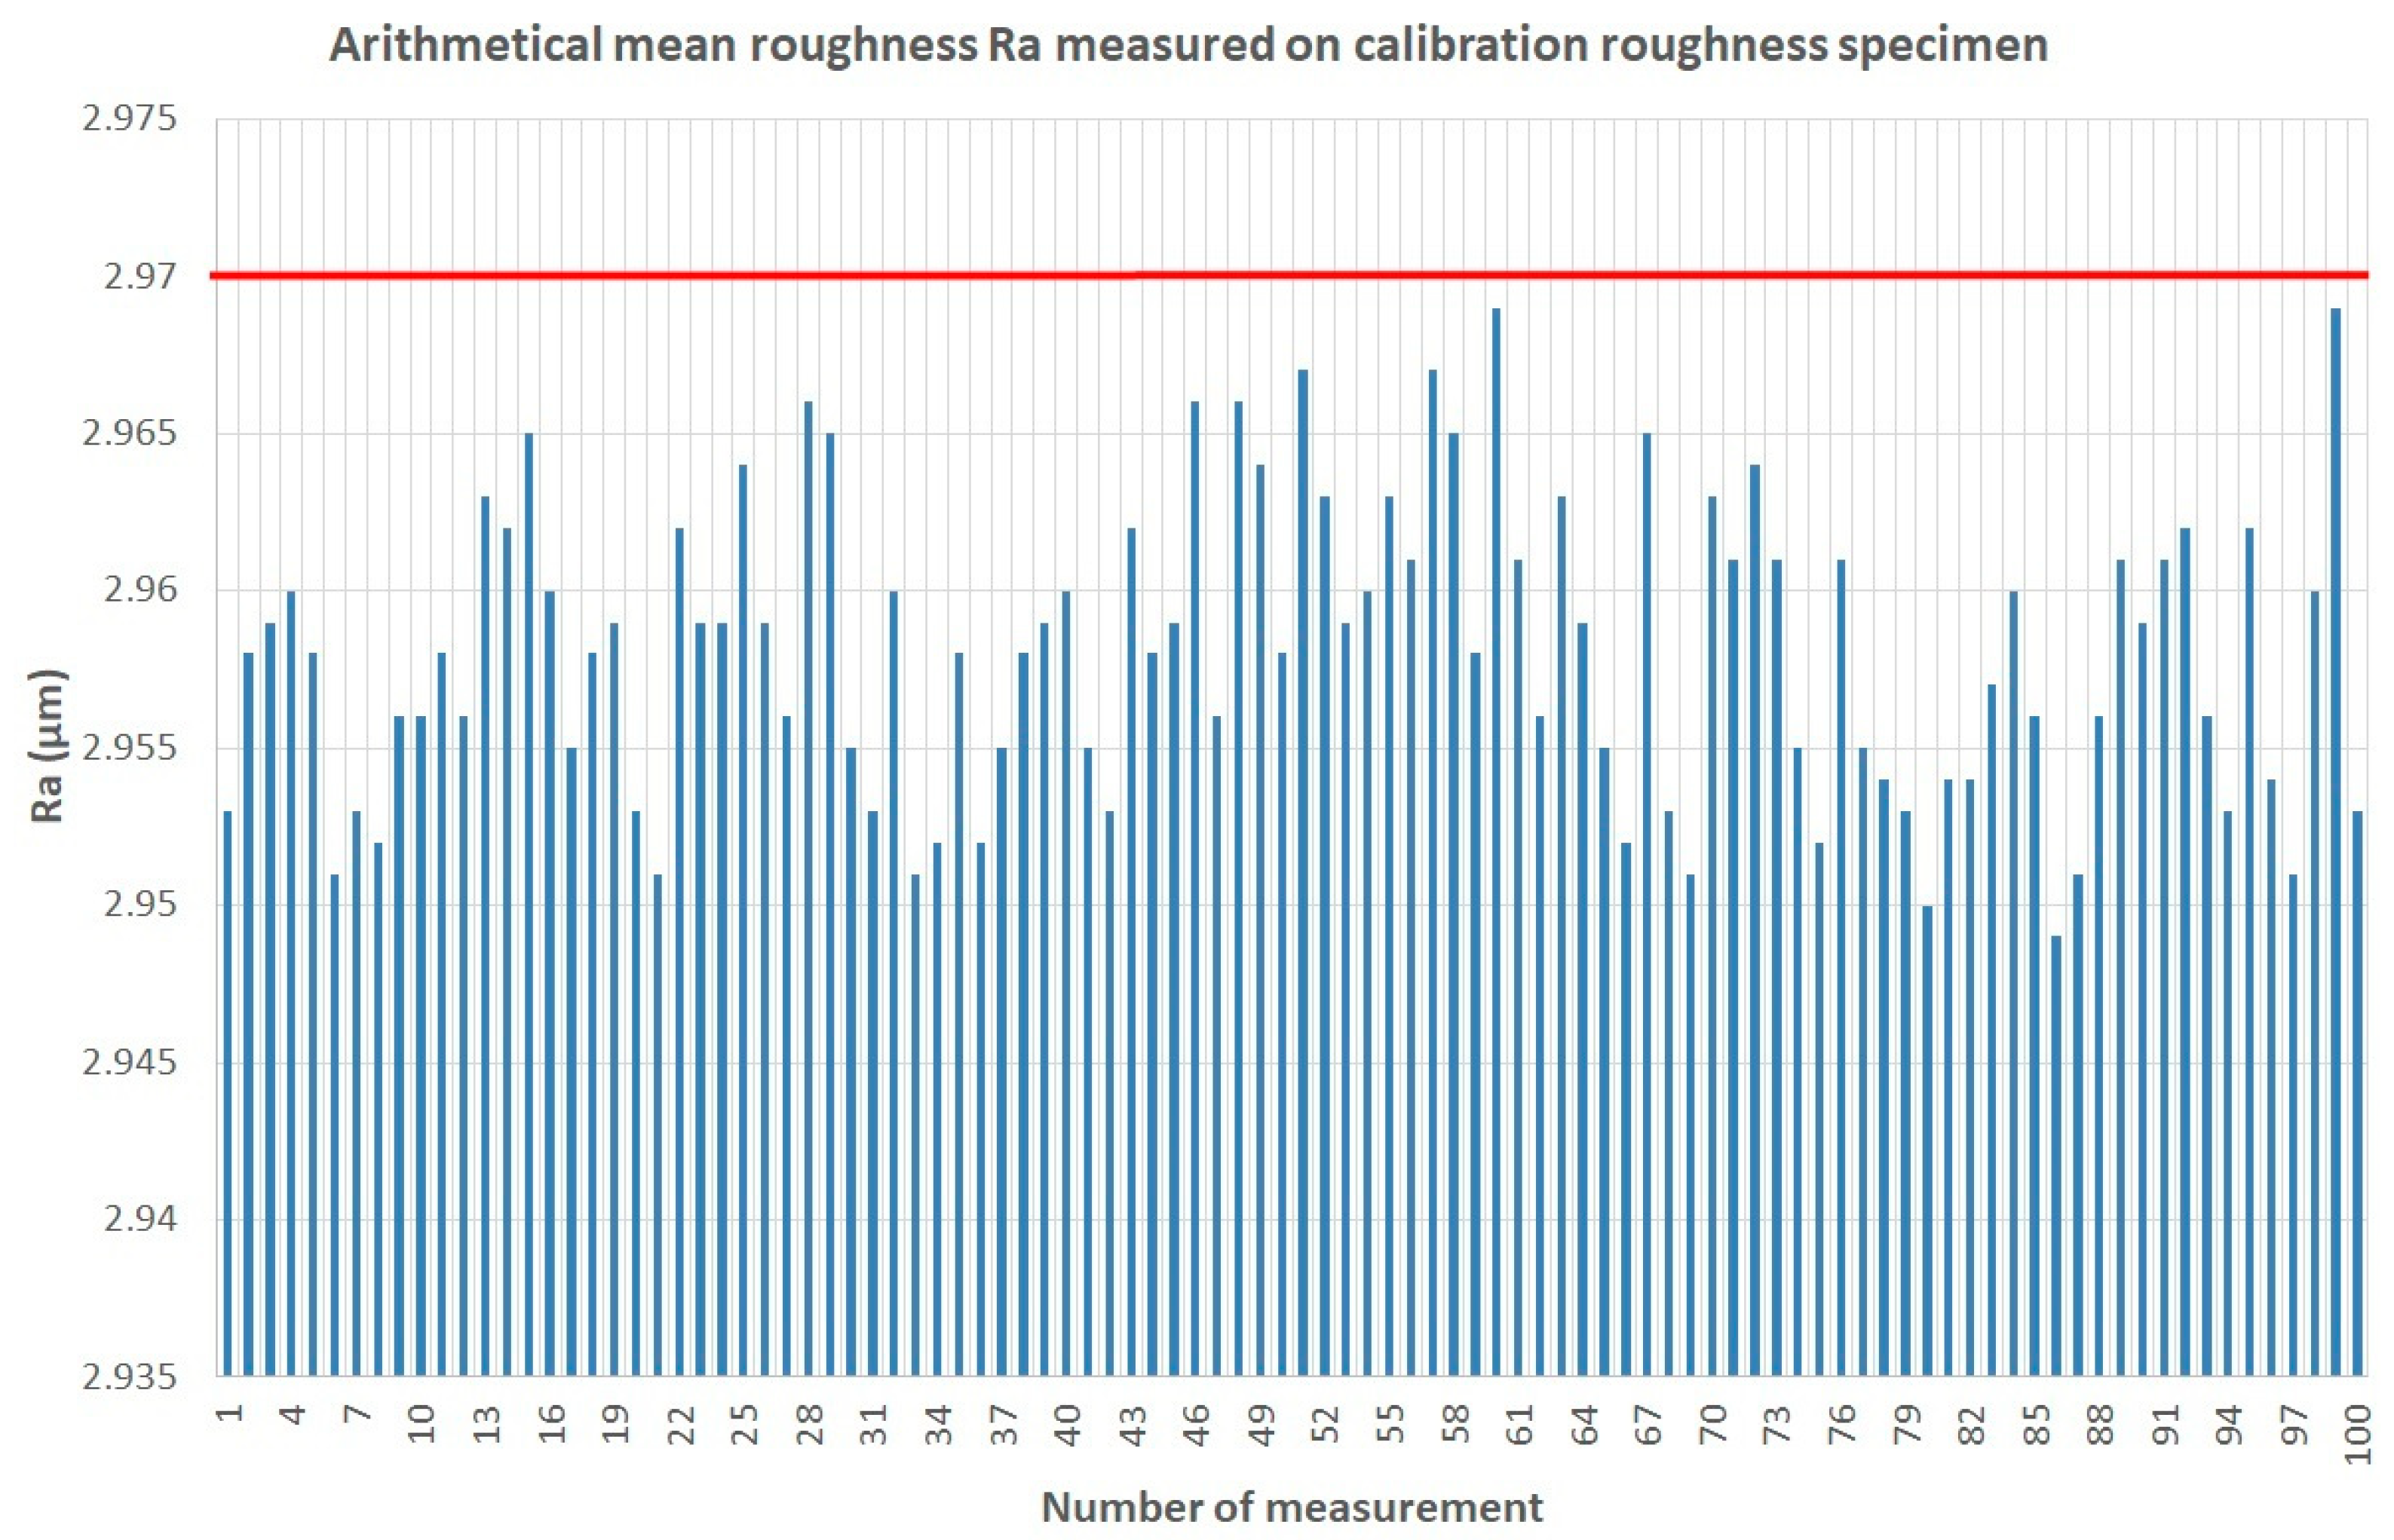
One way to determine the measurement uncertainty is to look at the gauge as a black box and determine the measurement uncertainty from the statistical evaluation of the data measured on the secondary surface roughness standards. For this purpose, 100 measurements were carried out at the same place under unchanged measurement conditions on the secondary surface roughness standard (measured to the standard—ISO 1997 [
33]; 0.25 mm/s;
Lc = 2.5 mm;
X = 5; Gauss). From the measured values, histograms of the frequency of individual intervals of arithmetic mean height of the roughness and standard deviations of the measurement were created.
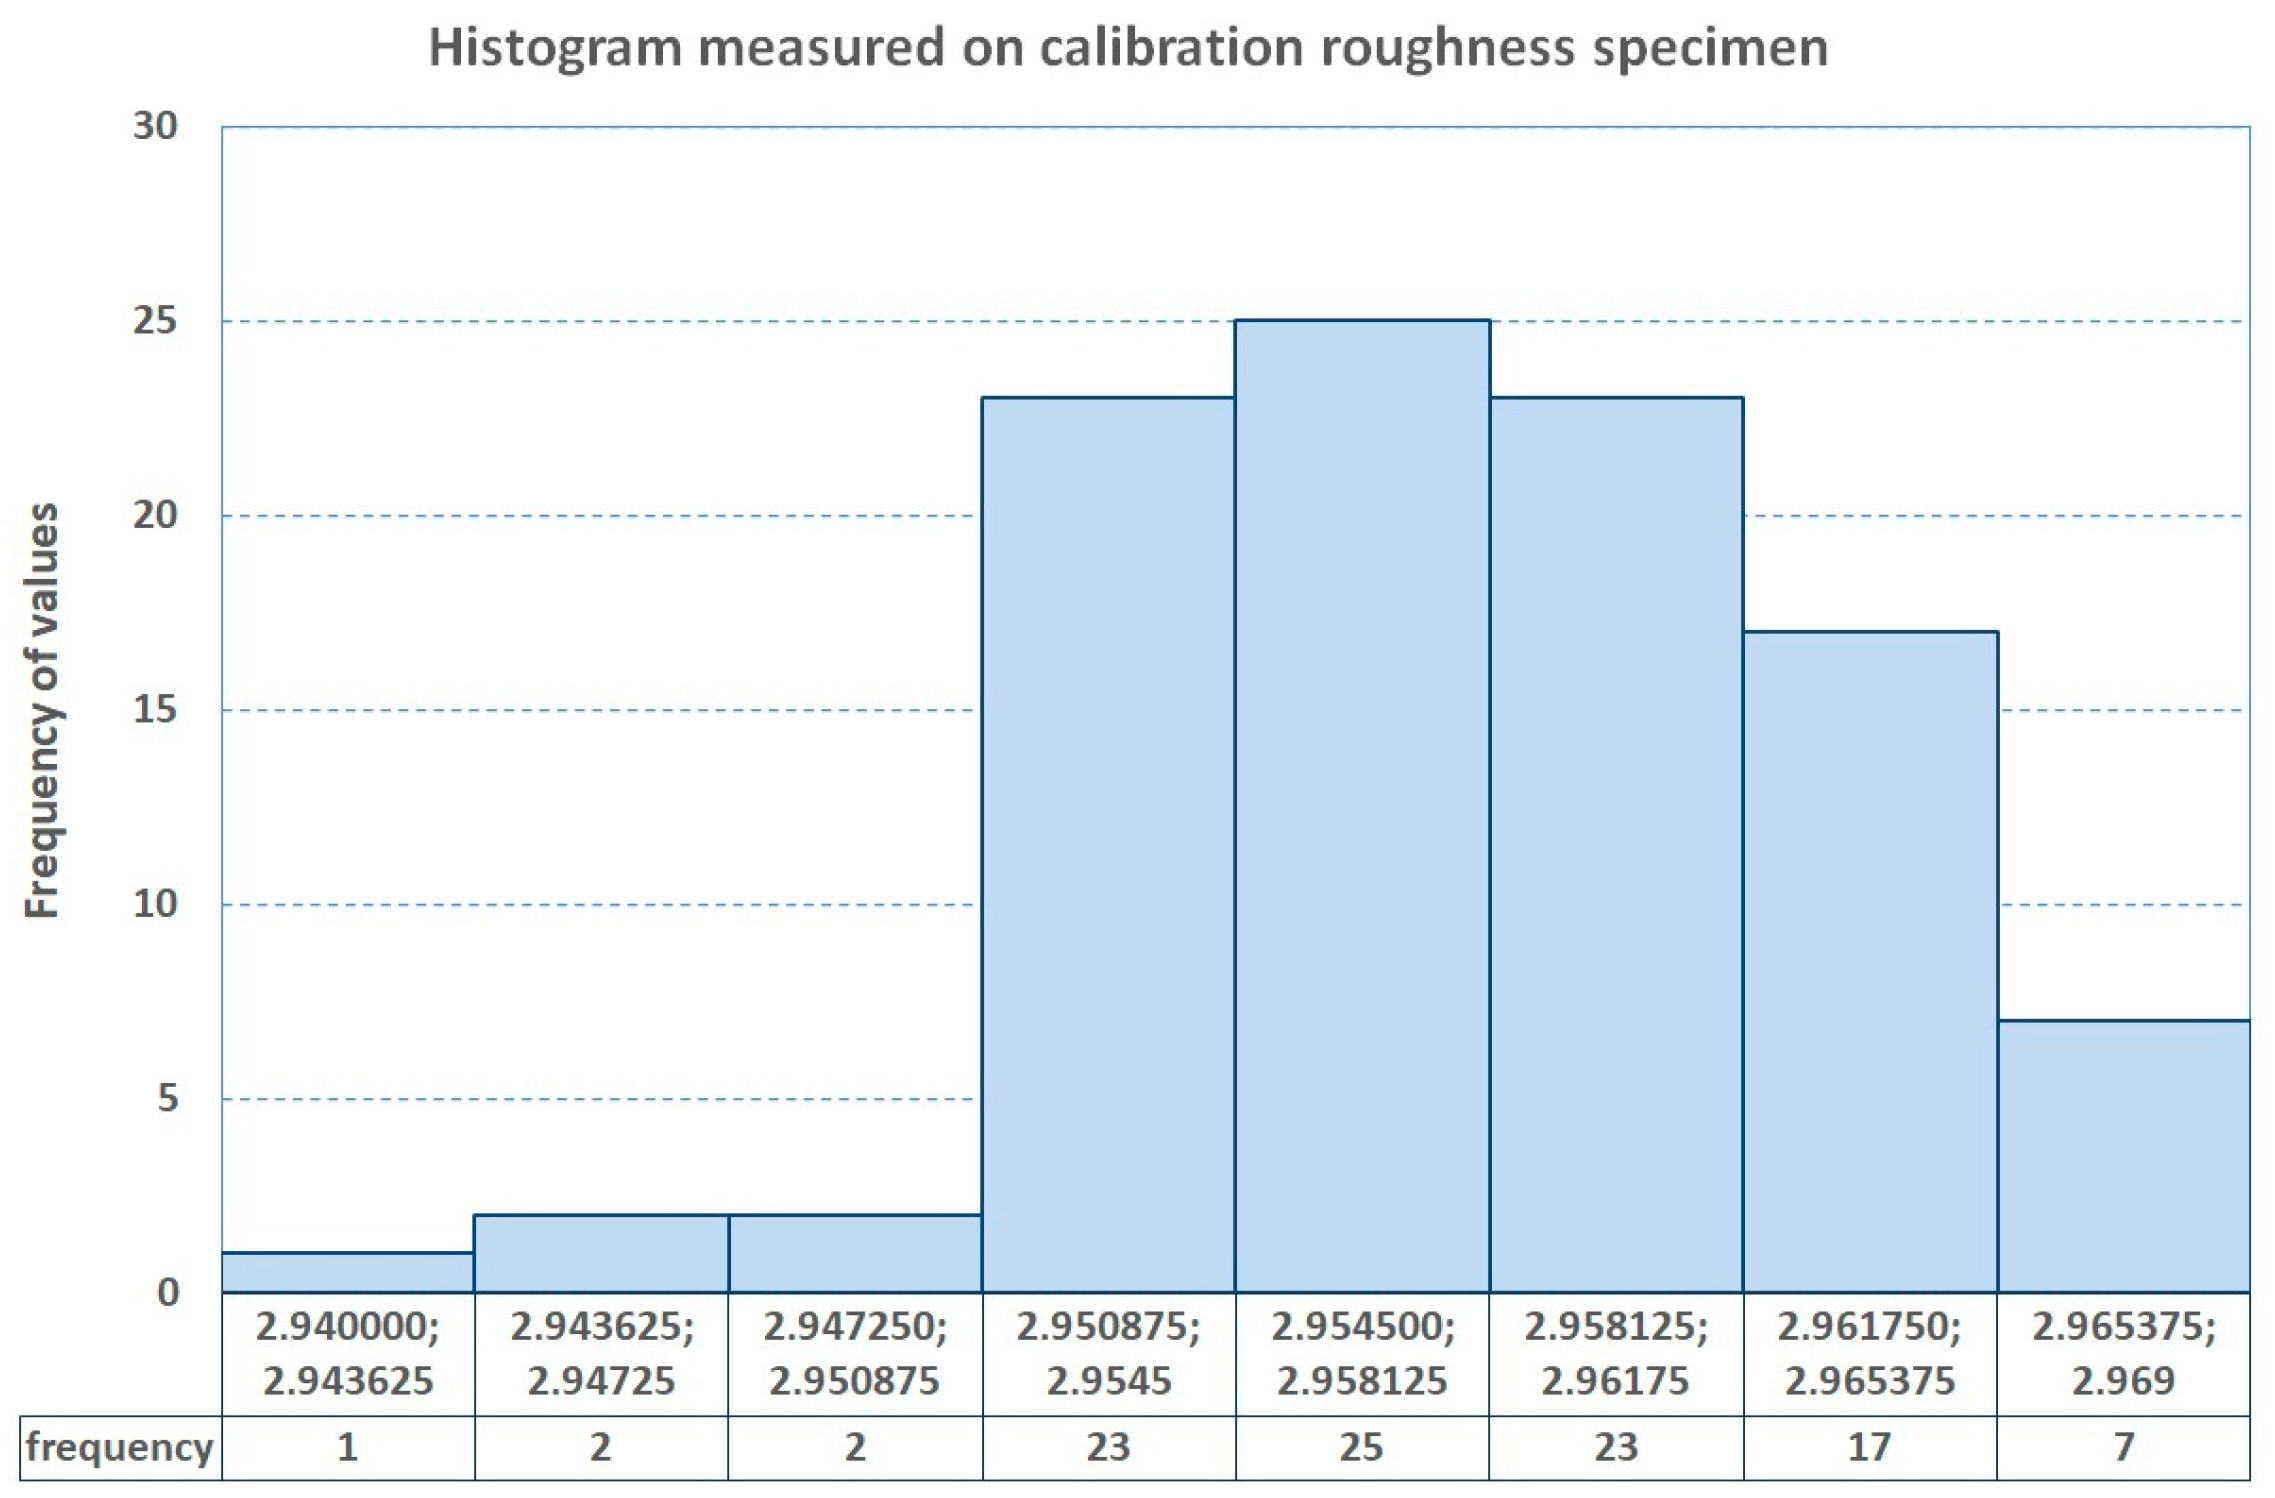
The measurement graph (
Figure 3) shows the variability and range of measured values of the quantity—
Ra for measurement under the same conditions. From these data, it is possible to create a histogram of the frequency of individually measured data (
Figure 4), from which the nature of the distribution of the measured data is visible, so in further considerations, we will assume a uniform law of distribution of the measured data.
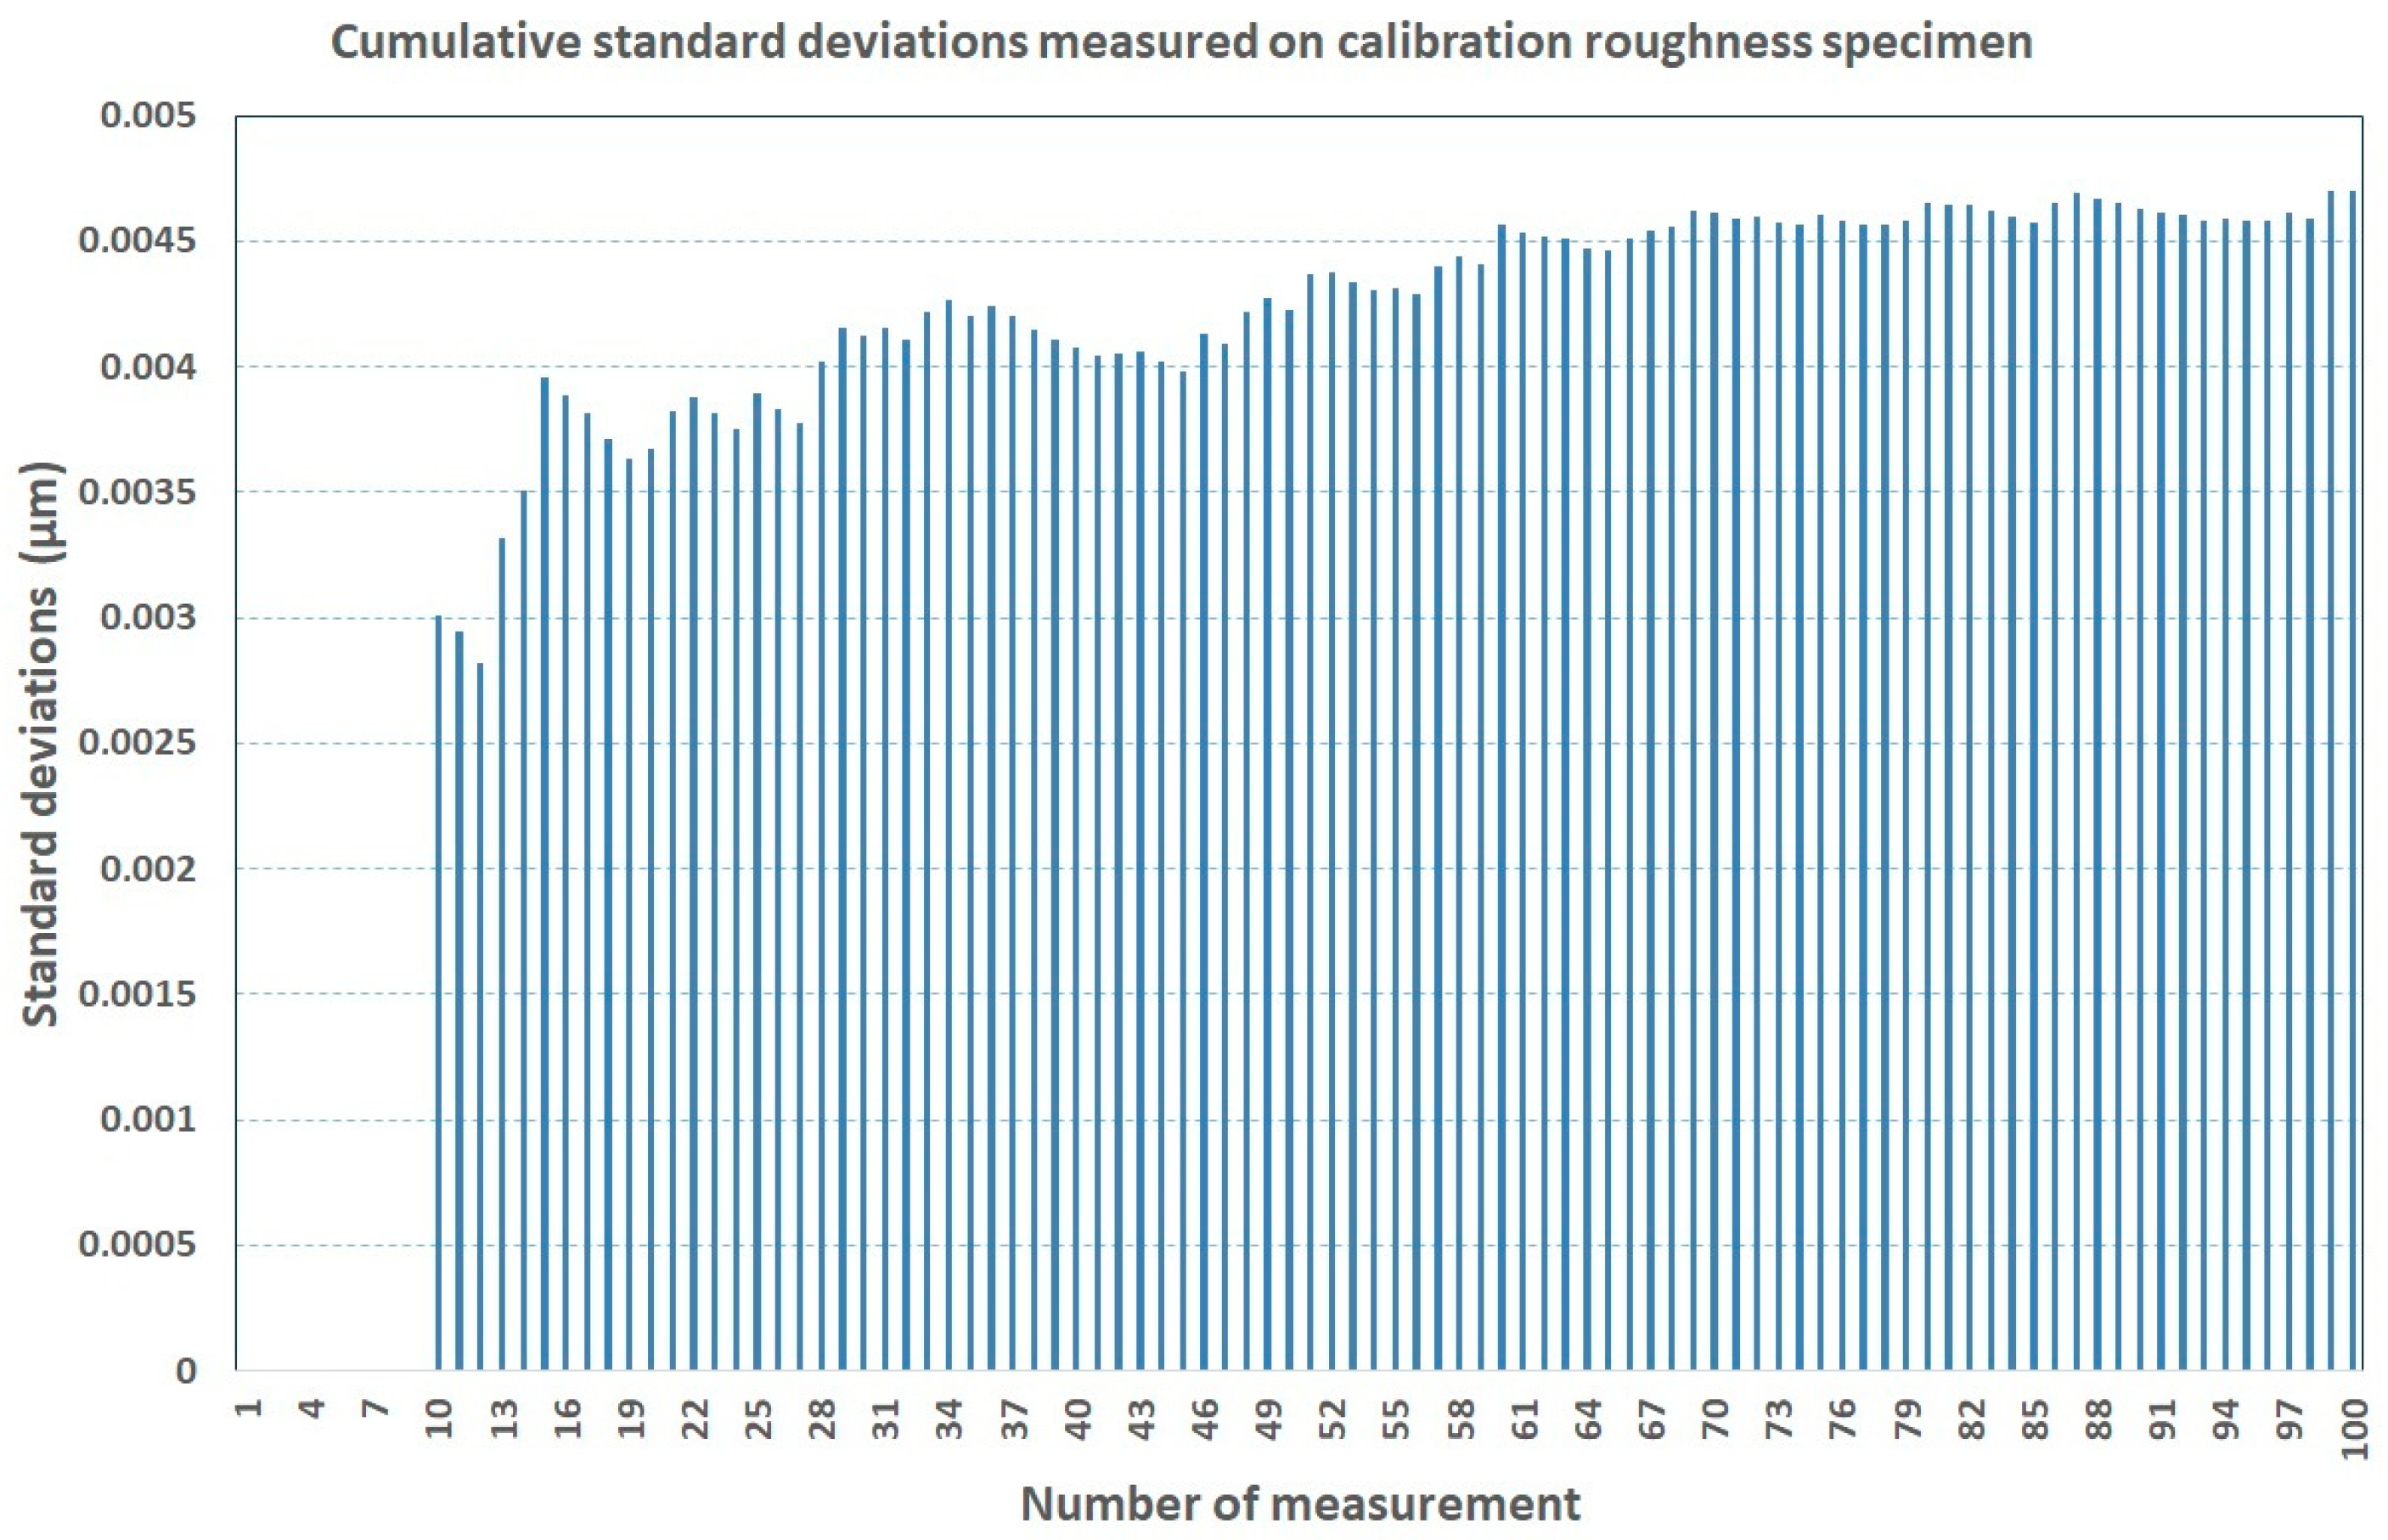
To assess the number of measurements as an indicator, it will be appropriate to use the standard deviation of a series of measurements. The value of these measurements depends on the dispersion of the evaluated values around the mean value. So, the smaller the standard deviation, the smaller the dispersion of the data. The evaluation of the standard deviation is therefore carried out in such a way that the standard deviation of a series of measurements is gradually determined, which is recalculated after the addition of each additional measurement. Therefore, we designated it as the cumulative standard deviation (
Figure 5). At the moment when the cumulative standard deviation stops changing, it means that the number of evaluated values has been reached, which will no longer improve the uncertainty of the measurement result. At the same time, these standard deviations give us the answer to the course of the standard deviation with the increasing number of measurements, and thus it is possible to obtain the maximum standard deviation of a series of measurements (
Figure 5).
From the stated values of standard deviations, it is possible to consider the maximum value Zmax = 0.005 µm for the standard uncertainty of measurement and evaluation of the quantity Ra for this device. However, the Secondary Surface Roughness Standard itself also contributes to this uncertainty. However, this uncertainty is still very small. This means that the device itself will not show a large measurement uncertainty, and the dispersion of the measured data will instead be related to the dispersion of values as a result of the implemented technology for the surface treatment of the component.
3. Experiments
Quantities of surface roughness are precisely defined in the standard, but obtaining the correct value of these quantities by measurement depends on the correct choice of measurement parameters. These include cut-off filter settings, evaluation standards, number of section lengths, and measuring speed.
Important factors to consider when assessing surface roughness using a stylus-based surface roughness tester:
- -
The size of the measured irregularities must be appropriate to the measuring range of the sensor (vertical stroke); irregularities exceeding its size of the maximum value of vertical lift cannot be measured.
- -
The set value of the sensed length should include 5—a multiple of the section length plus the start-up and run-down path of the sensor; if it is not possible to meet this requirement (e.g., due to the size of the measured area), it is necessary to take into account that the result of the measurements will be affected by the failure to meet the requirement.
- -
The object to be measured must be clamped, orientated spatially, and the sensor must be placed appropriately on the measured surface; for this, it is necessary to choose the appropriate shape of the sensor with regard to its diameter, length, the possibility of fitting the bottom of the groove, the possibility of measuring on roundness, etc.; in case of inadmissibility of the place of measuring the surface roughness of the profilometer sensor, replicas (imprints) of irregularities can be used in plastic film (or other suitable material) and the profile of the irregularities can be taken from this film (negative of the irregularities).
- -
Corresponding working conditions must be set, including measuring range, sensed length, filter type, basic length (cut-off) of the filter, and speed of the probe.
The measurement conditions during the measurements were as follows:
The surface tester was equipped with a stylus with a sliding tip. The tip of the stylus rides in a line across the surface, moving vertically over the peaks and valleys of the evaluated surface. Changes in the stylus’ height are registered electrically and tracked against the position as the stylus moves, creating a measured profile. The shape of the stylus is conical with a spherical tip with a radius of 2 μm and a tip angle of 60°, and it is pressed with a measuring force of 0.75 mN. The skid force is less than 400 mN. The cone angle and tip radius determine the smallest features that a stylus can trace.
The relative humidity was in the interval (65 ± 5)%, and the temperature was (20 ± 2) °C.
The measurement methodology encounters several problems that need to be defined—here, it must be remembered that even the setting of the measurement conditions can have an impact on the result of the evaluation of the arithmetical mean deviation of the assessed roughness profile. It is, therefore, necessary to give an answer to the question of what this effect is and how to choose individual measurement conditions when assessing surface roughness.
The following measurement conditions are investigated:
- -
Choice of cut-off filter λc (or textual equivalent Lc): 0.08 mm; 0.25 mm; 0.8 mm; 2.5 mm; 8 mm (the surface tester, which is available for experiments, does not have the setting of the value Lc = 8 mm).
- -
Choice of standard for evaluation: ISO 1997 [
33,
34,
35,
36,
37,
38,
39,
40], JIS 1982 [
50], JIS 1994 [
51], JIS 2001 [
52,
53,
54,
55,
56,
57,
58], ANSI Gauss [
59,
60,
61,
62], ANSI PC 75 [
59,
60,
61,
62], VDA, [
63,
64,
65].
- -
Selection of speed of the sensing tip (stylus): 0.25 mm/s; 0.5 mm/s; 0.75 mm/s.
3.1. The Influence of the Choice of Standard and the Measuring Speed of the Surface Tester’s Sensing Tip on the Evaluation of the Arithmetic Mean Height of the Roughness Ra
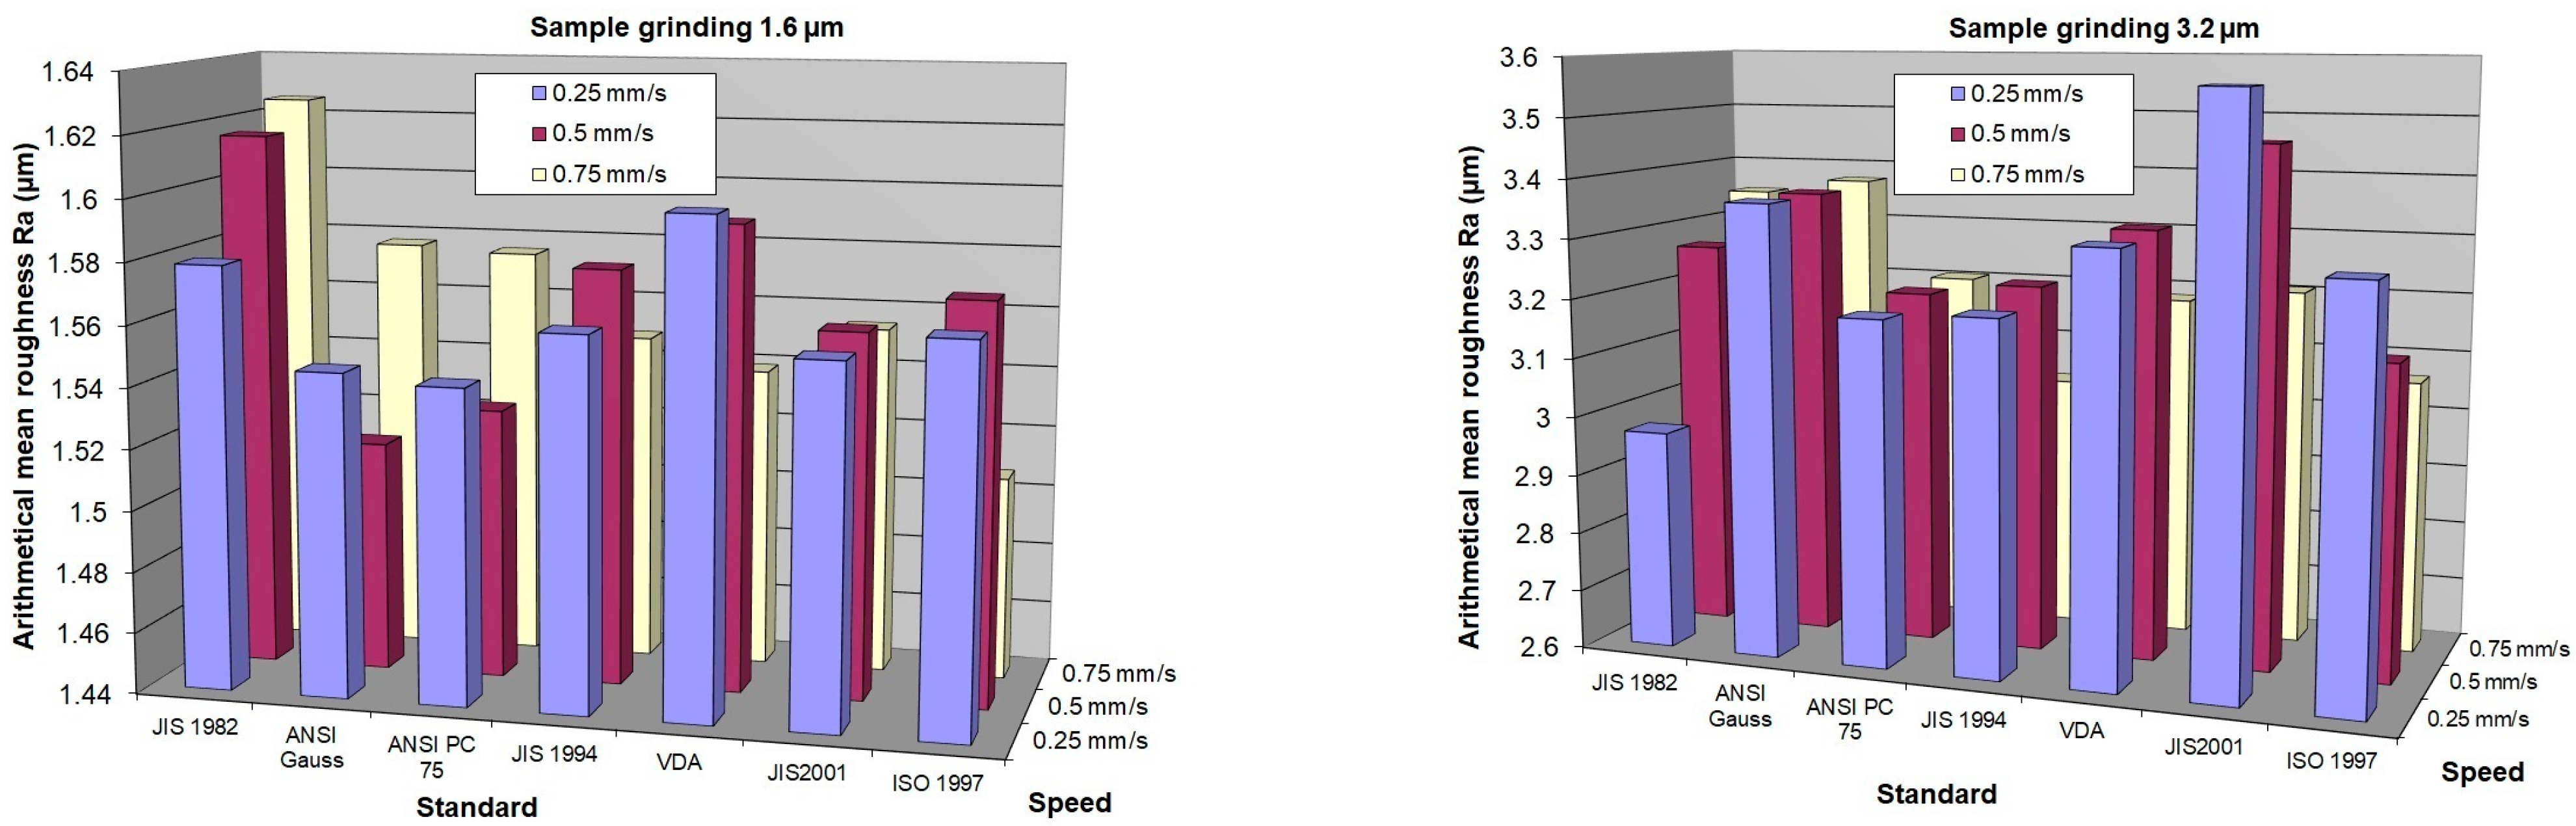
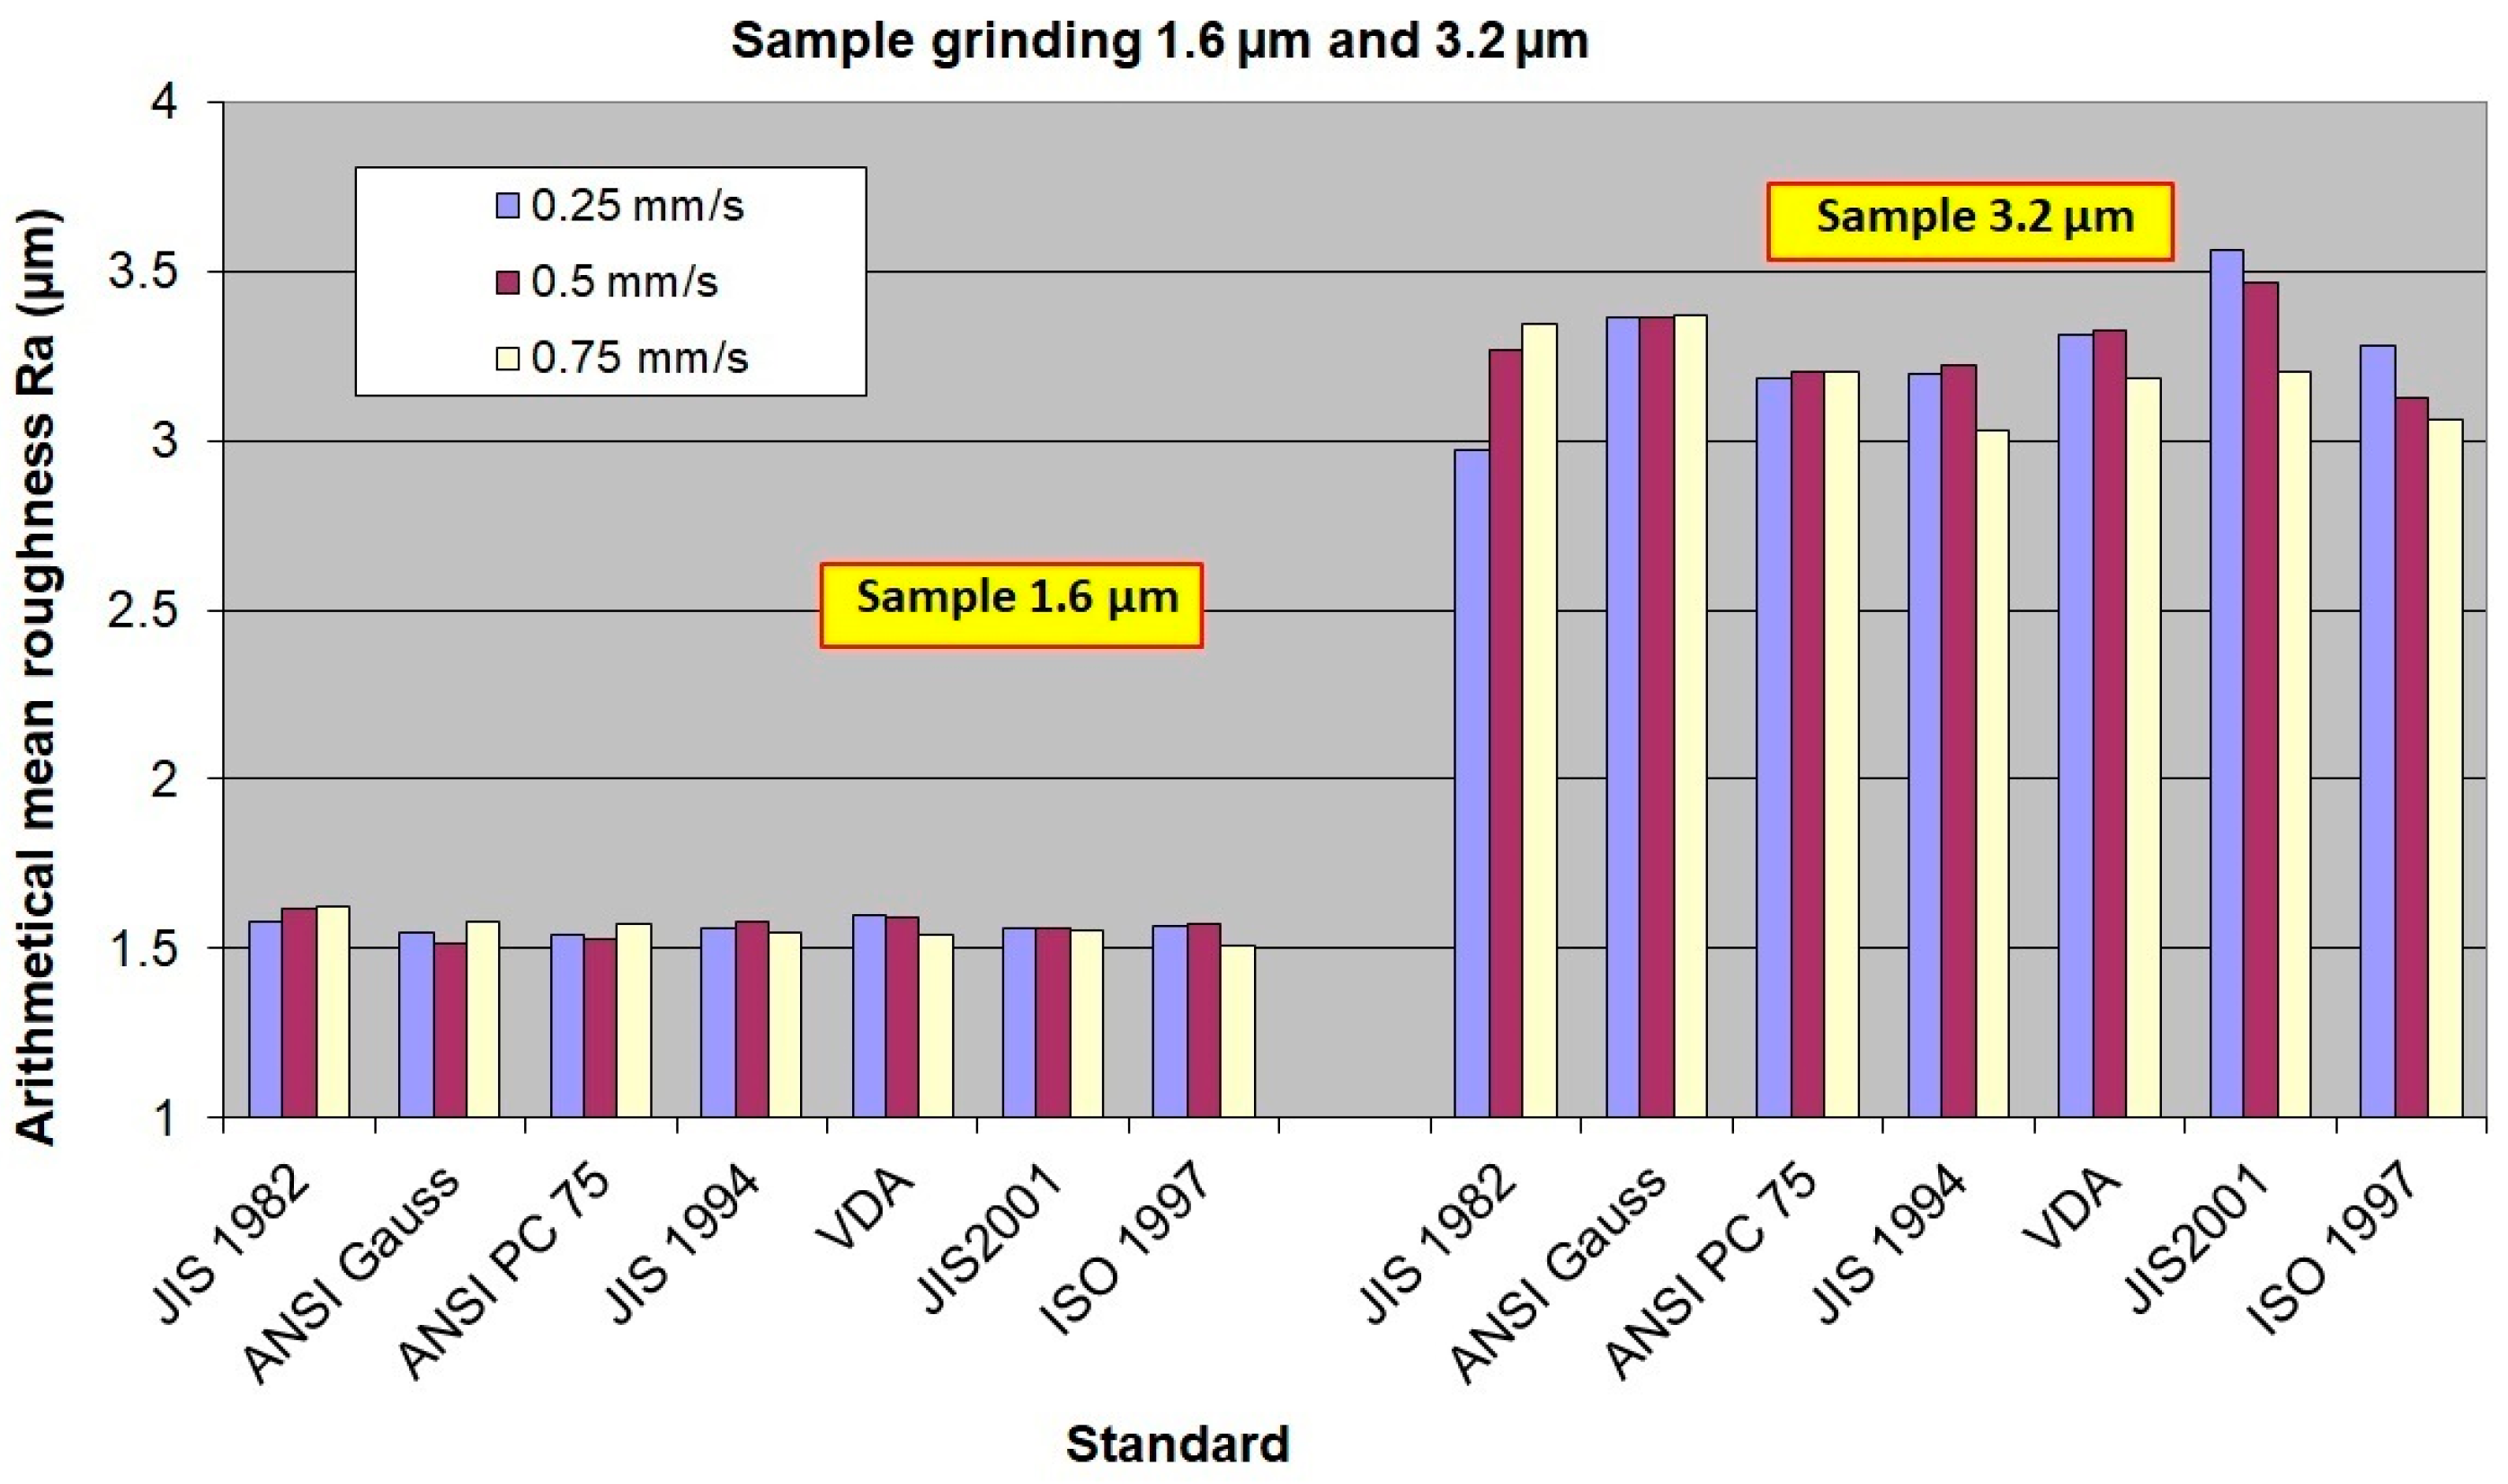
In this part, the influence of the selection of the measurement speed of the sensor tip displacement and the influence of the selection of the standard for the evaluation of the surface roughness values are assessed. Experimental measurements were carried out on the surface roughness standard (
Figure 6 and
Figure 7) for grinding with nominal values of
Ra = 1.6 µm and 3.2 µm. For each combination of the selected speed of the sensor and the evaluation standard, ten measurements were carried out at the same place in order to exclude the variability of the standard sample.
The influence of the selection of the evaluation standard and the selection of the sensor movement speed has an effect on the resulting
Ra value. It can be concluded that for some standards, this influence is negligible, but for some standards, it is visible that increasing the speed of the sensor movement tends to reduce the resulting
Ra value, and this influence is visible mainly for samples with a larger
Ra value. It seems like a good choice to use the speed of movement of the sensor with a value of 0.5 mm/s, and the standard of evaluation can be selected according to the country where the evaluation is carried out. For our conditions, we will prefer evaluation according to the ISO 1997 [
33,
34,
35,
36,
37,
38,
39,
40] standard in further experiments.
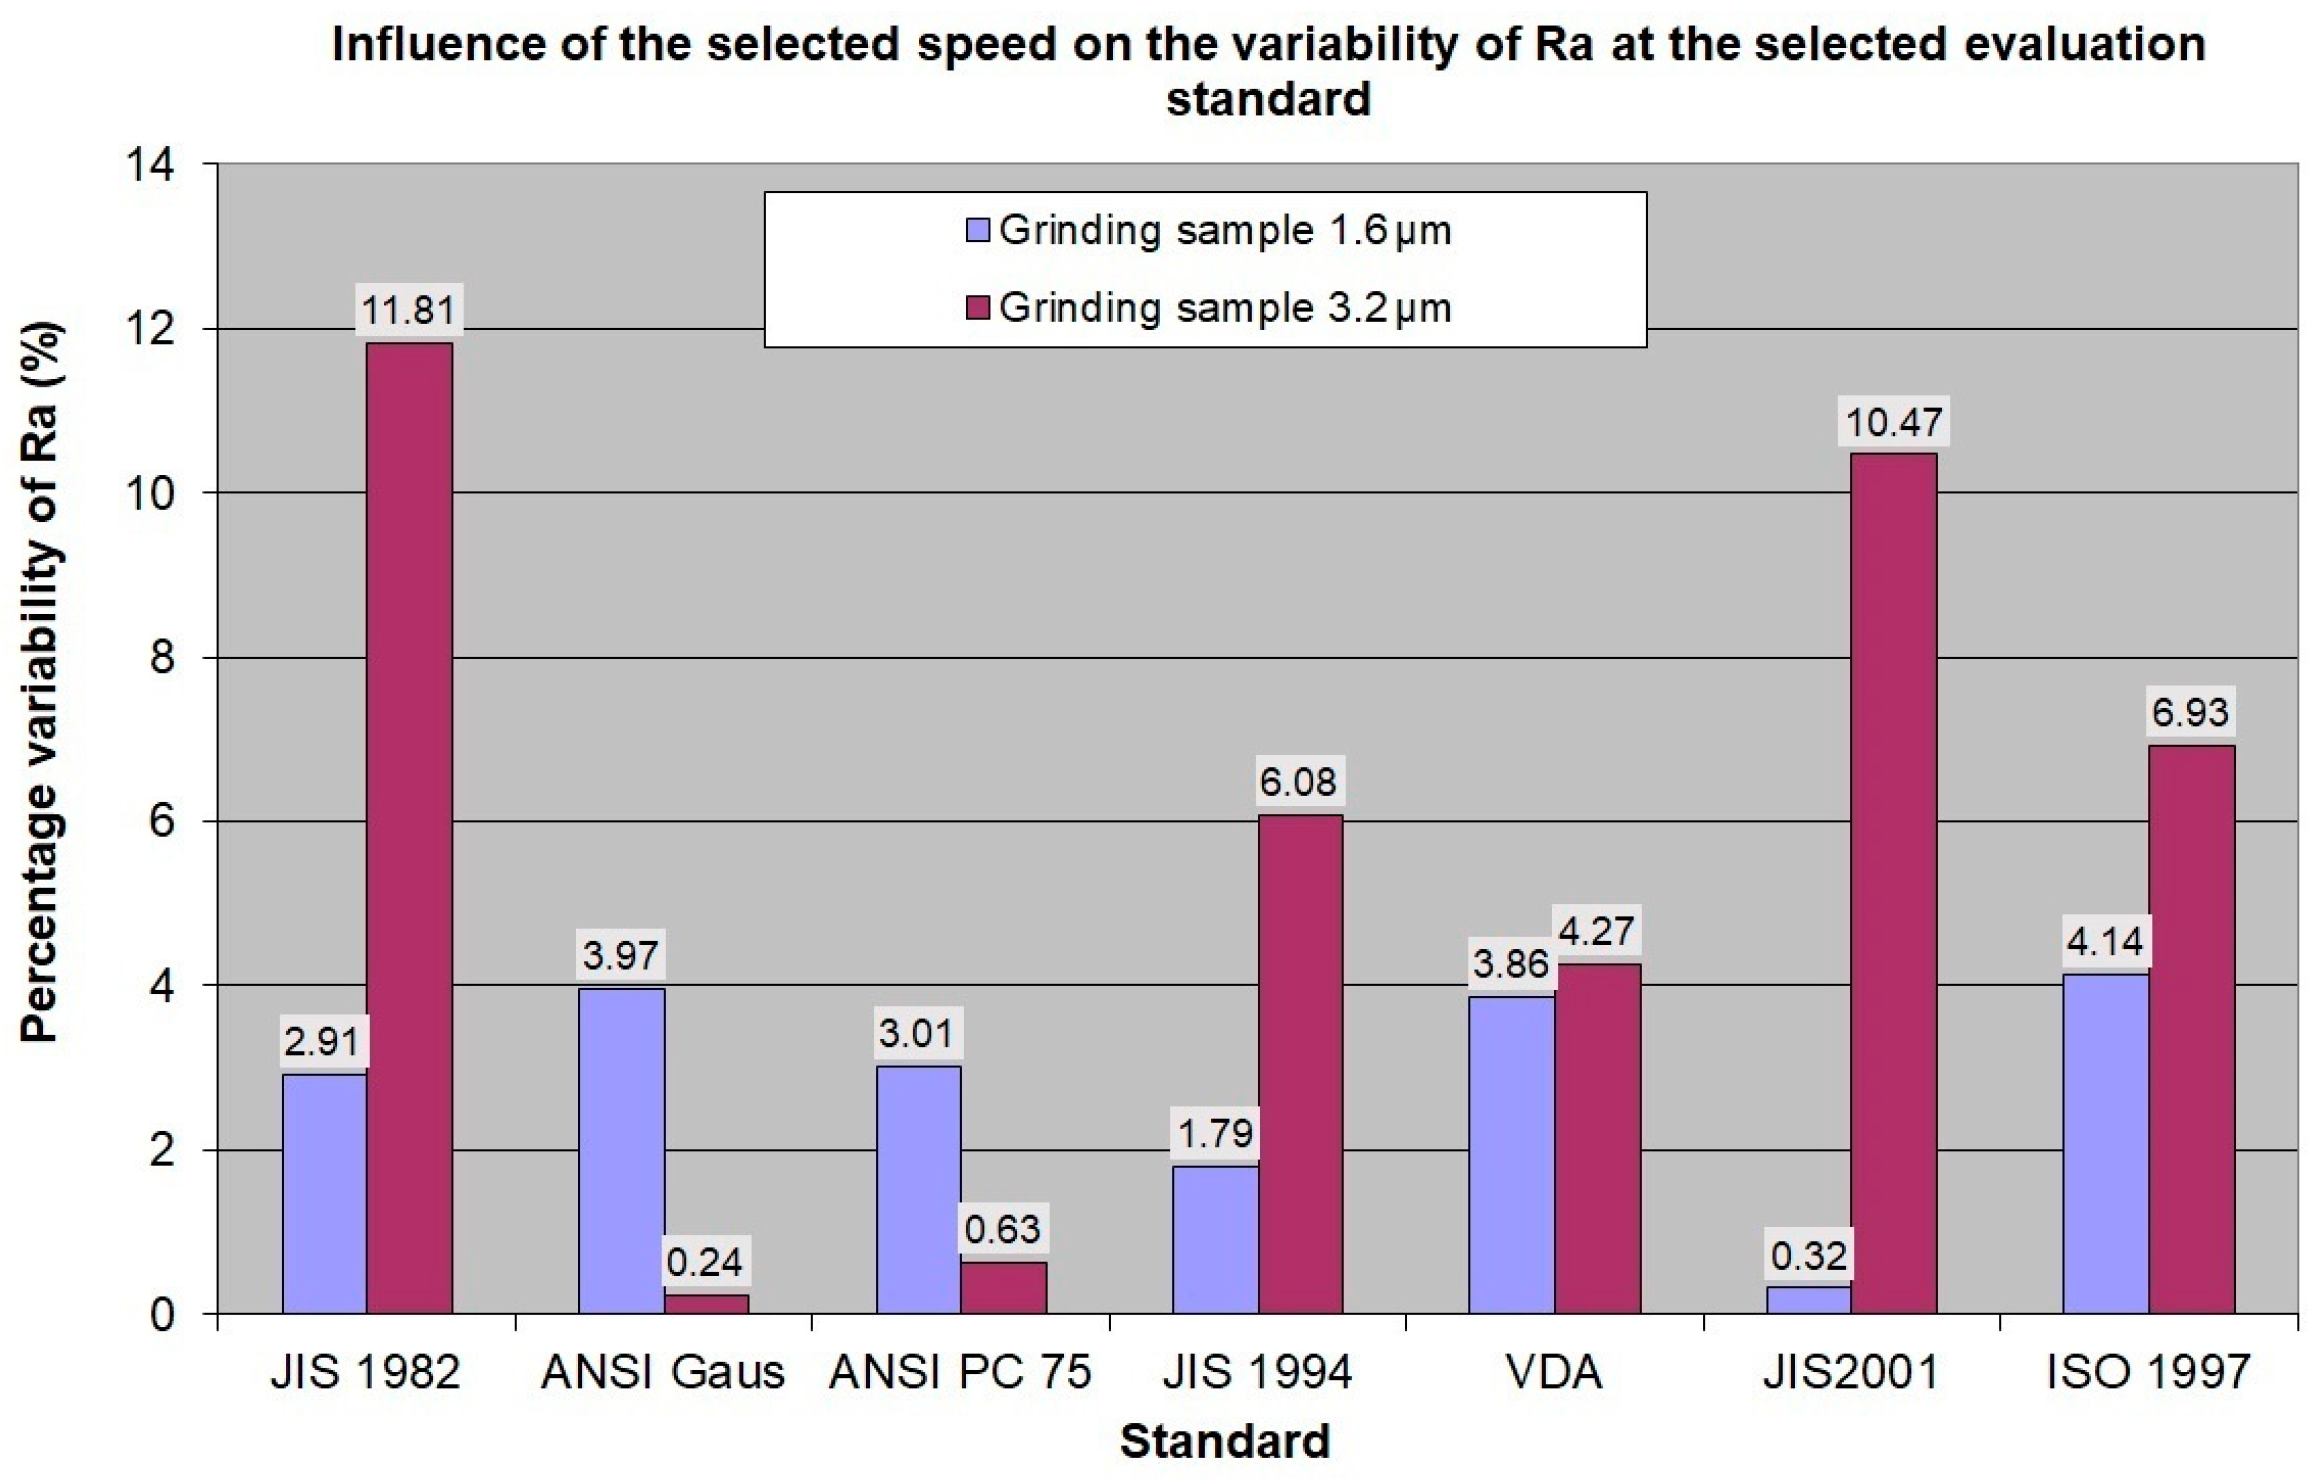
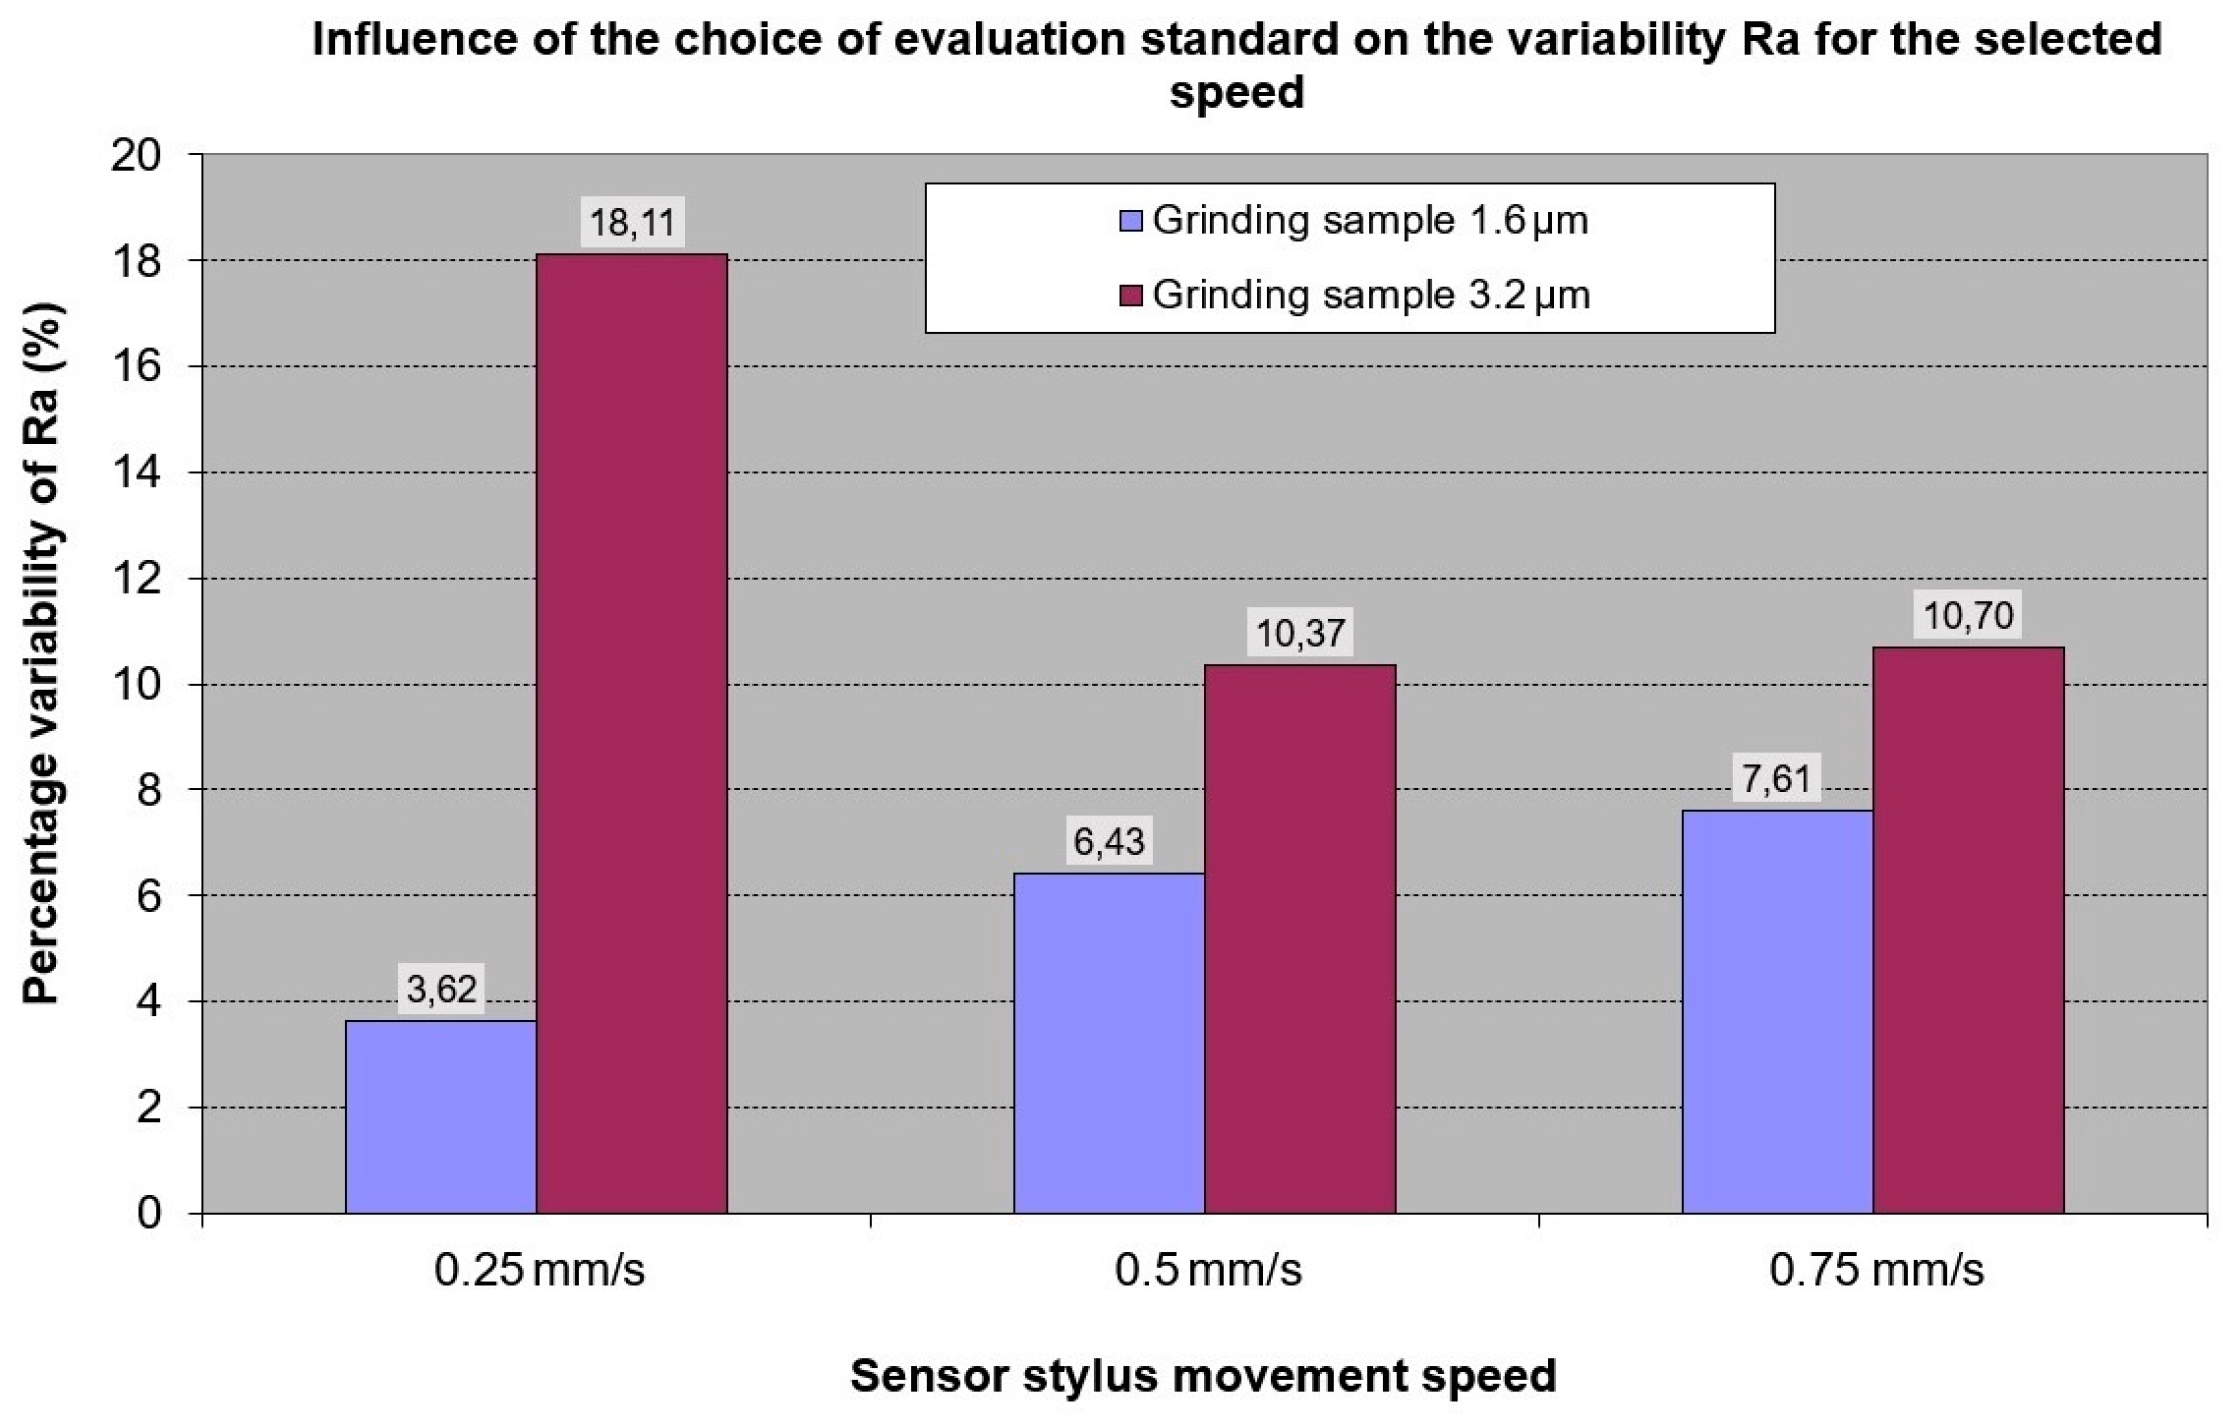
The variability of the measured and evaluated Ra data obtained under the same conditions is also an interesting indicator for assessing the influence of the selection of the evaluation standard and the selection of the speed of the sensor movement.
The variability of the data, depending on the selection of the evaluation standard and the speed of the sensor movement, is expressed in percentage terms with respect to the average evaluated values of
Ra and is shown in the following figure. The evaluation shows that the variability of the
Ra data is in percentage terms up to a maximum of 18% (
Figure 8).
Evaluations according to JIS1982 [
50,
51] and JIS2001 [
52,
53,
54,
55,
56,
57,
58] standards have the greatest variability of Ra, and evaluations according to ANSI and VDA standards have the smallest variability. The ISO 1997 [
33] and JIS1994 [
51] standards are somewhere in the middle of these percentage expressions of variability. From these experiments, it can be concluded that the evaluations according to the JIS1982 [
50] and JIS2001 [
52,
53,
54,
55,
56,
57,
58] standards had the greatest sensitivity to the change in the movement speed of the sensor. However, this result may also depend on the specific sample on which the experiments were carried out (
Figure 9).
In measurements where the speed of the sensor’s movement did not change, and the standard of evaluation was changed, it can be seen that at a speed of 0.25 mm/s, the evaluations of Ra are most sensitive to the choice of the standard according to which the evaluation took place. For speeds of 0.5 mm/s and 0.75 mm/s, this effect was smaller.
Based on the above results, we decided to use a speed setting of 0.5 mm/s in further experiments, and we will use ISO 1997 [
33,
34,
35,
36,
37,
38,
39,
40] as the evaluation standard.
3.2. The Influence of the Cut-Off Setting on the Evaluation of the Arithmetic Mean Height of the Roughness Ra
According to the cut-off value
λc (or the text equivalent
Lc), the recommendation is also for the choice of the second parameter cut-off
λs (or the text equivalent
Ls) according to
Table 2 [ISO 11562; ISO 3274] [
35,
40]. Both values must be set before measuring the assessed surface of the component. This applies except for the VDA [
63,
64,
65], JIS1982 [
50], and JIS1994 [
51] standards, where this parameter is not used.
When choosing the parameters of the cut-off filter, the parameters of the stylus tip must also be taken into account. The recommended combinations of
λc,
λs, and stylus tip radius are shown in ISO 3274:1996 [
35]. The used roughness gauge has a stylus tip that has a radius of 2 μm and an angle of 60° and is pressed with a measuring force of 0.75 mN (
Table 3). Some types of surface testers allow you to select only the
Lc parameter, and the second parameter of the cut-off filter is automatically set. However, there are also surface testers that allow you to independently set both parameters of the cut-off filter, so the mentioned standards provide a recommendation in the form of a table (
Table 3) for choosing these settings. In some cases, the surface tester also allows the replacement of the stylus and thereby changing its geometry, where the standards bring certain recommendations.
Similarly, the newer standard ISO 21920-3 [
47] introduces default settings for functional parameters (
Rk,
Rpk,
Rvk, etc.) and R- and W- parameters without defined defaults (
Table 4). The so-called setting class, while the difference is only in the values of the parameter
λs.
The problem is that if we determine the Ra of the assessed surface, we choose L-filter Lc. If, for example, we choose a too-small value of L-filter Lc for the sample, then the result is Ra with an almost zero size. However, if we choose a value of Lc that is too large, then the value of Ra may also include the effect of waviness and will distort the value of Ra. The mistakes we make when choosing a bad cut-off can be huge and can have a fatal impact on the result of evaluating the roughness of the surface of the component under consideration. We will try to solve this problem in this work.
For the practical measurement of surface roughness parameter values, it is important to choose the L-filter
Lc (the cut-off value for the stylus-based surface roughness tester) in such a way that it includes a sufficient number of profile irregularities characterizing its roughness and at the same time excludes the influence of irregularities with a larger spacing (with longer wavelength) of inappropriate roughness (profile waviness and profile shape). For the comparability of the surface roughness measurement results, the values of the basic length
Lc (cut-off) are determined by the standard. The nominal values of the limit lengths of the profile filter
Lc (cut-off) are selected from the following series: 0.08 mm, 0.25 mm, 0.8 mm, 2.5 mm, and 8 mm. To obtain sufficiently accurate values of the surface roughness parameters, it is recommended to choose the evaluated length as several times the basic length (usually five times) (
Table 4).
For sensor feed speed rates, the manufacturer’s recommendation is to use selected values of the measuring feed speed. The assessment of the influence of
Lc on
Ra values will therefore be carried out at a feed speed of 0.5 mm/s because this speed is recommended for all
Lc values, and at the same time, the results of our experiments in the previous chapter confirm the correctness of this choice (
Table 5).
According to the standards for evaluating the surface roughness, the cut-off parameter
λc (also referred to as
Lc) determines the basic length of the evaluated profile
lm. The standard STN EN ISO 4288 [
34] provides recommended values (see
Table 6) for the choice of cut-off
Lc and section and evaluation of lengths according to the values of the roughness parameters of periodic and non-periodic profiles. In the ISO 21920-3 [
39] standard, the Setting class parameters (
Table 4) are similarly designed but already uniformly for all types of surfaces and without justification. In our opinion, it is also necessary to take into account the technology used to evaluate the surface of the component. The origin and conditions of the mentioned recommendations are not clear, and therefore, in the next part of this work, experiments will be carried out on samples produced by different technologies to verify these recommendations.
In the next part, we will distinguish the so-called periodic and non-periodic surface roughness profiles (See
Appendix A).
The ISO 21920-3 [
39] standard introduces no distinction between periodic and non-periodic profiles compared to the edition of ISO 4288:1996 [
34]. Nevertheless, the following part is focused on the analysis in the course of the choice of cut-off filter for individual technologies, which were used to produce individual samples.
3.2.1. Effect of Cut-Off Filter Setting for Non-Periodic Surface Roughness Profiles
The goal is to identify the effect of setting the cut-off filter Lc on Ra values for individual types of reference samples processed by different technologies.
The standard (EN ISO 4288 and ISO 21920-3) [
34,
39] recommends setting the cut-off parameter
Lc or section length
lsc and evaluation length
lm according to the
Ra value. Evaluation length is recommended as five times the section length
lsc.
Here the aforementioned problem arises concerning how to set the L-filter or section length and evaluation length according to an unknown Ra value. This problem does not make sense and creates a challenge with the measurement procedure defined in this way because it is the choice of the basic length that has a significant impact on the result of the Ra evaluation process. This paradoxical recommendation can significantly influence the result of the surface roughness evaluation.
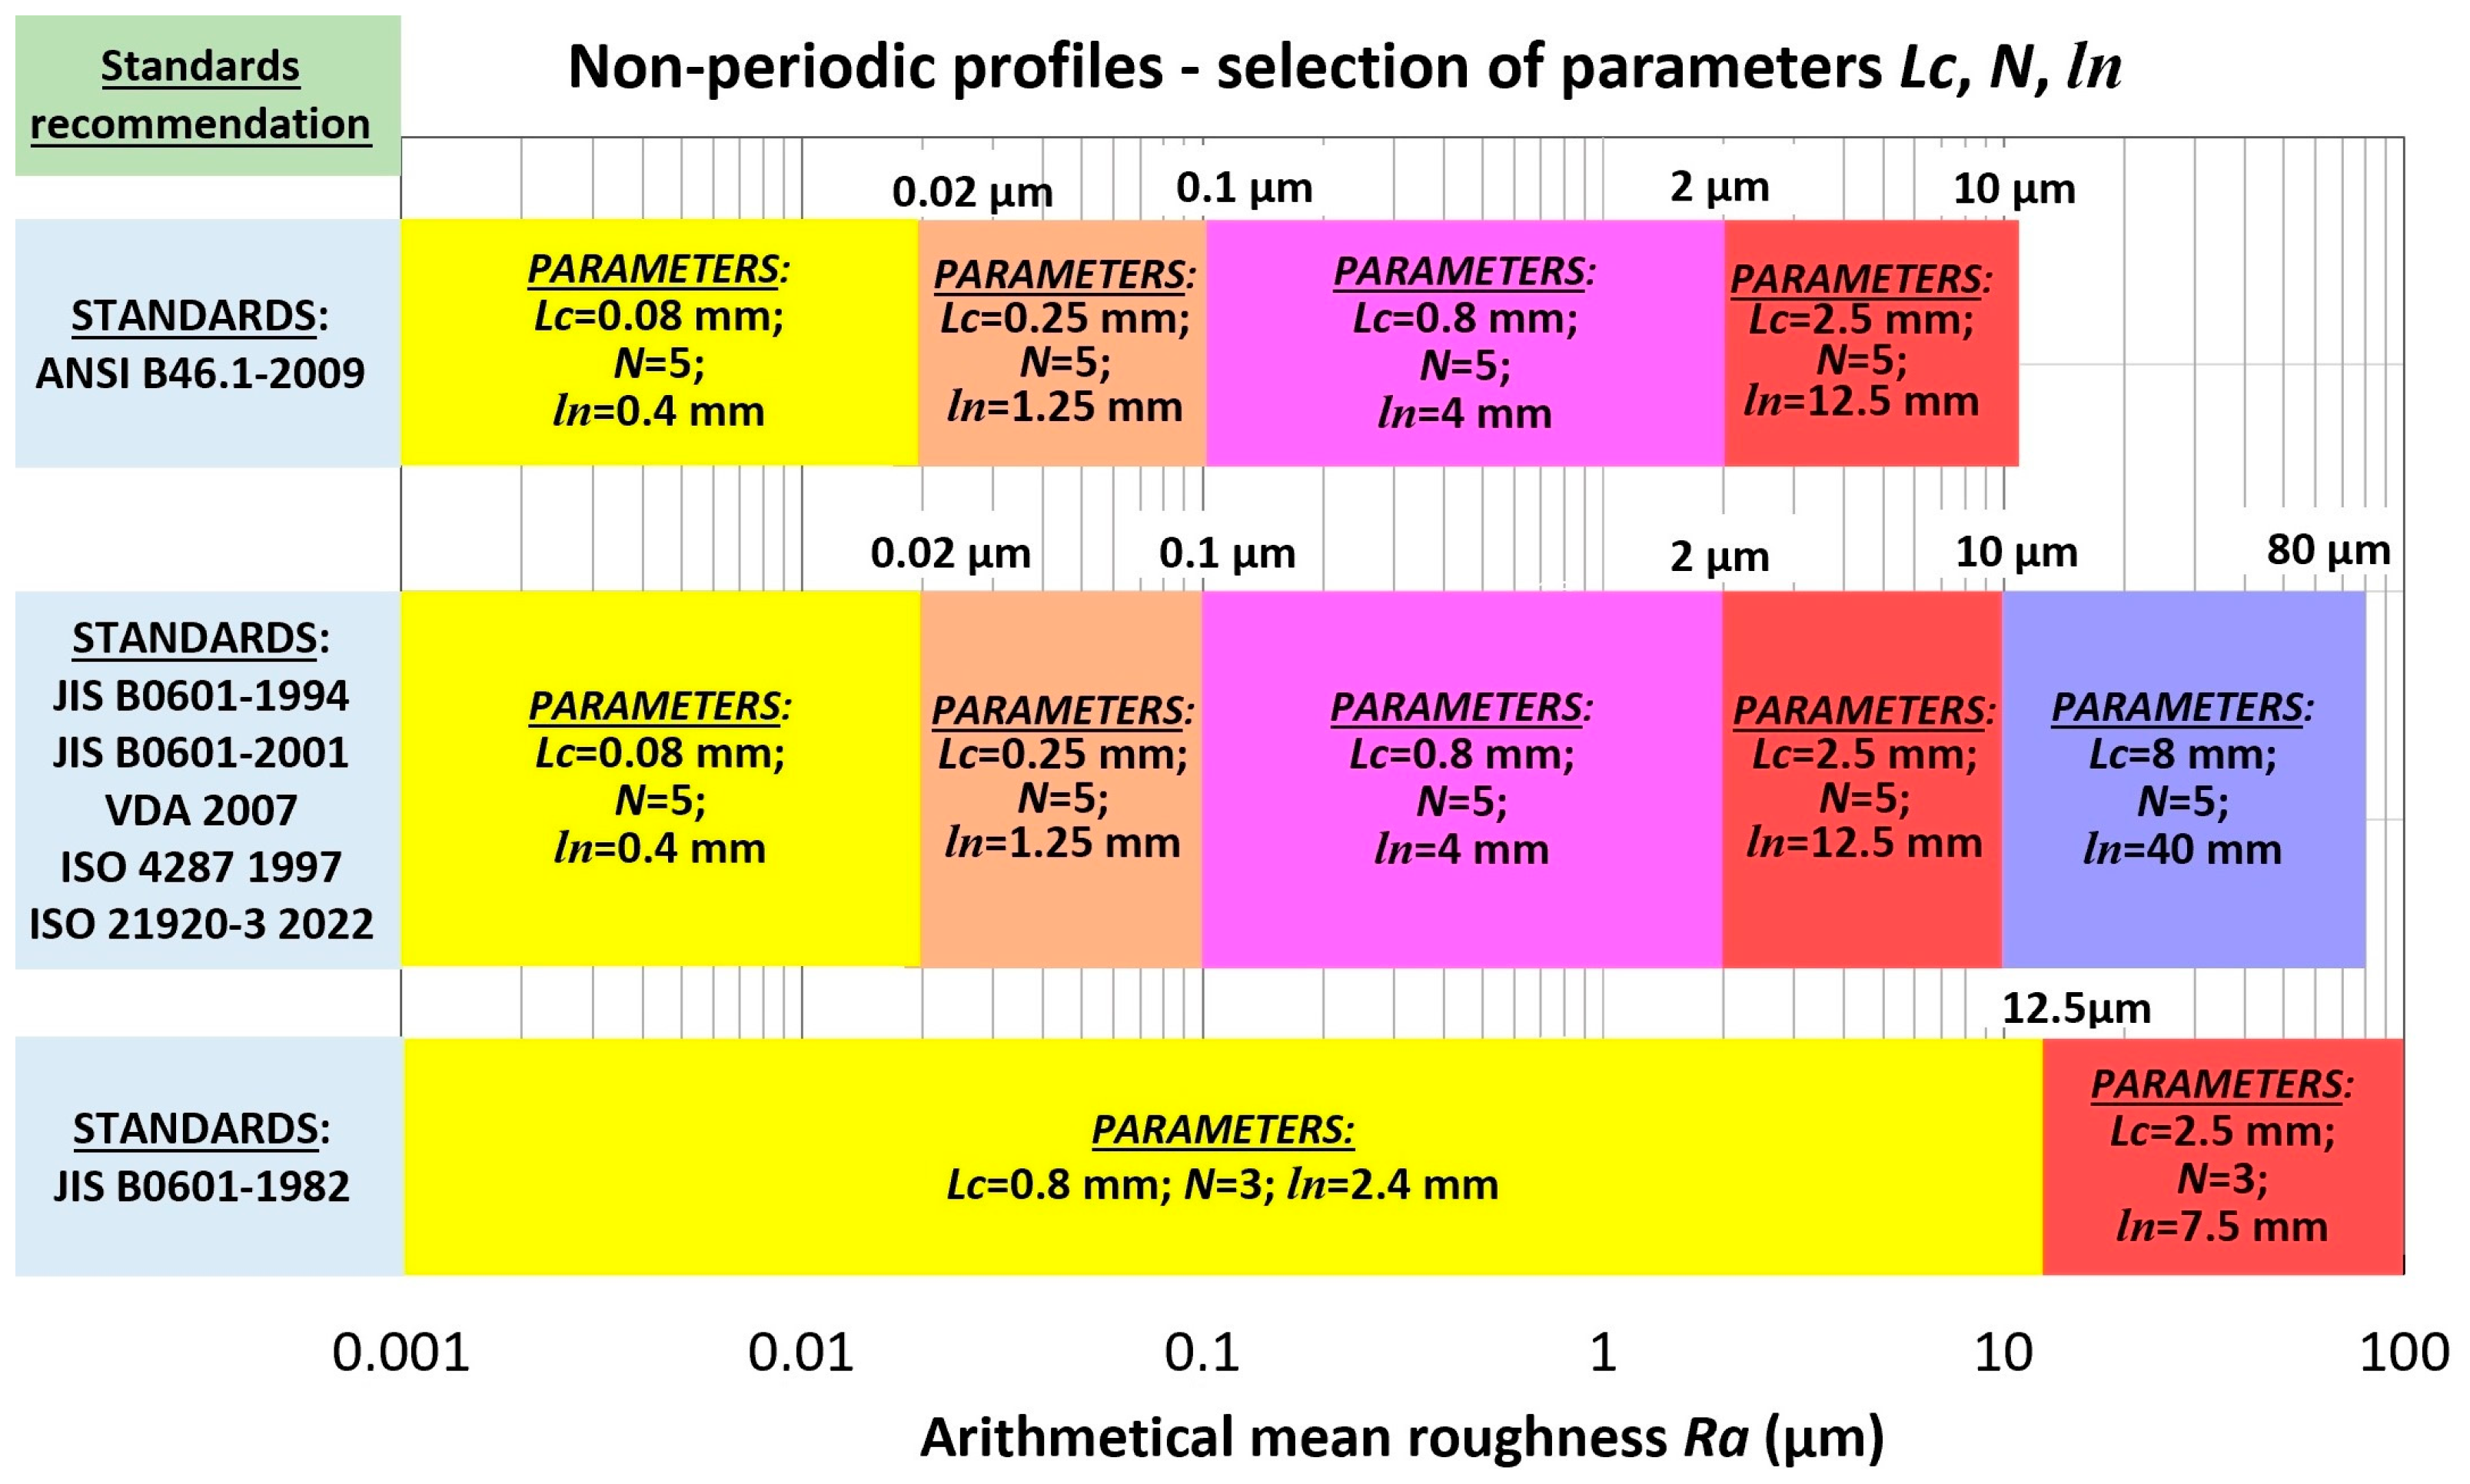
Some standards for the evaluation of surface roughness quantities differ in these recommendations, stating different values of the parameter
Lc for the values of
Ra. These differences are shown in the following
Figure 10. The JIS B0601-1982 [
50] standard, for example, recommends using a cut-off filter with a value of
Lc = 0.8 mm for values of
Ra < 12.5 µm. For all larger
Ra values, it is recommended to use
Lc = 2.5 mm. Other standards for evaluation use more finely graded cut-off filters, which complicate the situation when setting the cut-off
Lc filter during measurement.
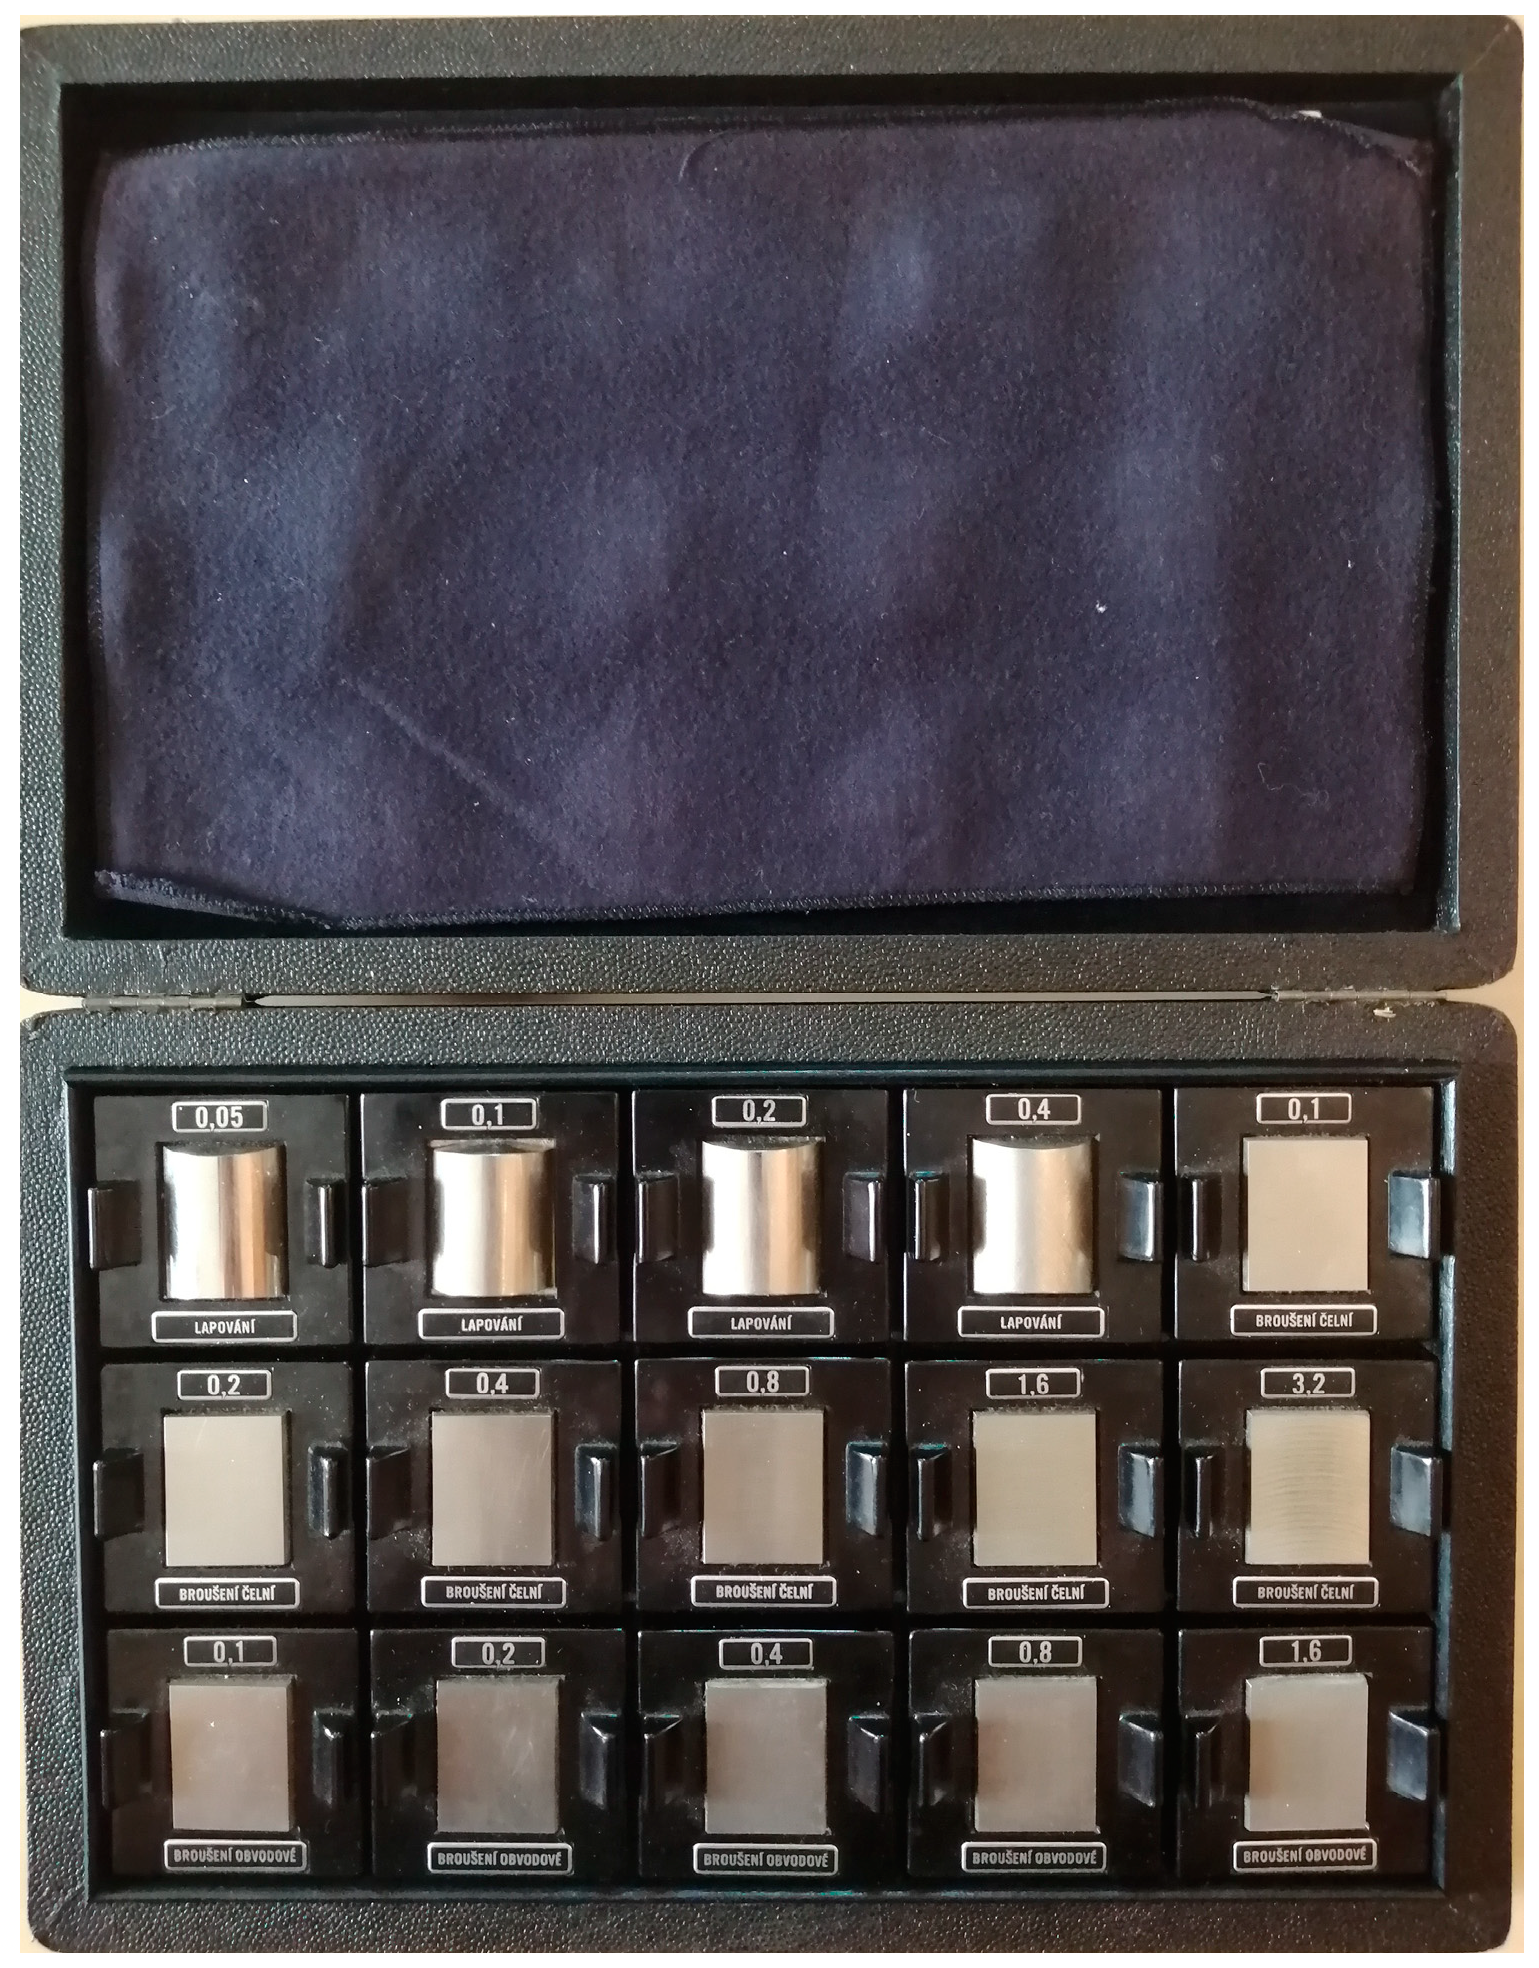
For the experimental investigation, selected samples of non-periodic surface roughness profiles with different
Ra values were processed using the technology (
Figure 11), (
Table 7):
- -
Lapping operation samples.
- -
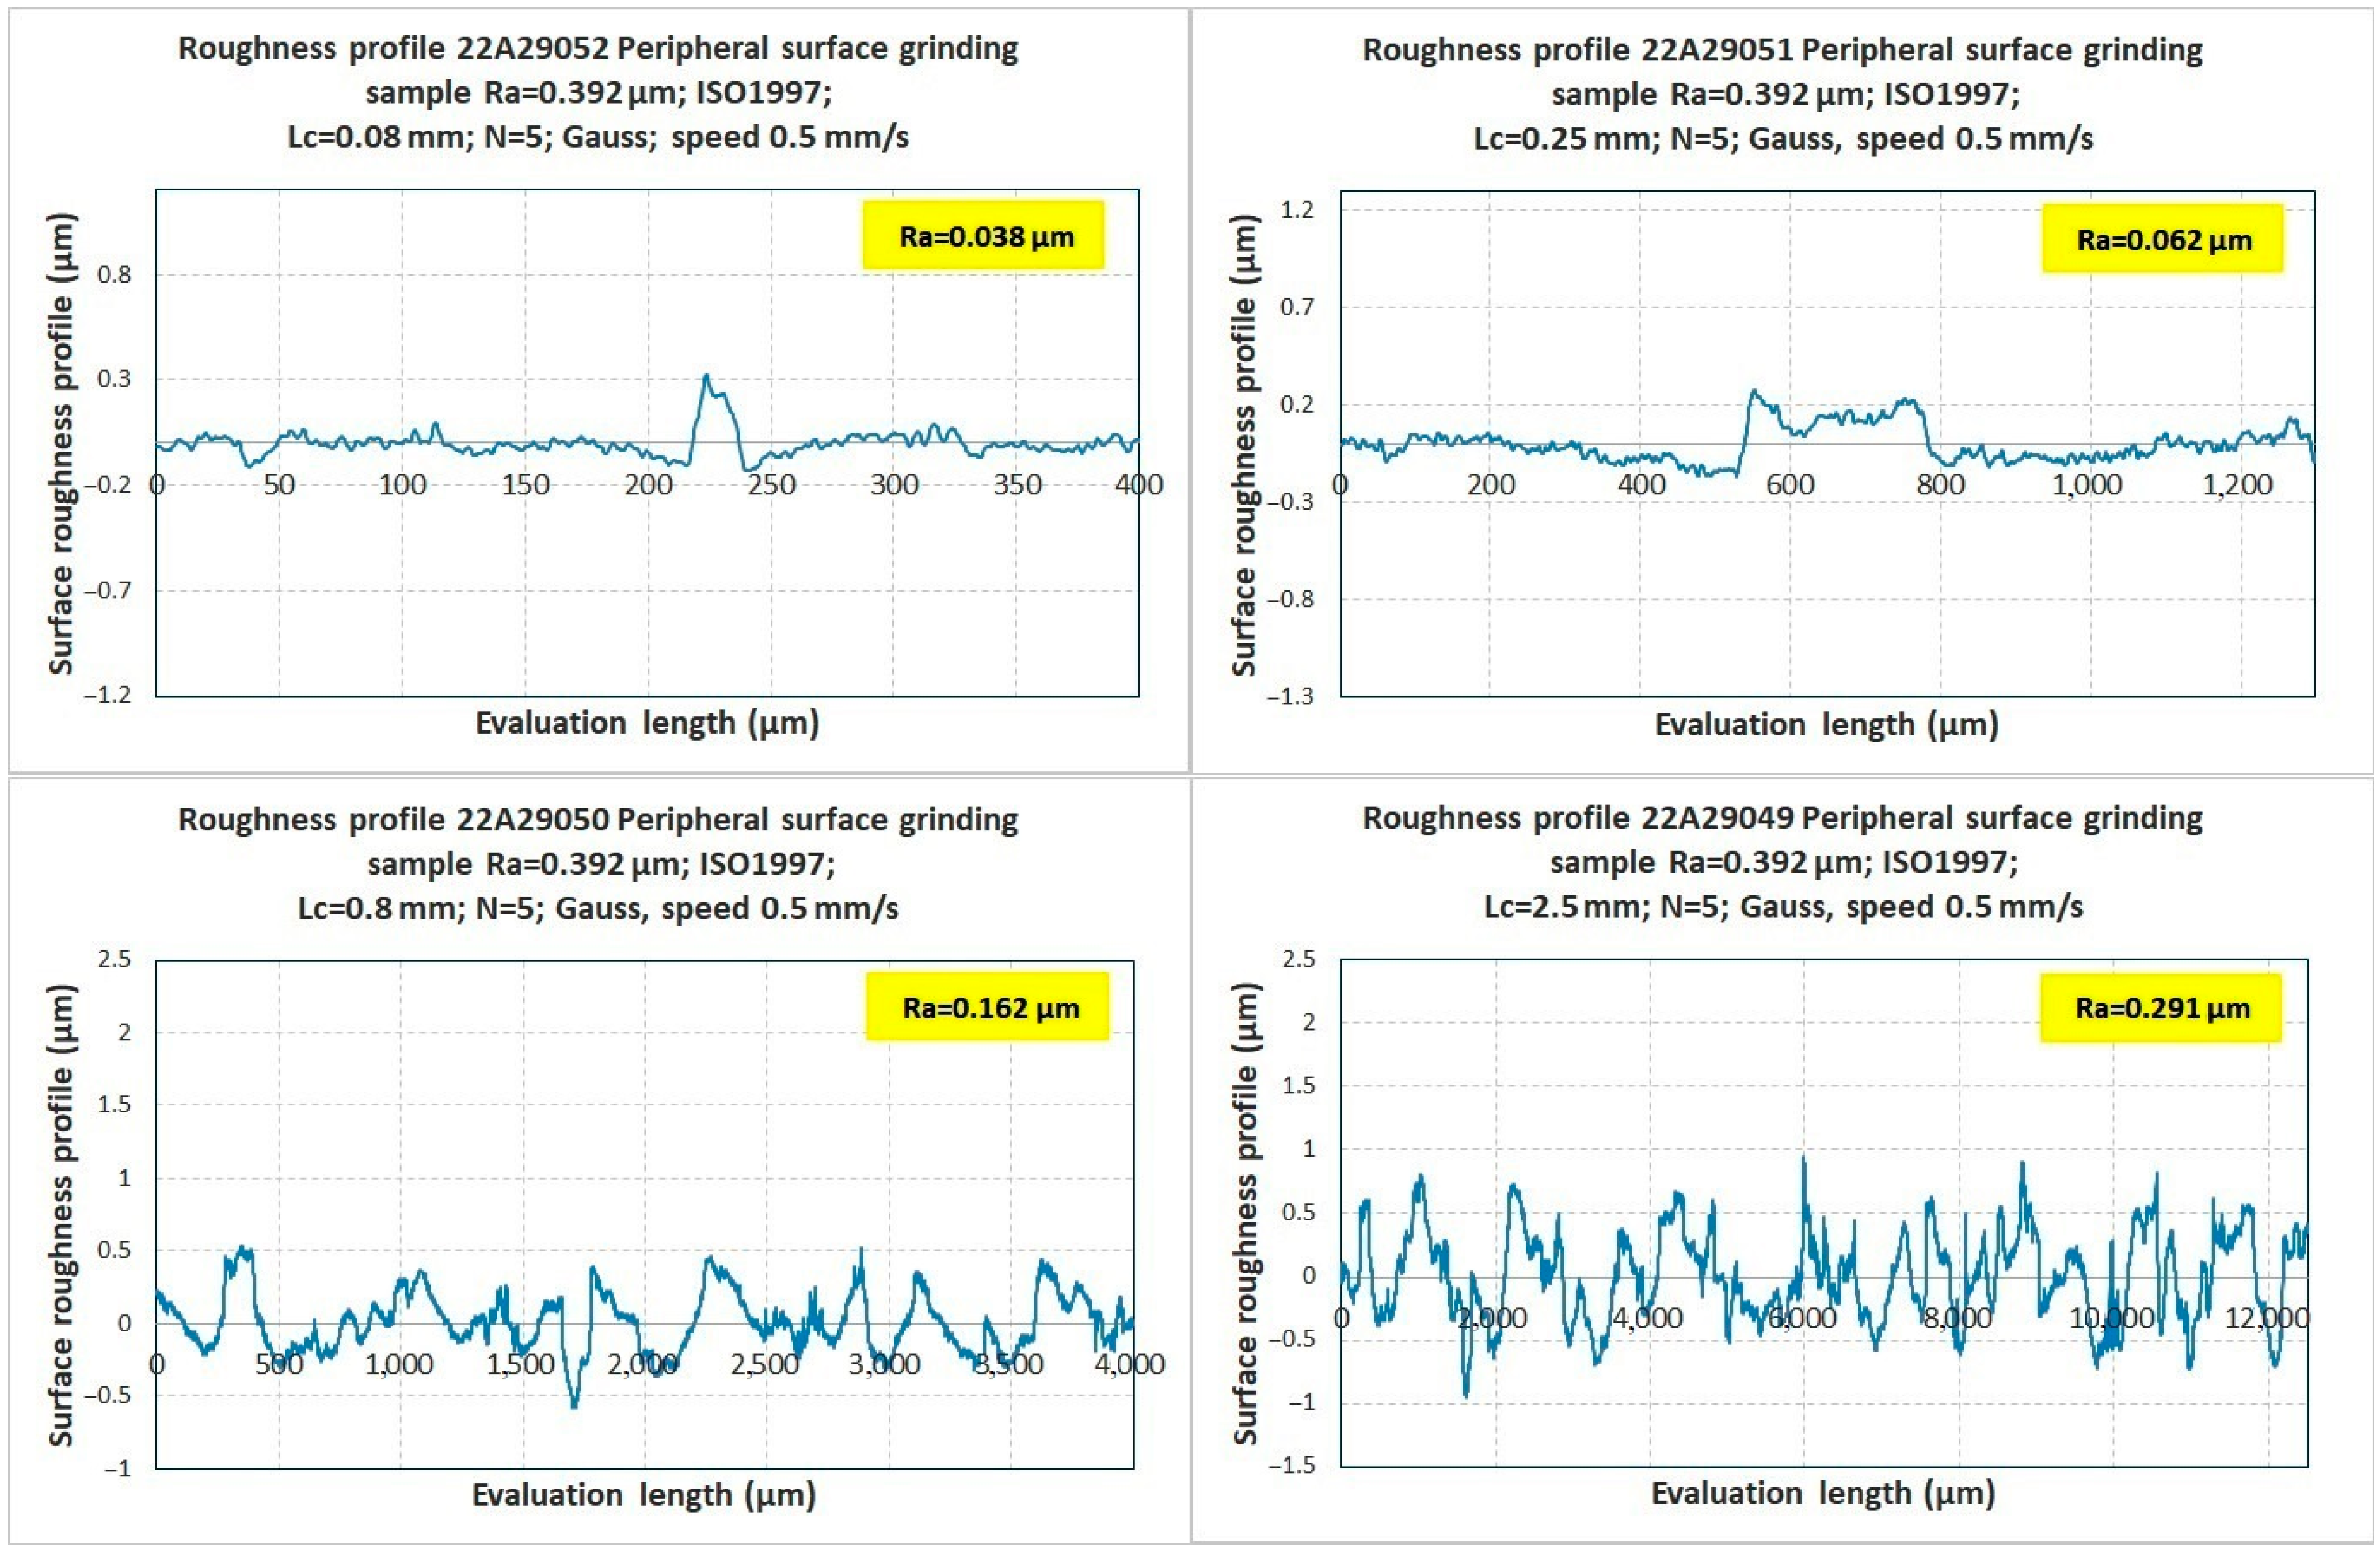
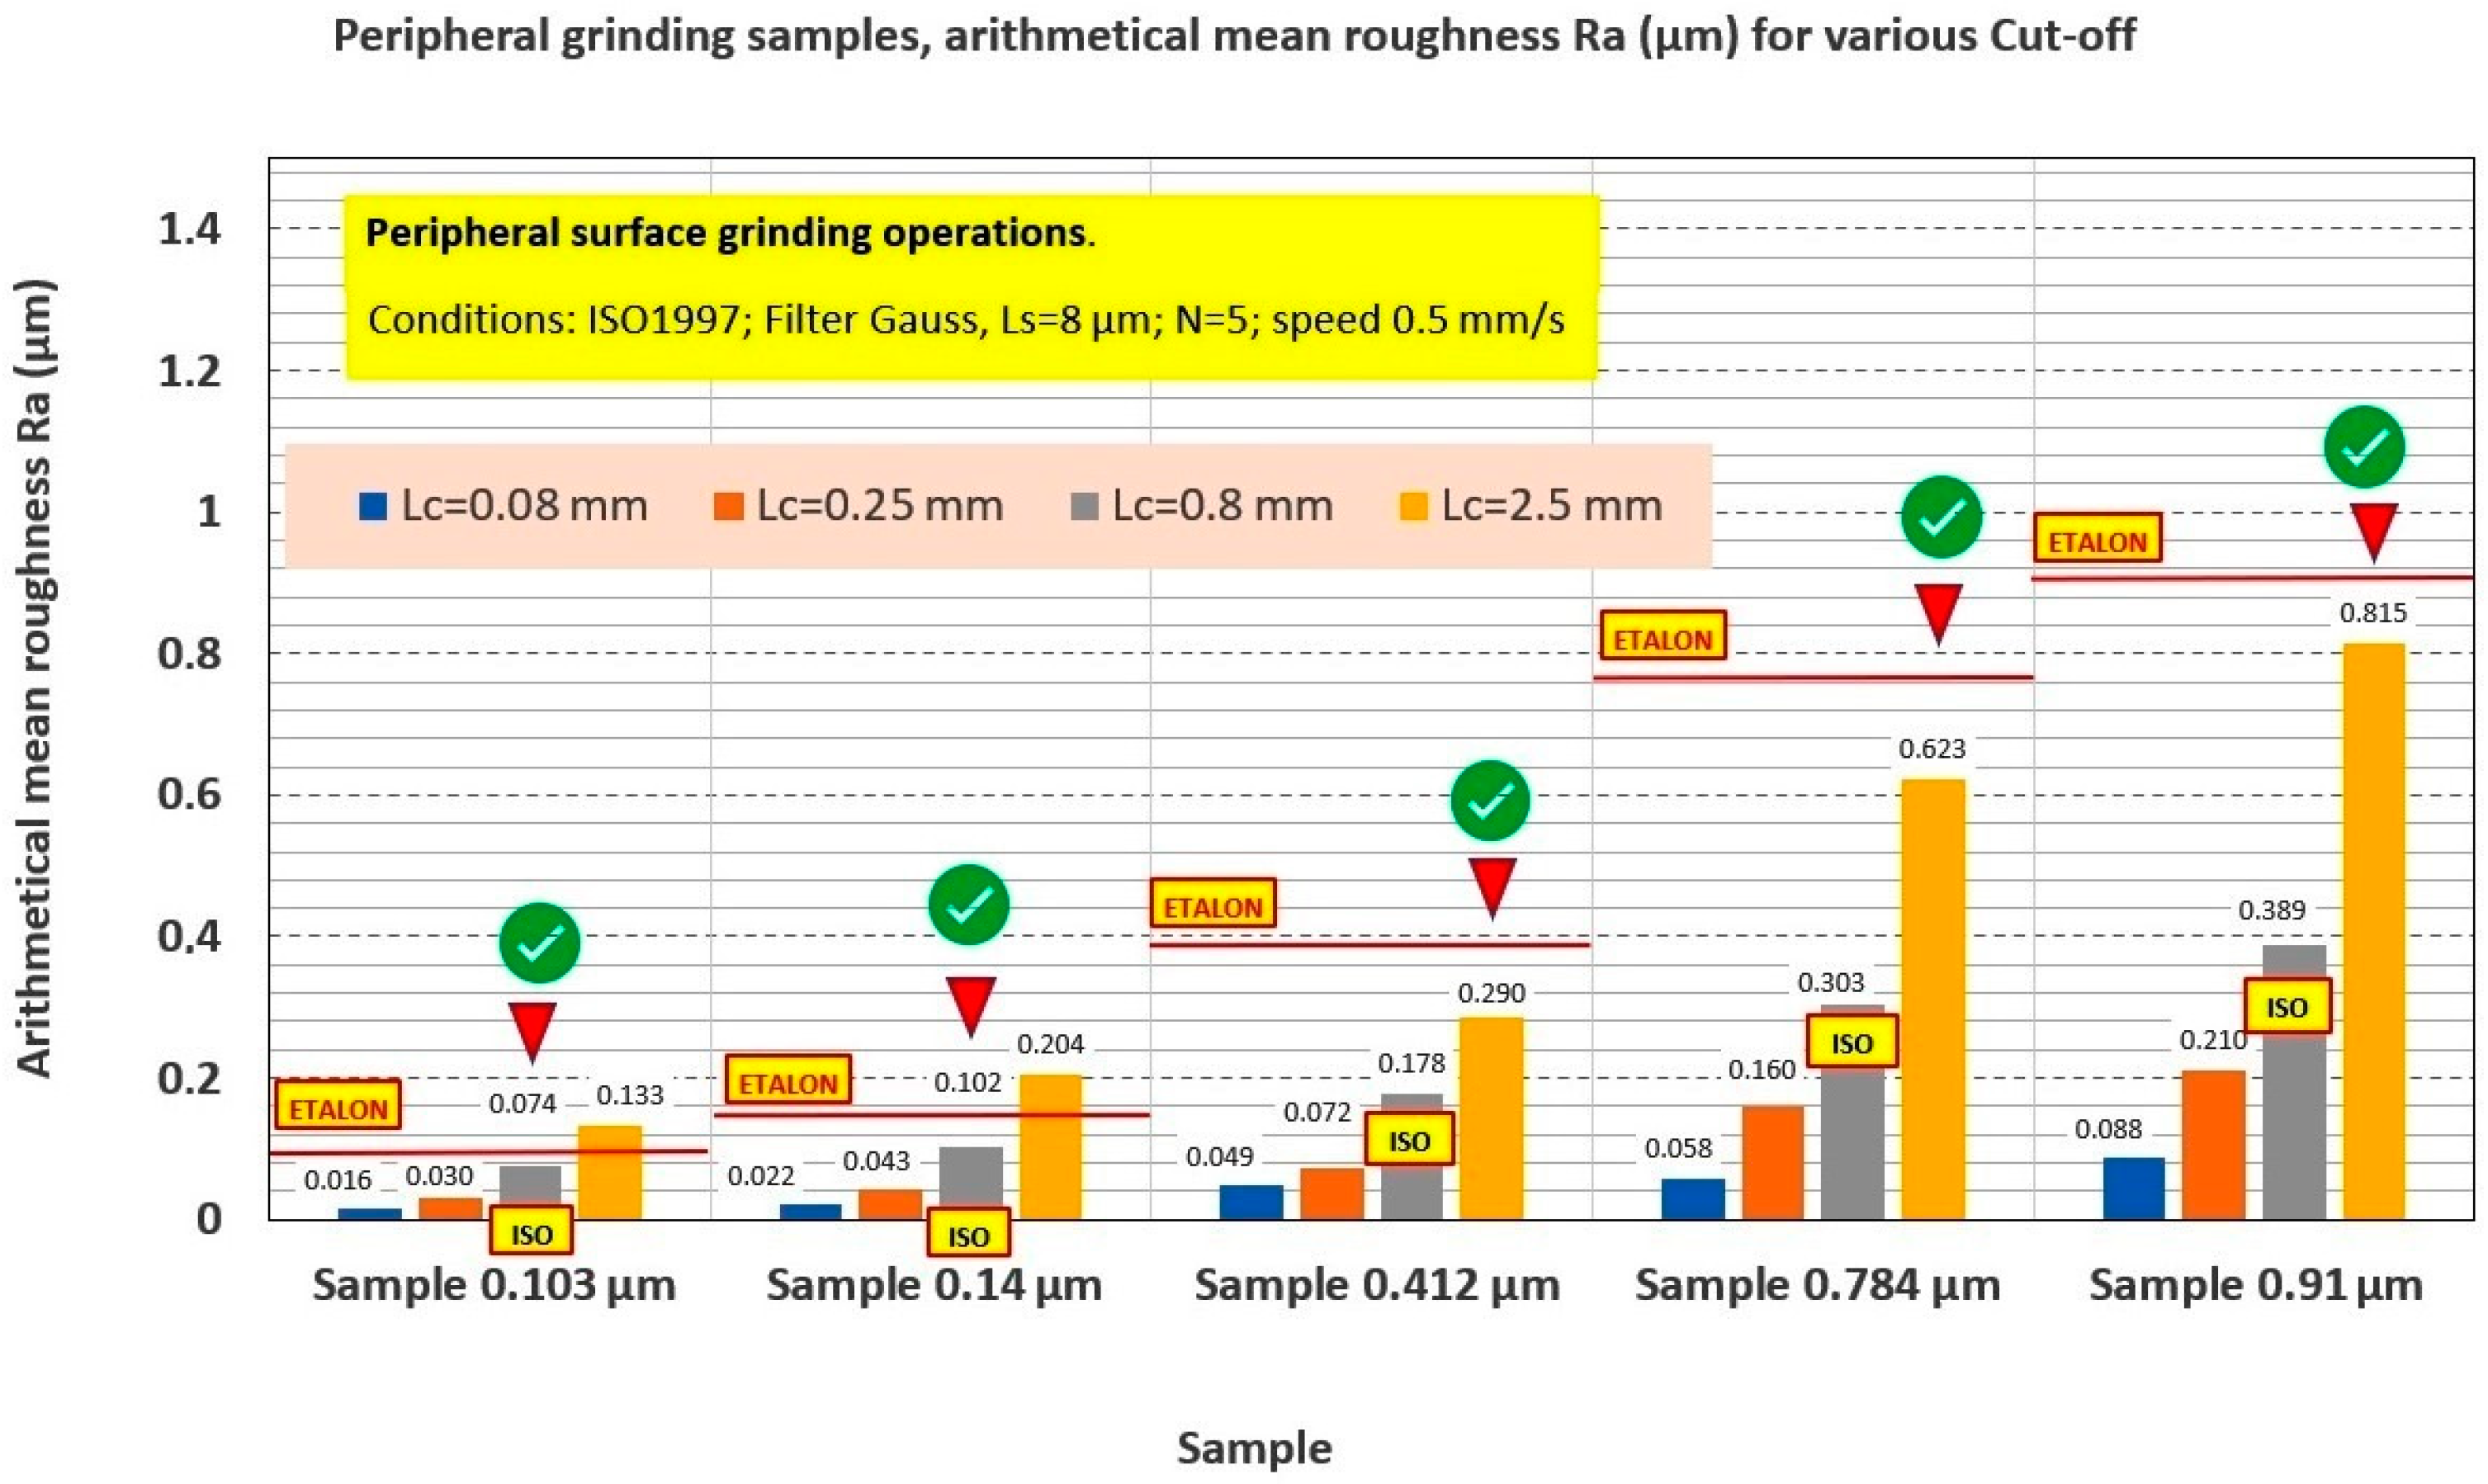
Peripheral grinding operation samples.
- -
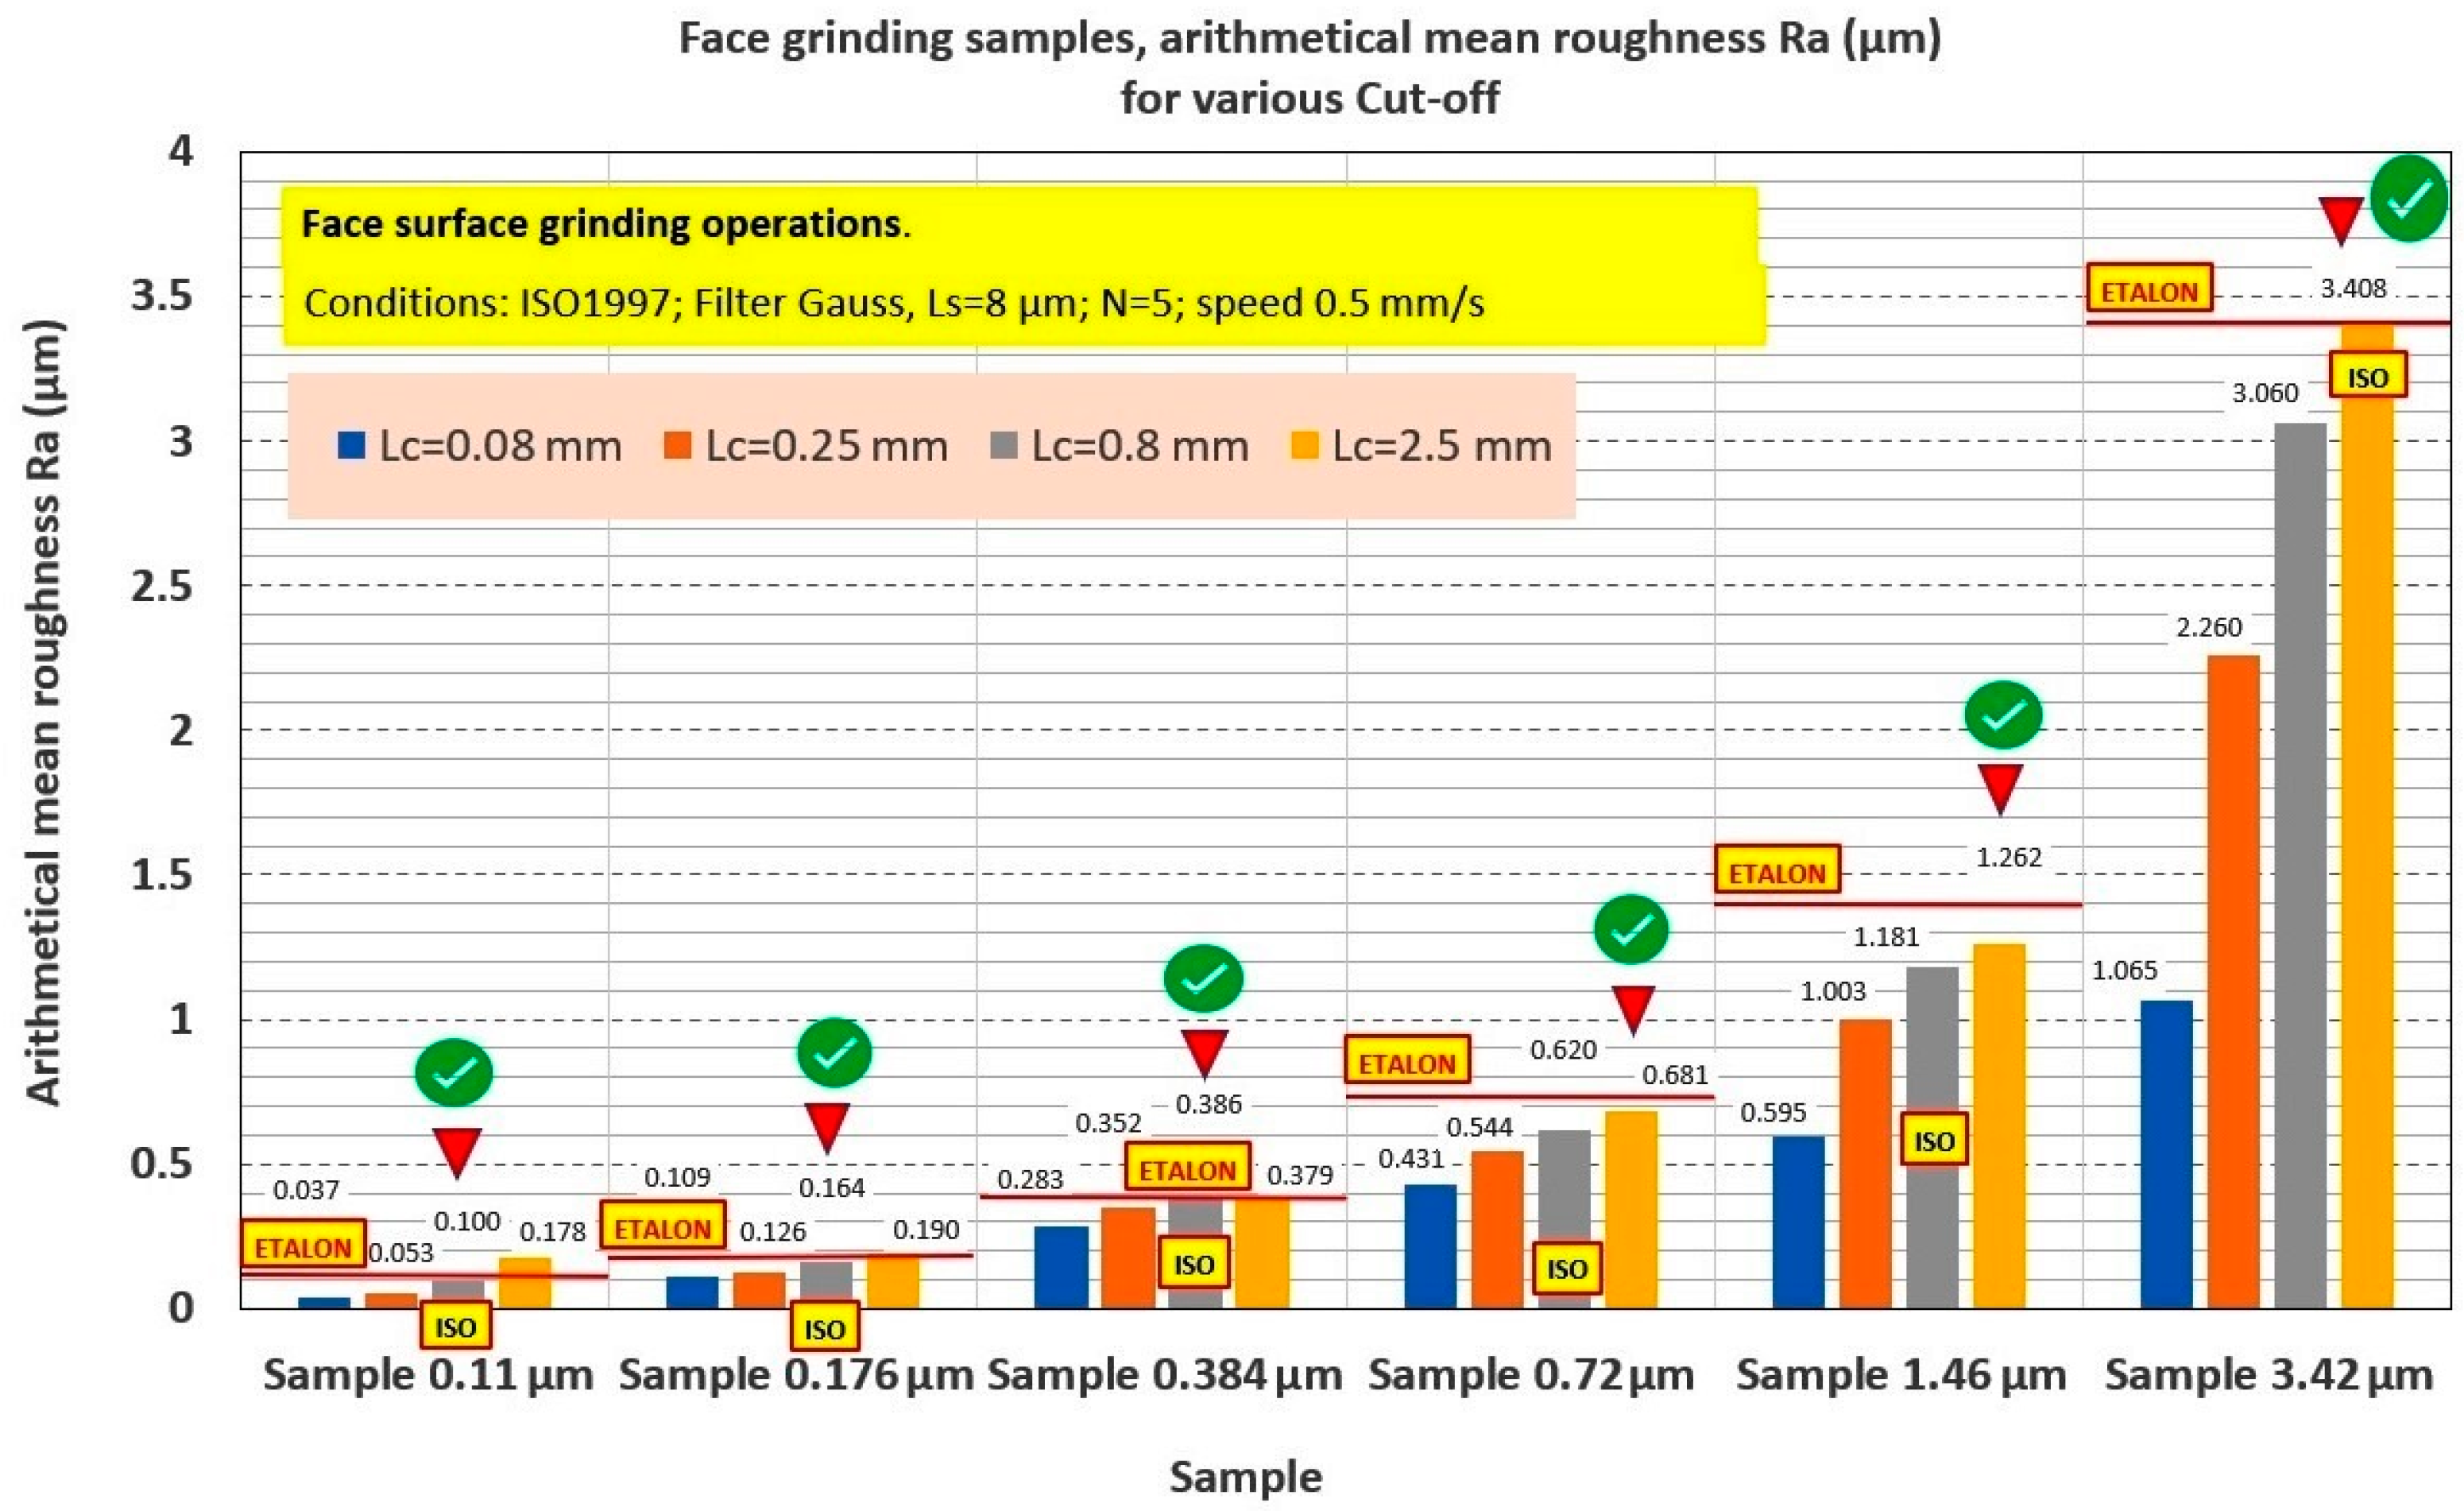
Face grinding operation samples.
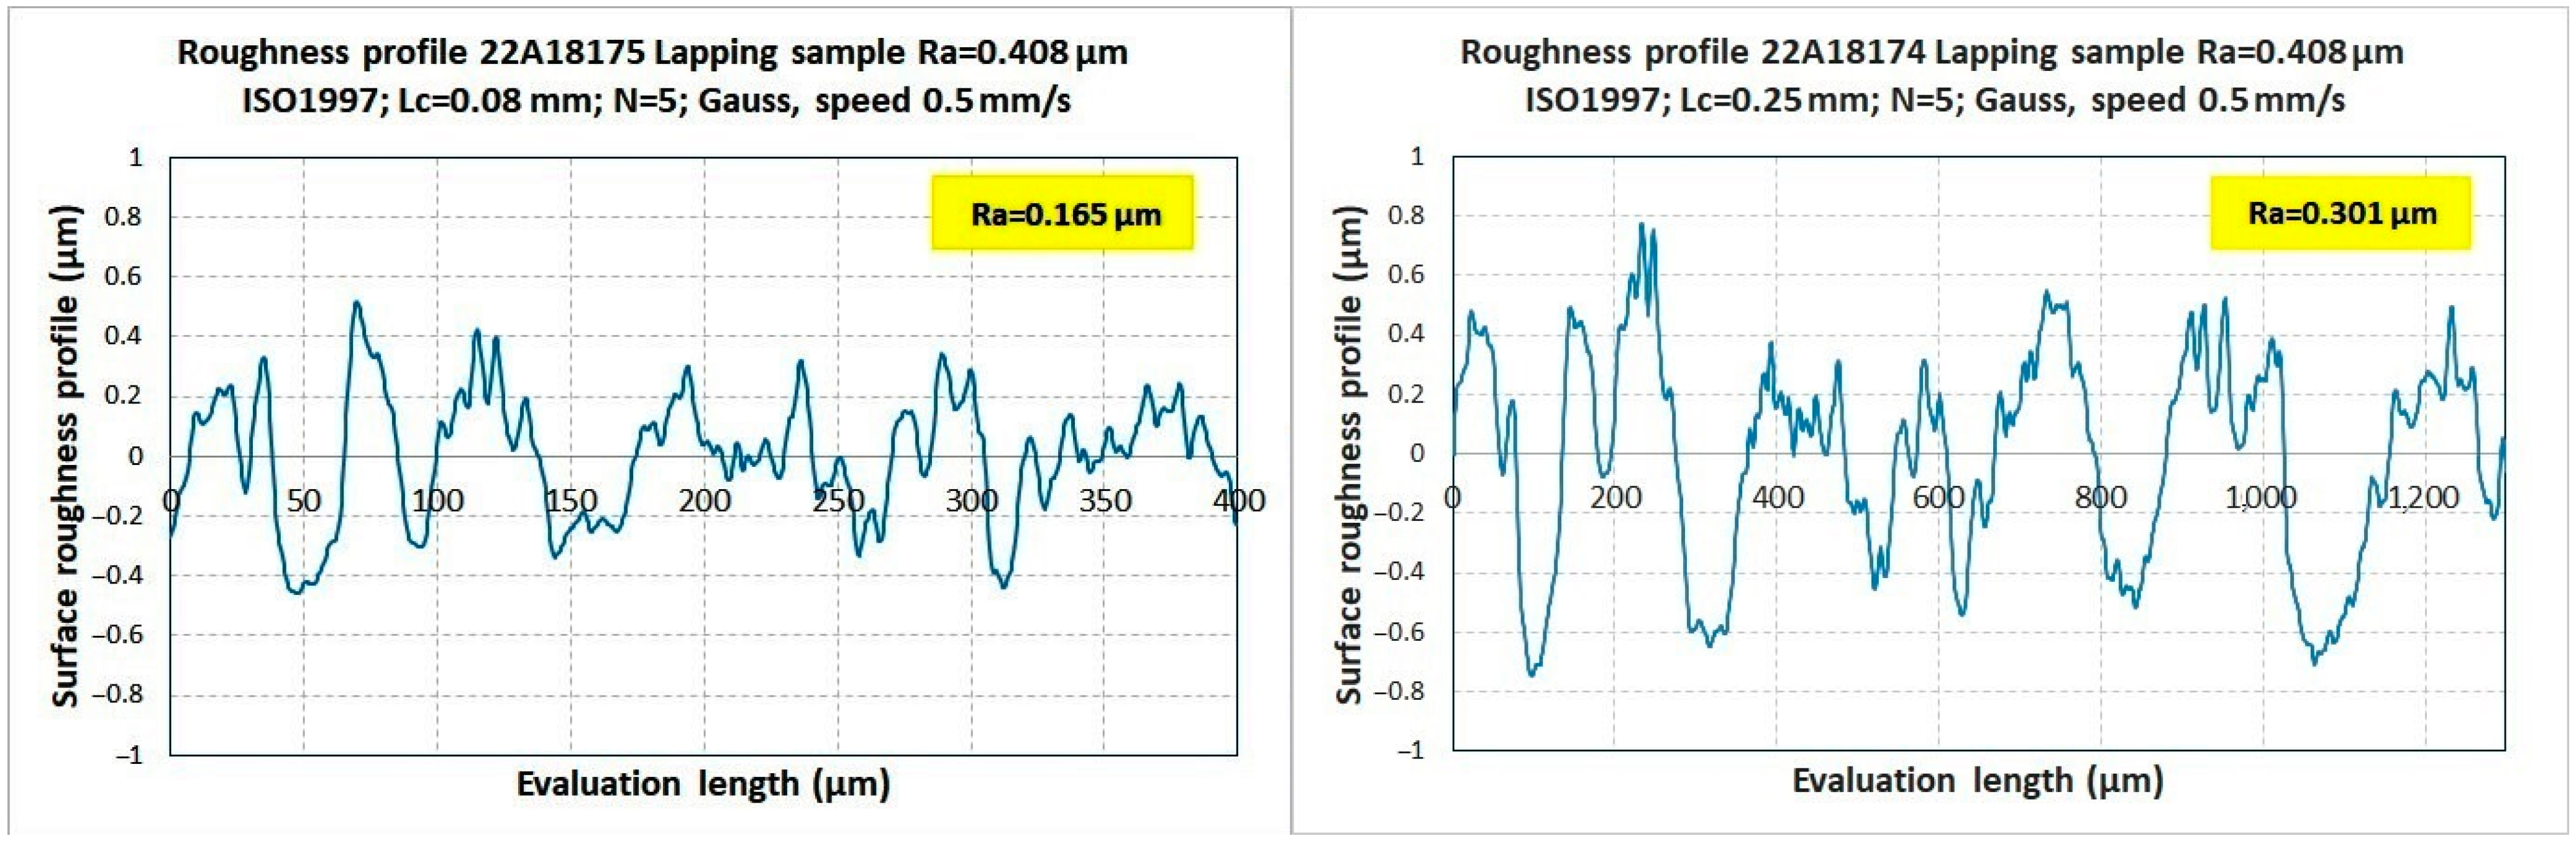
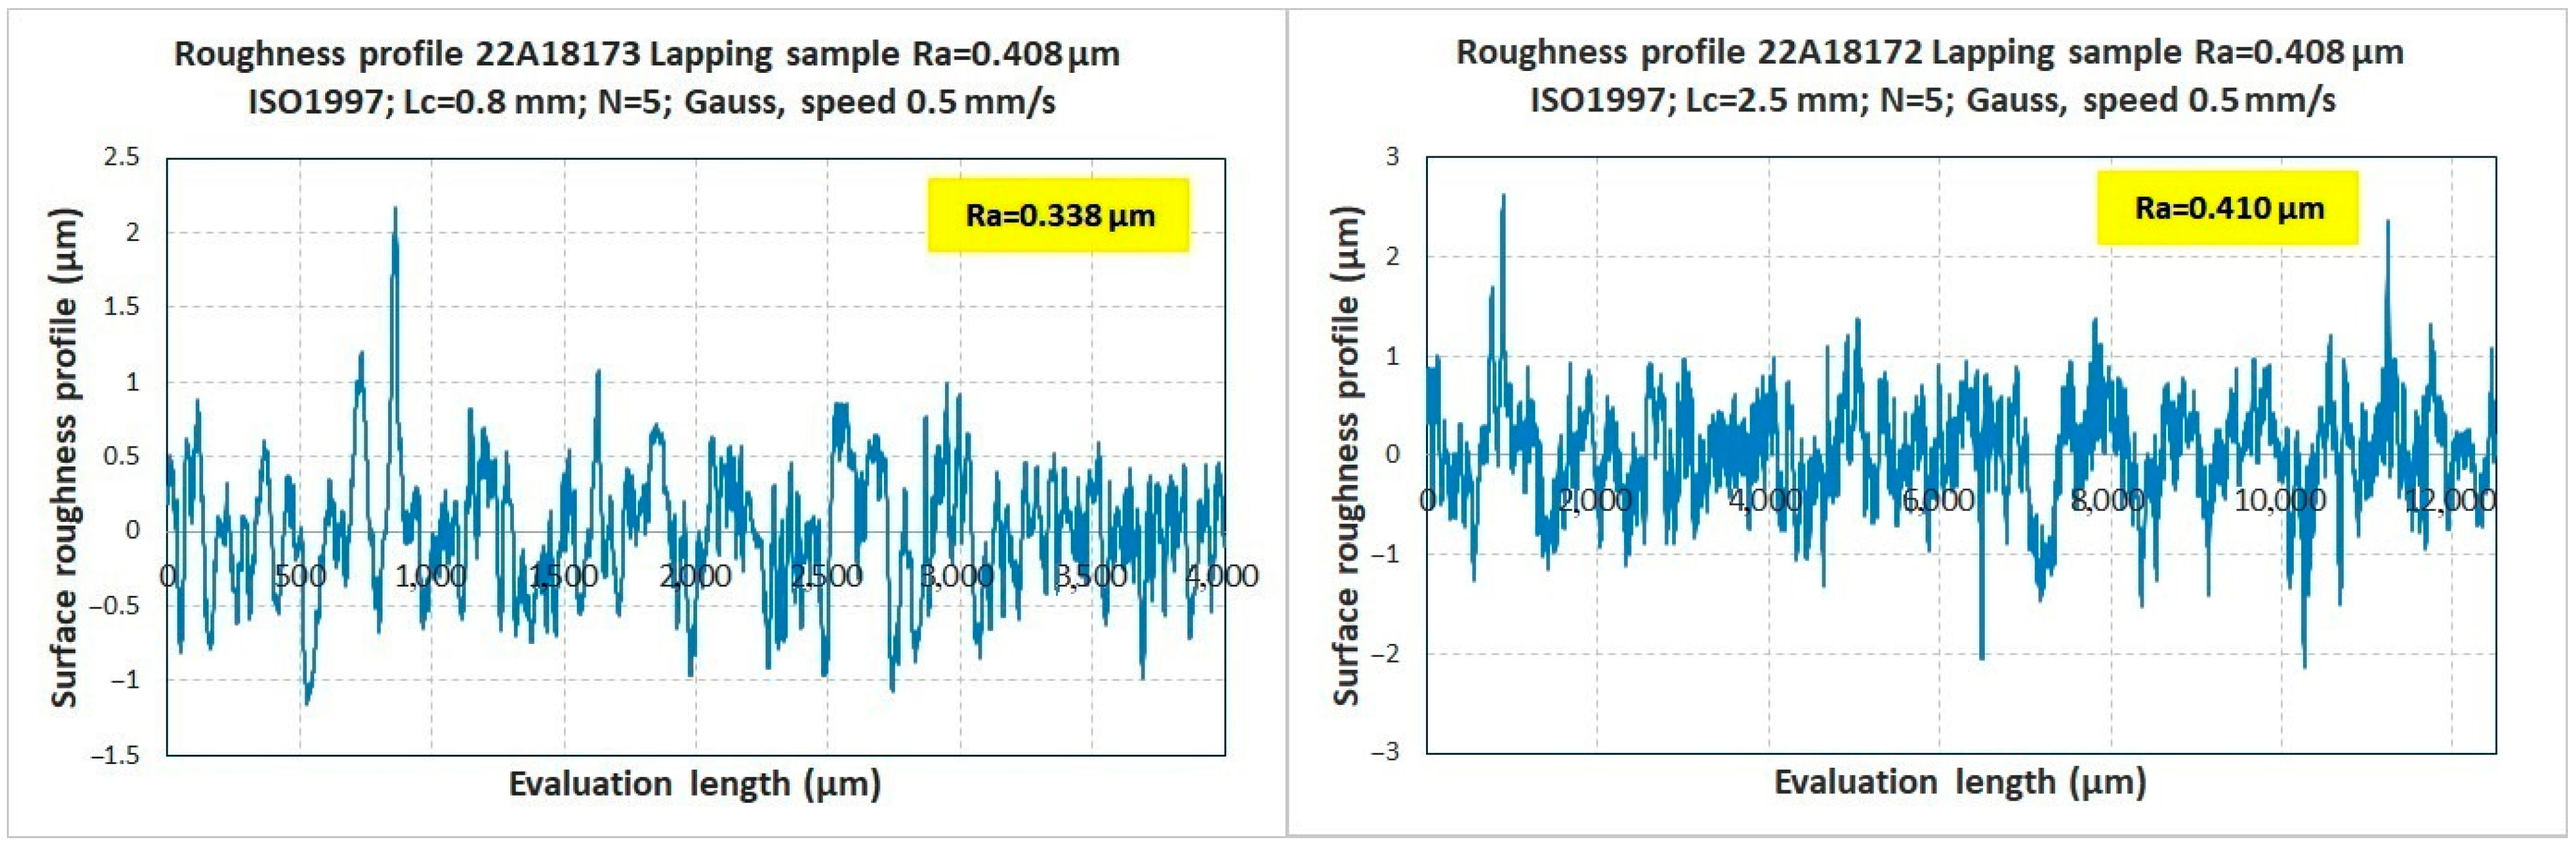
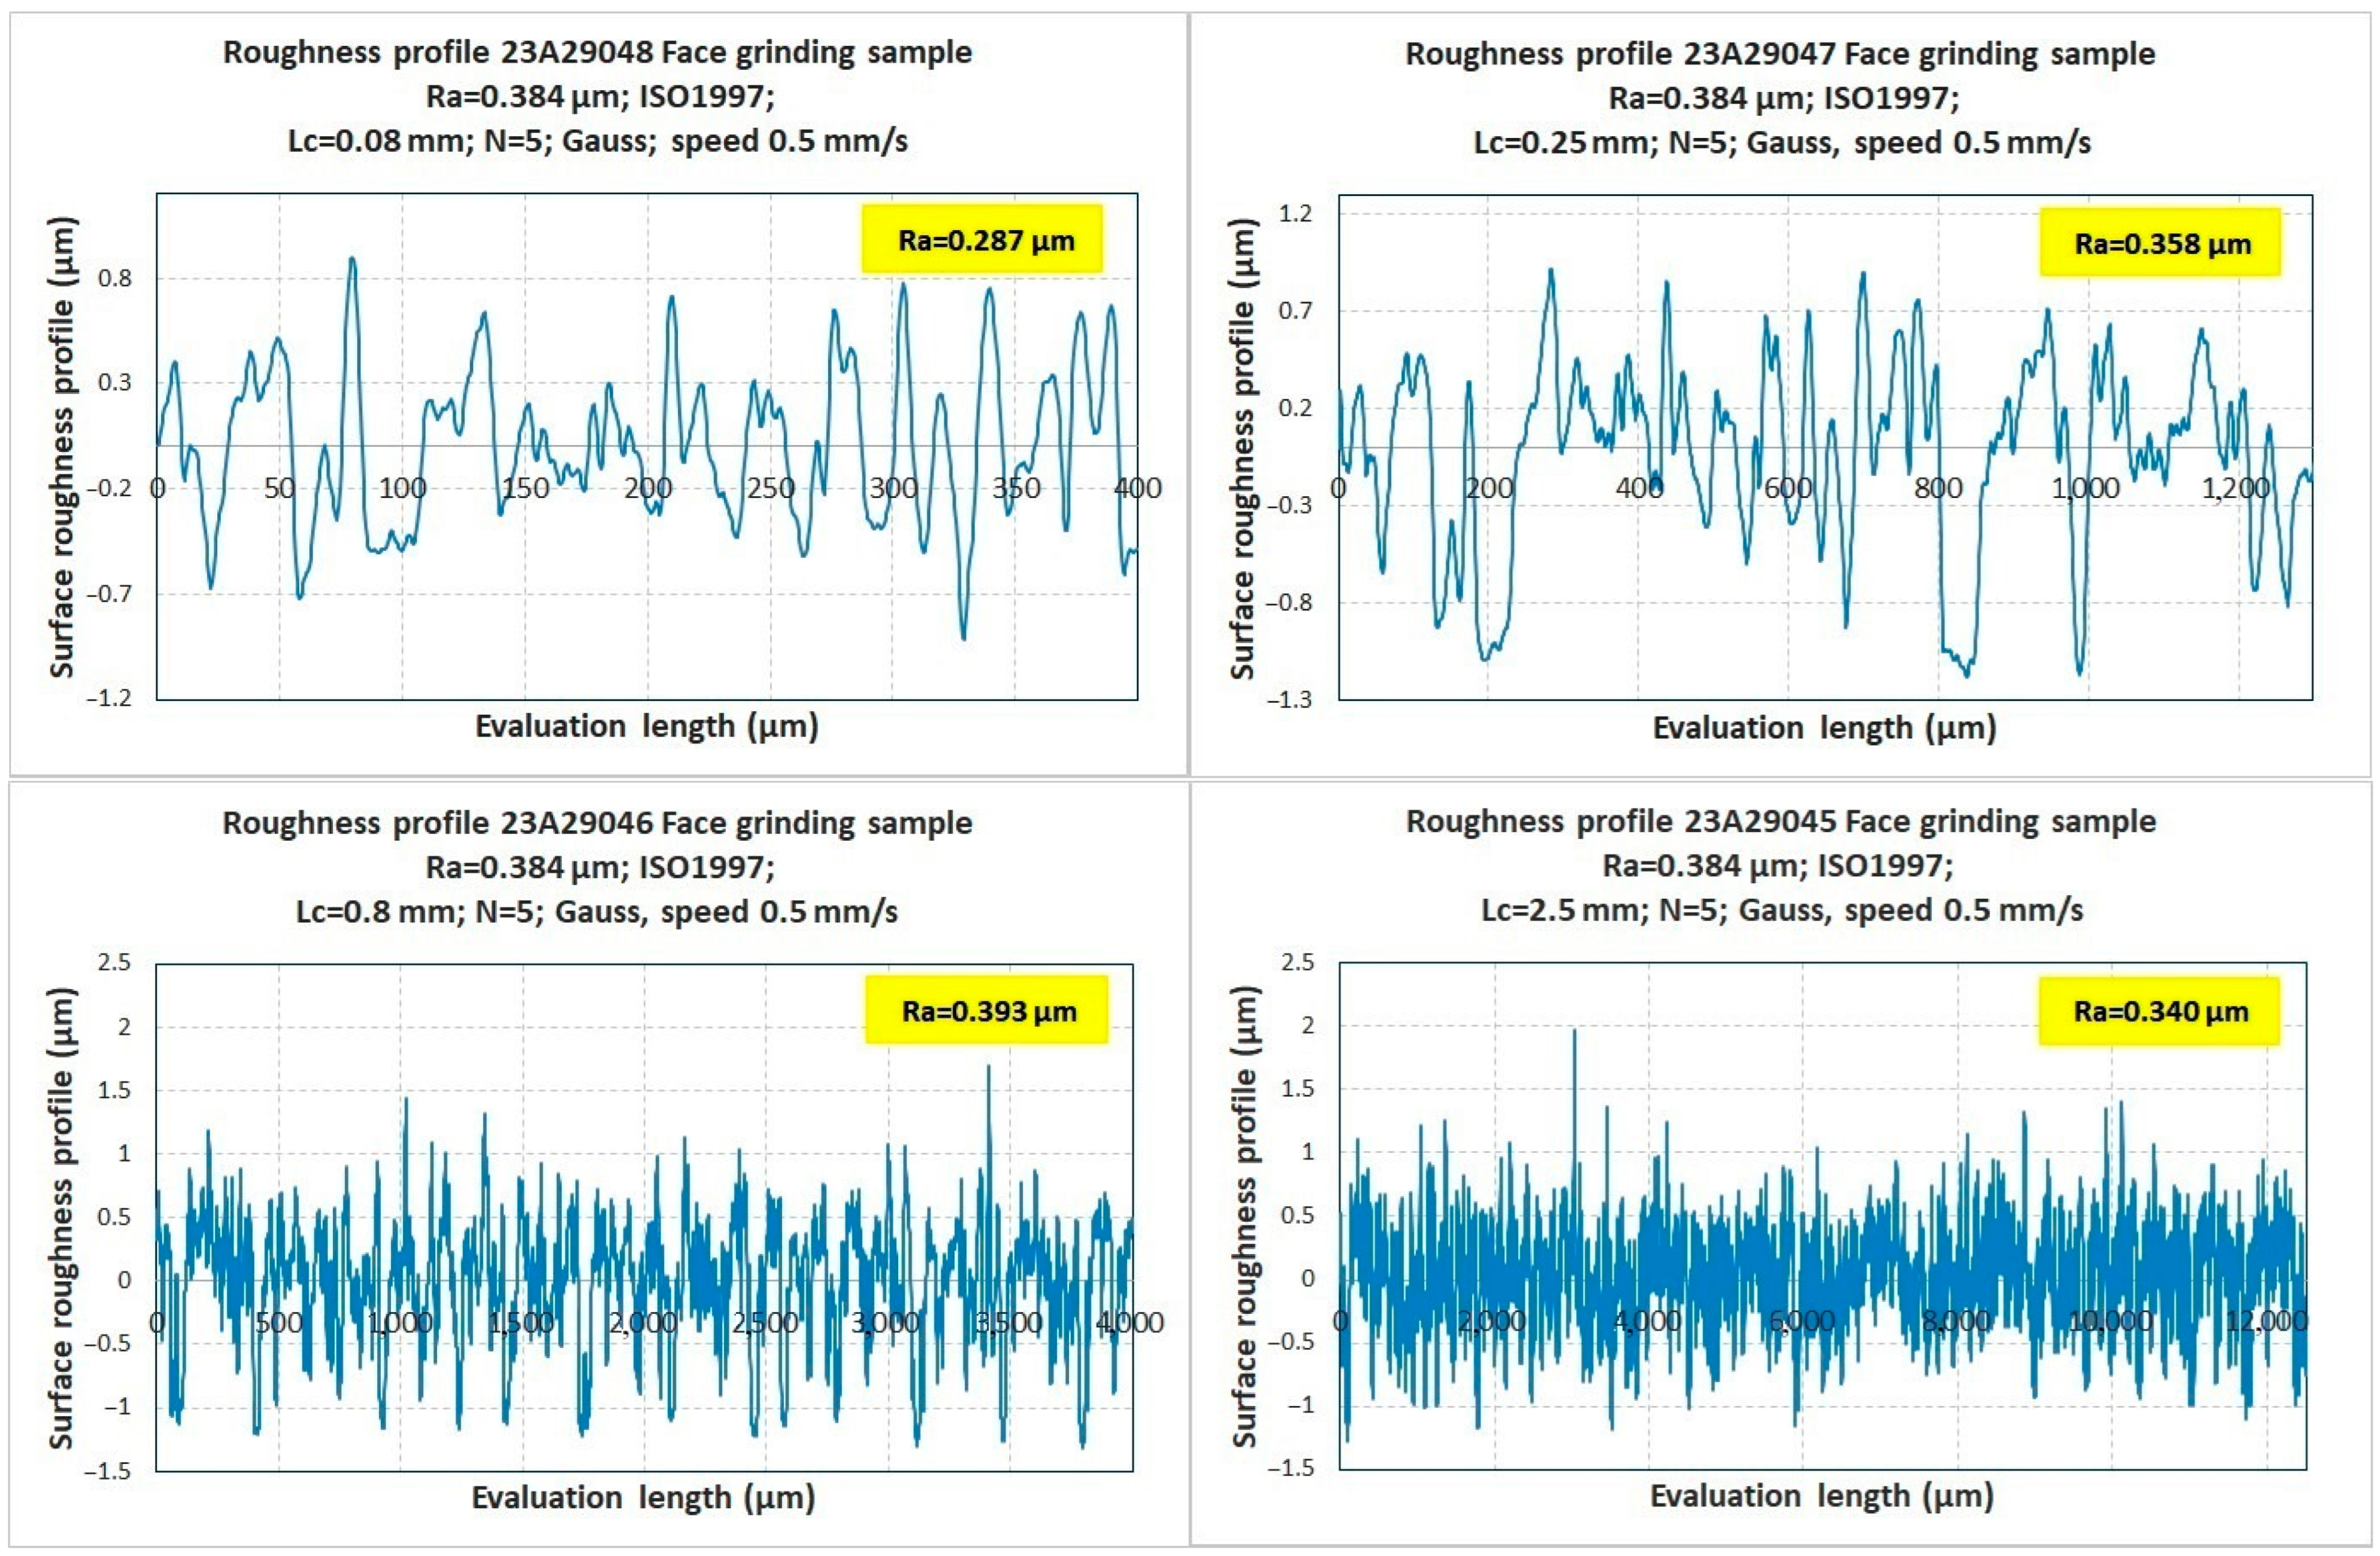
Measurements were carried out for each setting of the cut-off filter
Lc and for each sample at ten randomly selected locations in the central region of this sample. The average values were shown in graphs (
Appendix B), also showing the value of
Ra for each reference sample.
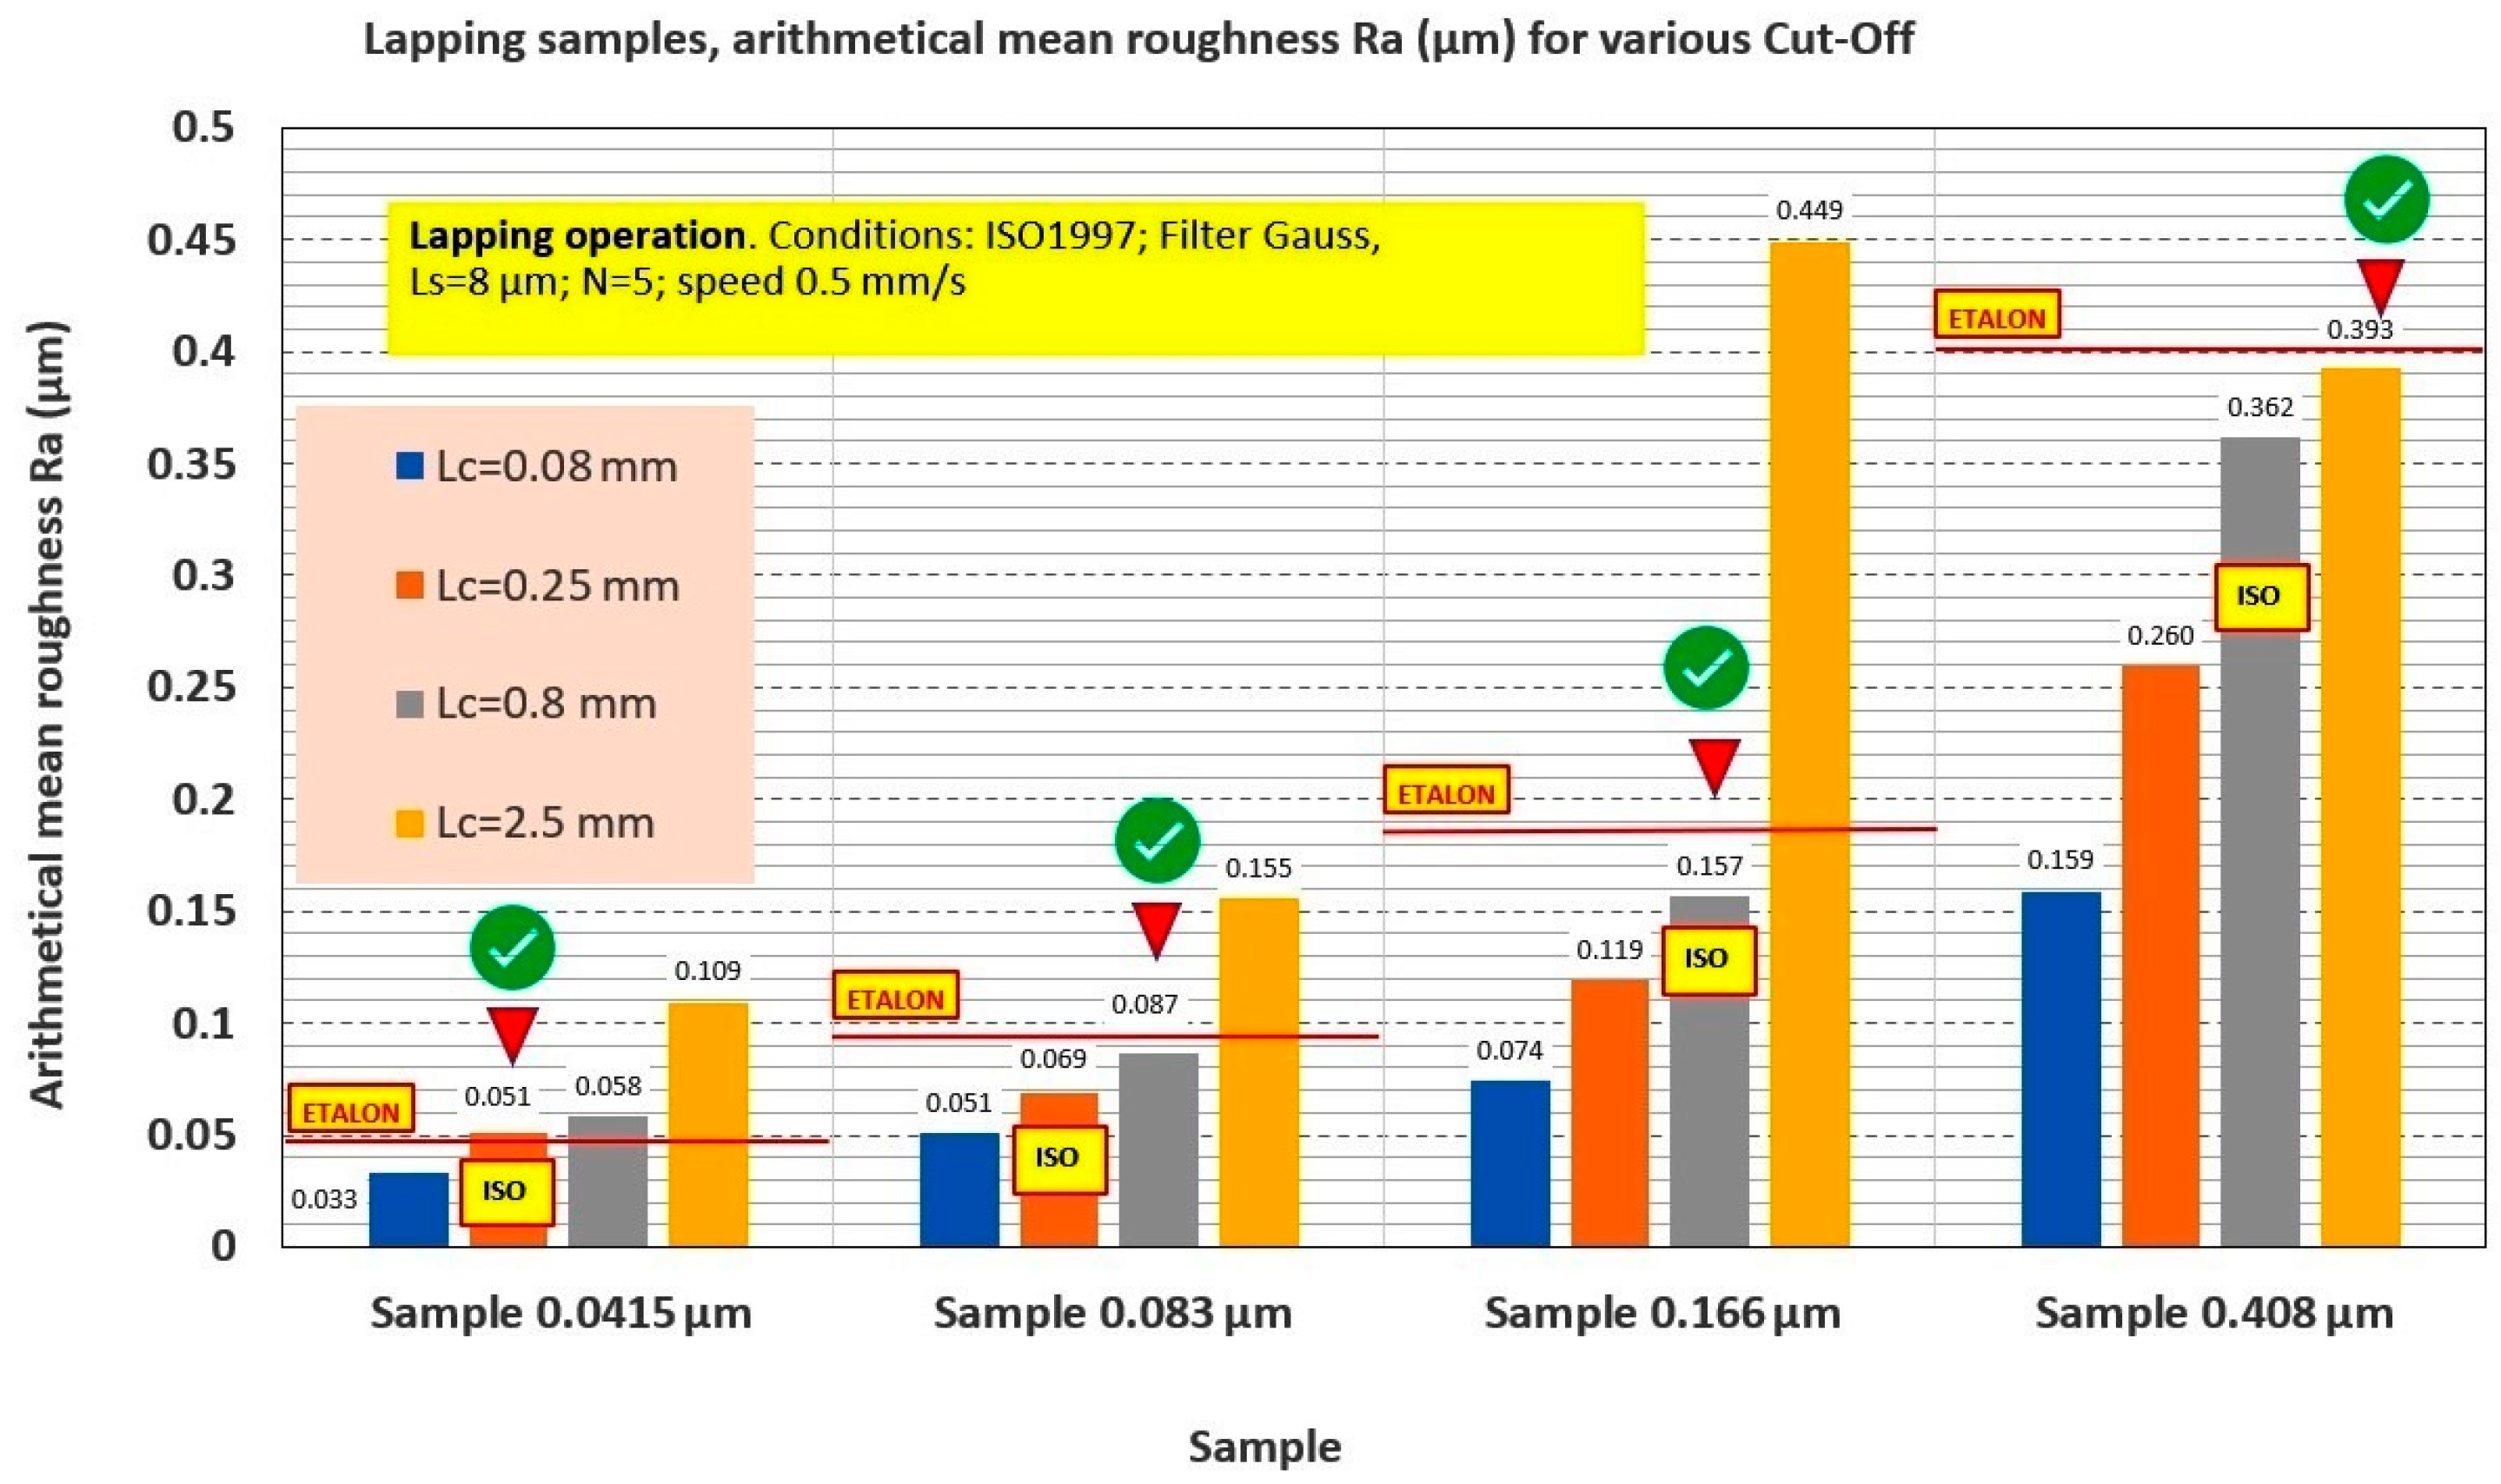
To assess suitability, it is necessary to observe the deviation of the average value from the Ra value of the reference sample. We were looking for a setting of the cut-off filter Lc for which the average value has the smallest deviation with respect to the reference nominal value Ra.
For experimentally assessed non-periodic surface roughness profiles (lapping, peripheral grinding, and face grinding), the optimal setting of the cut-off filter
Lc was observed for some reference samples, which is recommended in the ISO standard [
33,
34,
35,
36,
37,
38,
39,
40]. However, for some samples, other recommended settings of the cut-off filter
Lc (for samples with larger
Ra values) were obtained.
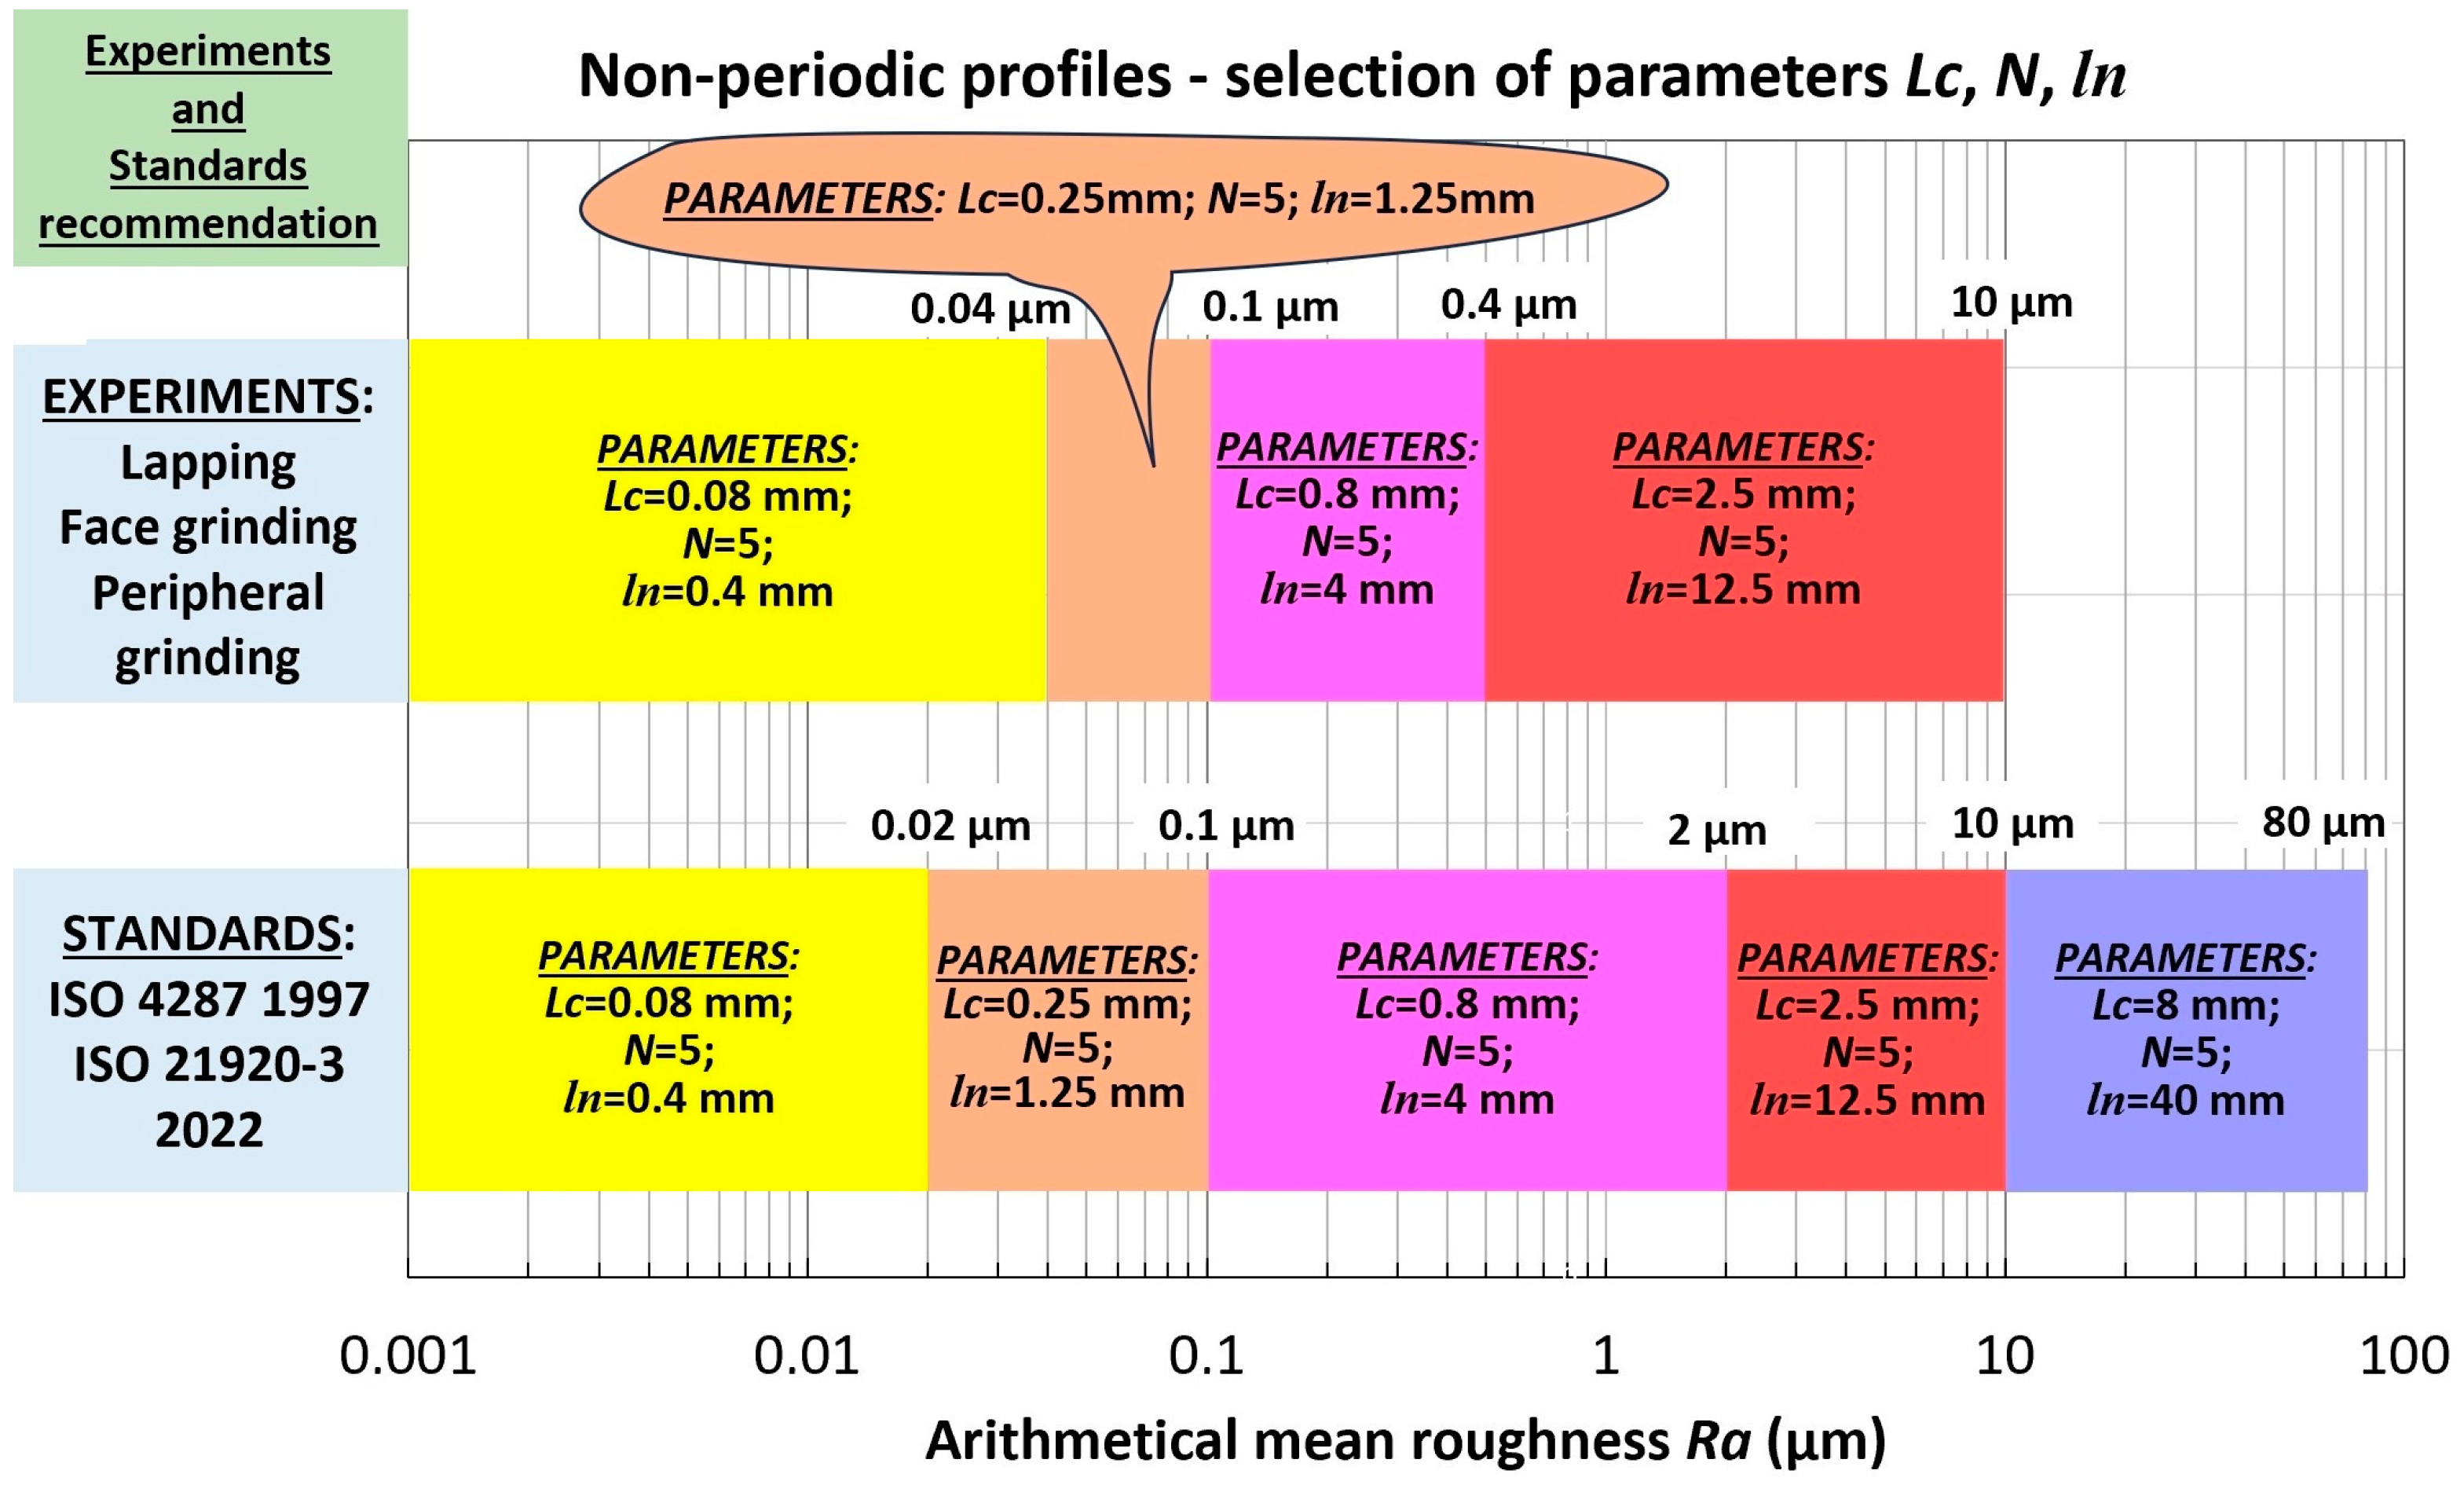
For the mentioned non-periodic samples with values up to
Ra = 0.1 µm, it is appropriate to use
Lc = 0.25 mm. Then, for values from
Ra = 0.1 µm to
Ra = 0.4 µm, it is appropriate to use
Lc = 0.8 mm. From a value of
Ra = 0.4 µm, it is advisable to use
Lc = 2.5 mm. It is shown more vividly in the following
Figure 12, while for comparison, the recommended settings of the cut-off
Lc filter according to the ISO standard [
33,
34,
35,
36,
37,
38,
39,
40] are also shown.
The shift of the boundary between Lc = 0.8 mm and Lc = 2.5 mm may be due to measurement uncertainties. The area with the cut-off value of the filter Lc = 0.25 mm starts only at the value Ra = 0.04 µm because reference samples with a smaller value of Ra were not available for the experiments.
On the basis of the above, it can be concluded that the guidelines according to the standard for the settings of the cut-off filter
Lc are applicable for obtaining relevant results for the evaluation of the surface roughness quantity
Ra (
Figure 12).
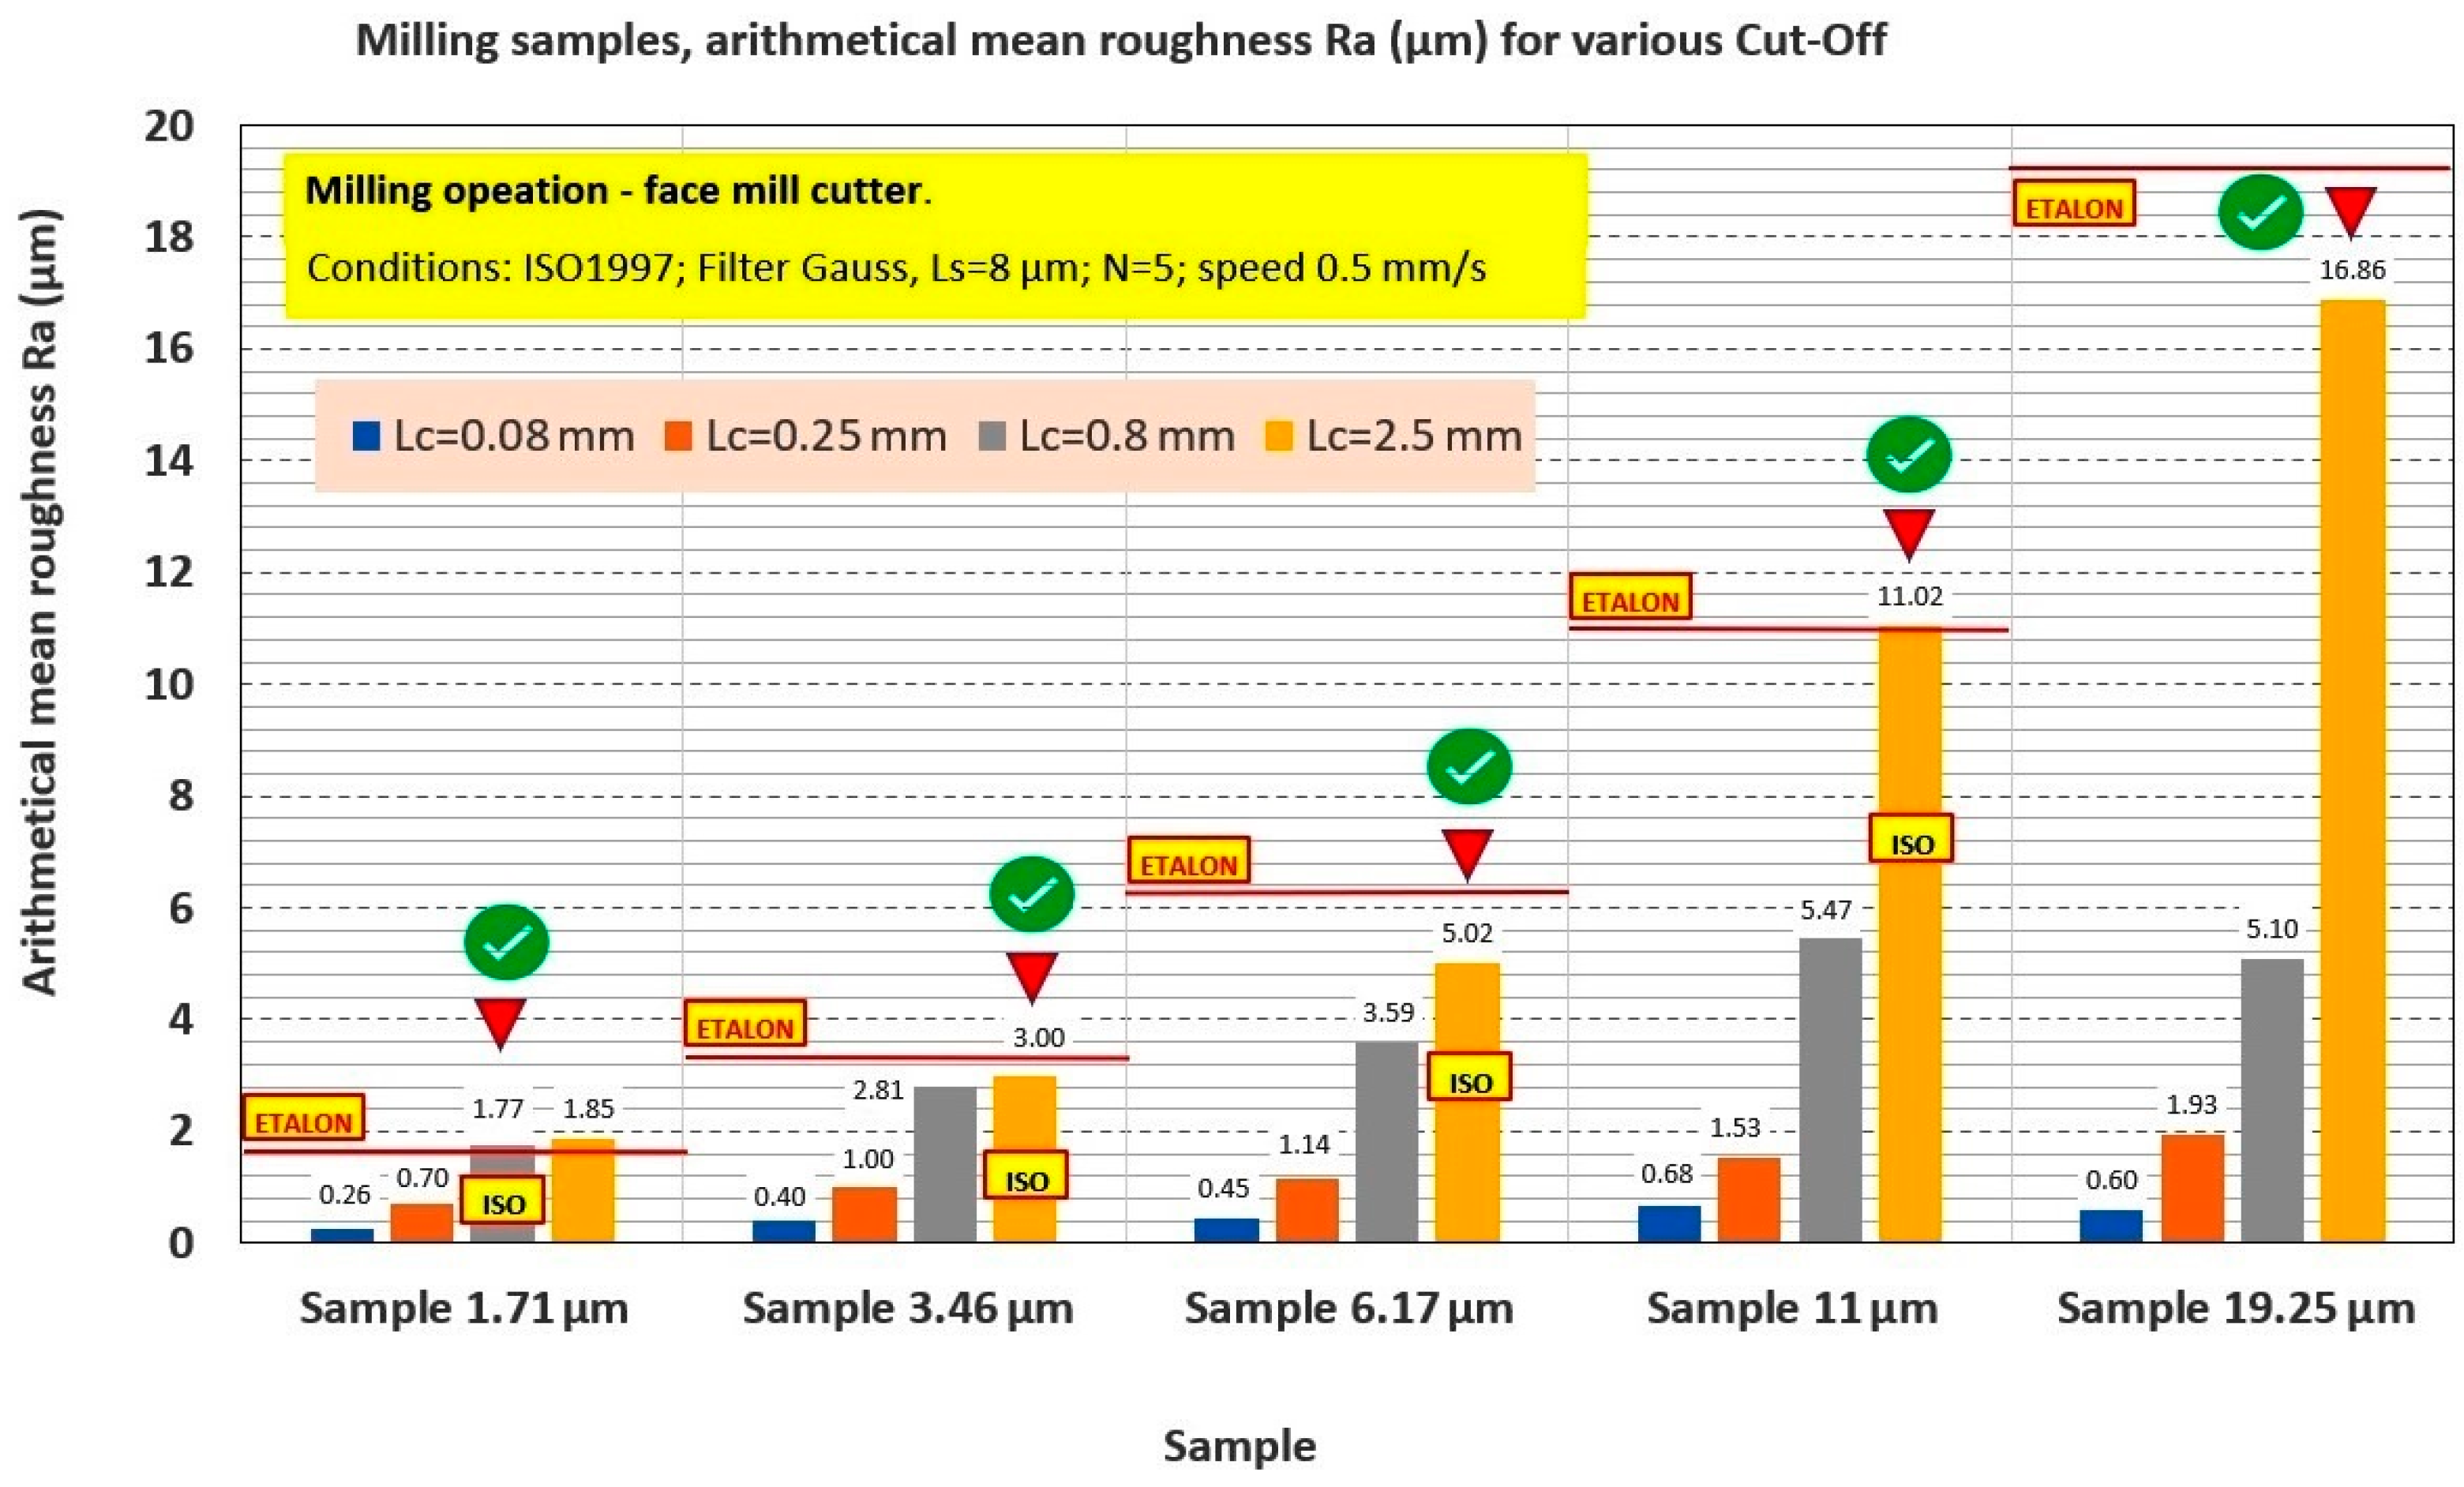
3.2.2. Effect of Cut-Off Filter Setting for Periodic Surface Roughness Profiles
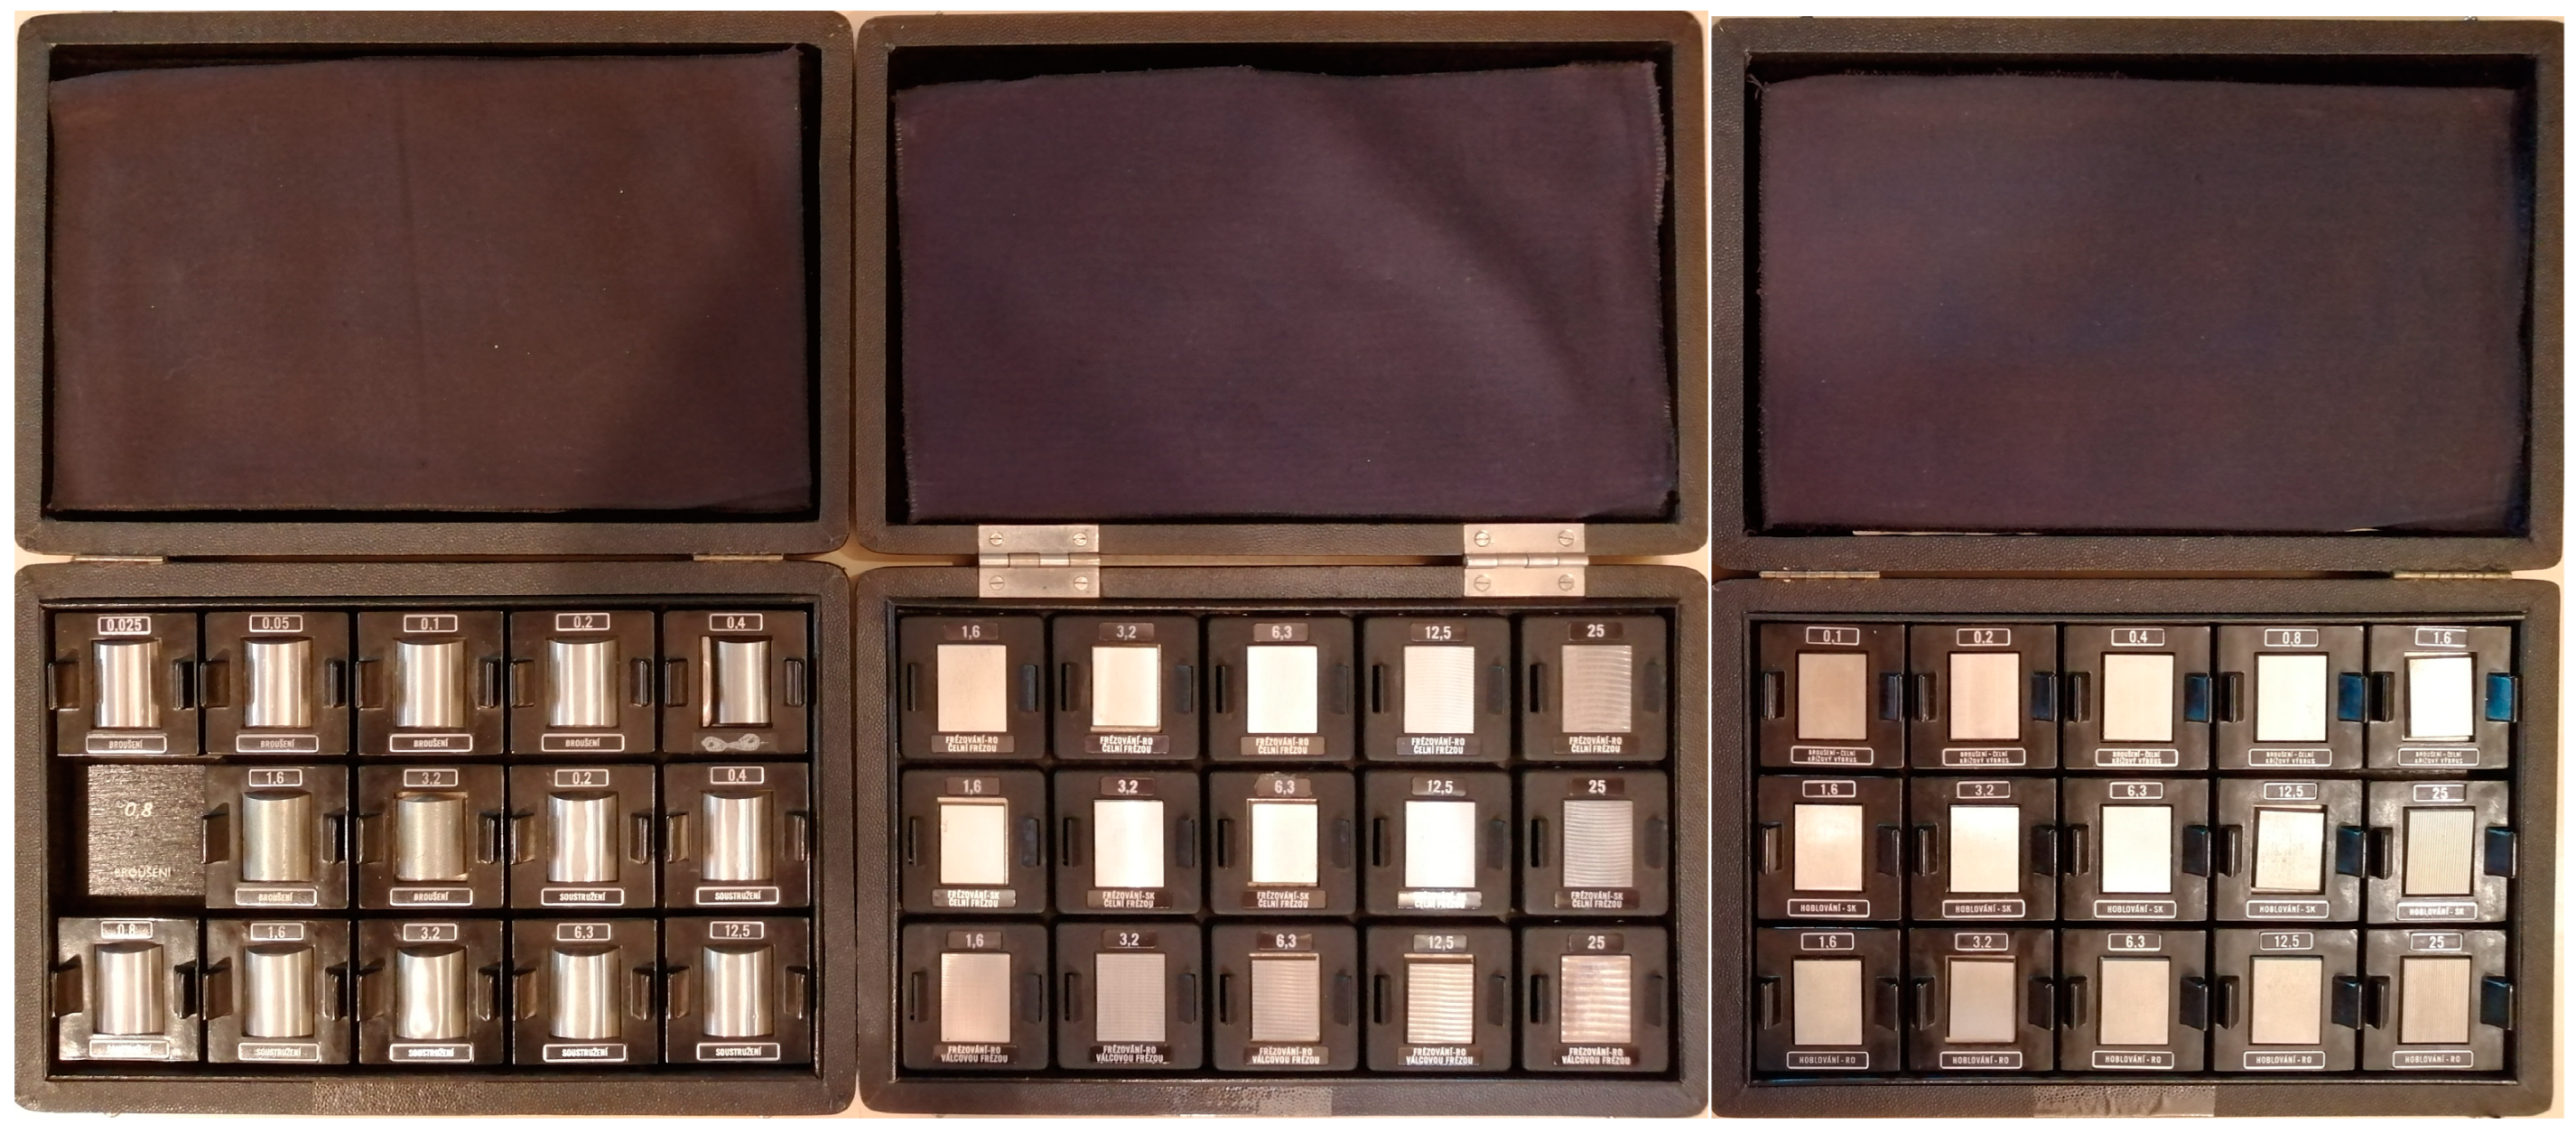
For the experimental investigation, standard samples of periodic surface roughness profiles (
Figure 13) with different
Ra values were selected and processed using the technology (
Table 8):
- -
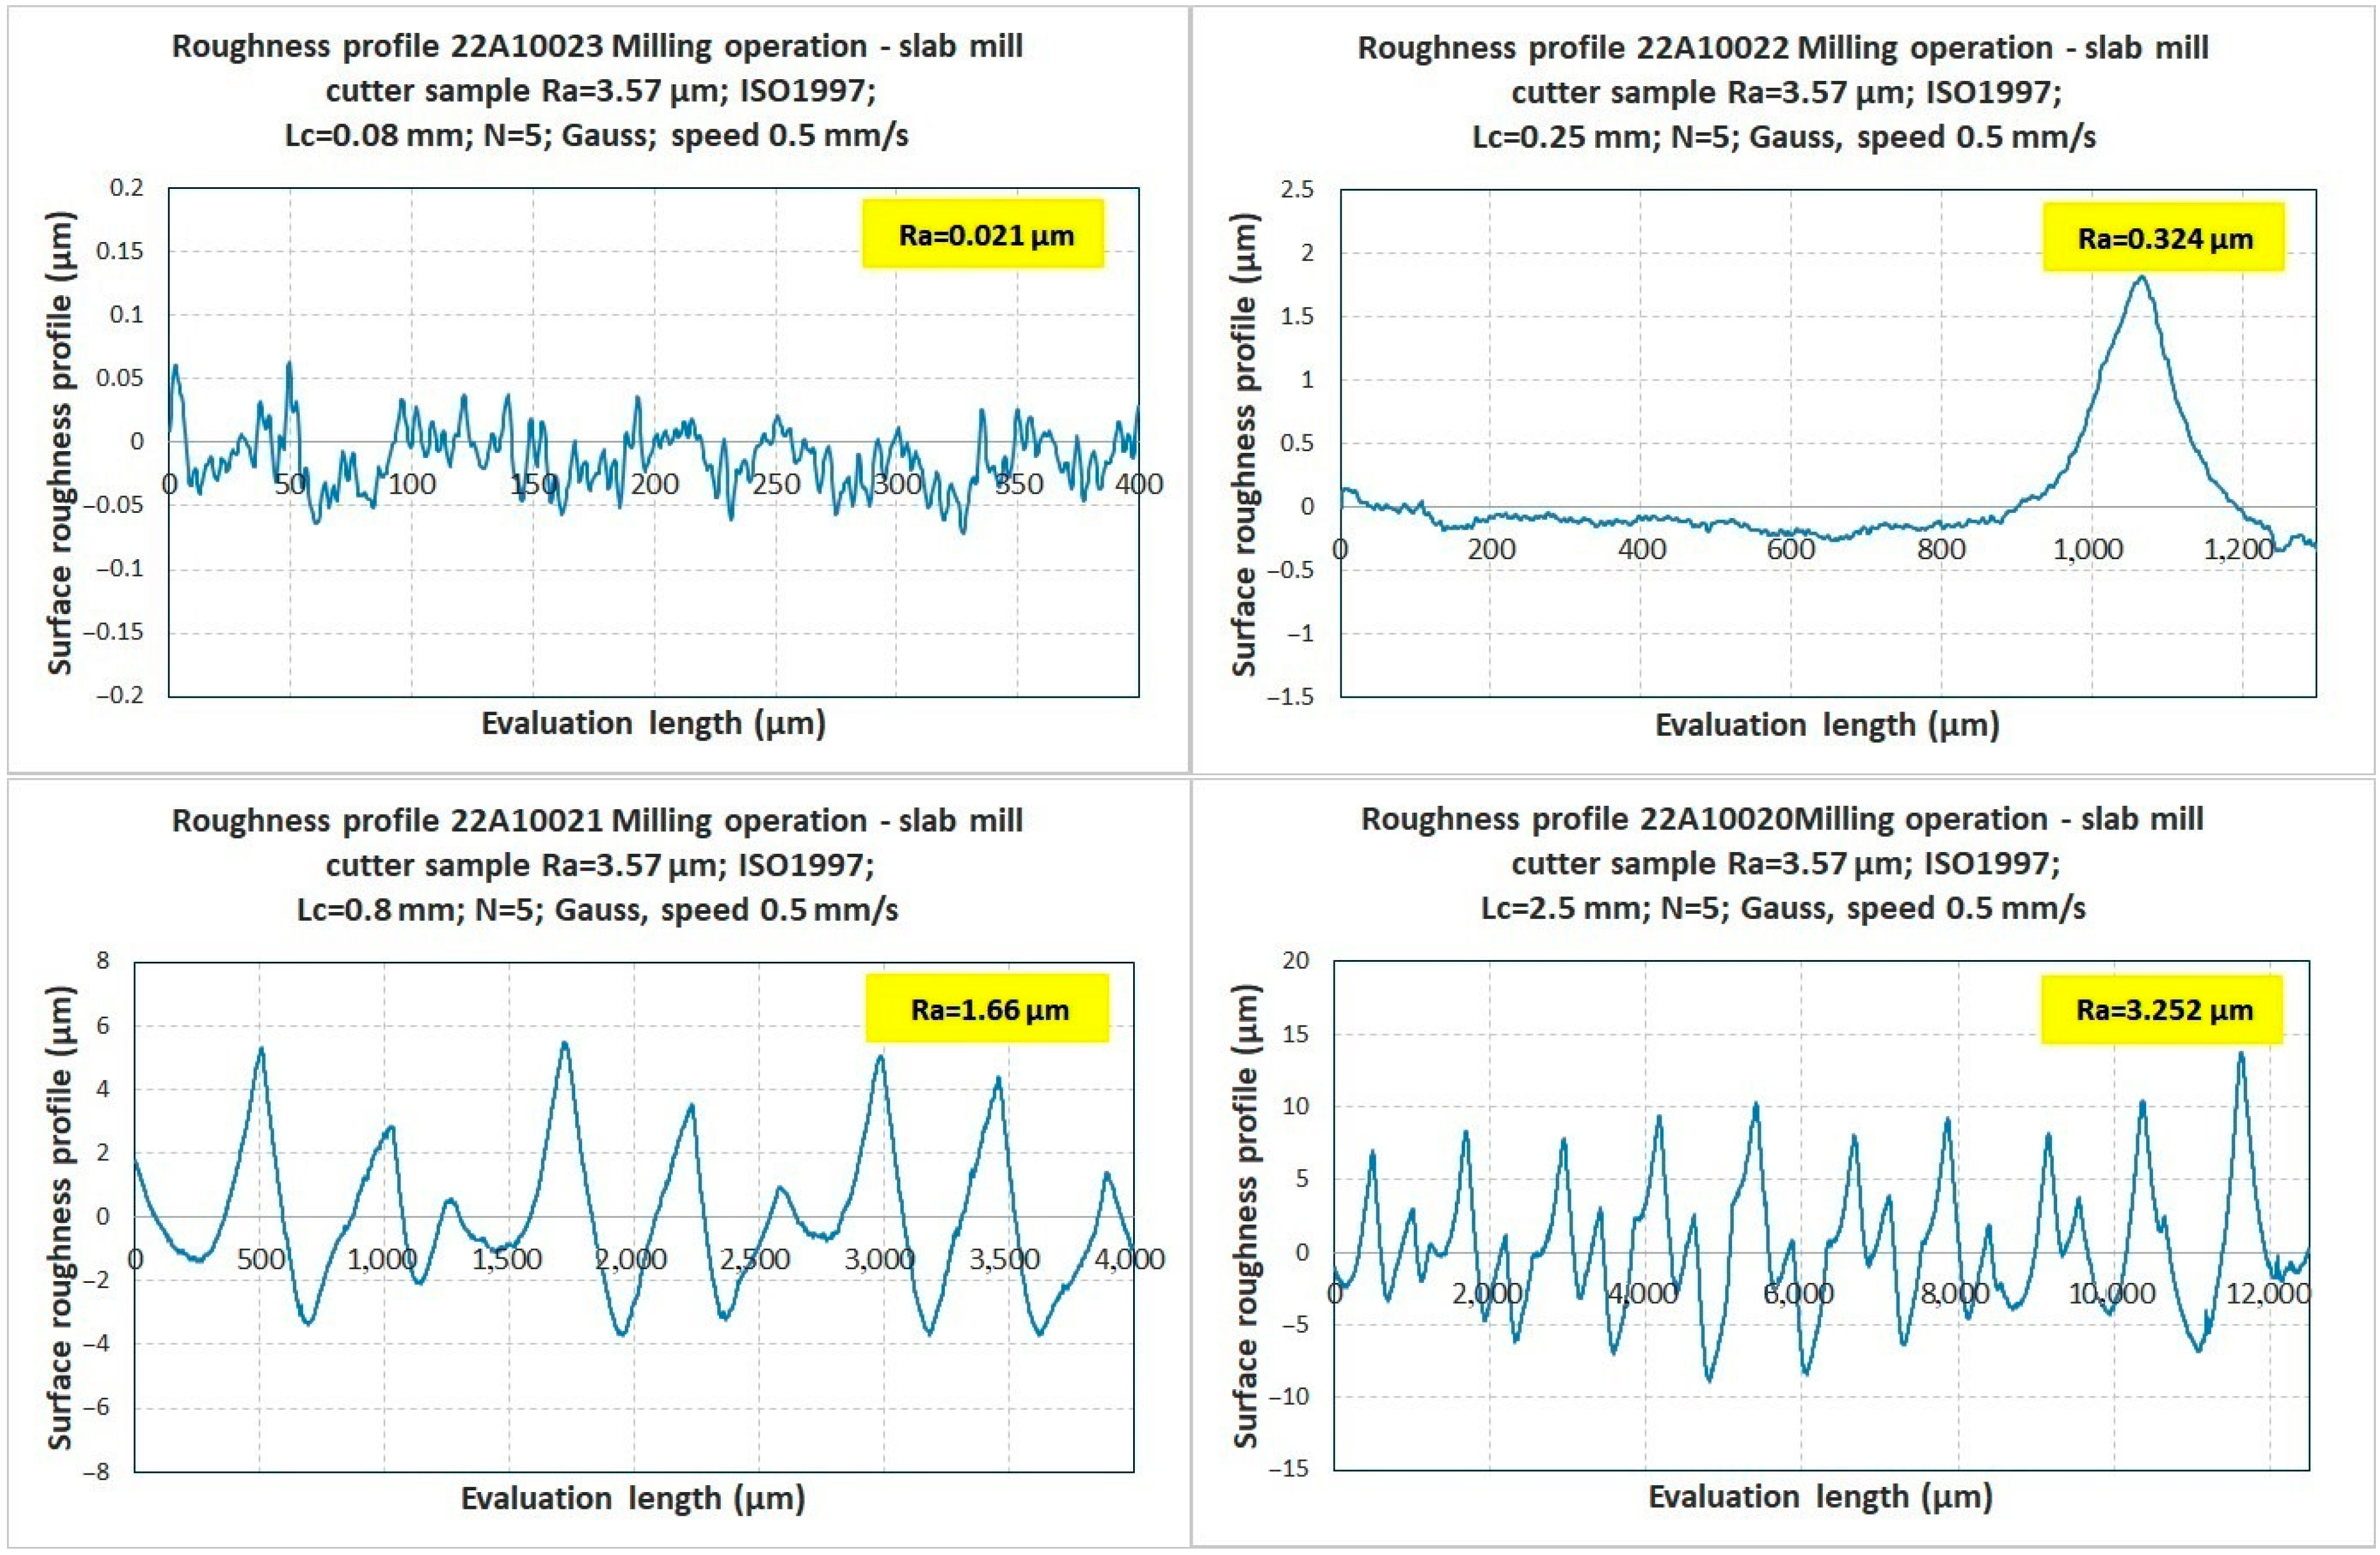
Milling operation with a slab mill cutter
- -
Milling operation with a face mill cutter
- -
Turning operation
- -
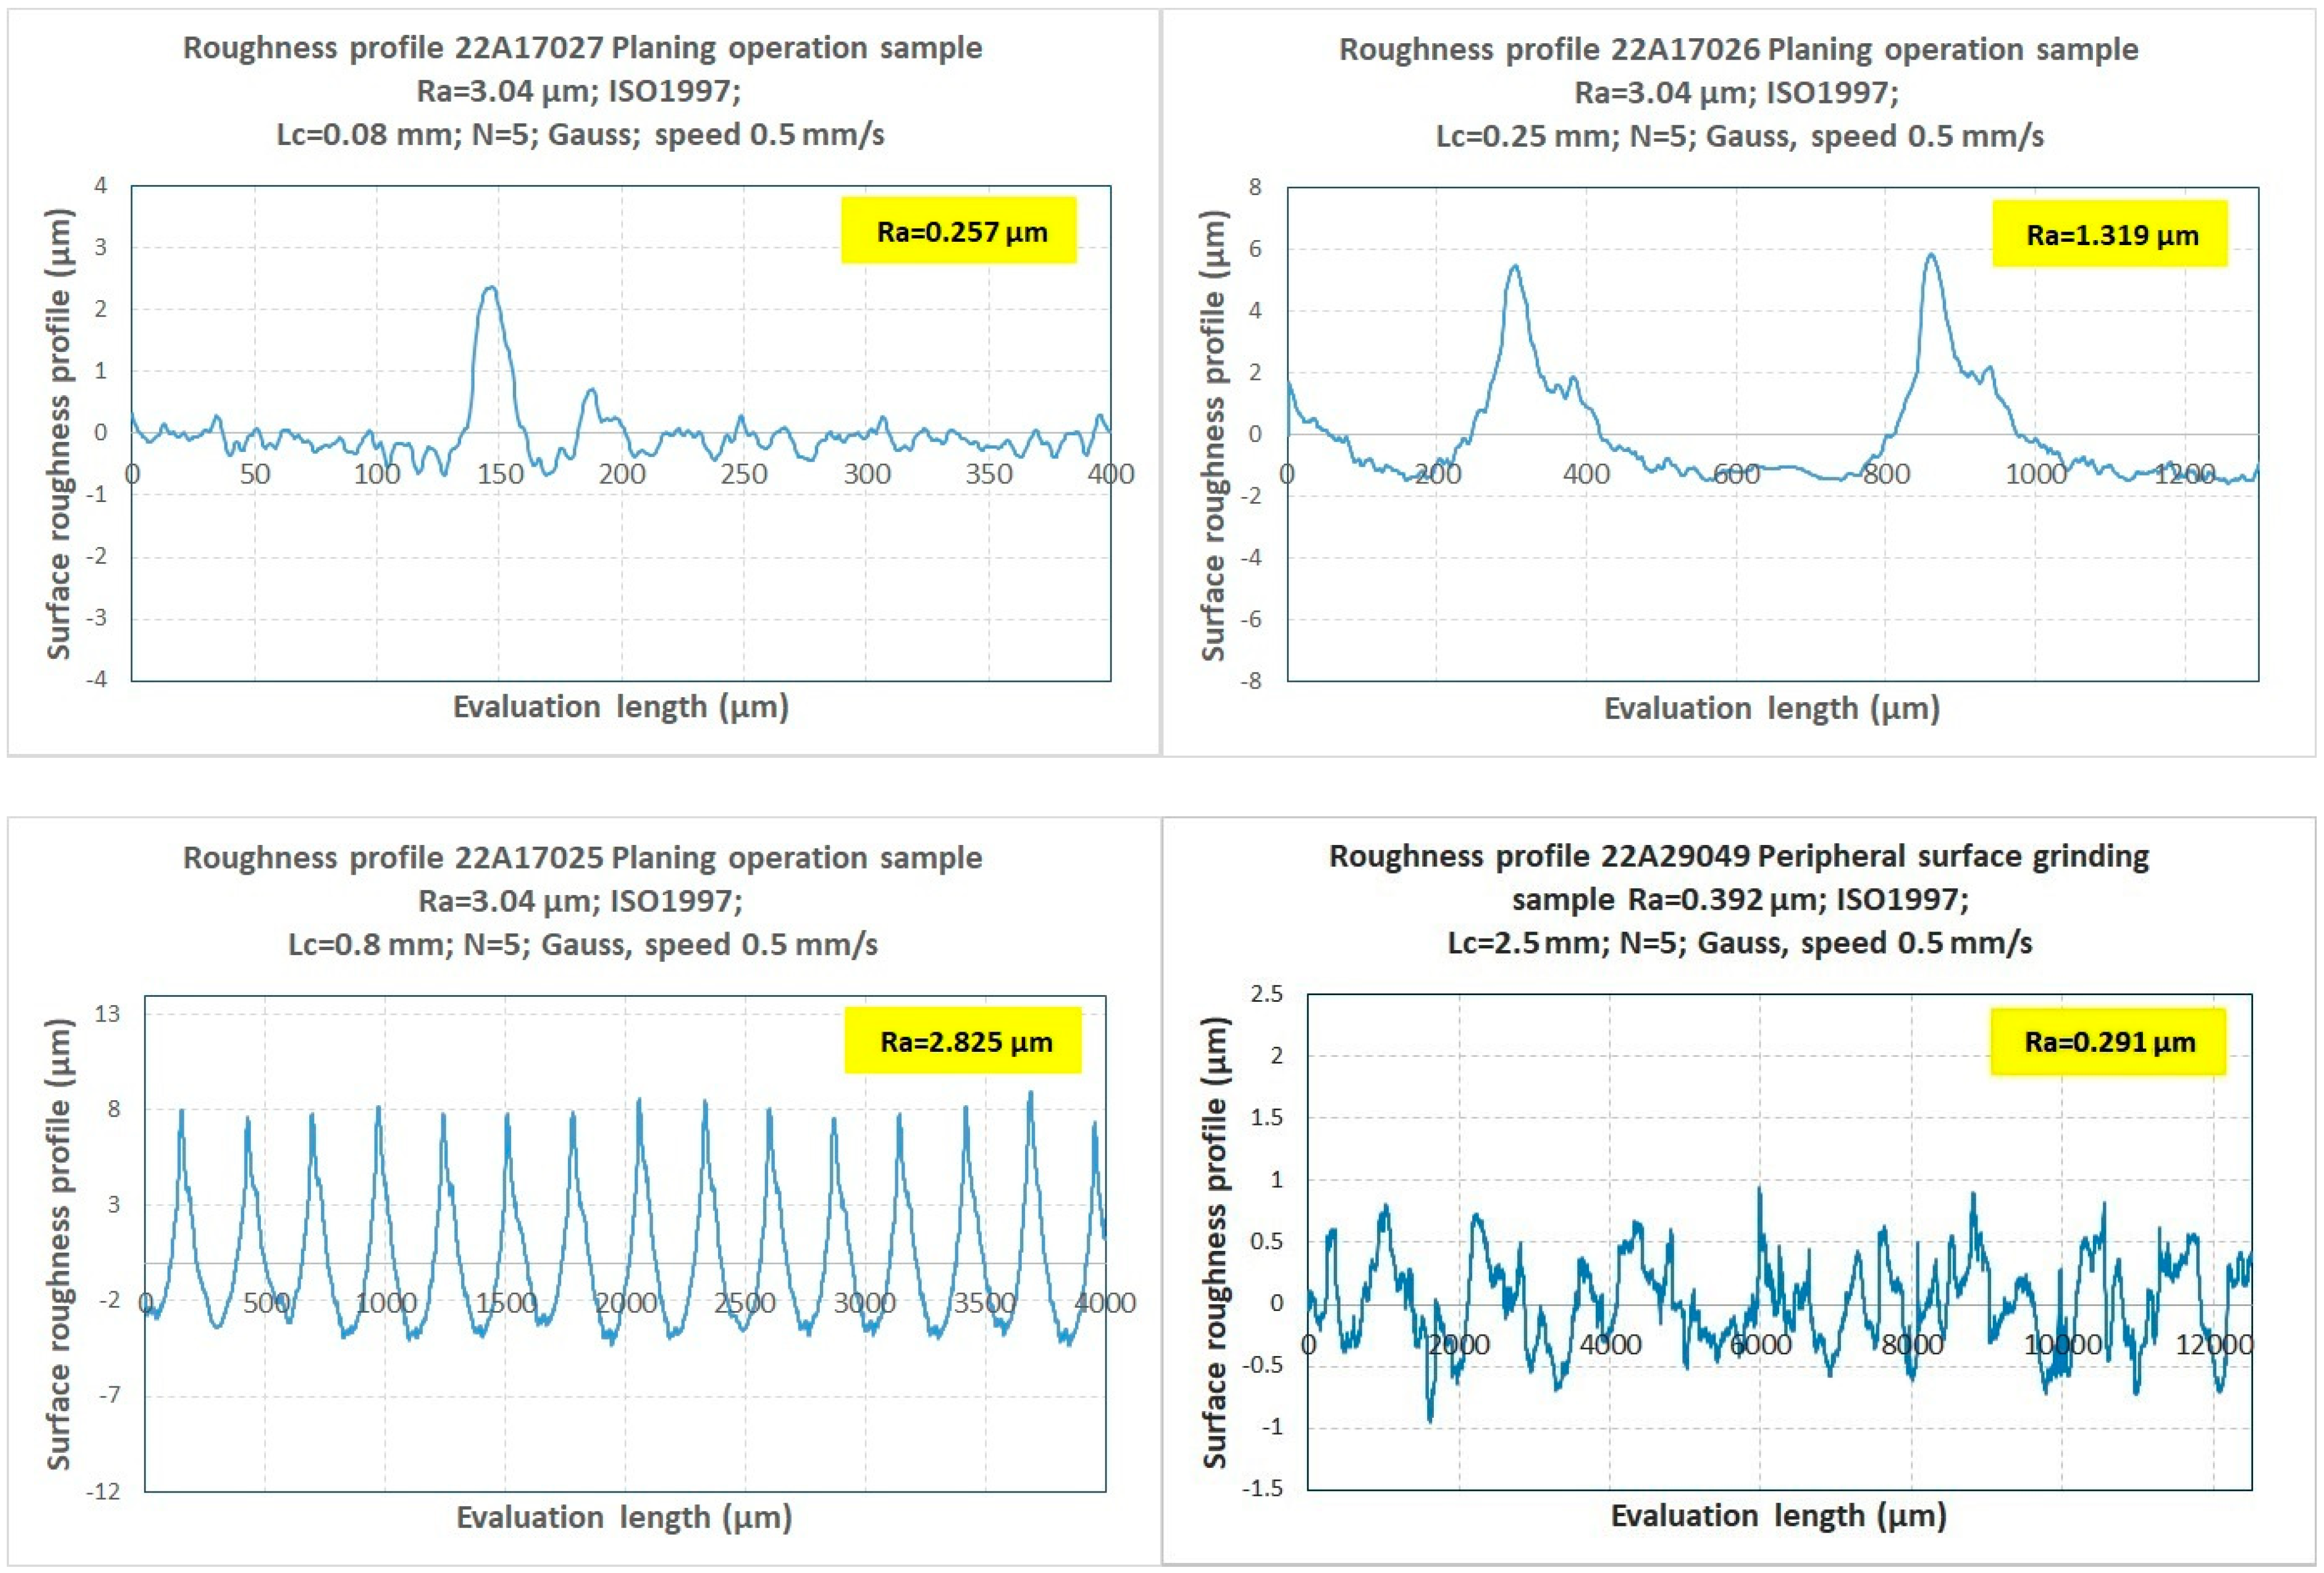
Planing operation
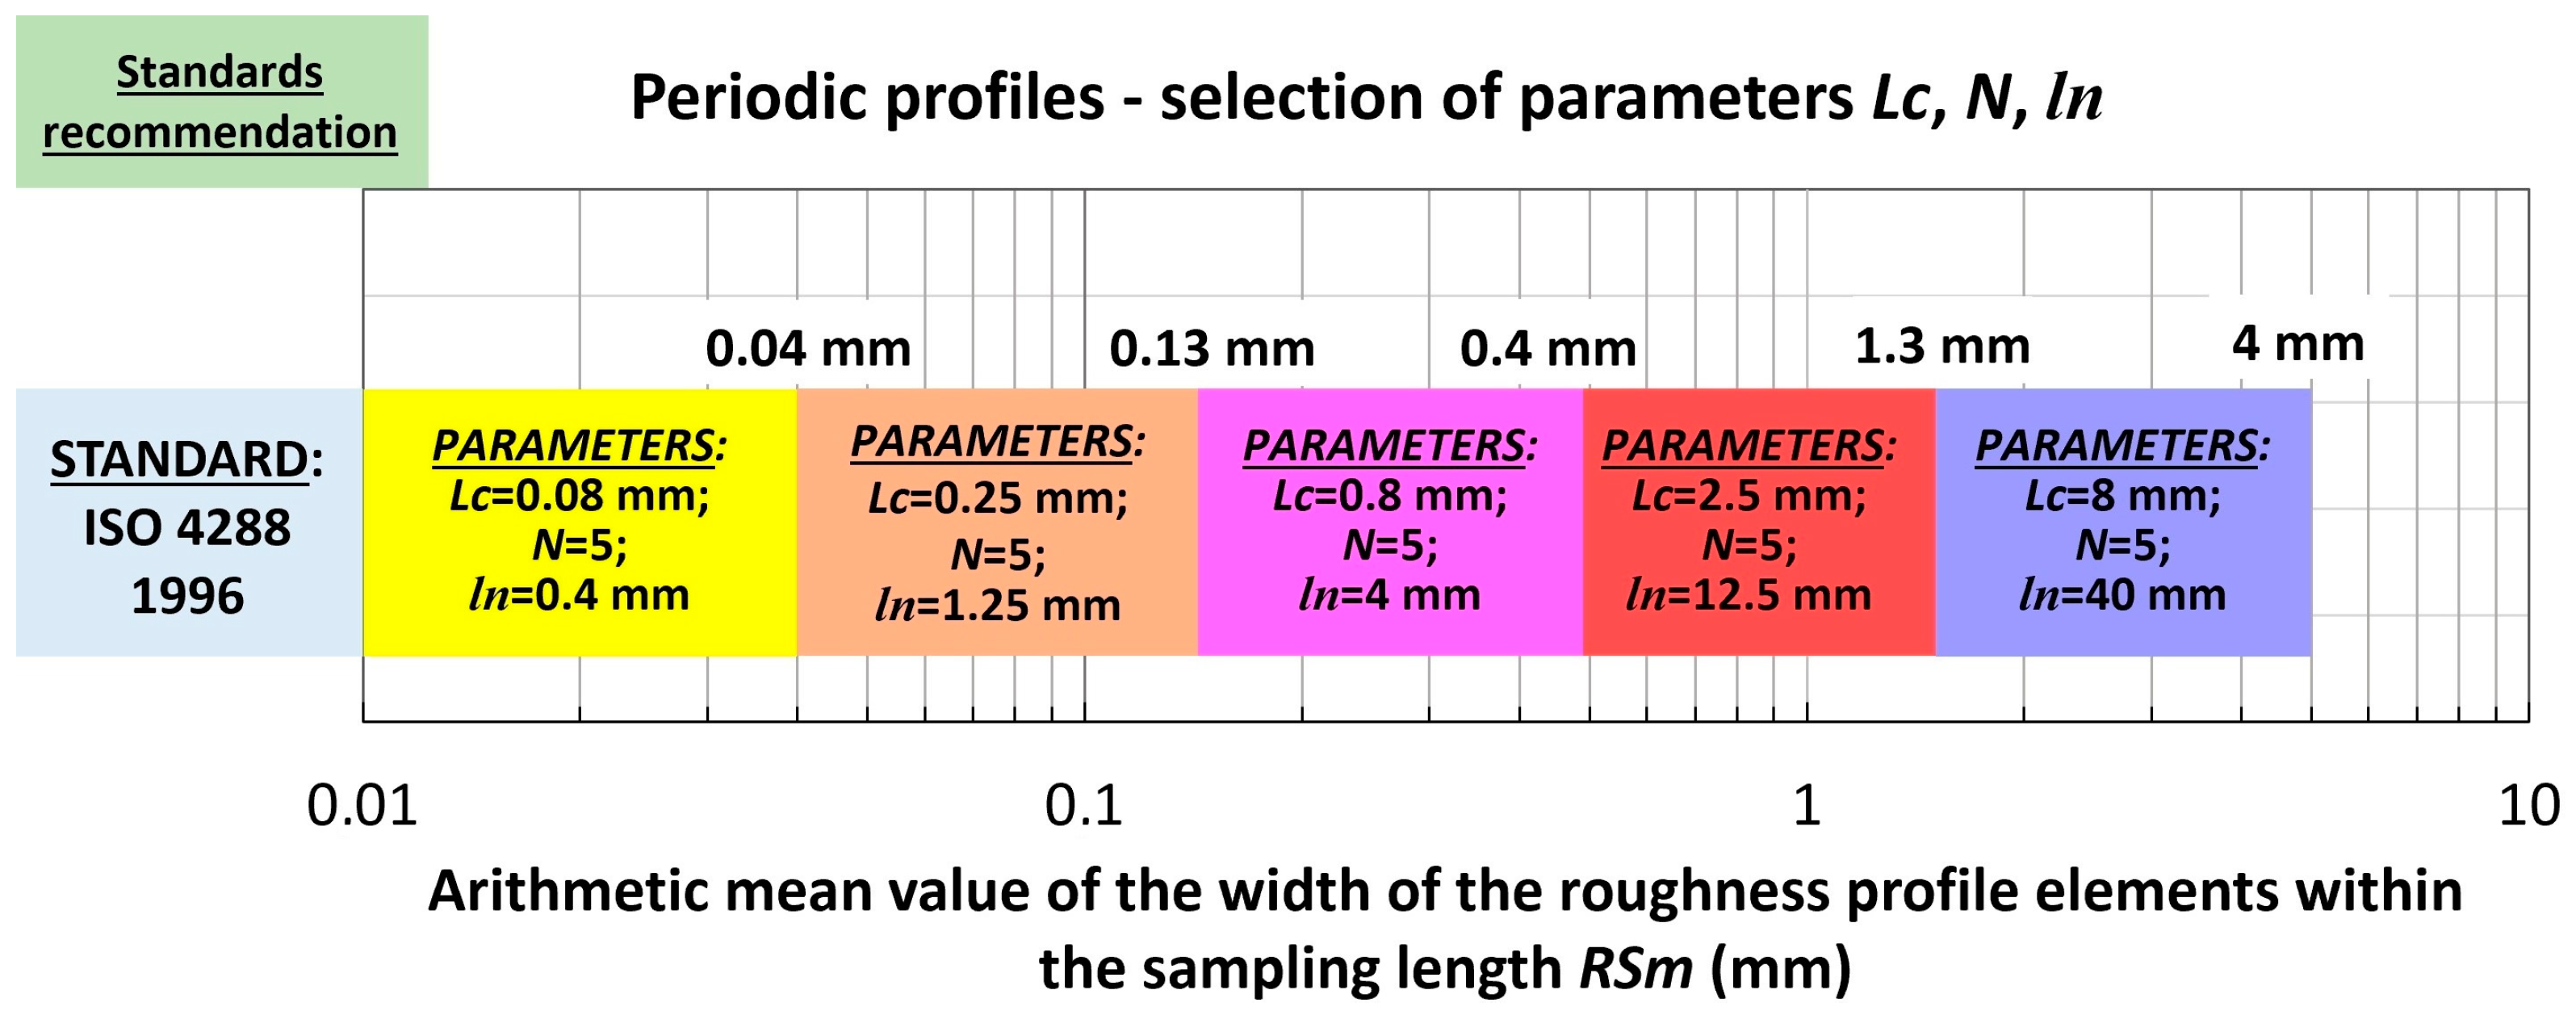
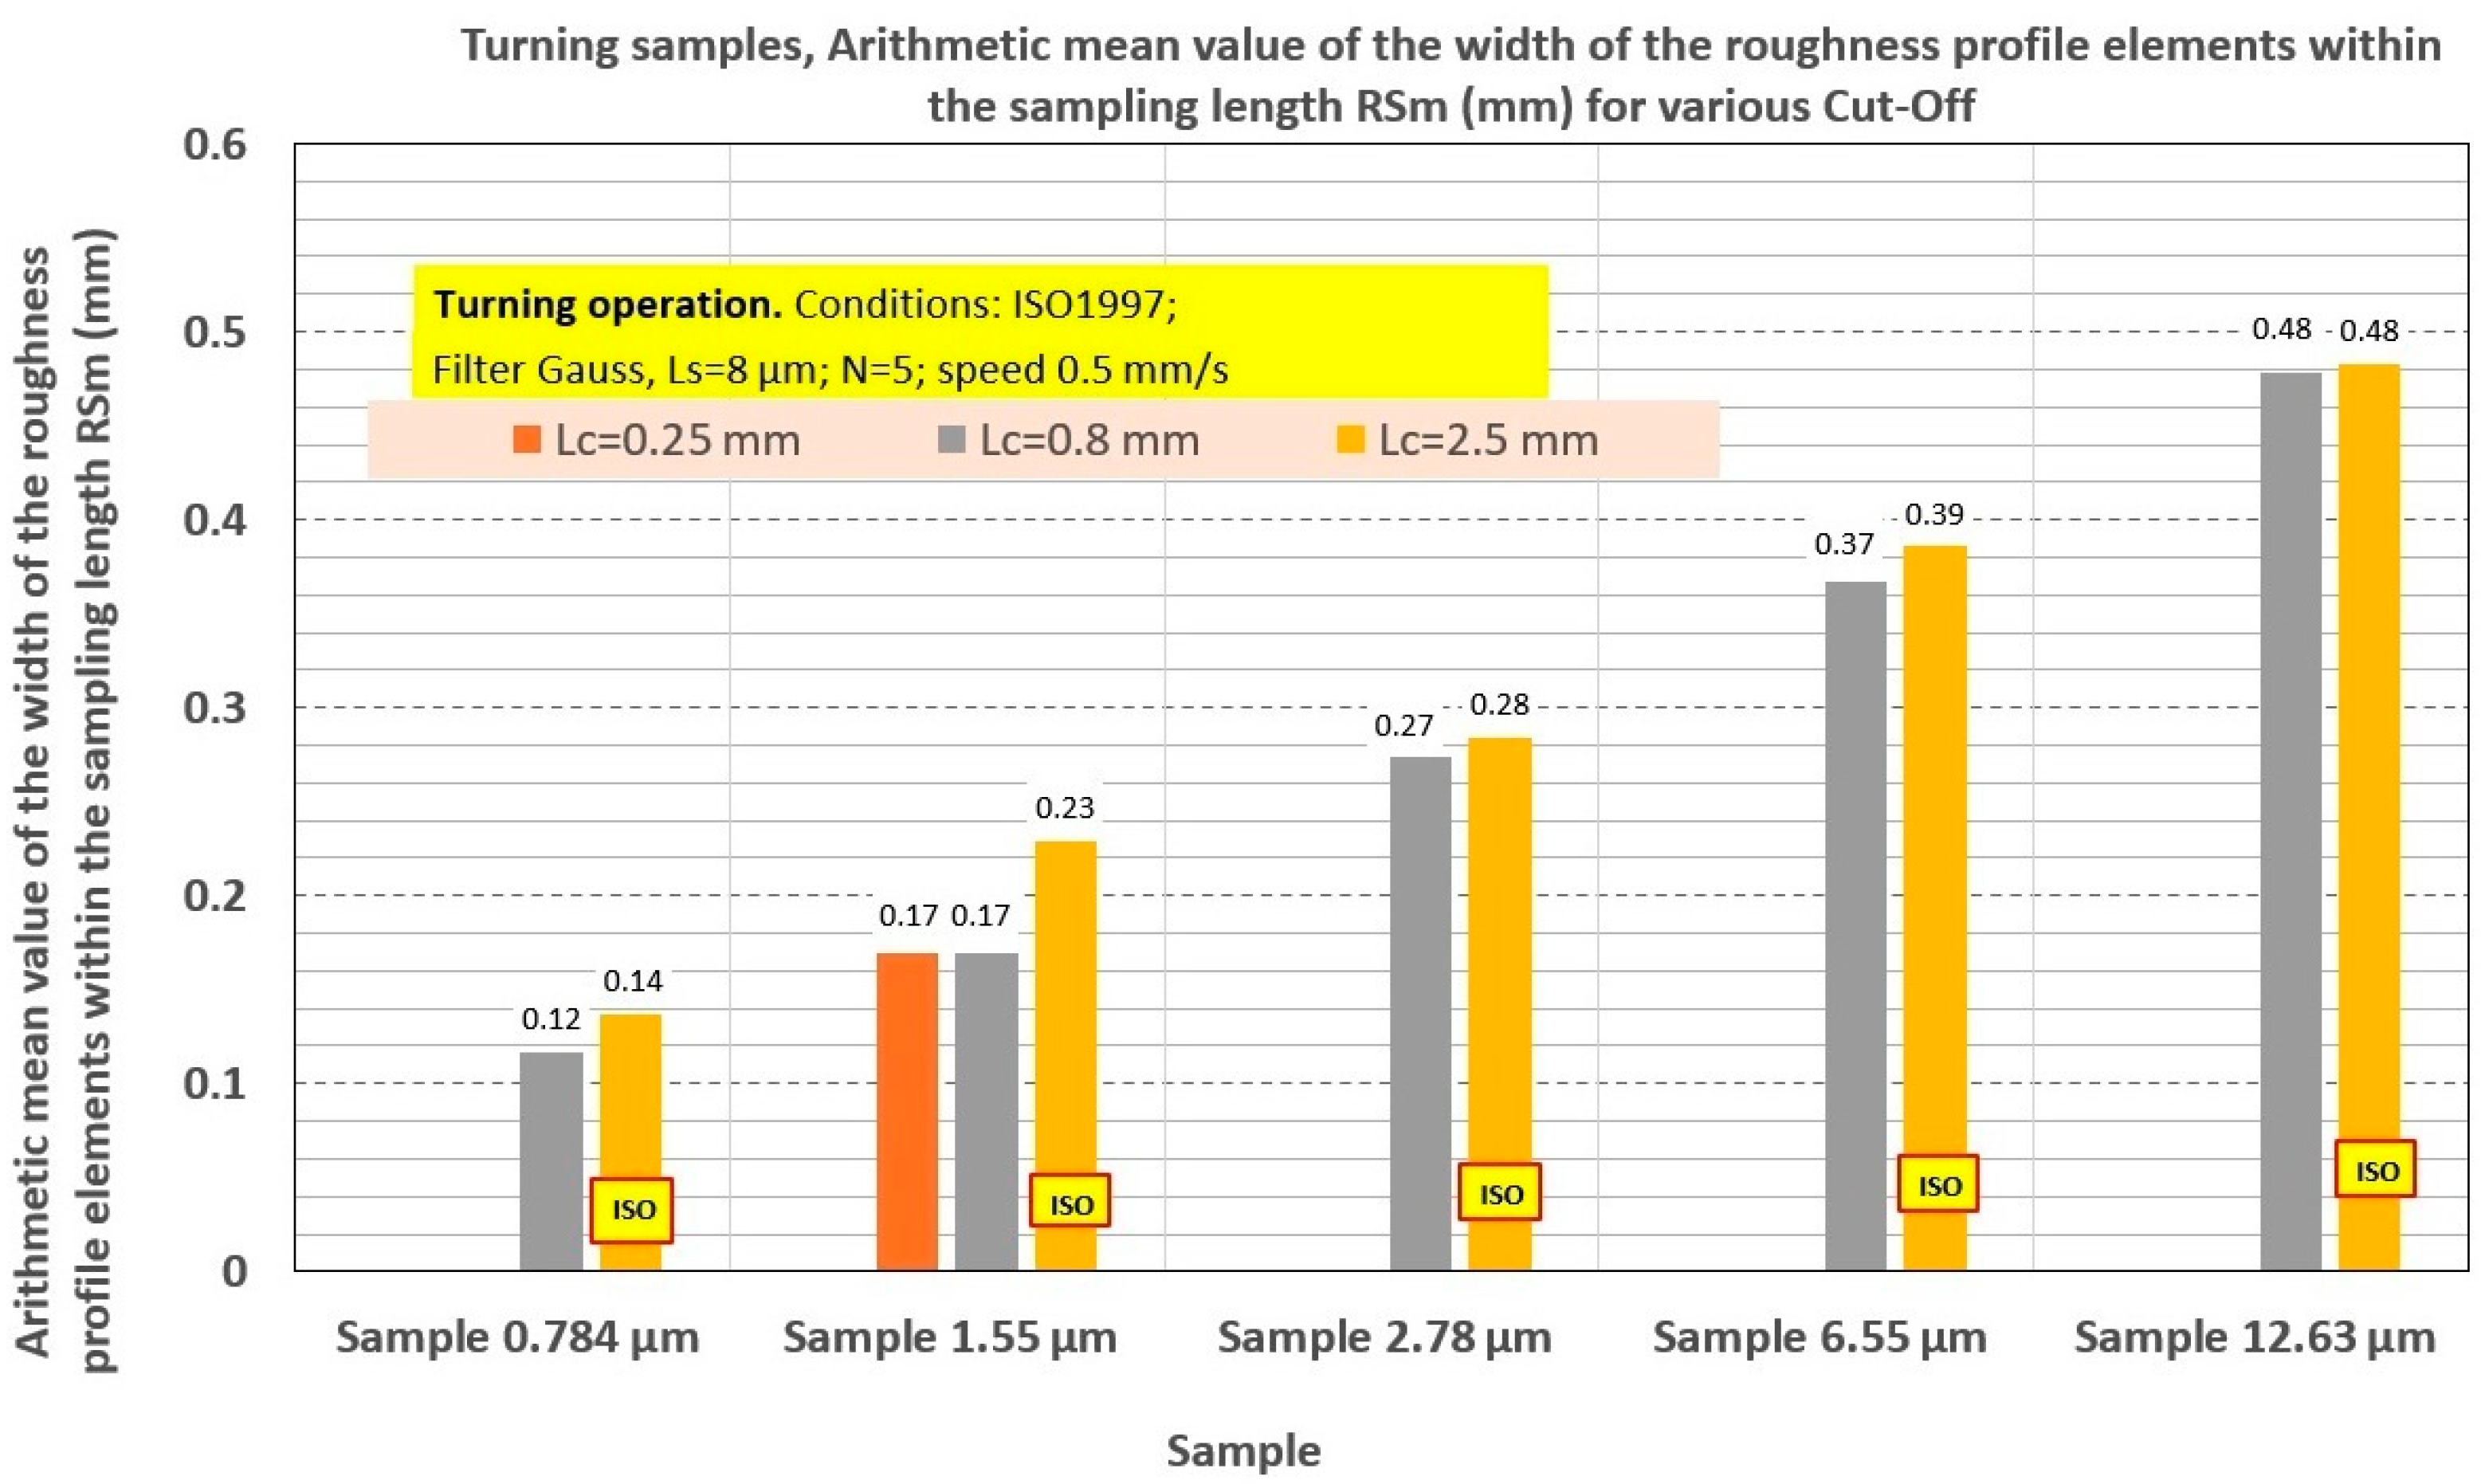
For periodic profiles (turning, milling, planing), the ISO 4288:1996 standard [
34] recommends monitoring the mean spacing of the profile elements
RSm (
Appendix A) (ISO 21920-2) [
38] as a parameter for choosing the cut-off filter
Lc. Here again, the problem arises in that the setting of the cut-off filter
Lc is dependent on the value of the parameter, in this case,
RSm, which, however, will only be available as a result of the evaluation of the surface roughness measurement. Standard ISO 4288:1996 presents a table of recommended values of section length or filter cut-off according to
RSm values (
Table 9).
Table 9.
Recommended cut-off values of the
Lc parameter or section lengths
lr and evaluated lengths ln for periodic profiles according to ISO 4288:1996 [
34].
Table 9.
Recommended cut-off values of the
Lc parameter or section lengths
lr and evaluated lengths ln for periodic profiles according to ISO 4288:1996 [
34].
| Mean Spacing of the Profile Elements RSm (mm) | Roughness Sampling Length lr (mm) | Roughness Evaluation Length ln (mm) |
|---|
| 0.013 < RSm ≤ 0.04 | 0.08 | 0.4 |
| 0.04 < RSm ≤ 0.13 | 0.25 | 1.25 |
| 0.13 < RSm ≤ 0.4 | 0.8 | 4 |
| 0.4 < RSm ≤ 1.3 | 2.5 | 12.5 |
| 1.3 < RSm ≤ 4 | 8 | 40 |
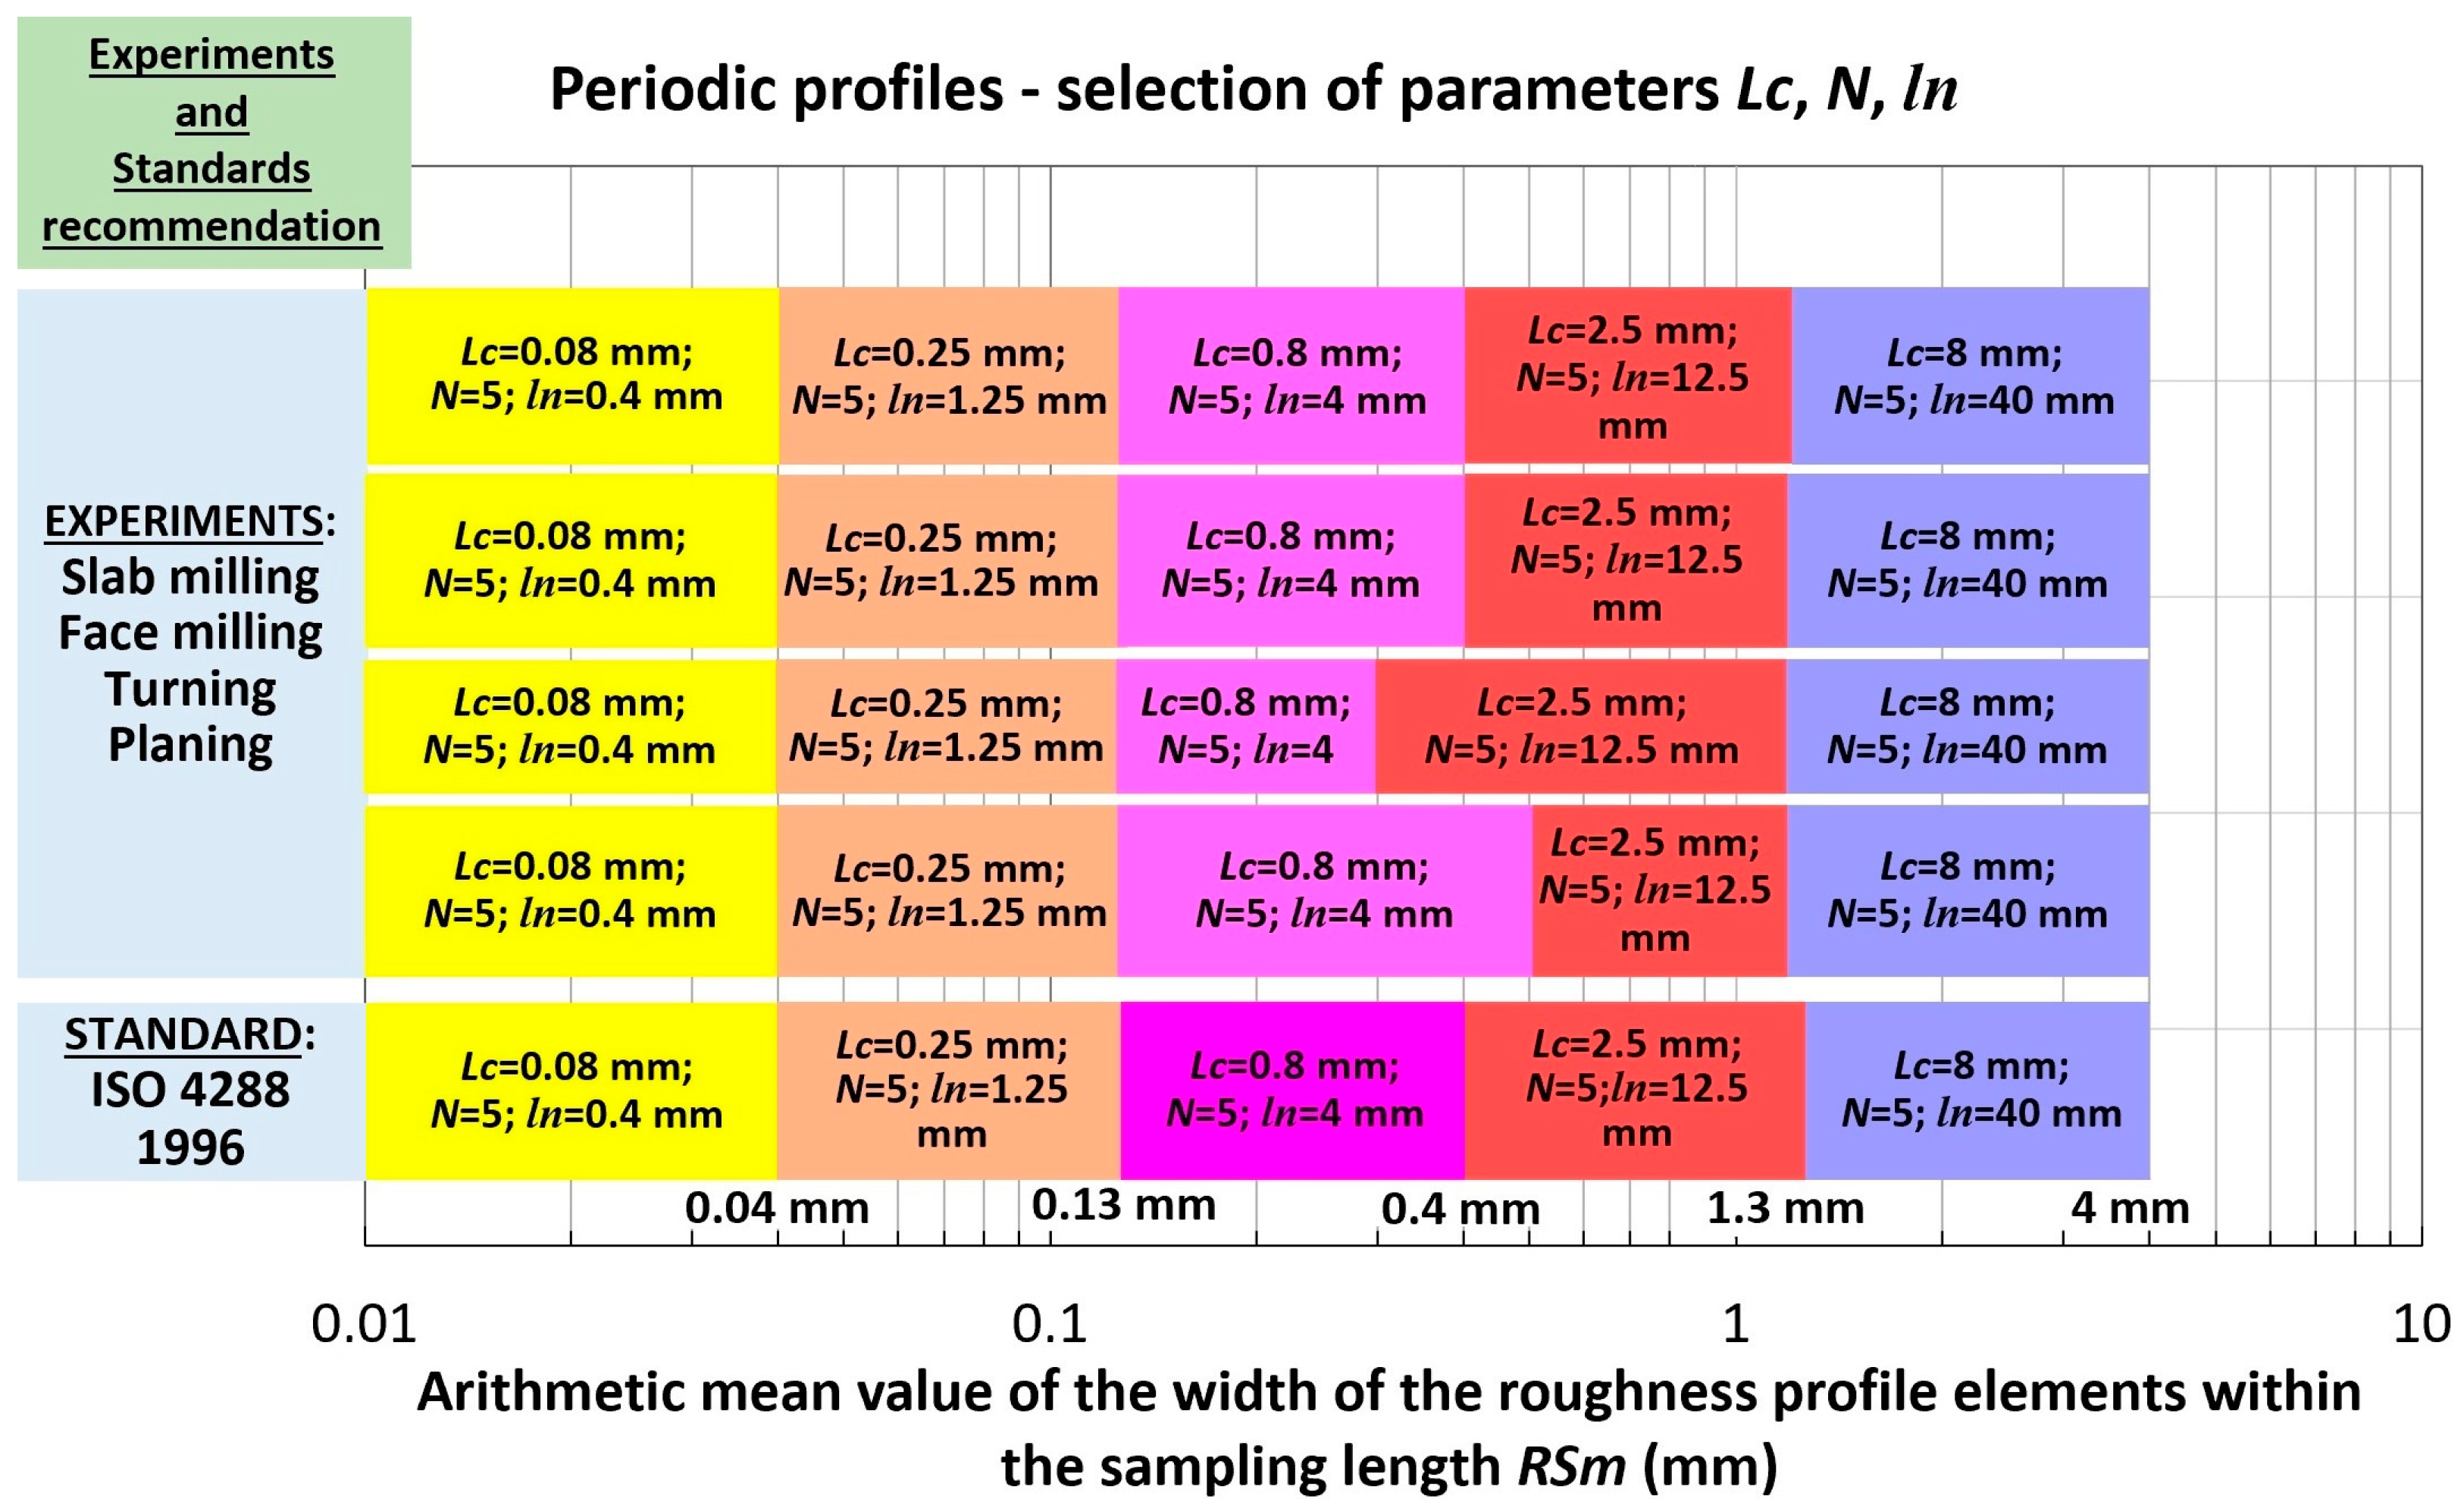
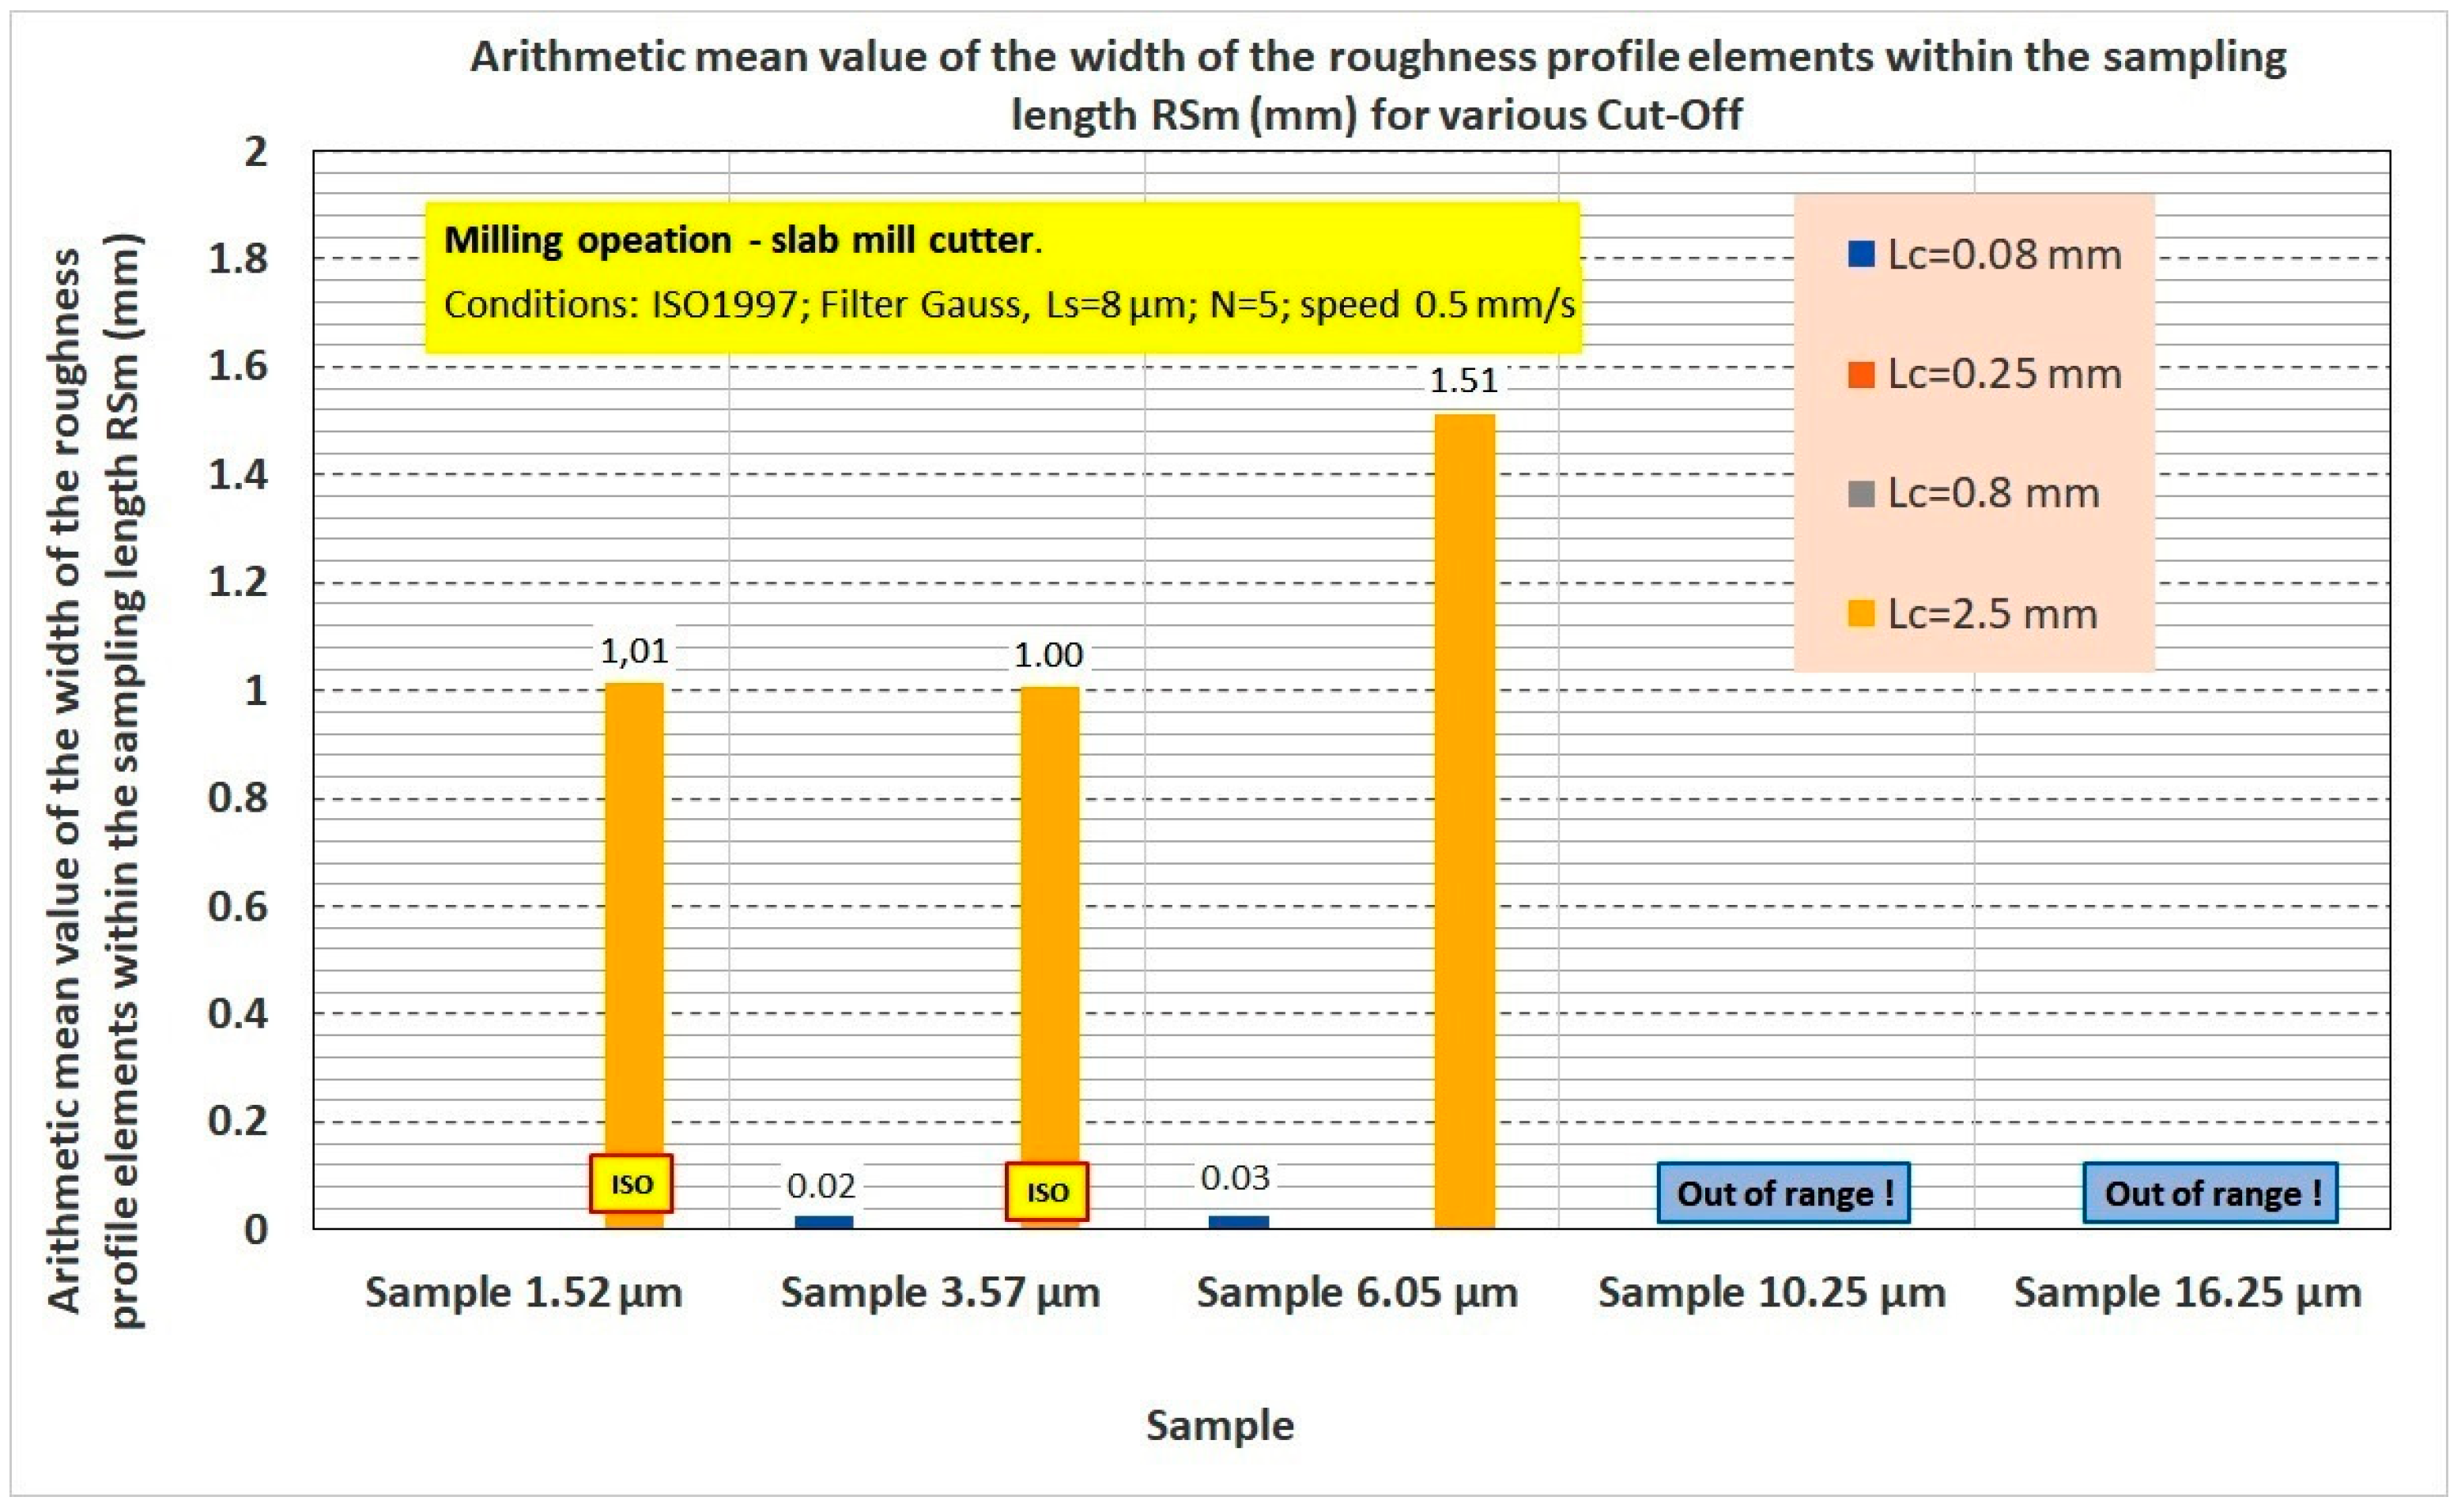
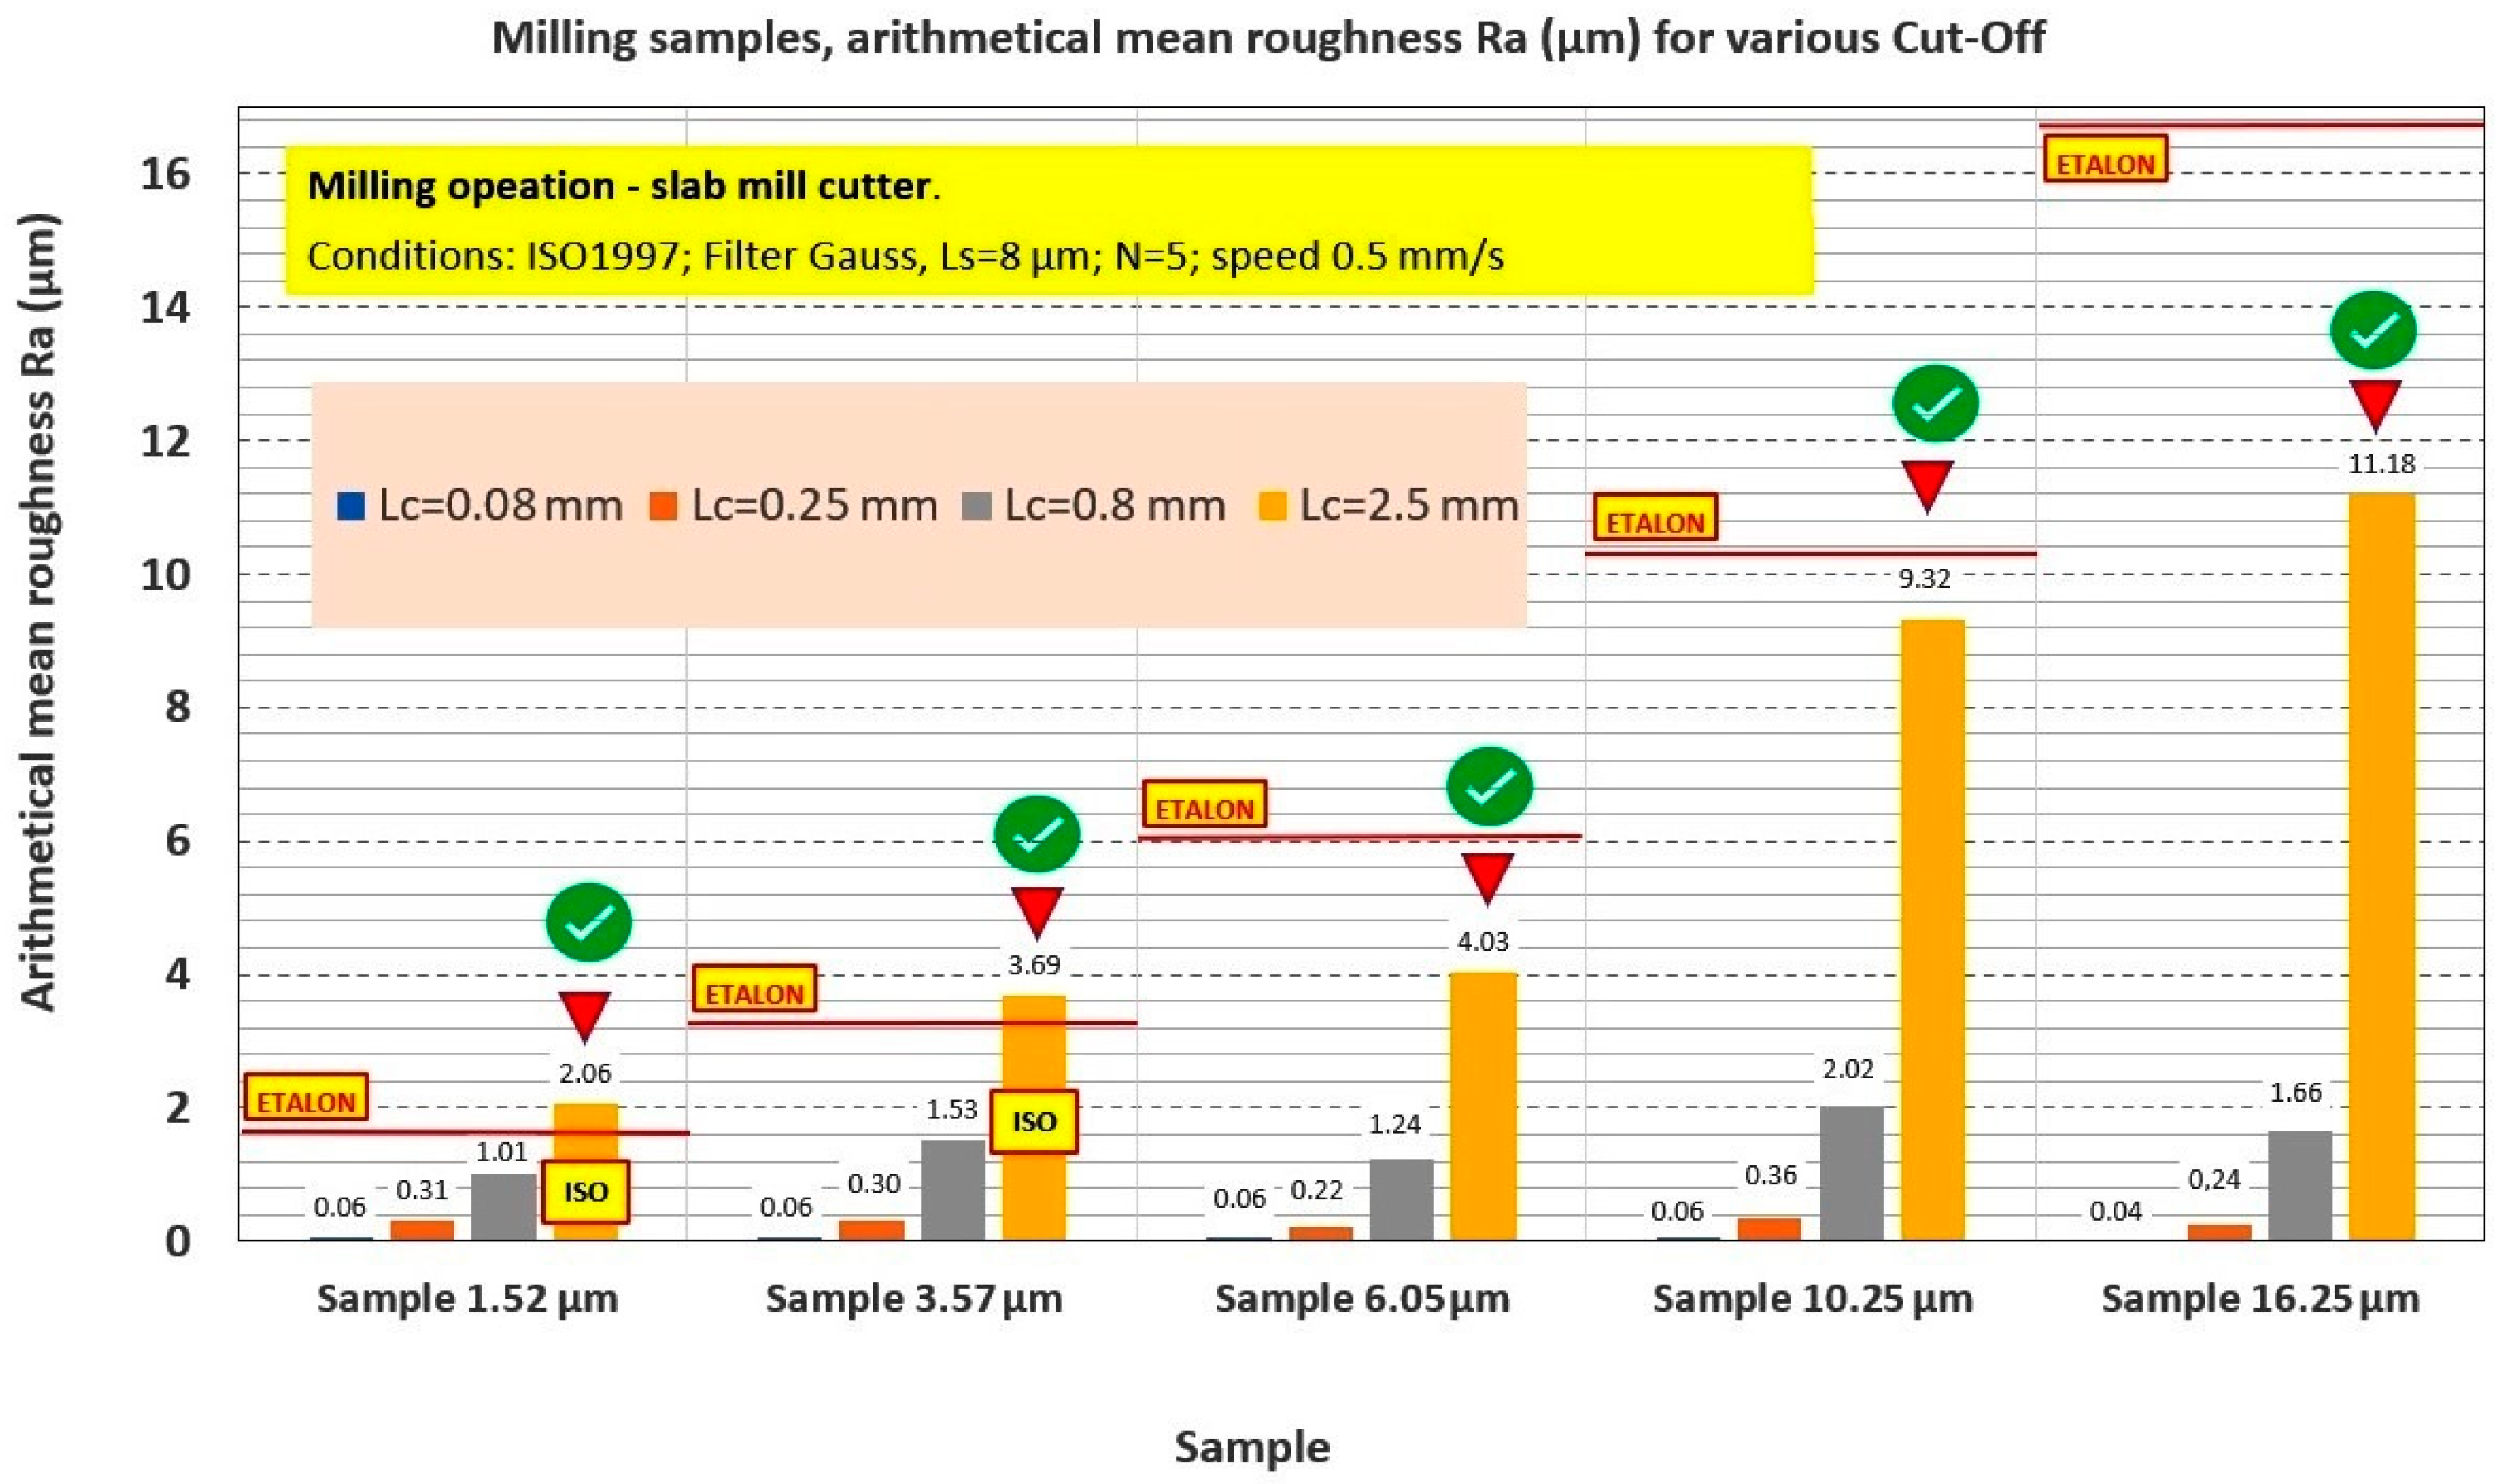
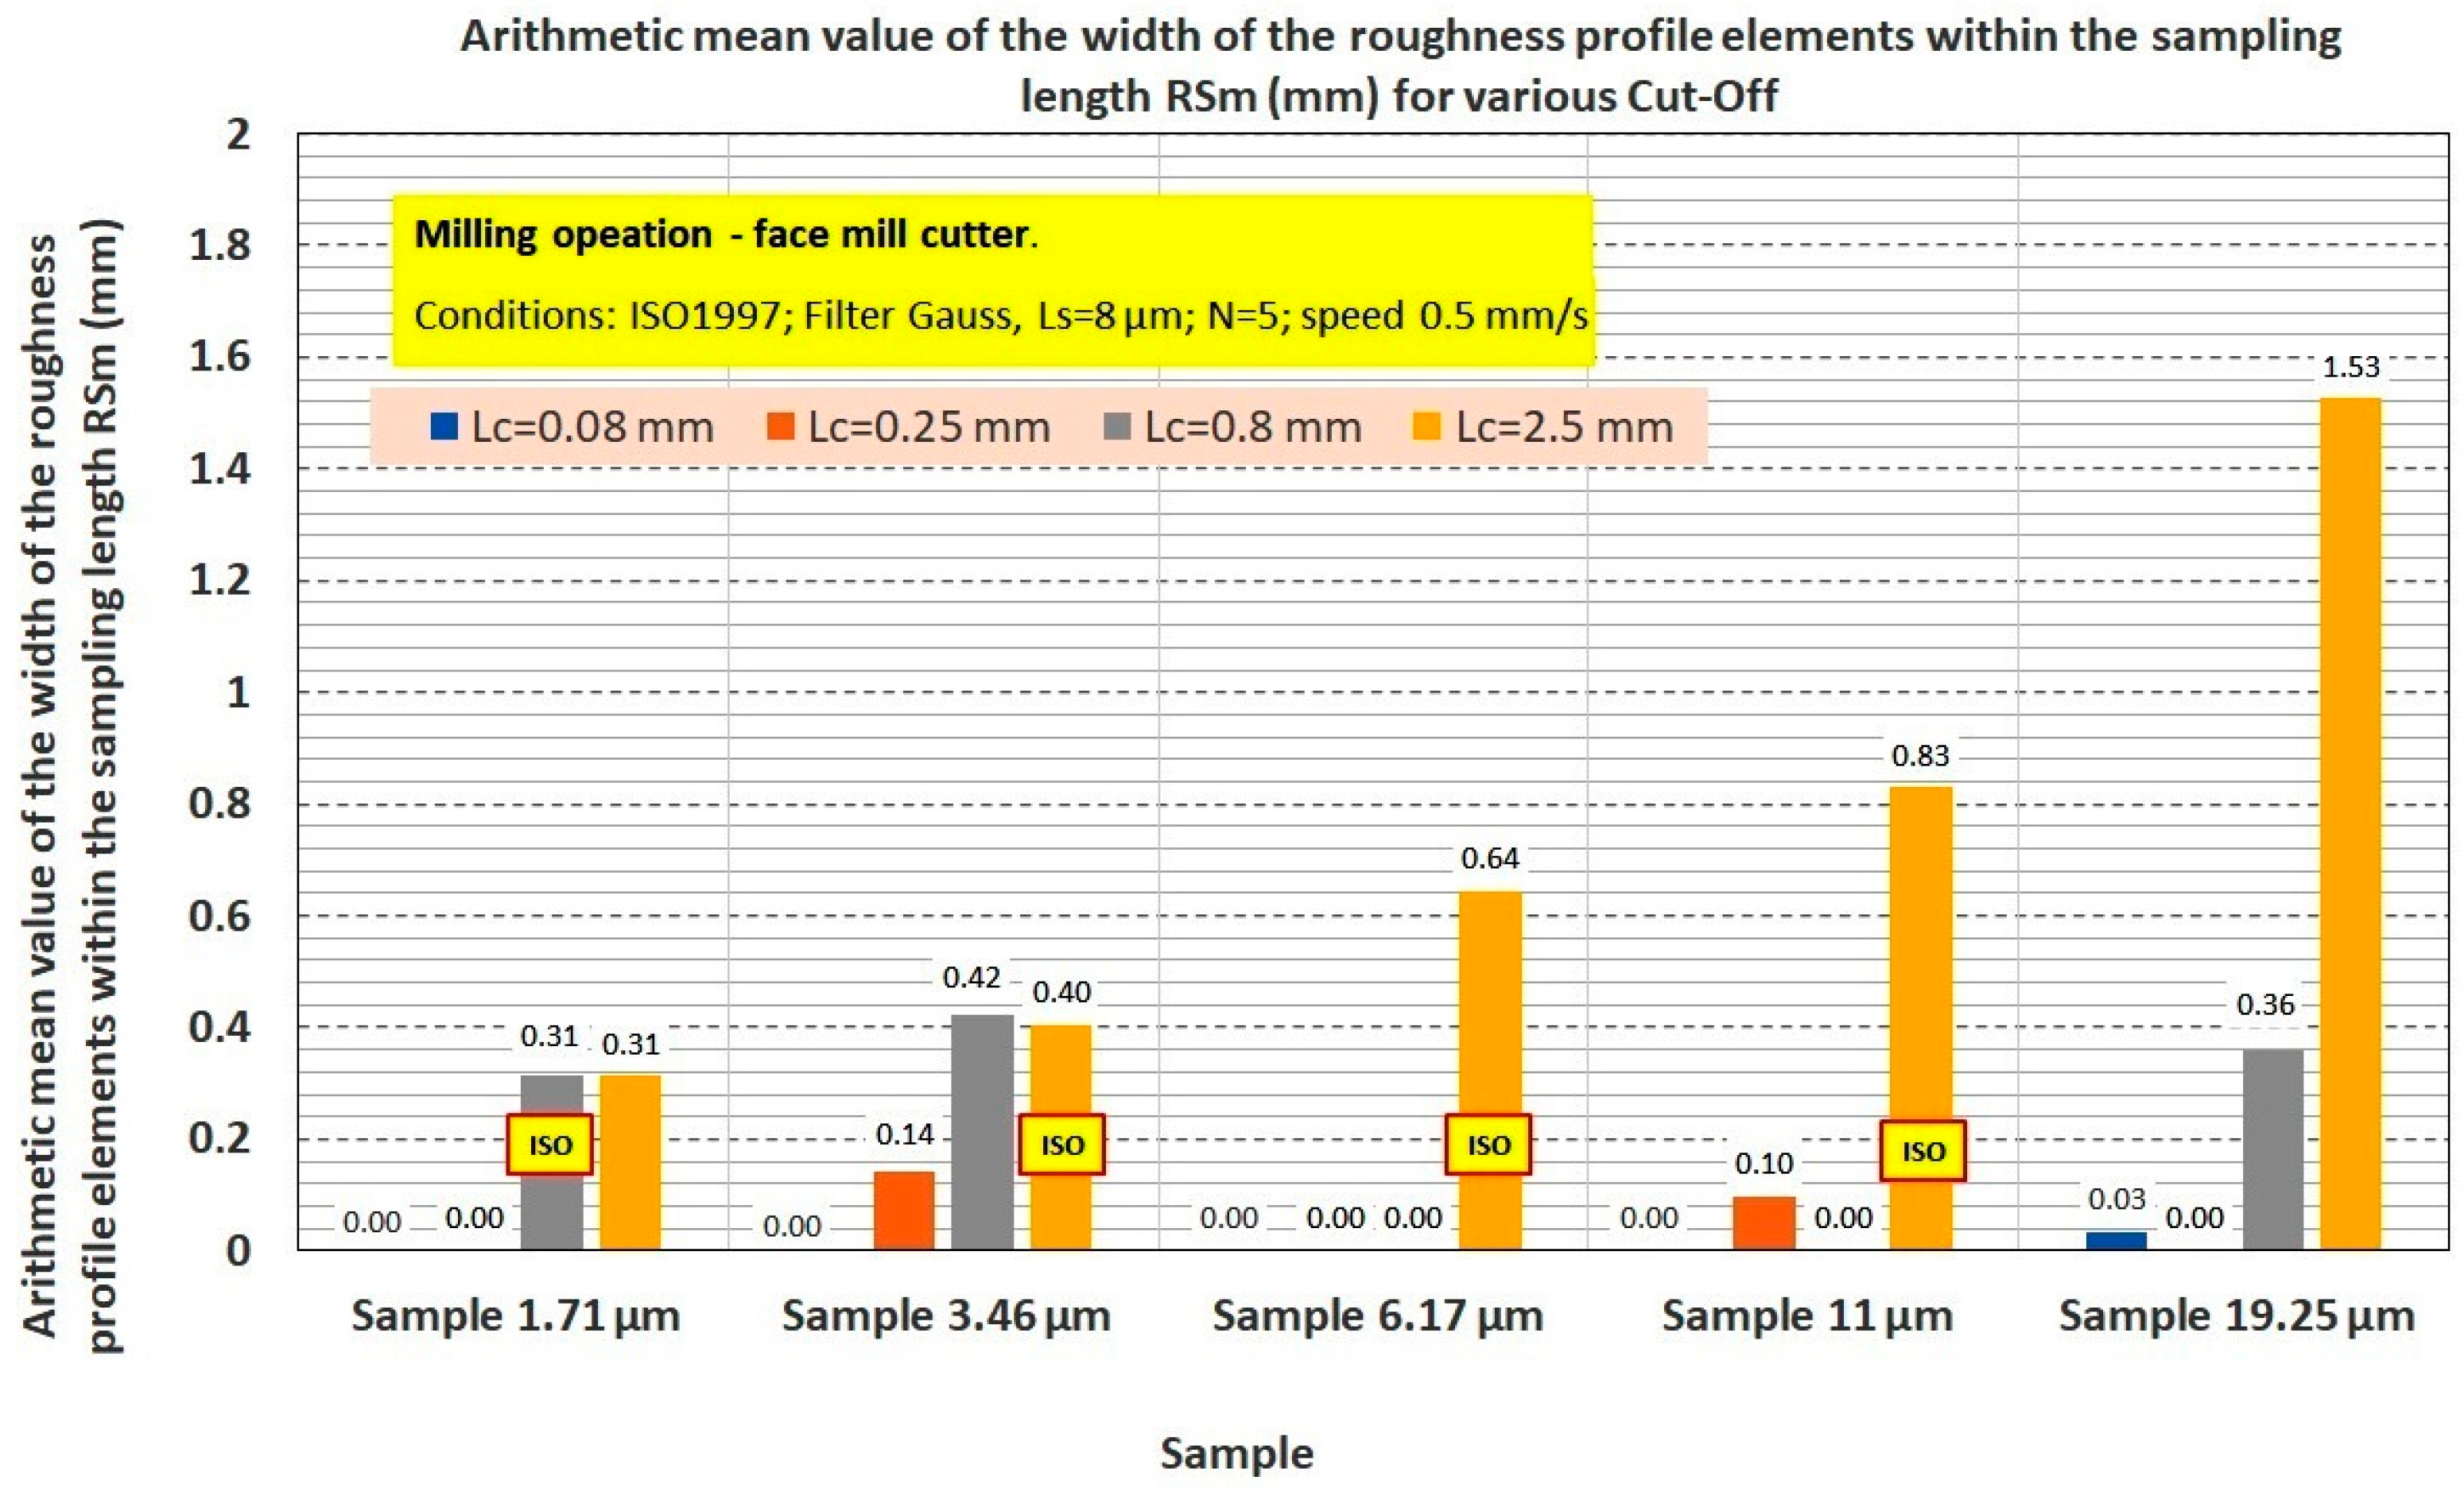
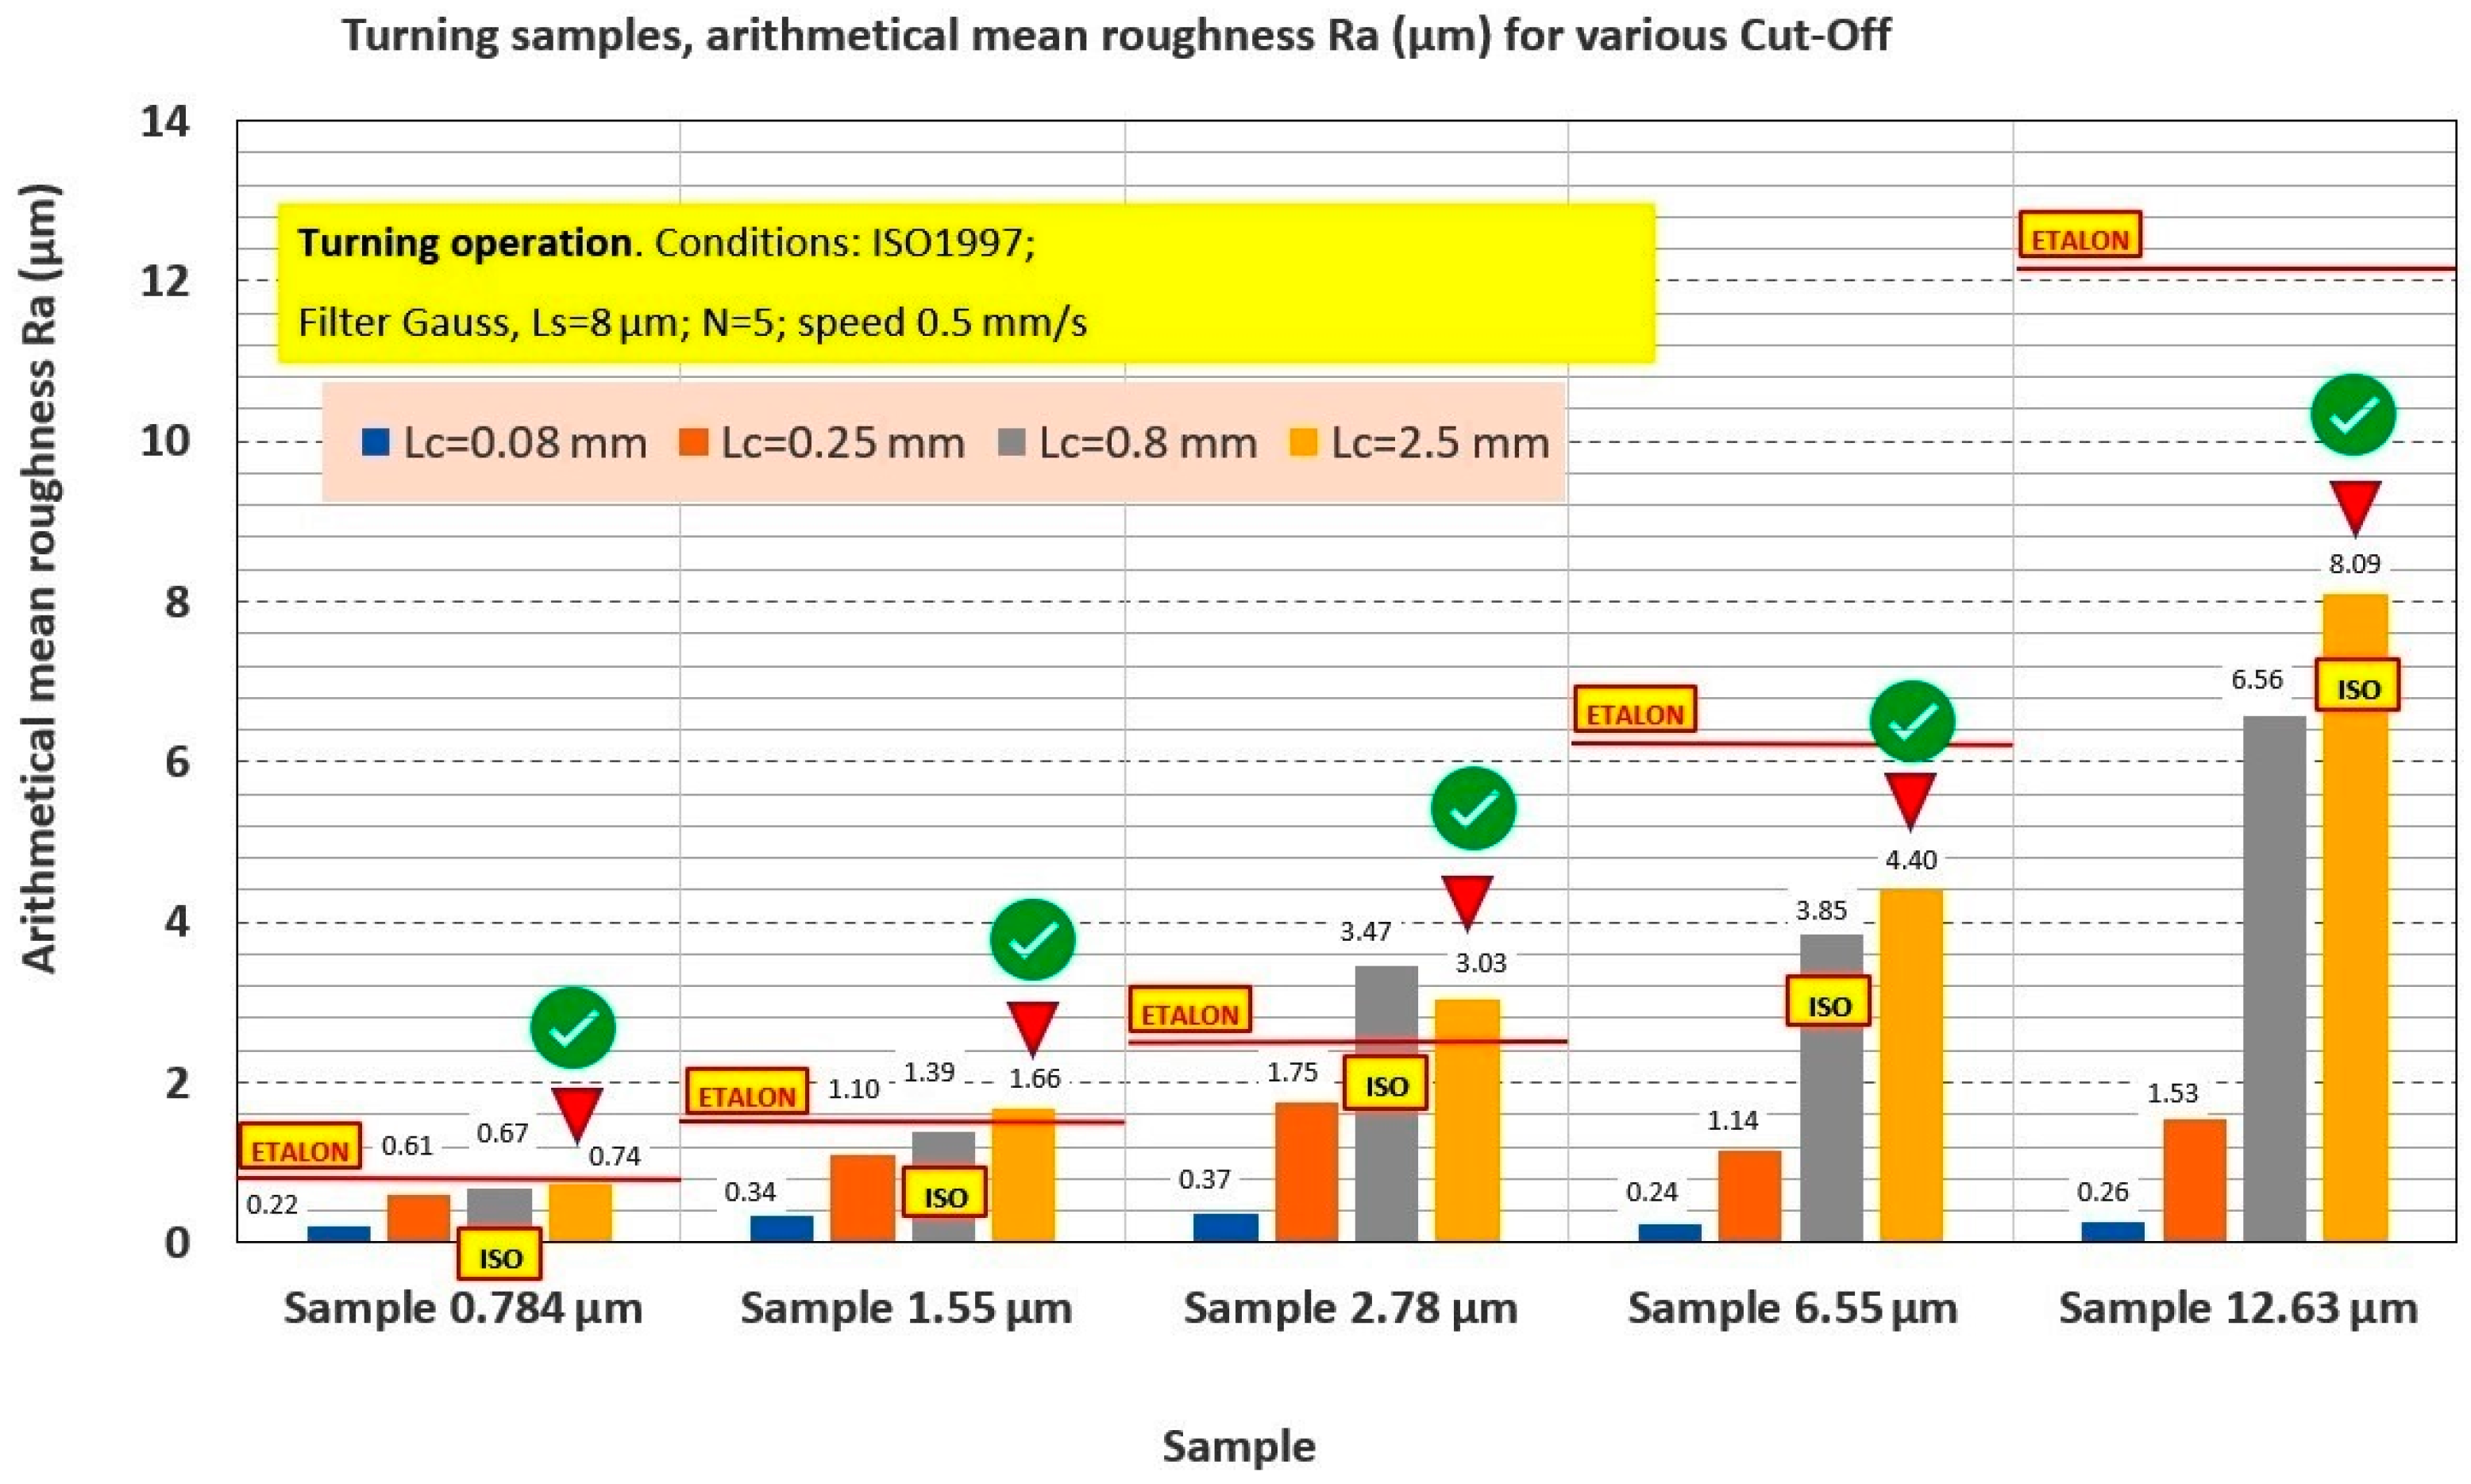
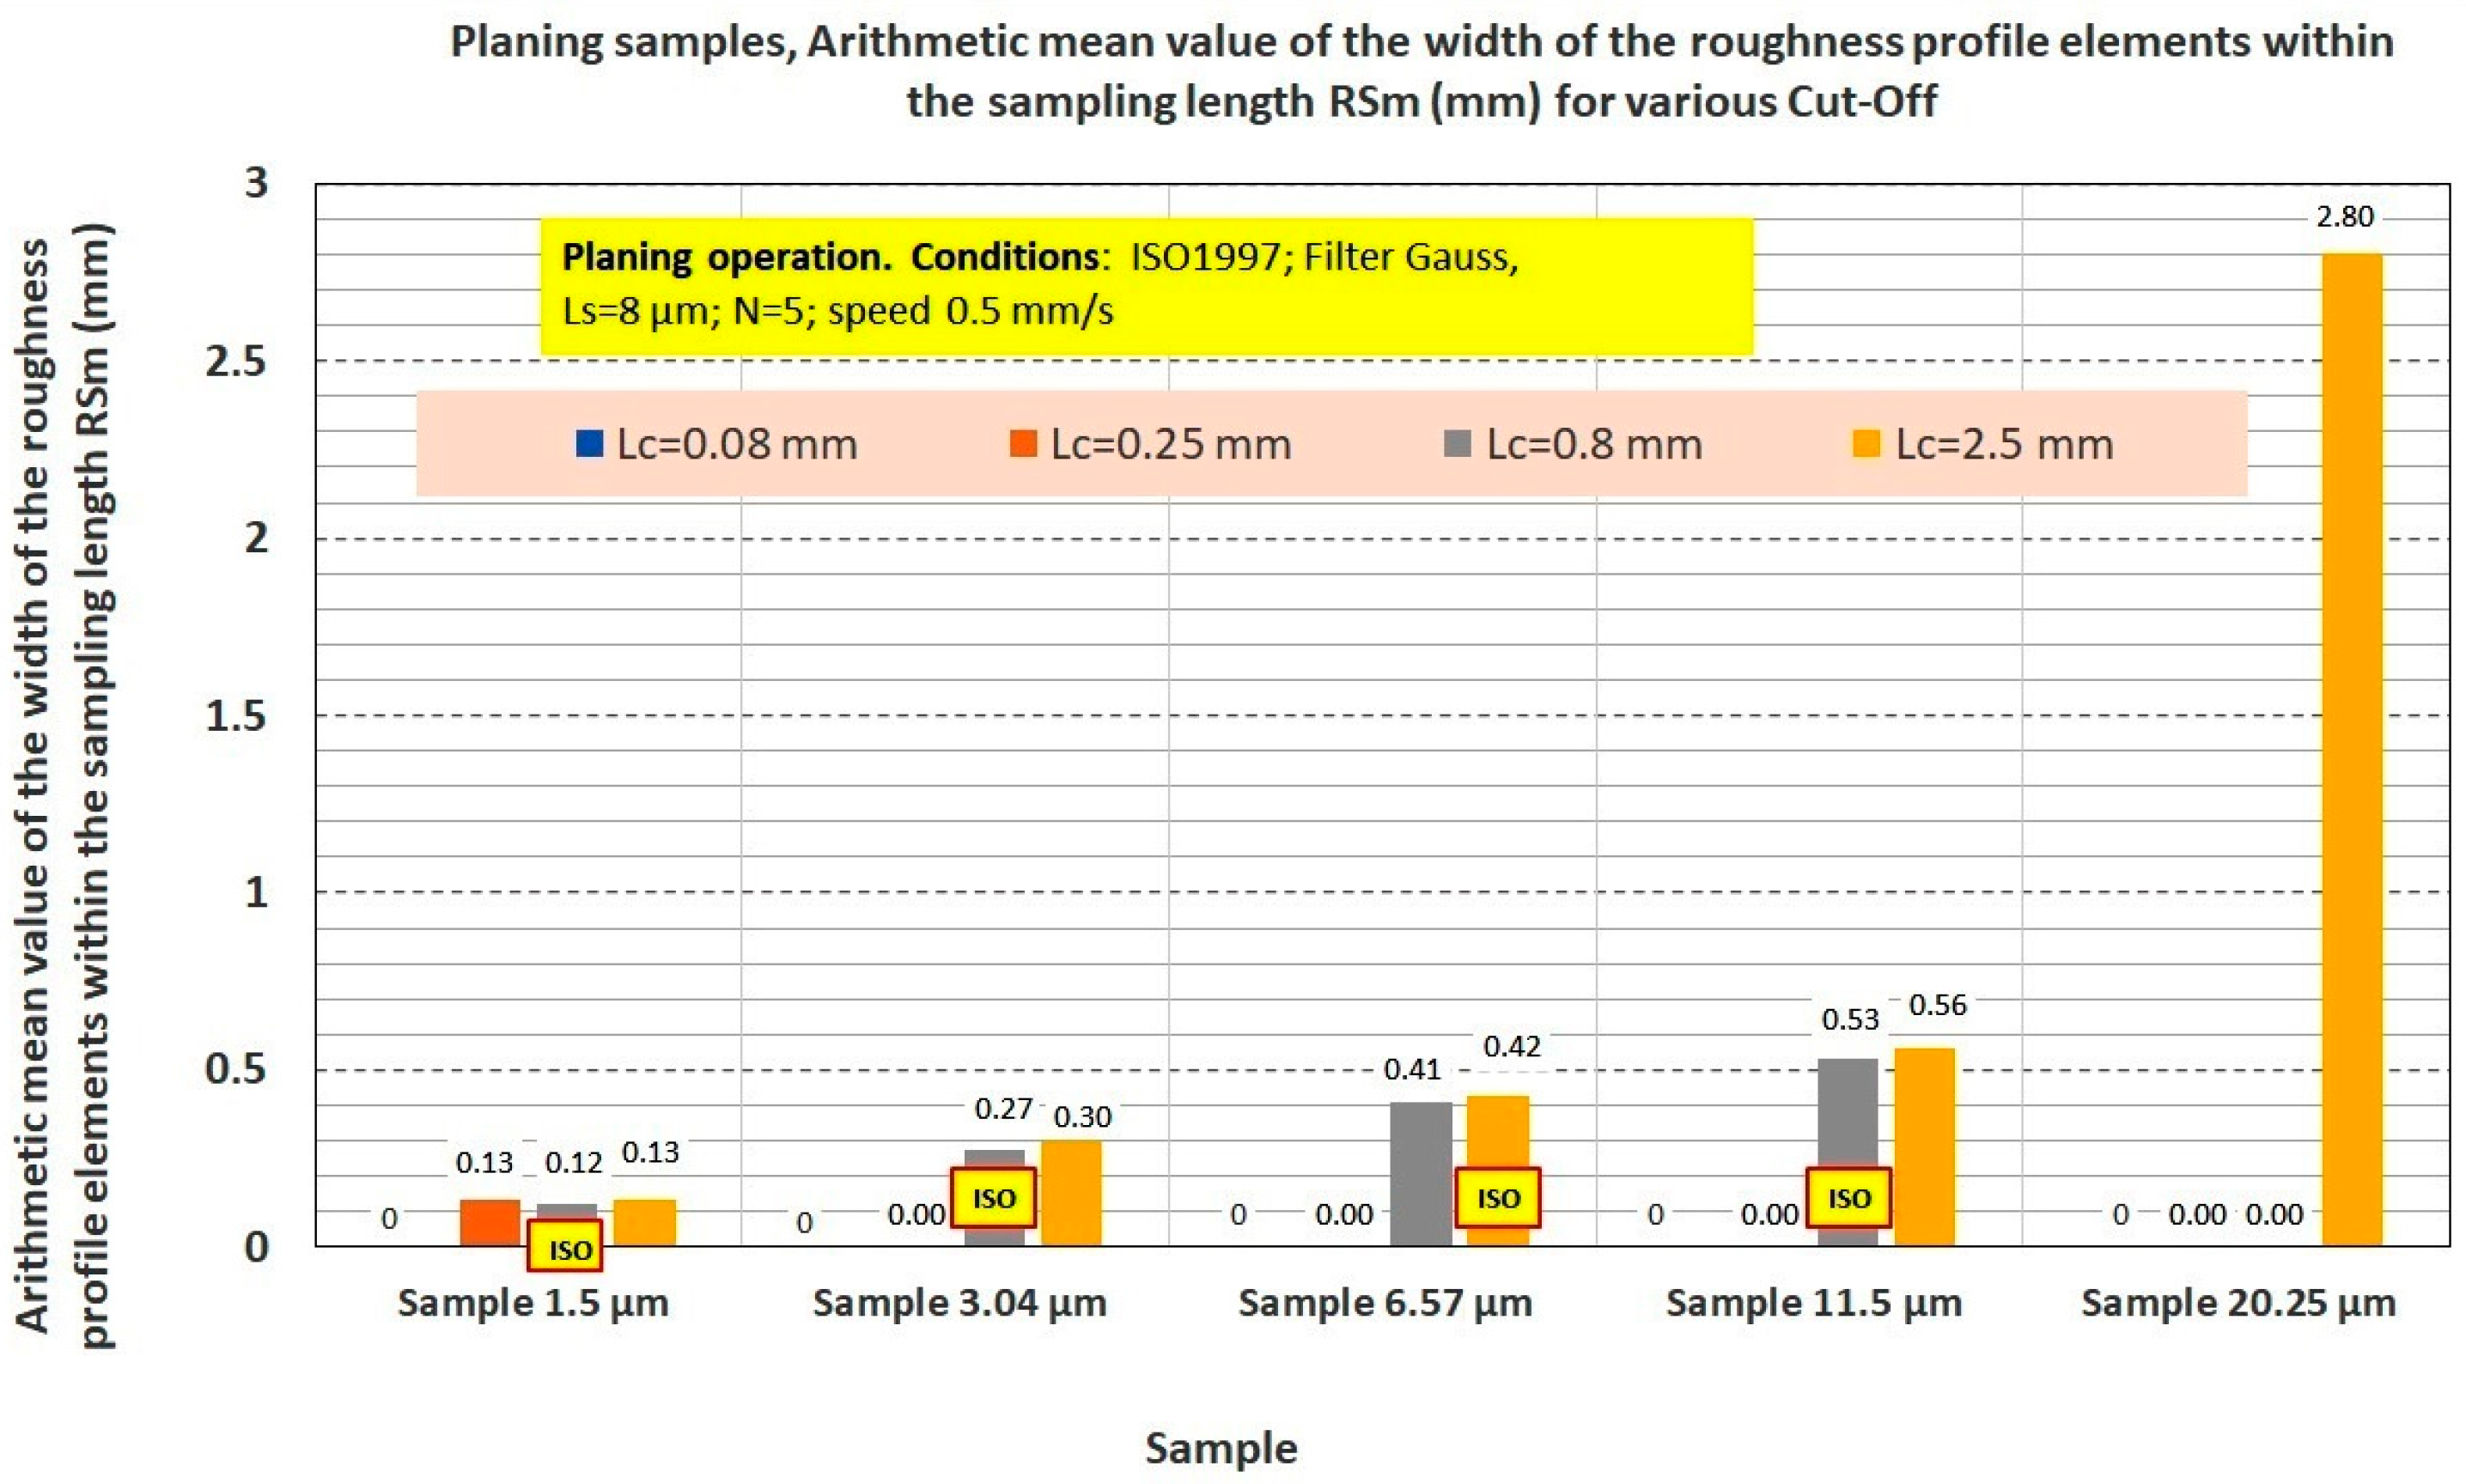
The results for individual technologies for periodic profiles (
Appendix C) were subjected to the above analyses, and the optimal setting of the cut-off filter
Lc for each technology was determined.
Figure 15 shows a comparison of the selection of the filter cut-off value
Lc for periodic profiles with the recommendations for the selection of the filter cut-off value
Lc according to ISO 4288/1996 [
34].
Samples produced by both methods of milling (
Figure 15) are in accordance with the recommendations of the mentioned ISO standard. For the turned and planed samples, slight disproportions are visible in the intervals suitable for the free cut-off values of the
Lc filter; however, these interval shifts may be related to measurement uncertainties.
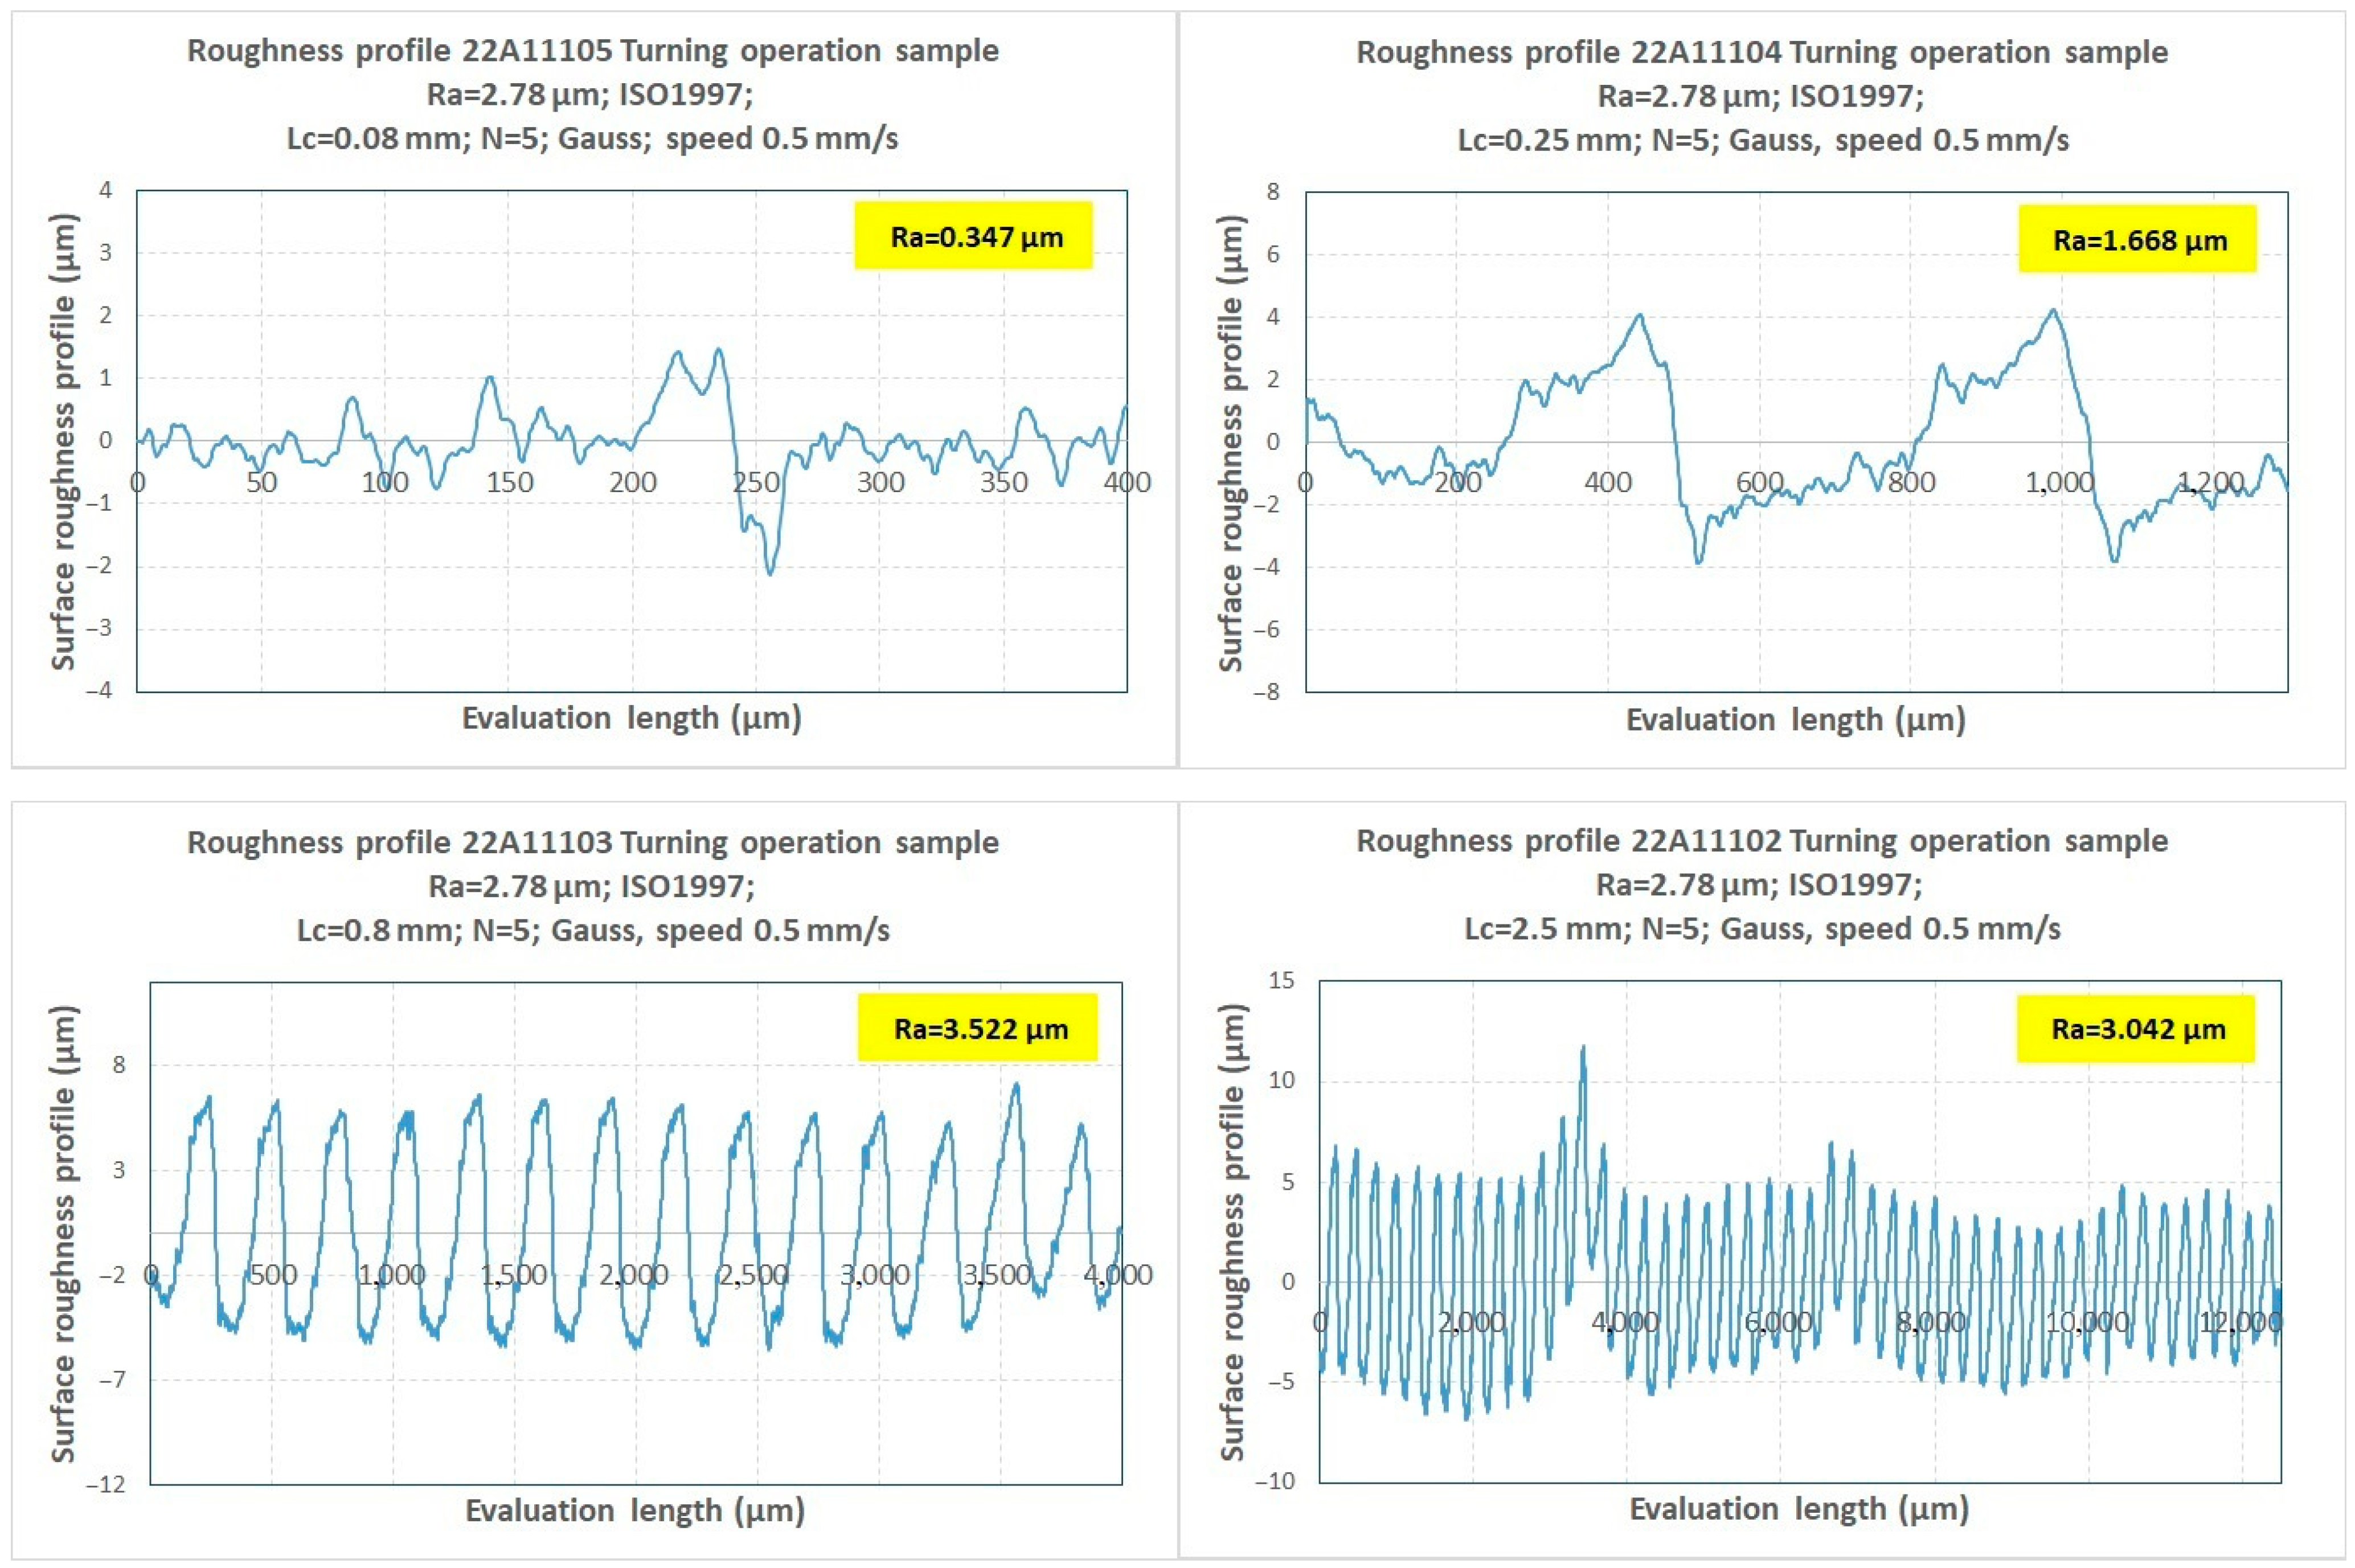
The analysis of surface roughness profiles,
RSm values, and
Ra values reveals the interesting fact that for all samples of periodic roughness surfaces, it is advisable to proceed in such a way that to determine the parameter
RSm, it is advisable to carry out measurements at all settings of the cut-off filter
Lc (similarly to what was carried out in the case of individual technologies of periodic profiles) and according to the detected surface roughness profiles, it is then possible to determine the value of
RSm. When evaluating
RSm, the character of the course of the surface roughness profile must be observed and whether there are signs of periodicity typical for the given type of machining, and whether the influence of the waviness of the surface profile is no longer visible. For the
RSm value determined in this way, it is then possible to select the cut-off filter parameter
Lc for further repeated measurements according to the recommendations in the ISO 4288/1996 standard [
42], and with this procedure, it is then possible to obtain the correct value of
Ra.
In order to verify the correct determination of the Ra value, it is also possible to perform comparative measurements using the Comparex comparative microscope, similar to what was done with non-periodic samples. In this way, it is possible to confirm the correct selection of the cut-off filter value Lc.
3.2.3. No Discrimination Periodic and Non-Periodic Profiles for Procedure of Ra Estimation
It was complicated for users working with unknown surfaces to identify whether it was a periodic profile or a non-periodic one. In some cases, even with the same evaluated surface, it could happen that a profile that was periodically changed to a non-periodic one. This made the strategy of measuring and evaluating surface roughness quantities difficult. Subjective assessment of component surfaces can thus cause errors caused by the operator himself. ISO 21920-1, ISO 21920-2, and ISO 21920-3 standards [
37,
38,
39] eliminate these problems. The ISO 21920-3 standard specifies the non-discrimination procedure for periodic and non-periodic profiles for the roughness quantities estimation procedure. This edition of ISO 21920 cancels and replaces the edition of ISO 4287:1997 [
33] and ISO 4288:1996 [
40], which have been technically revised. ISO 21920-3 introduces no distinction between periodic and non-periodic profiles. The ISO 21920-3 standard introduces a unified strategy for setting measurement parameters using setting classes—Sc1, Sc2, Sc3, Sc4, and Sc5.
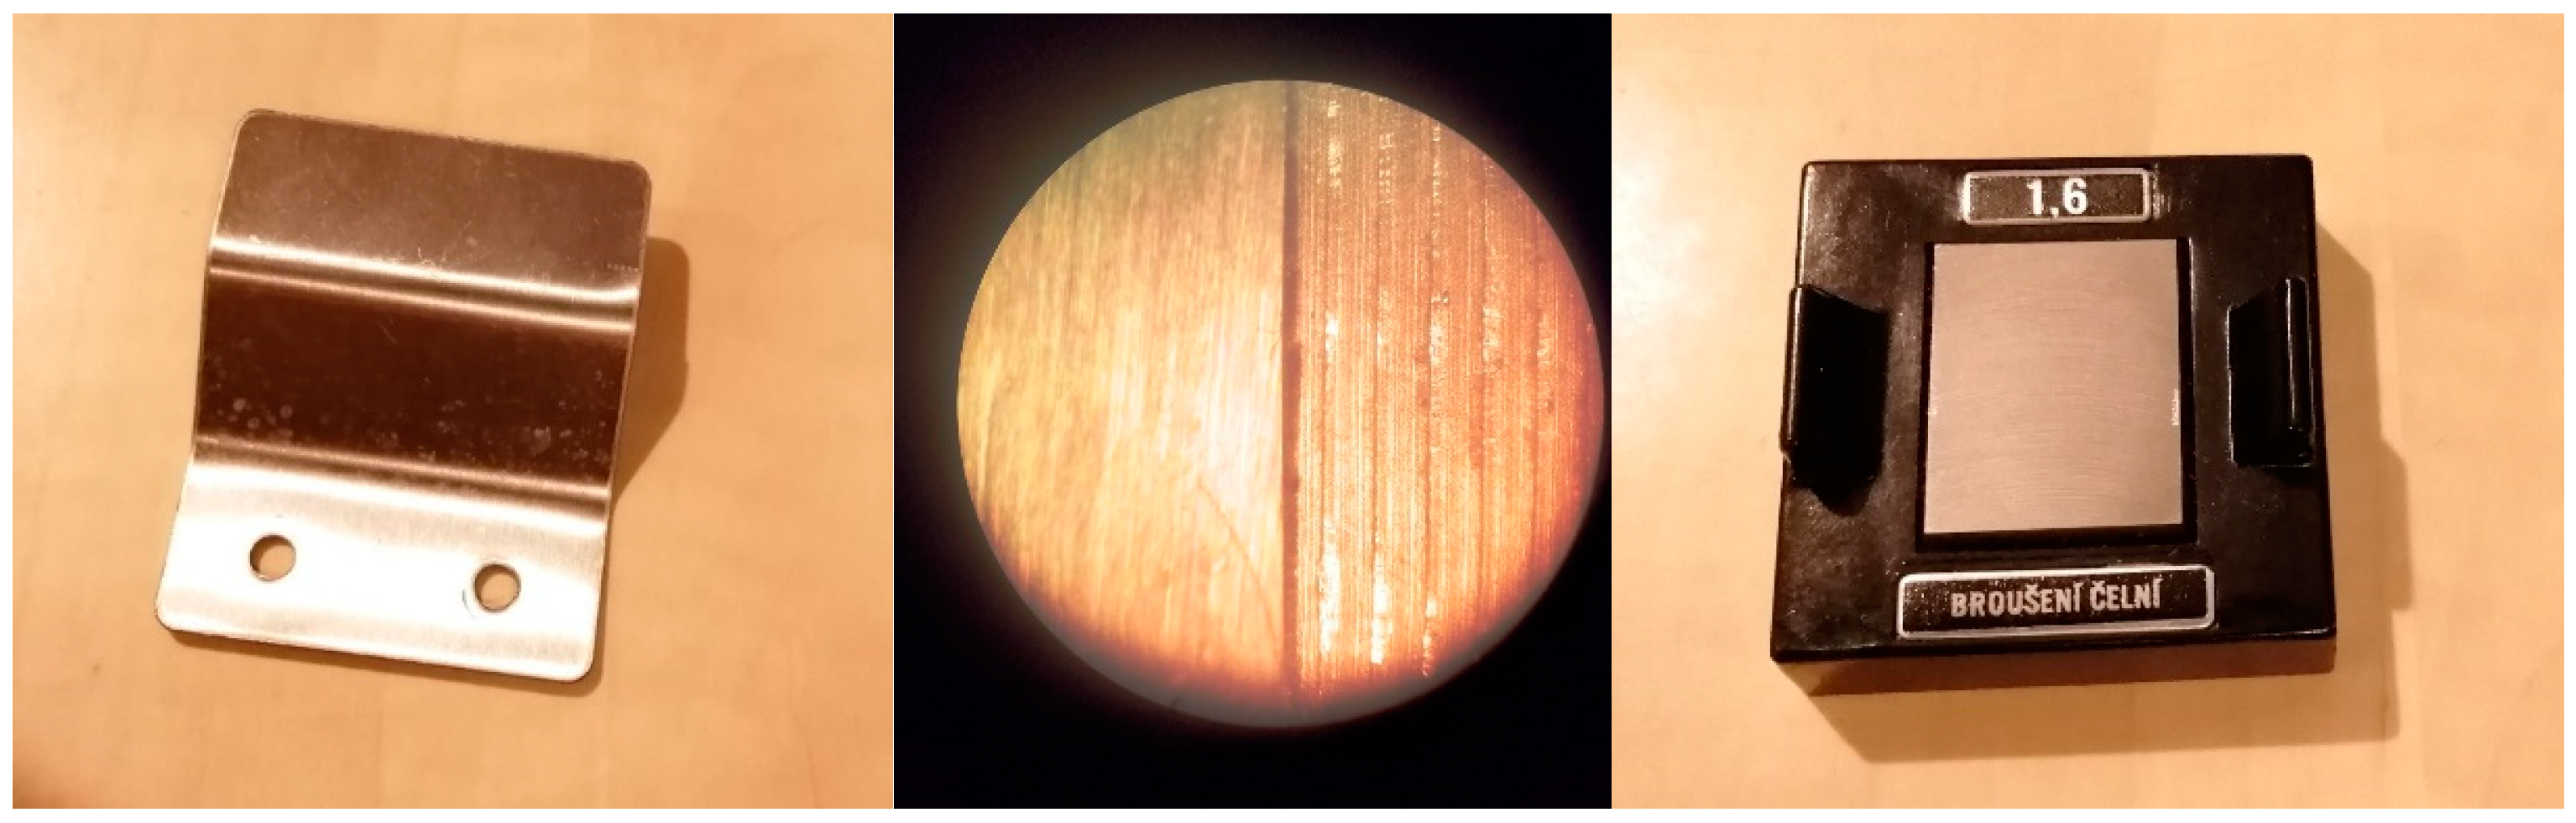
In cases of missing part surface specifications, one of the options for determining the surface roughness of the examined part is to compare the surface roughness profile with the surface roughness profile of the standard sample whose nominal
Ra value is known. For this purpose, the Comparex monocular comparison microscope (
Figure 16) can be used.
It is a device that enables the determination of surface roughness on different types of surfaces obtained by all available technologies. The eyepiece is divided into two halves, and both surfaces of the surface roughness are displayed in it, namely the surface of the part and the surface of the reference sample, so it is possible to optically compare both surface profiles. According to these displayed profiles, it is possible to make a fairly reliable estimate of the Ra of the examined sample.
By successively optically comparing the surfaces of the reference samples with the examined surface of the component, it is possible to determine the desired value of
Ra for the surface of the component (
Figure 17). In
Figure 17 is a comparison with the standard sample
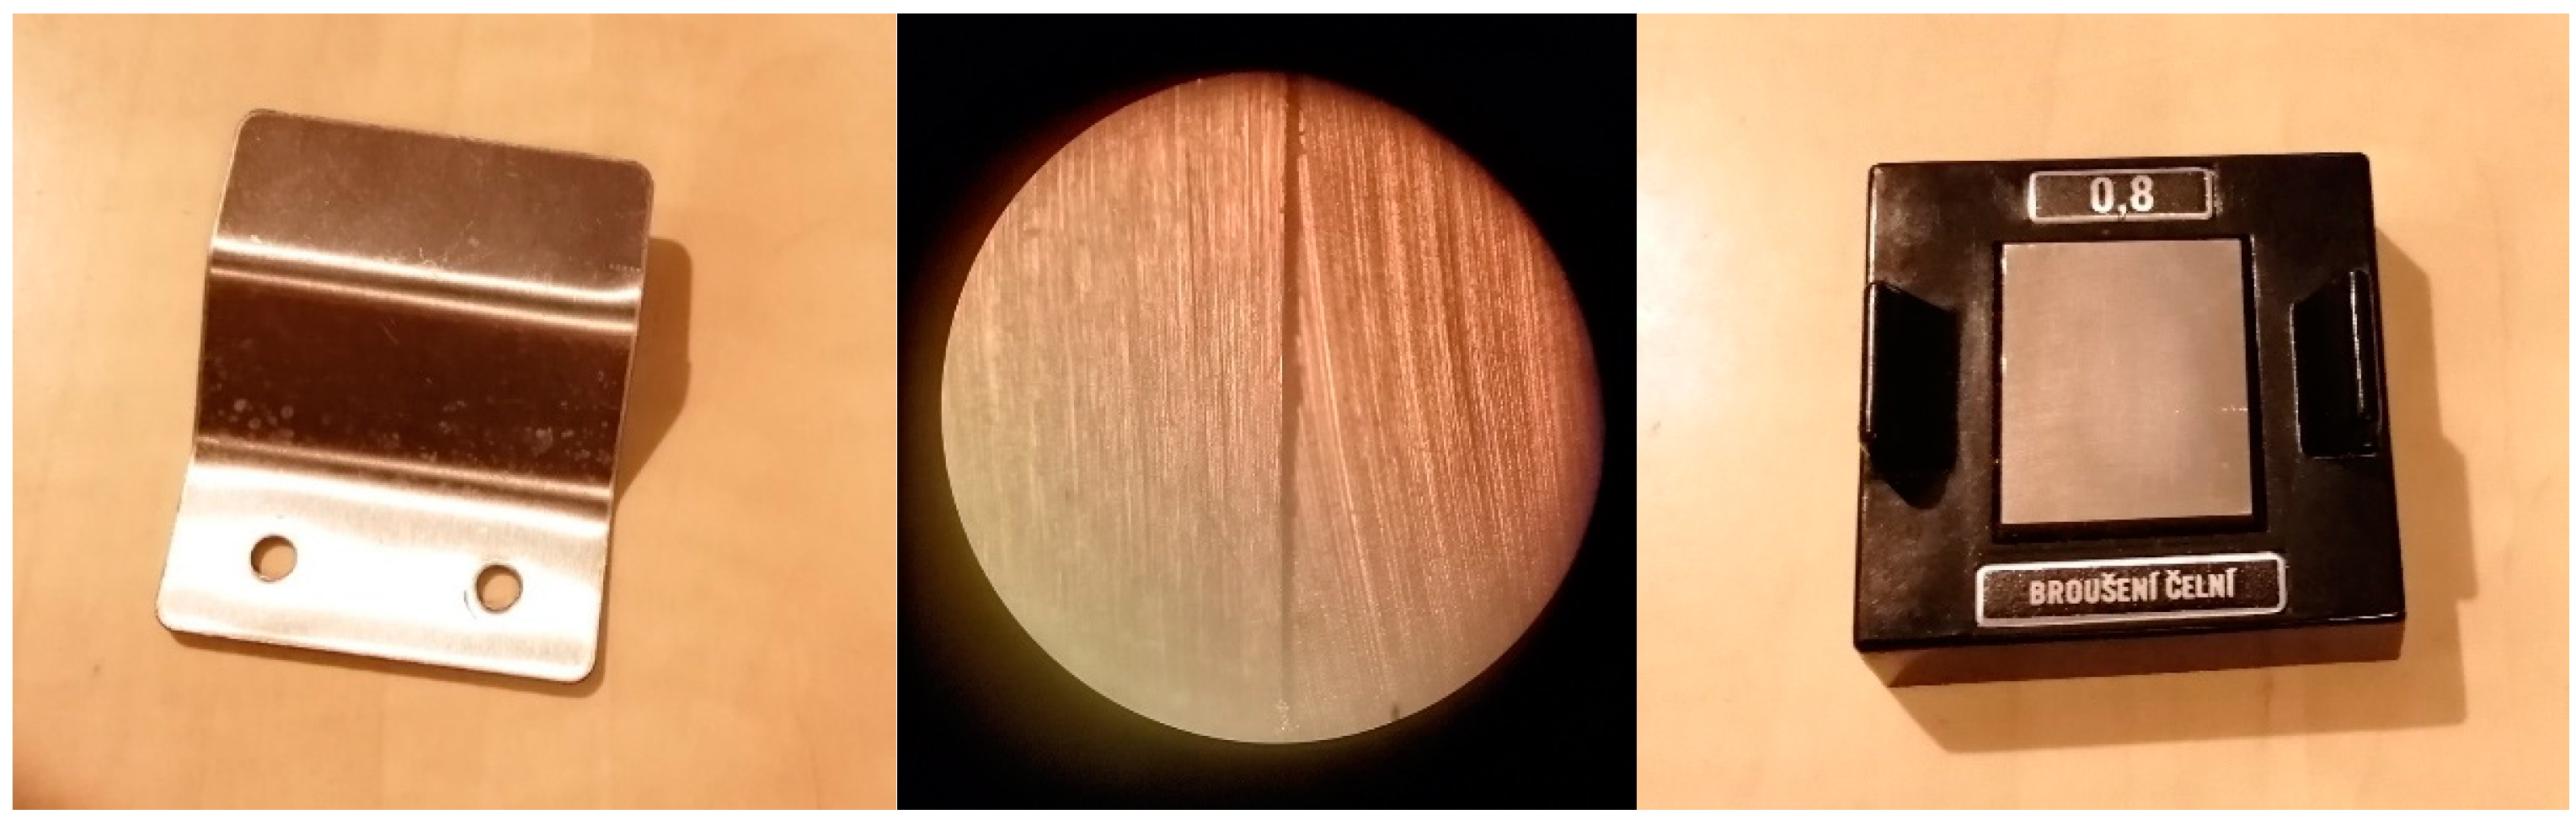
Ra = 1.6 µm, and from the image of the eyepiece, it can be seen that the standard has a greater surface fragmentation than the examined surface of the part. Then the surface of the component is compared with the reference sample
Ra = 0.8 µm, and a match is visible (
Figure 18), based on which we can estimate the value of
Ra and then subsequently set the cut-off parameter
Lc for the subsequent measurement and evaluation of
Ra using stylus-based surface roughness tester.
The ISO 21920-3 standard [
39] also provides recommendations for the selection of Setting class settings according to the estimate of the unknown quantity of surface roughness
Ra (
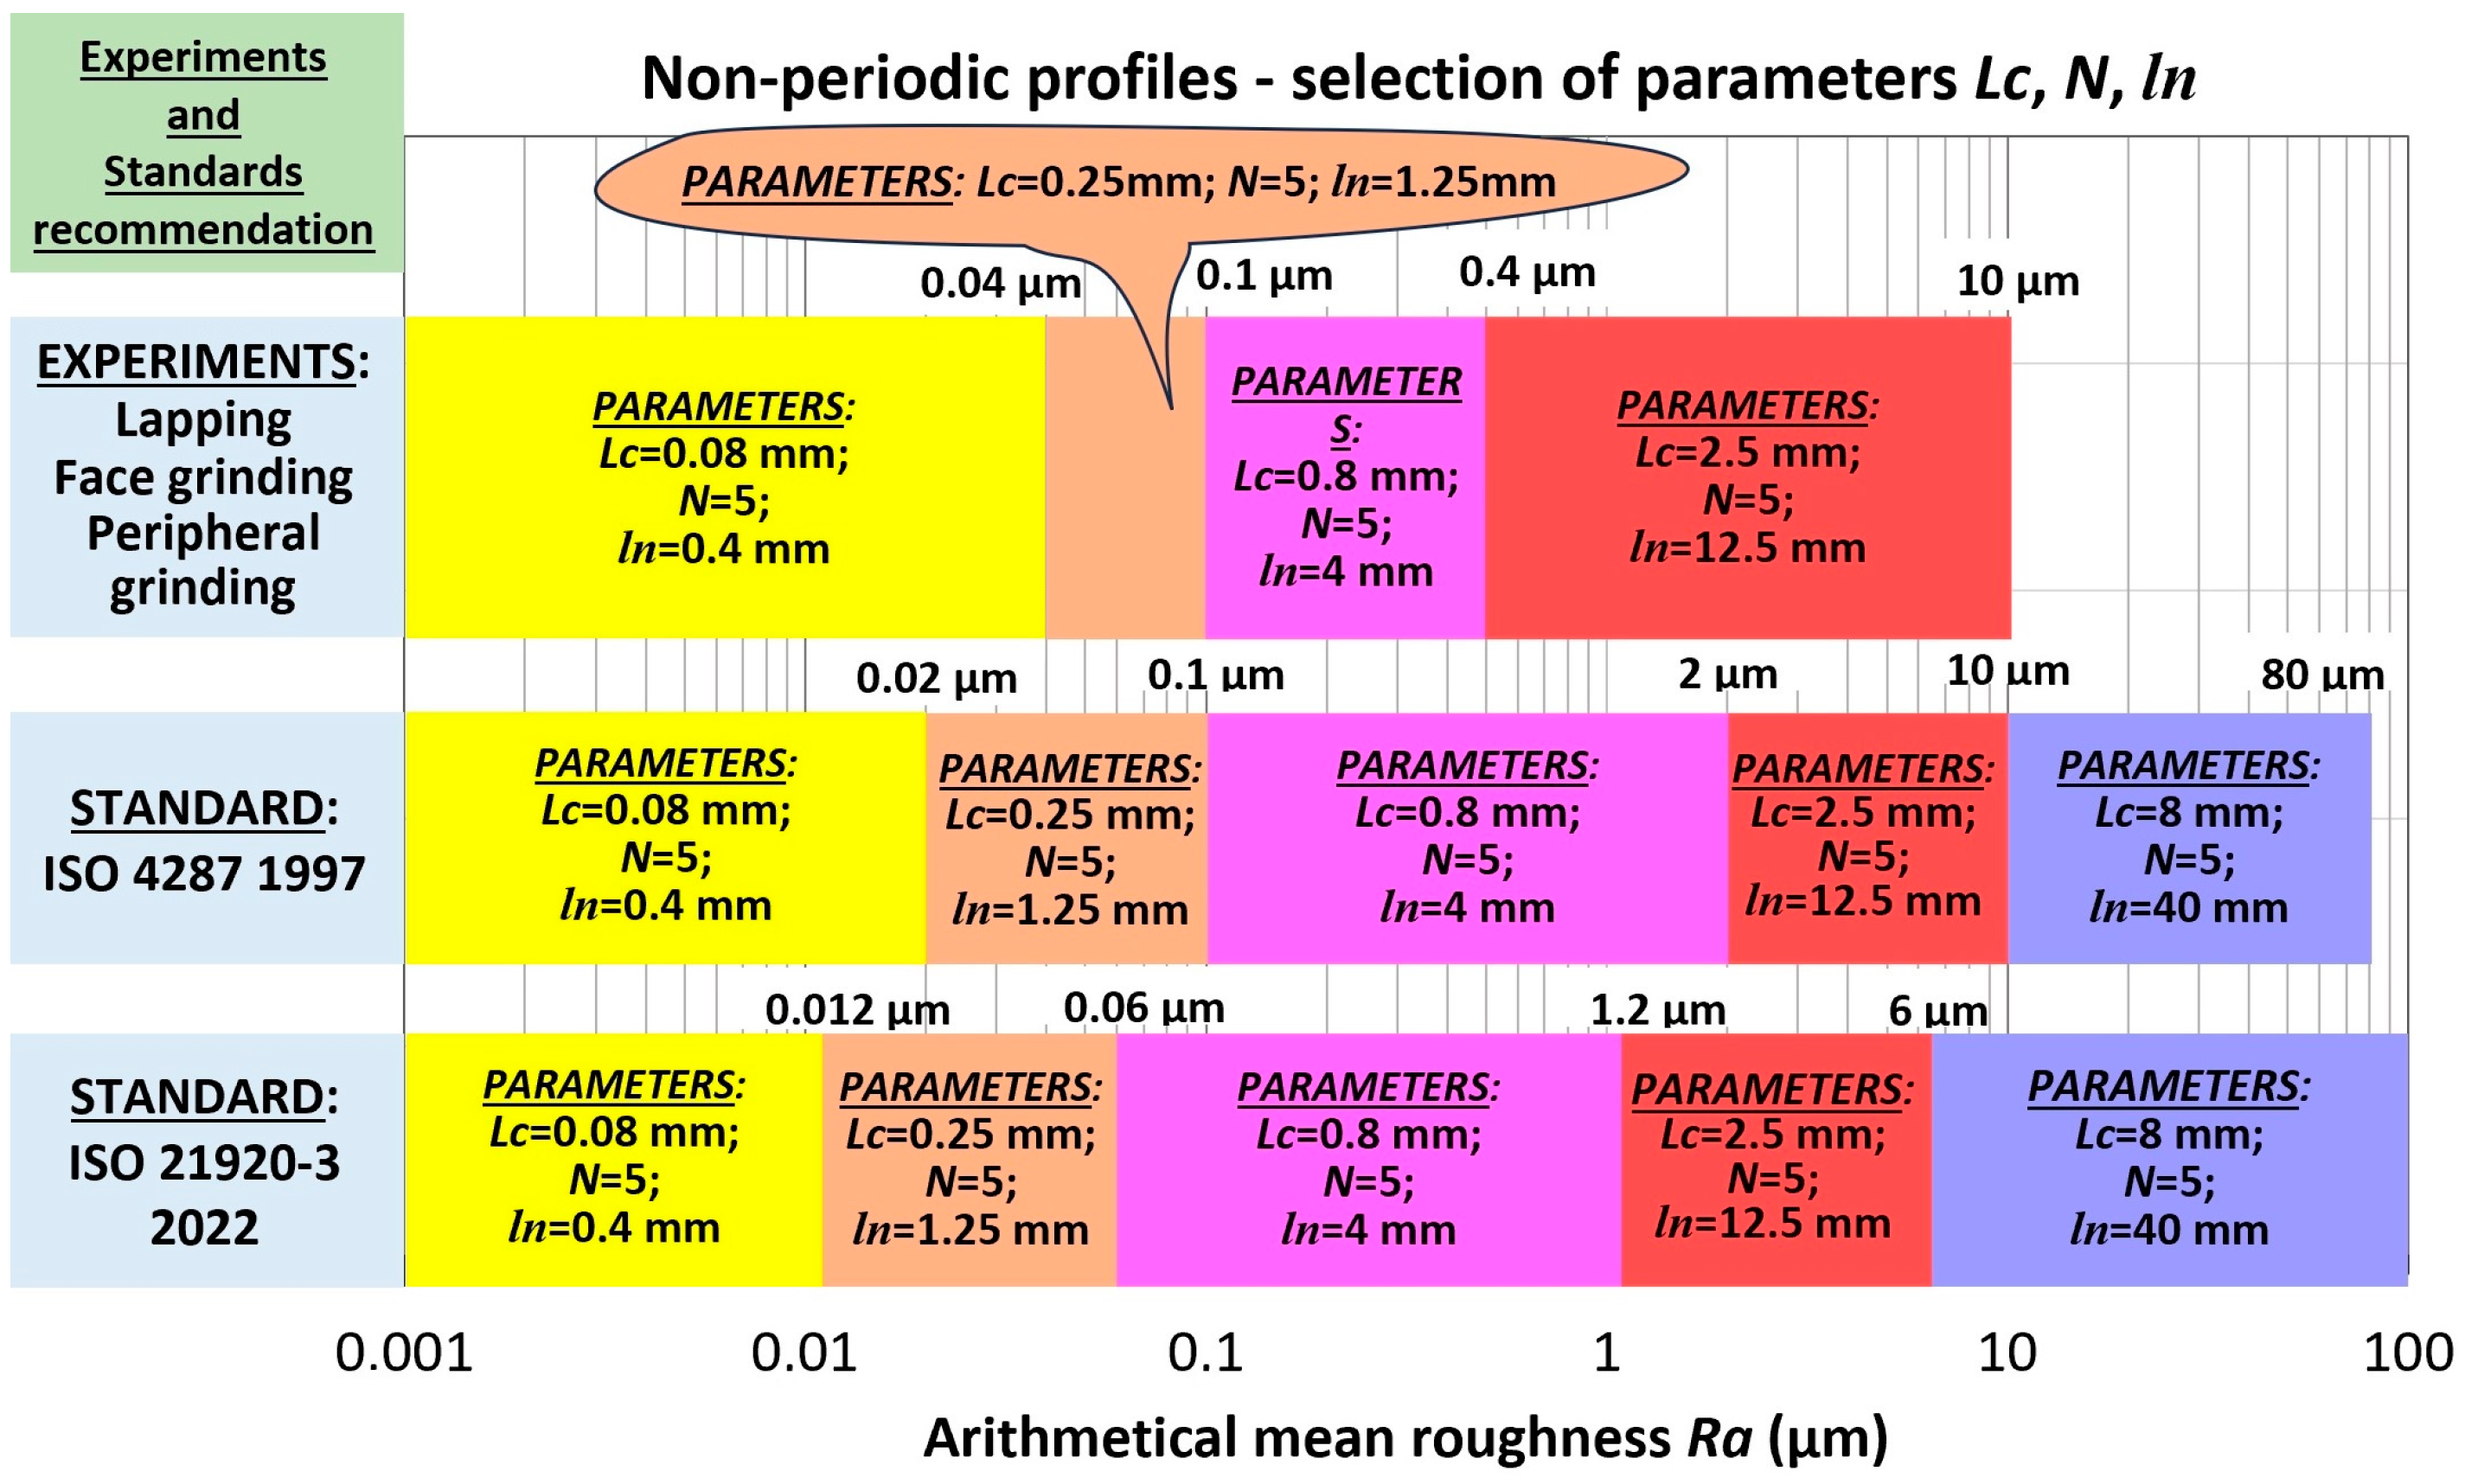
Table 10). The graph (
Figure 19) shows a comparison of the recommendations of both ISO 4287 [
33] and ISO 21920-3 [
39] standards and the results of experiments for non-periodic part surface profiles. It results in only slight differences, which can be considered measurement errors and uncertainties.
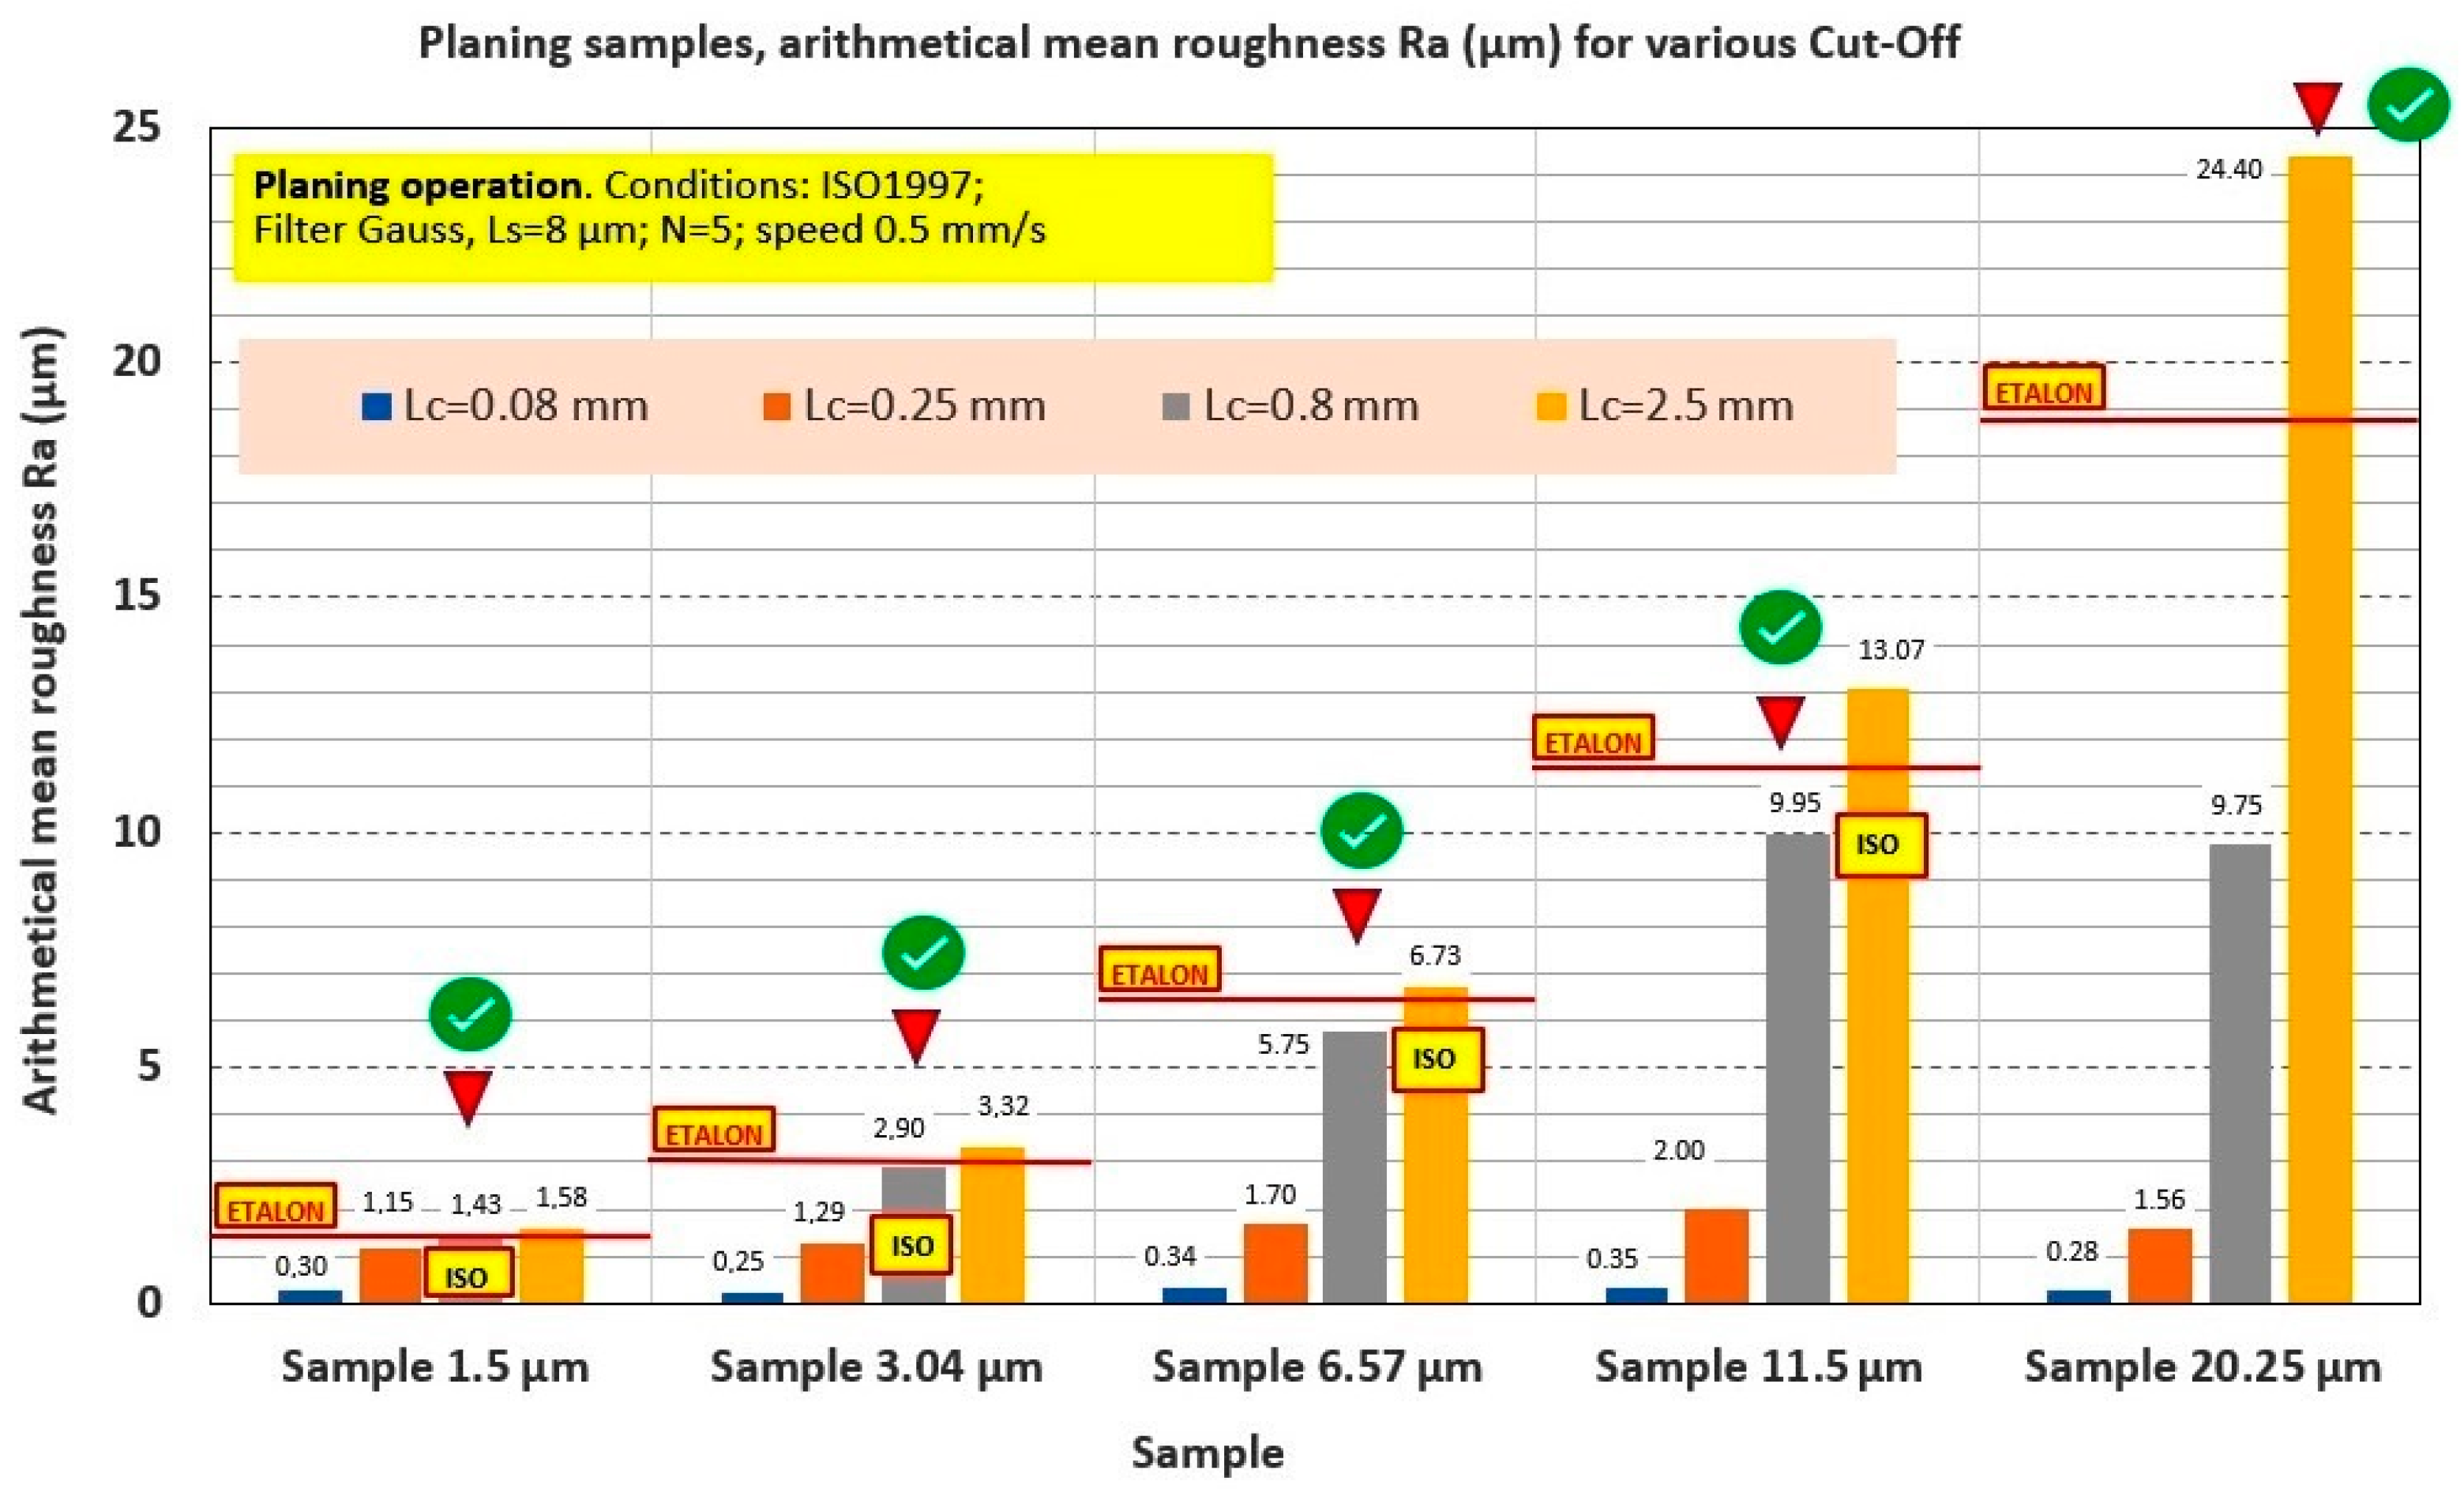
For periodic profiles, preferred values resulting from experiments and recommended values according to the ISO 4288 standard and according to the ISO 21920-3 standard are shown. Except for planing technology, all values for periodic profiles are in accordance with the recommendations of the ISO 21920-3 standard. Planing technology does not agree with these recommendations, and the reasons for this are probably found in the essence of the technology itself. It is important to note that reference samples were not available for ranges with small Ra values, which is related to the nature of these technologies, which are used to achieve larger Ra values, and thus it was not possible to assess the recommendations of the standards for smaller Ra values. Interestingly, however, the experimental optimum settings for the periodic profiles are in agreement with the recommendations of the previous ISO 4288 standard.
With the exception of planing technology, however, we can state that the recommendations of the ISO 21920-3 standard can be applied to periodic and non-periodic profiles of the surface of components (
Figure 20), and therefore the investigation of planing technology will be the subject of further research.
A comparison of the validity of using
RSm to select the cut-off filter
Lc according to ISO 4288 and using
Ra according to ISO 21920 can be realized from the evaluation of the previous graphs (
Figure 20). According to this evaluation, it can be concluded that better compliance results were achieved using the
RSm quantity according to ISO 4288. At the same time, however, it can be seen that there were not enough samples available for a reliable evaluation, mainly with low
Ra values, which follows from the nature of these technologies, as they are designed to achieve surfaces with larger
Ra values. We will further verify these results in future research.
3.3. Identification of the Minimum Number of Measurements for Assessing the Surface Roughness of the Part
To define the problem, it is necessary to determine the minimum number of measurements needed to assess the surface roughness. It is known from common metrological practice that one measurement is insufficient and, especially for quantities with a high degree of variability, it is necessary to carry out repeated measurements and an estimate of the measured quantity together with an expression of the uncertainty of the determination of this estimate of the measured quantity.
To solve this problem, a method of successive evaluation of the standard deviation of repeated measurements and evaluation of the quantity Ra is proposed. After each additional measurement is added, the standard deviation will be recalculated with the addition of a new value to the set of measured data. We called it the cumulative standard deviation, which will capture the effect of the number of performed measurements on the value of the standard deviation of the quantity Ra.
First, 100 measurements were carried out at different measurement points on selected reference samples from each technology for which samples were available while the
Ra quantity was evaluated. Thus, the influence of the variability of the sample implementation on the resulting variability of the measured data will be clear.
Figure 21 shows the cumulative standard deviations for non-periodic profiles, and it follows that the first values of the cumulative standard deviations are unstable, which indicates a high degree of variability of the evaluated
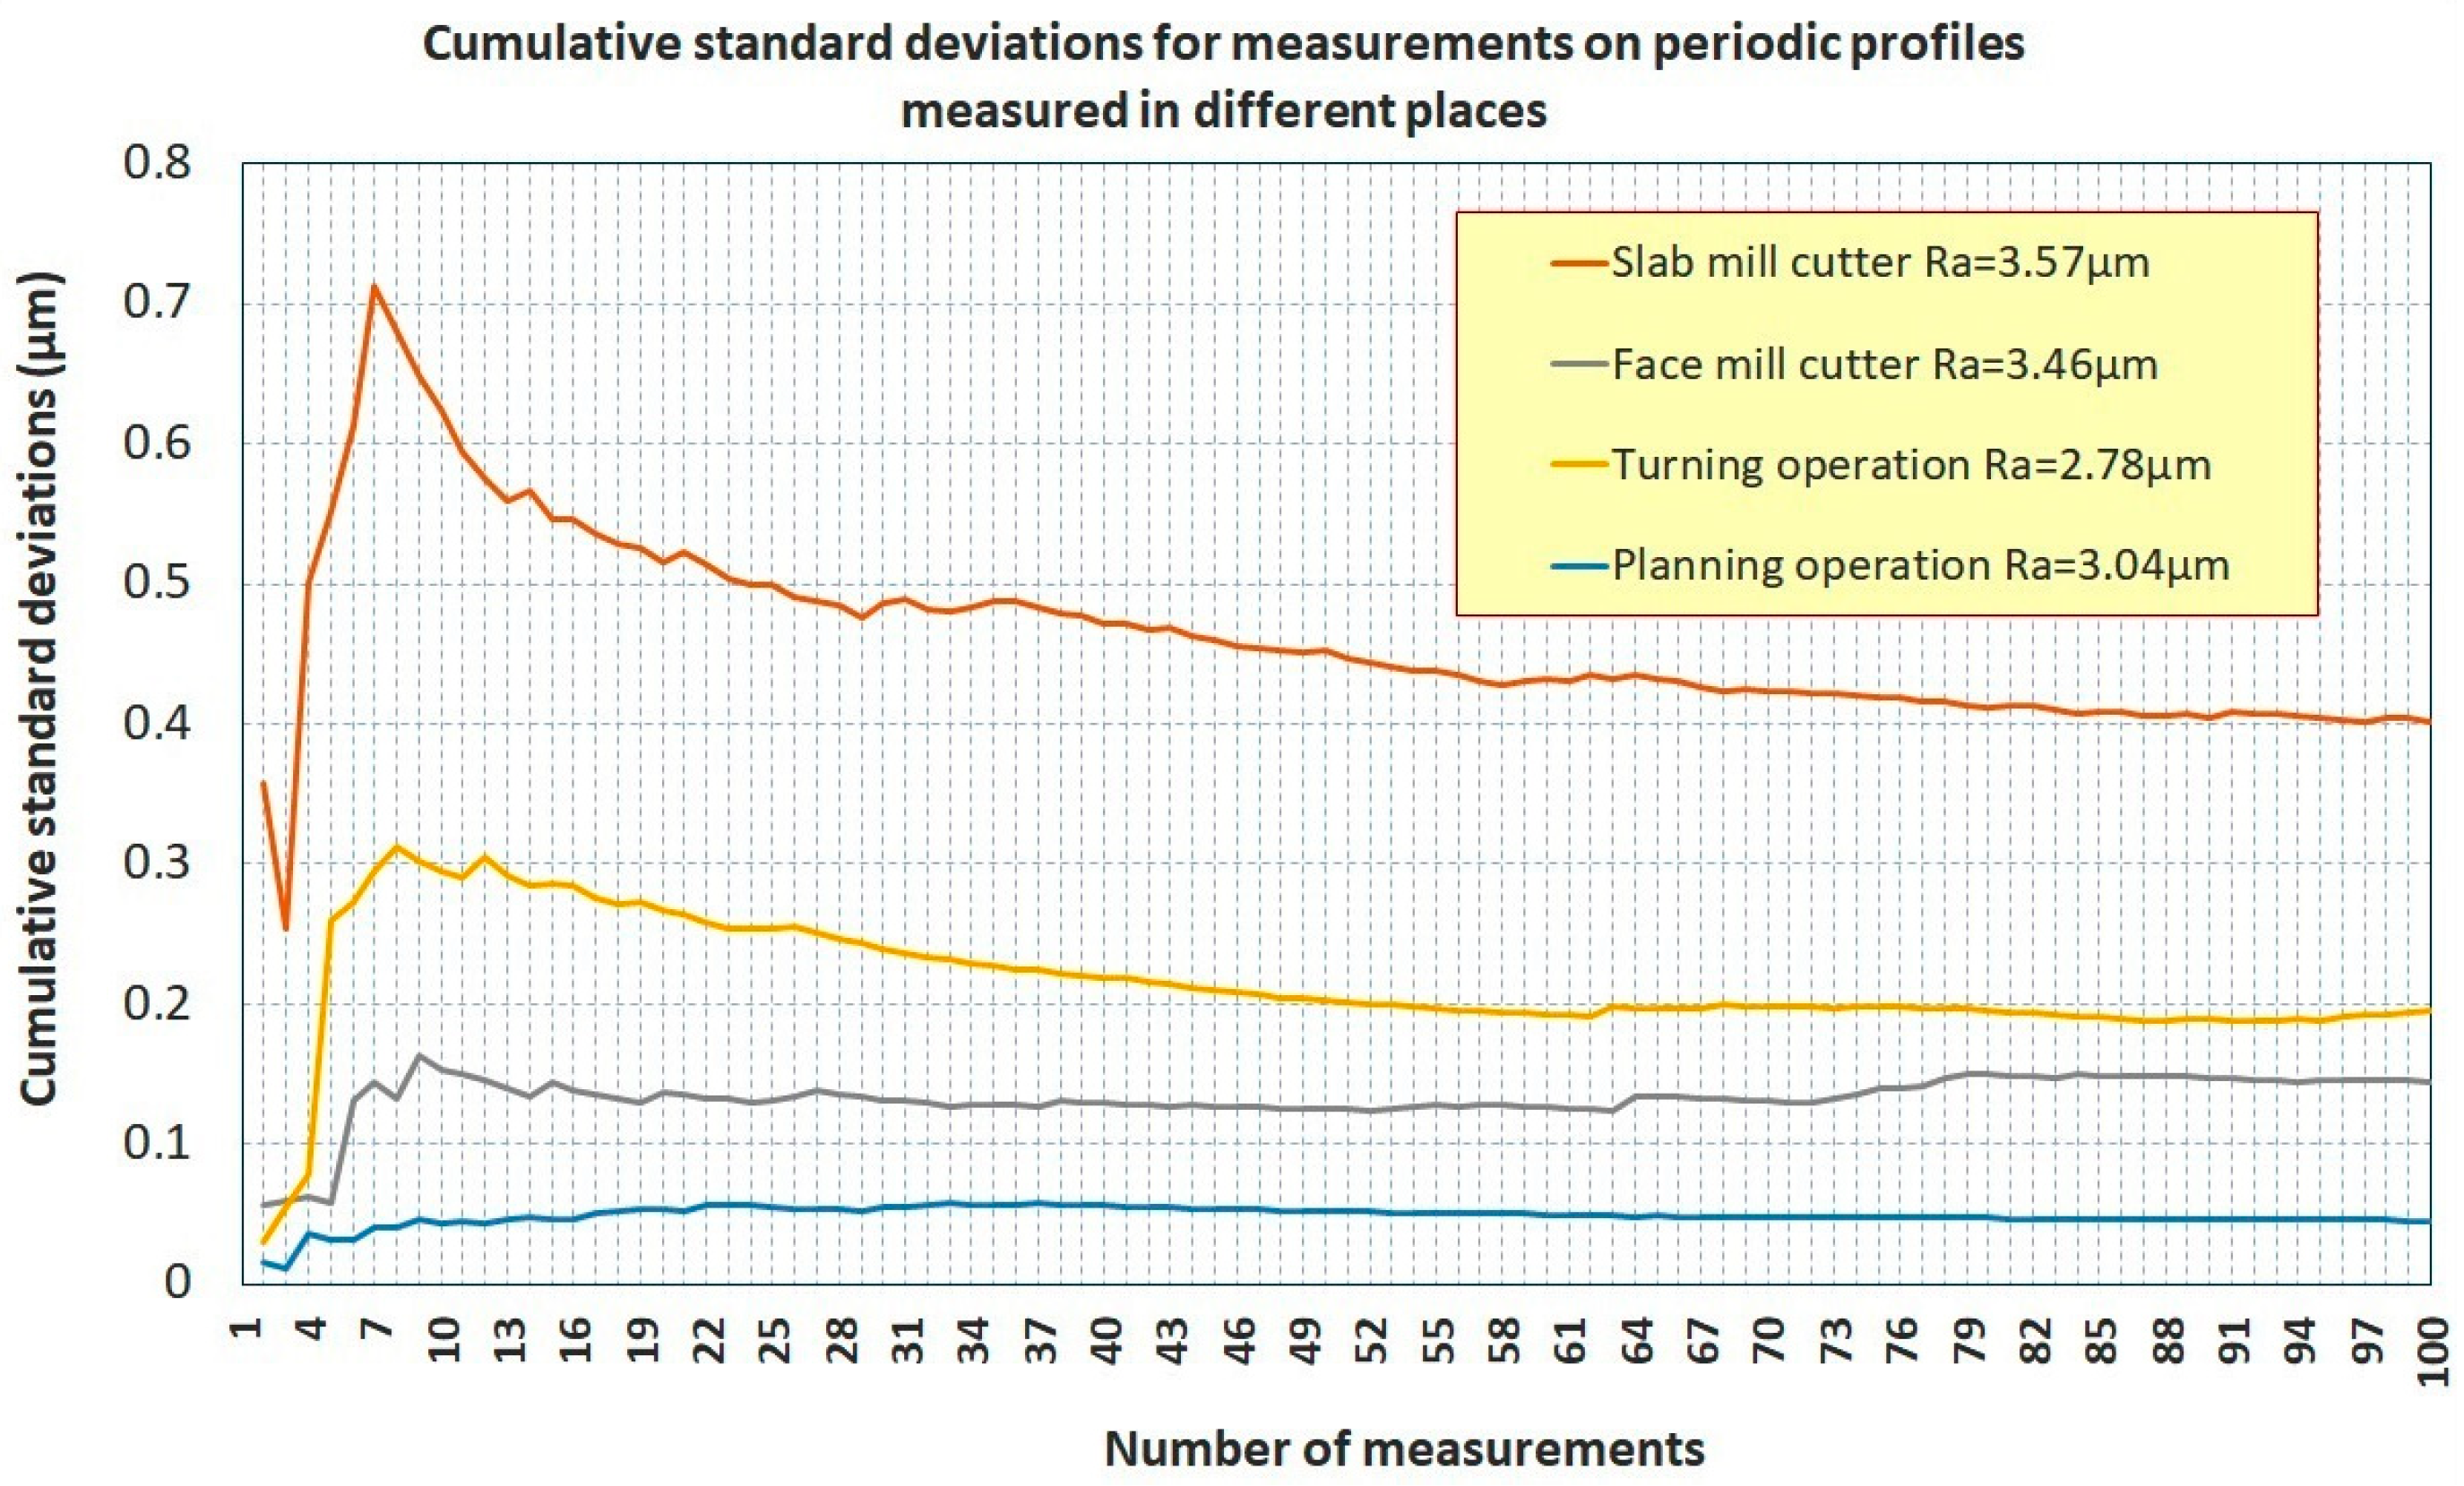
Ra data. Thus, it is clear that the number of measurements is insufficient. Only after 30 measurements is the cumulative standard deviation stabilized, and therefore, it is the optimal number for determining a reliable value of the surface roughness when measuring at different places of the examined surface of the component. Similarly, for samples with periodic profiles, the cumulative standard deviations are evaluated (
Figure 22). It also follows from them that the optimal number of measurements for determining a reliable value of the quantity
Ra is 30. Further increasing the number of measurements does not significantly improve the cumulative standard deviation of the measurement.
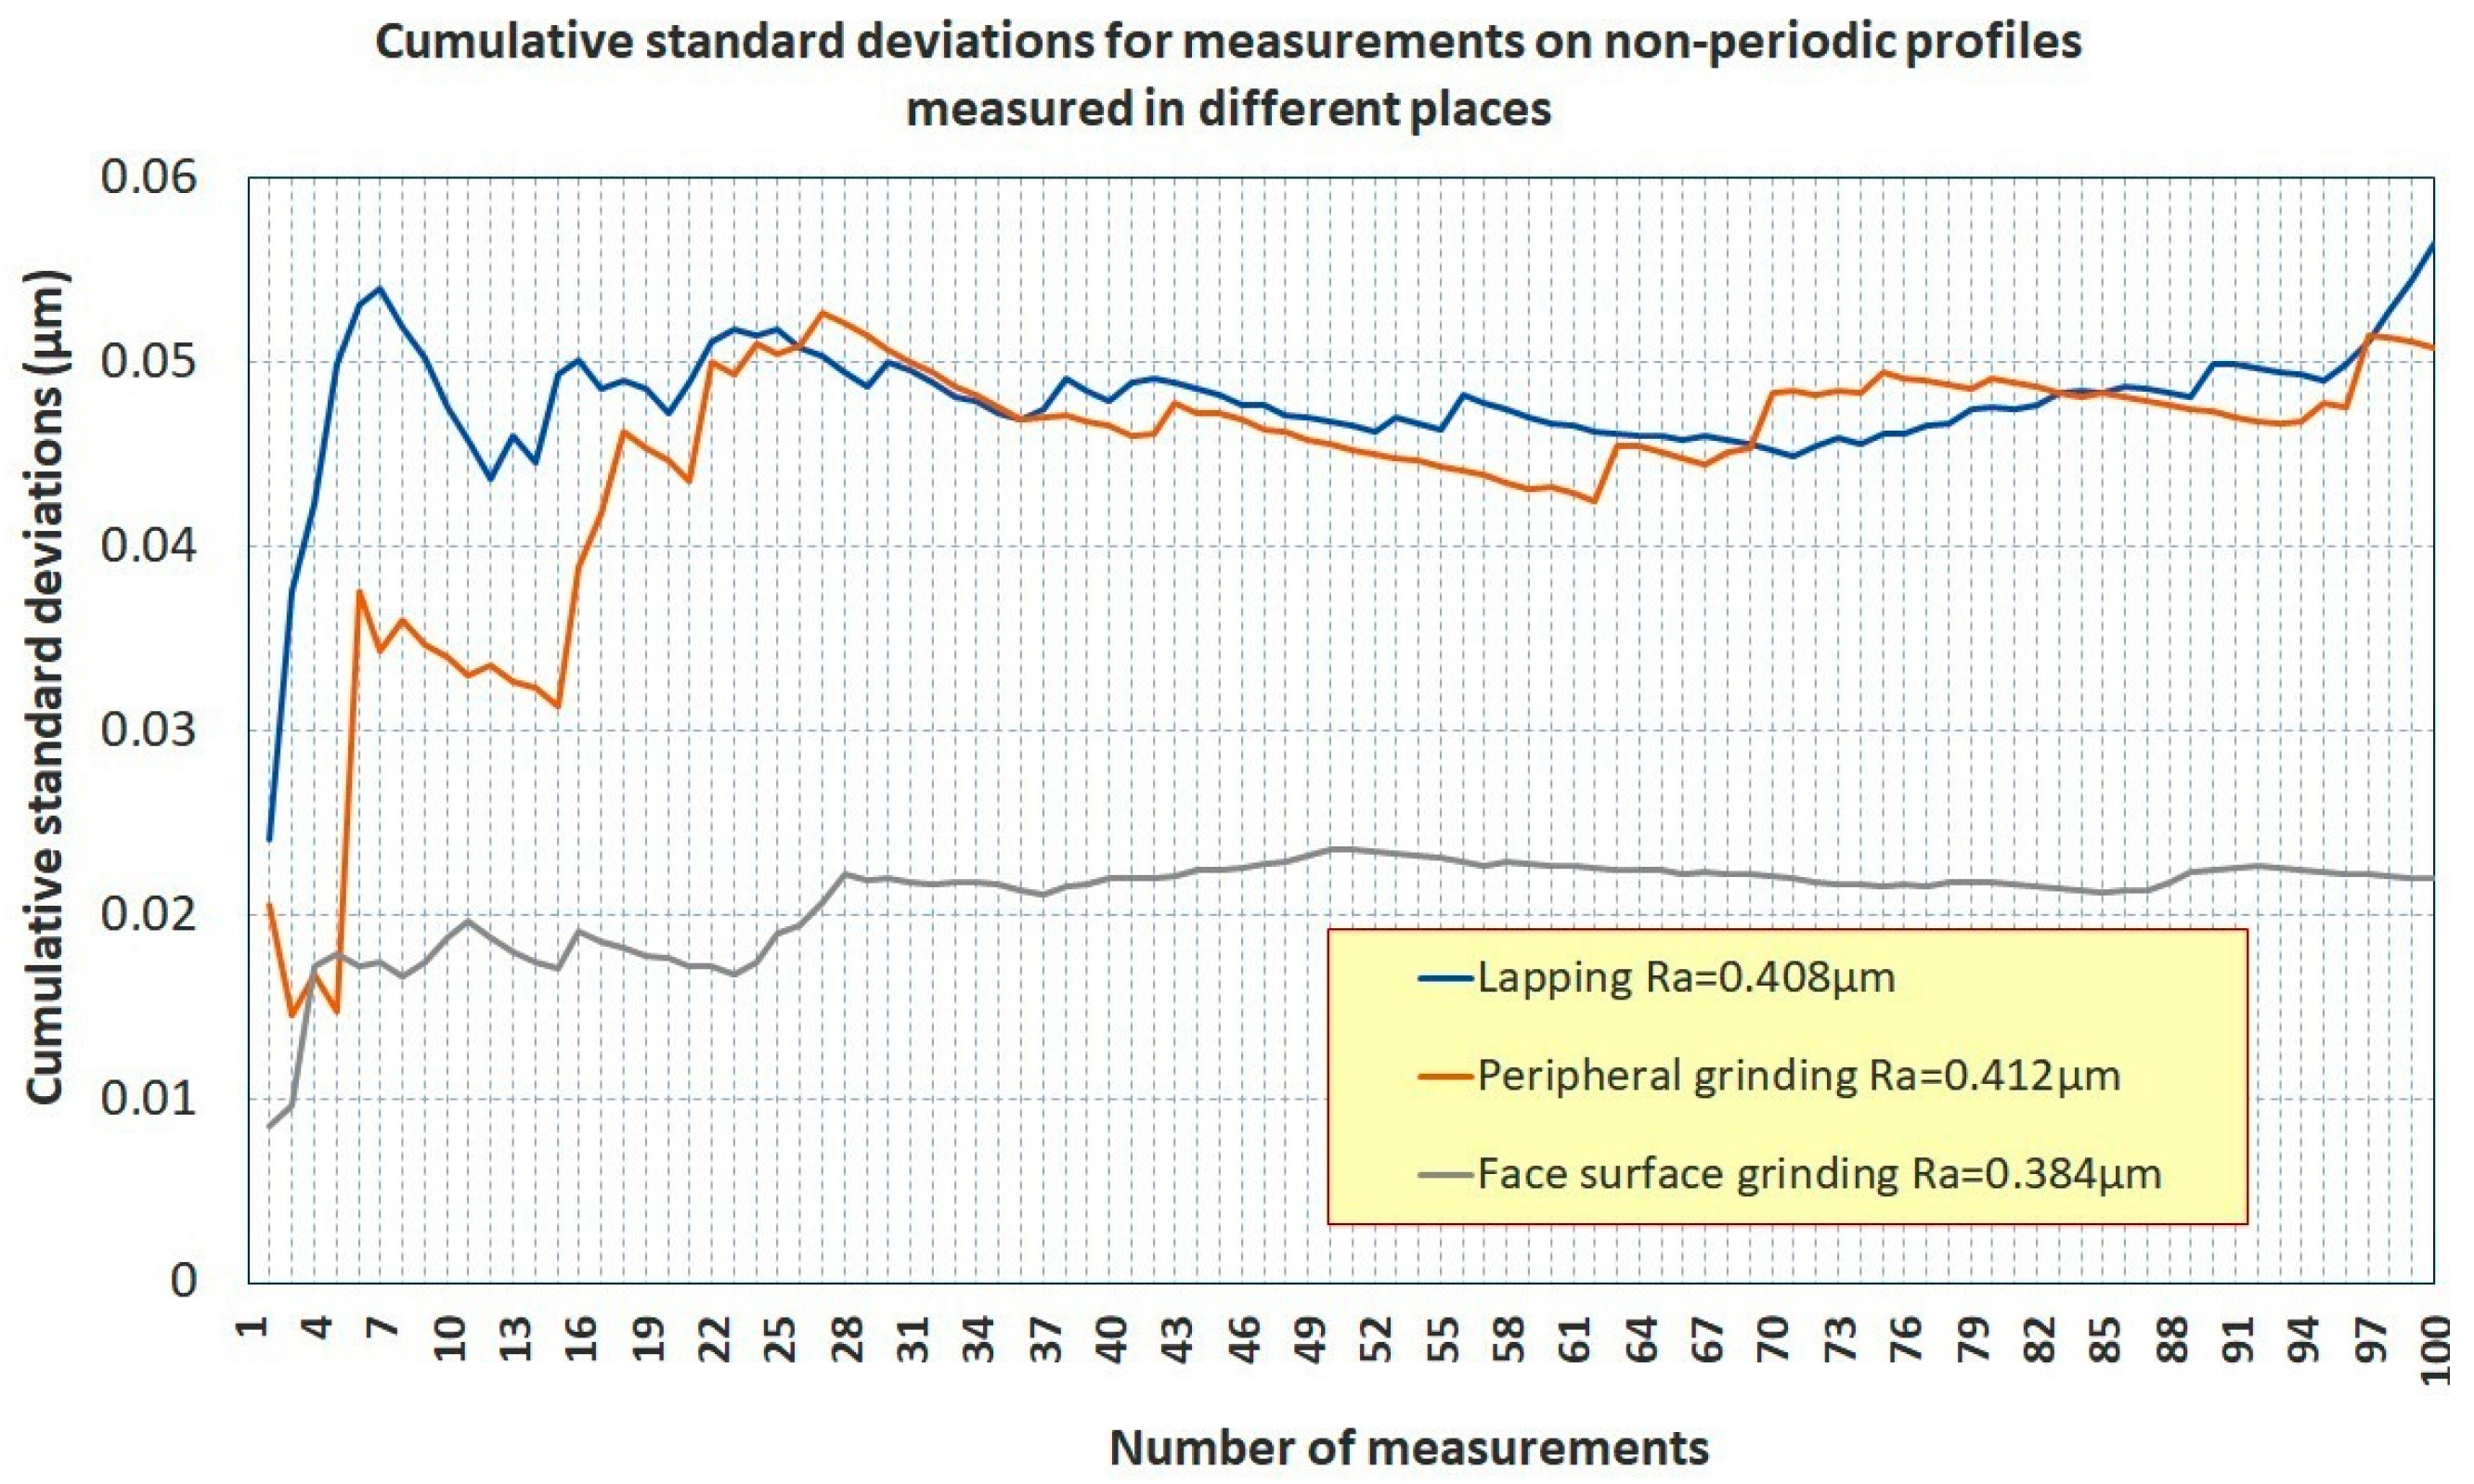
In the next step, repeated measurements and evaluations of Ra were again carried out for the same reference samples from each technology that was used for deposition. However, the measurements were carried out 30 times at the same place under the same measurement conditions. These measurements and evaluations should provide information on the variability of Ra values, excluding the influence of the technology itself on the uniformity of the surface roughness of the examined sample.
In
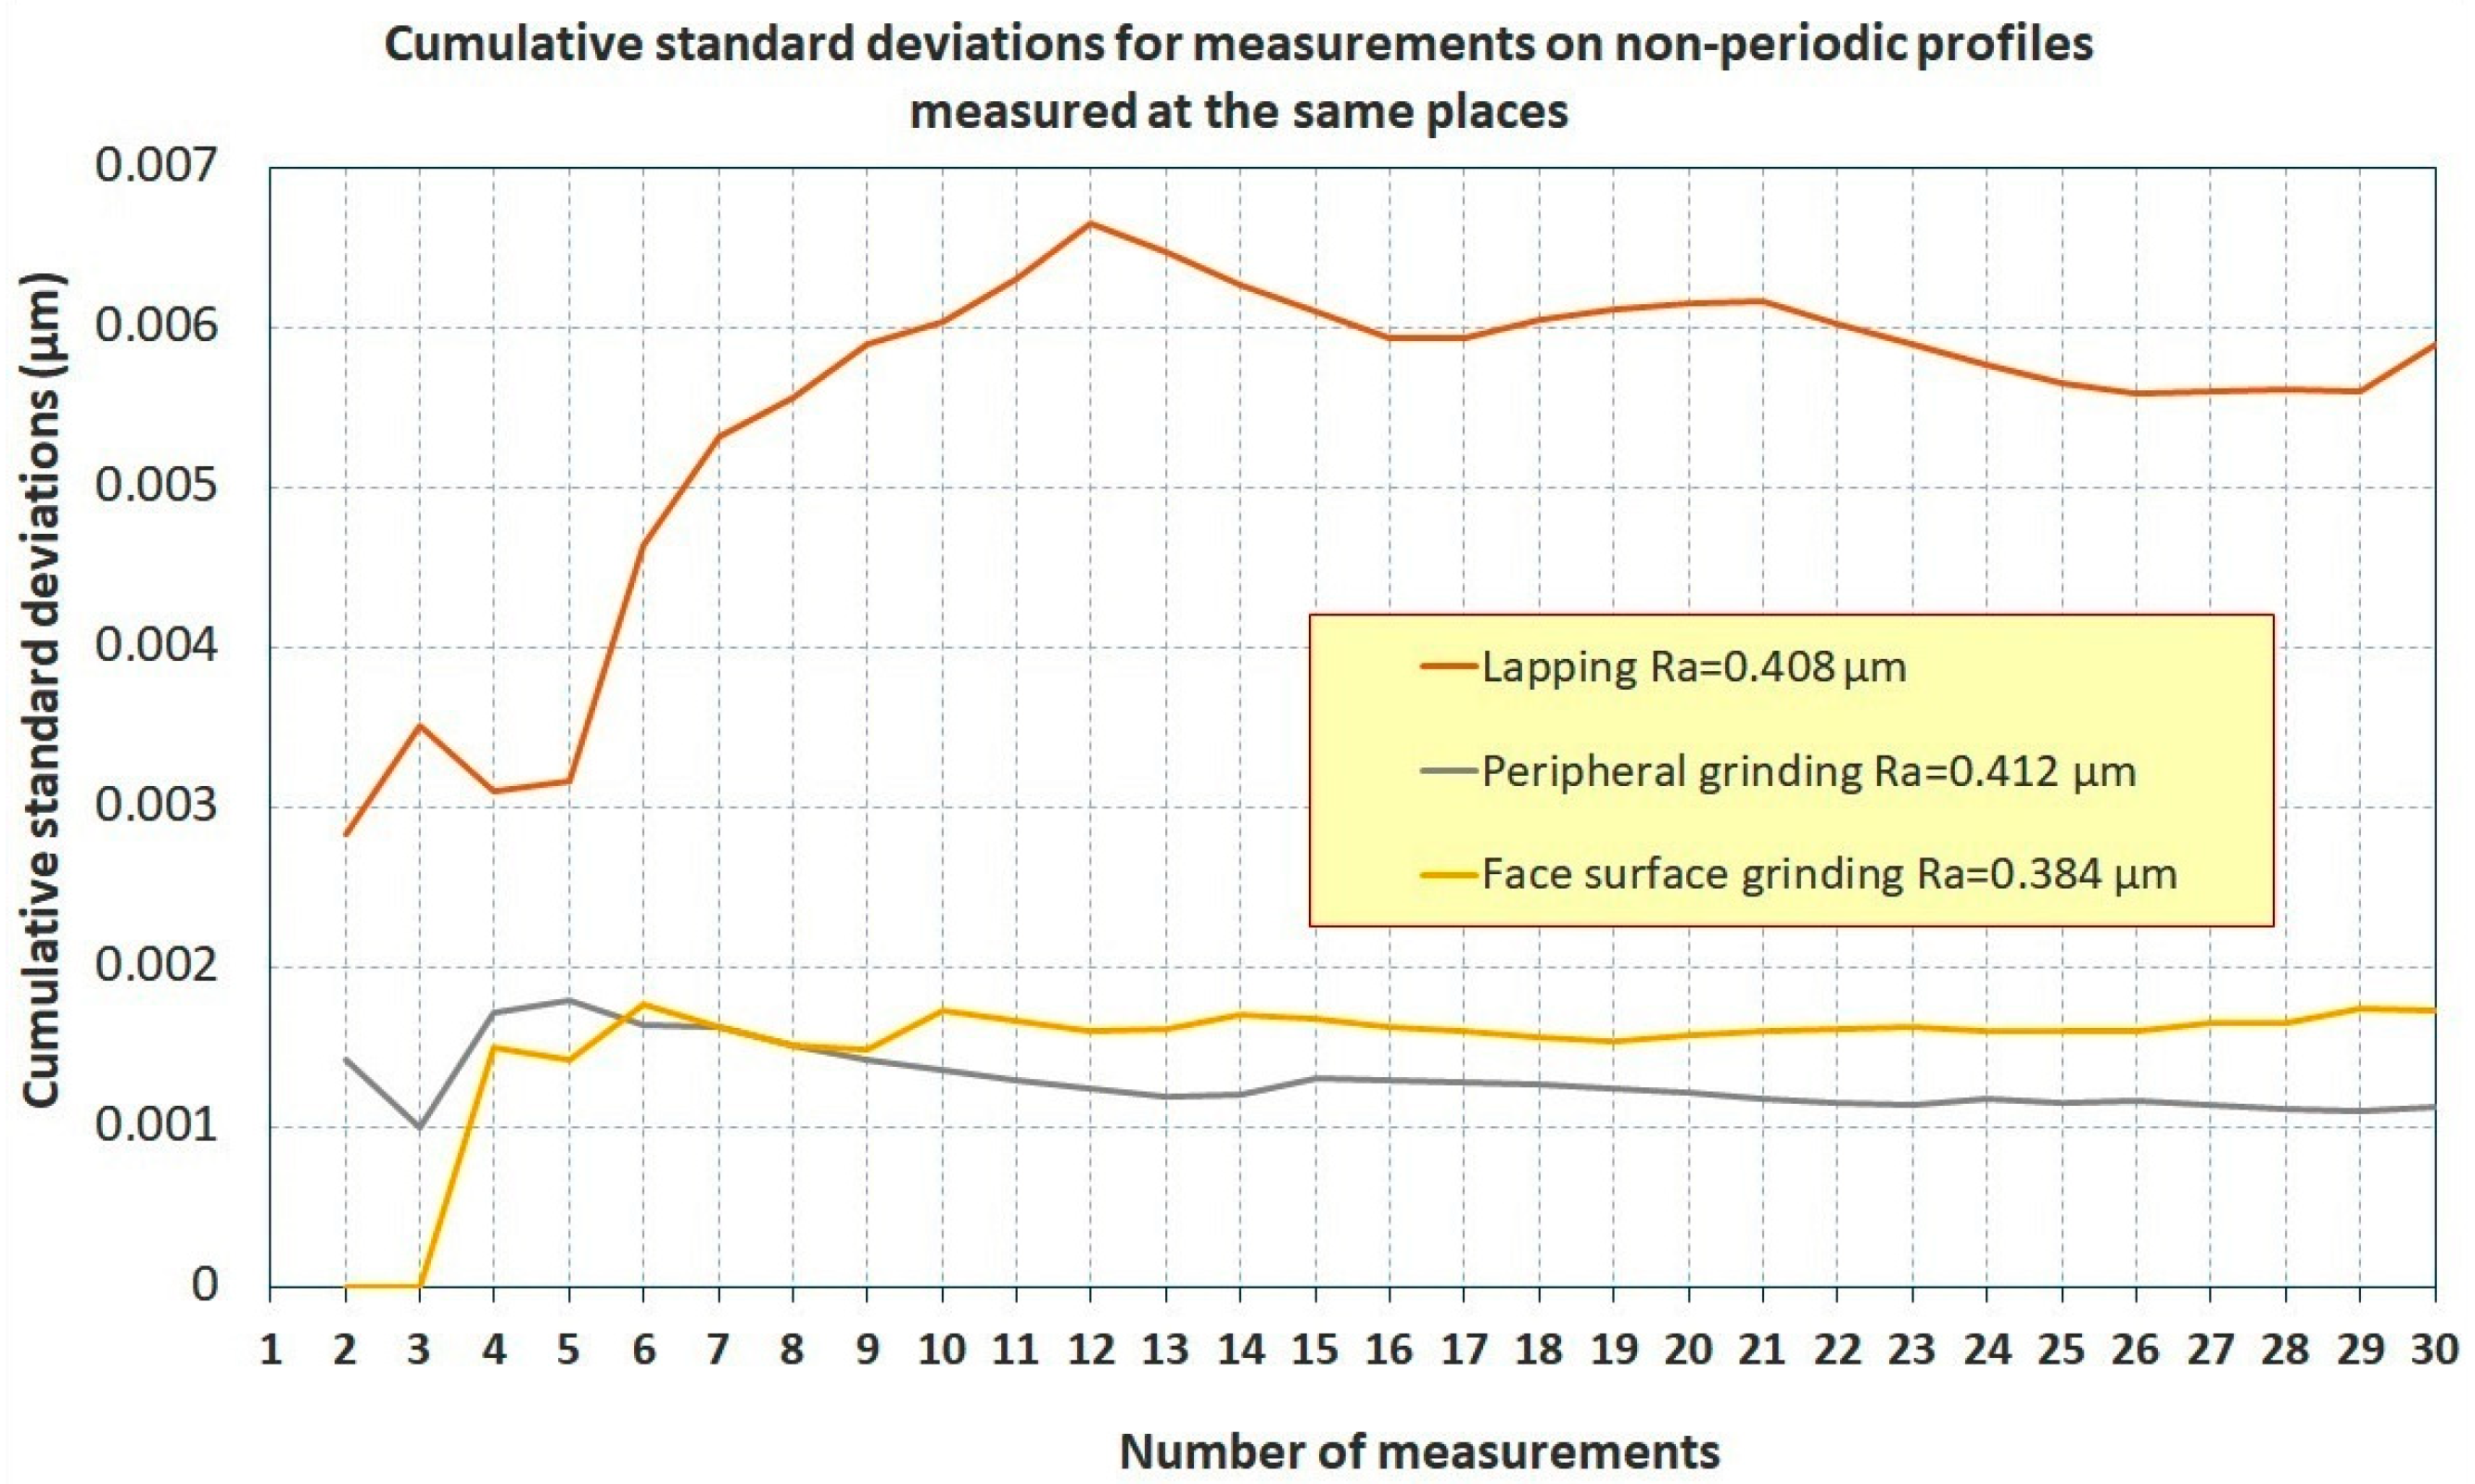
Figure 23, cumulative standard deviations for non-periodic profiles are evaluated. In the first values, instability is visible, which indicates a high variability of the
Ra values, but after 15 measurements, the value of the cumulative standard deviation stabilizes, which indicates that the number of measurements of 15 is sufficient for all technologies and further measurements will no longer bring a rapid improvement in the variability and uncertainty of the value of the quantity
Ra.
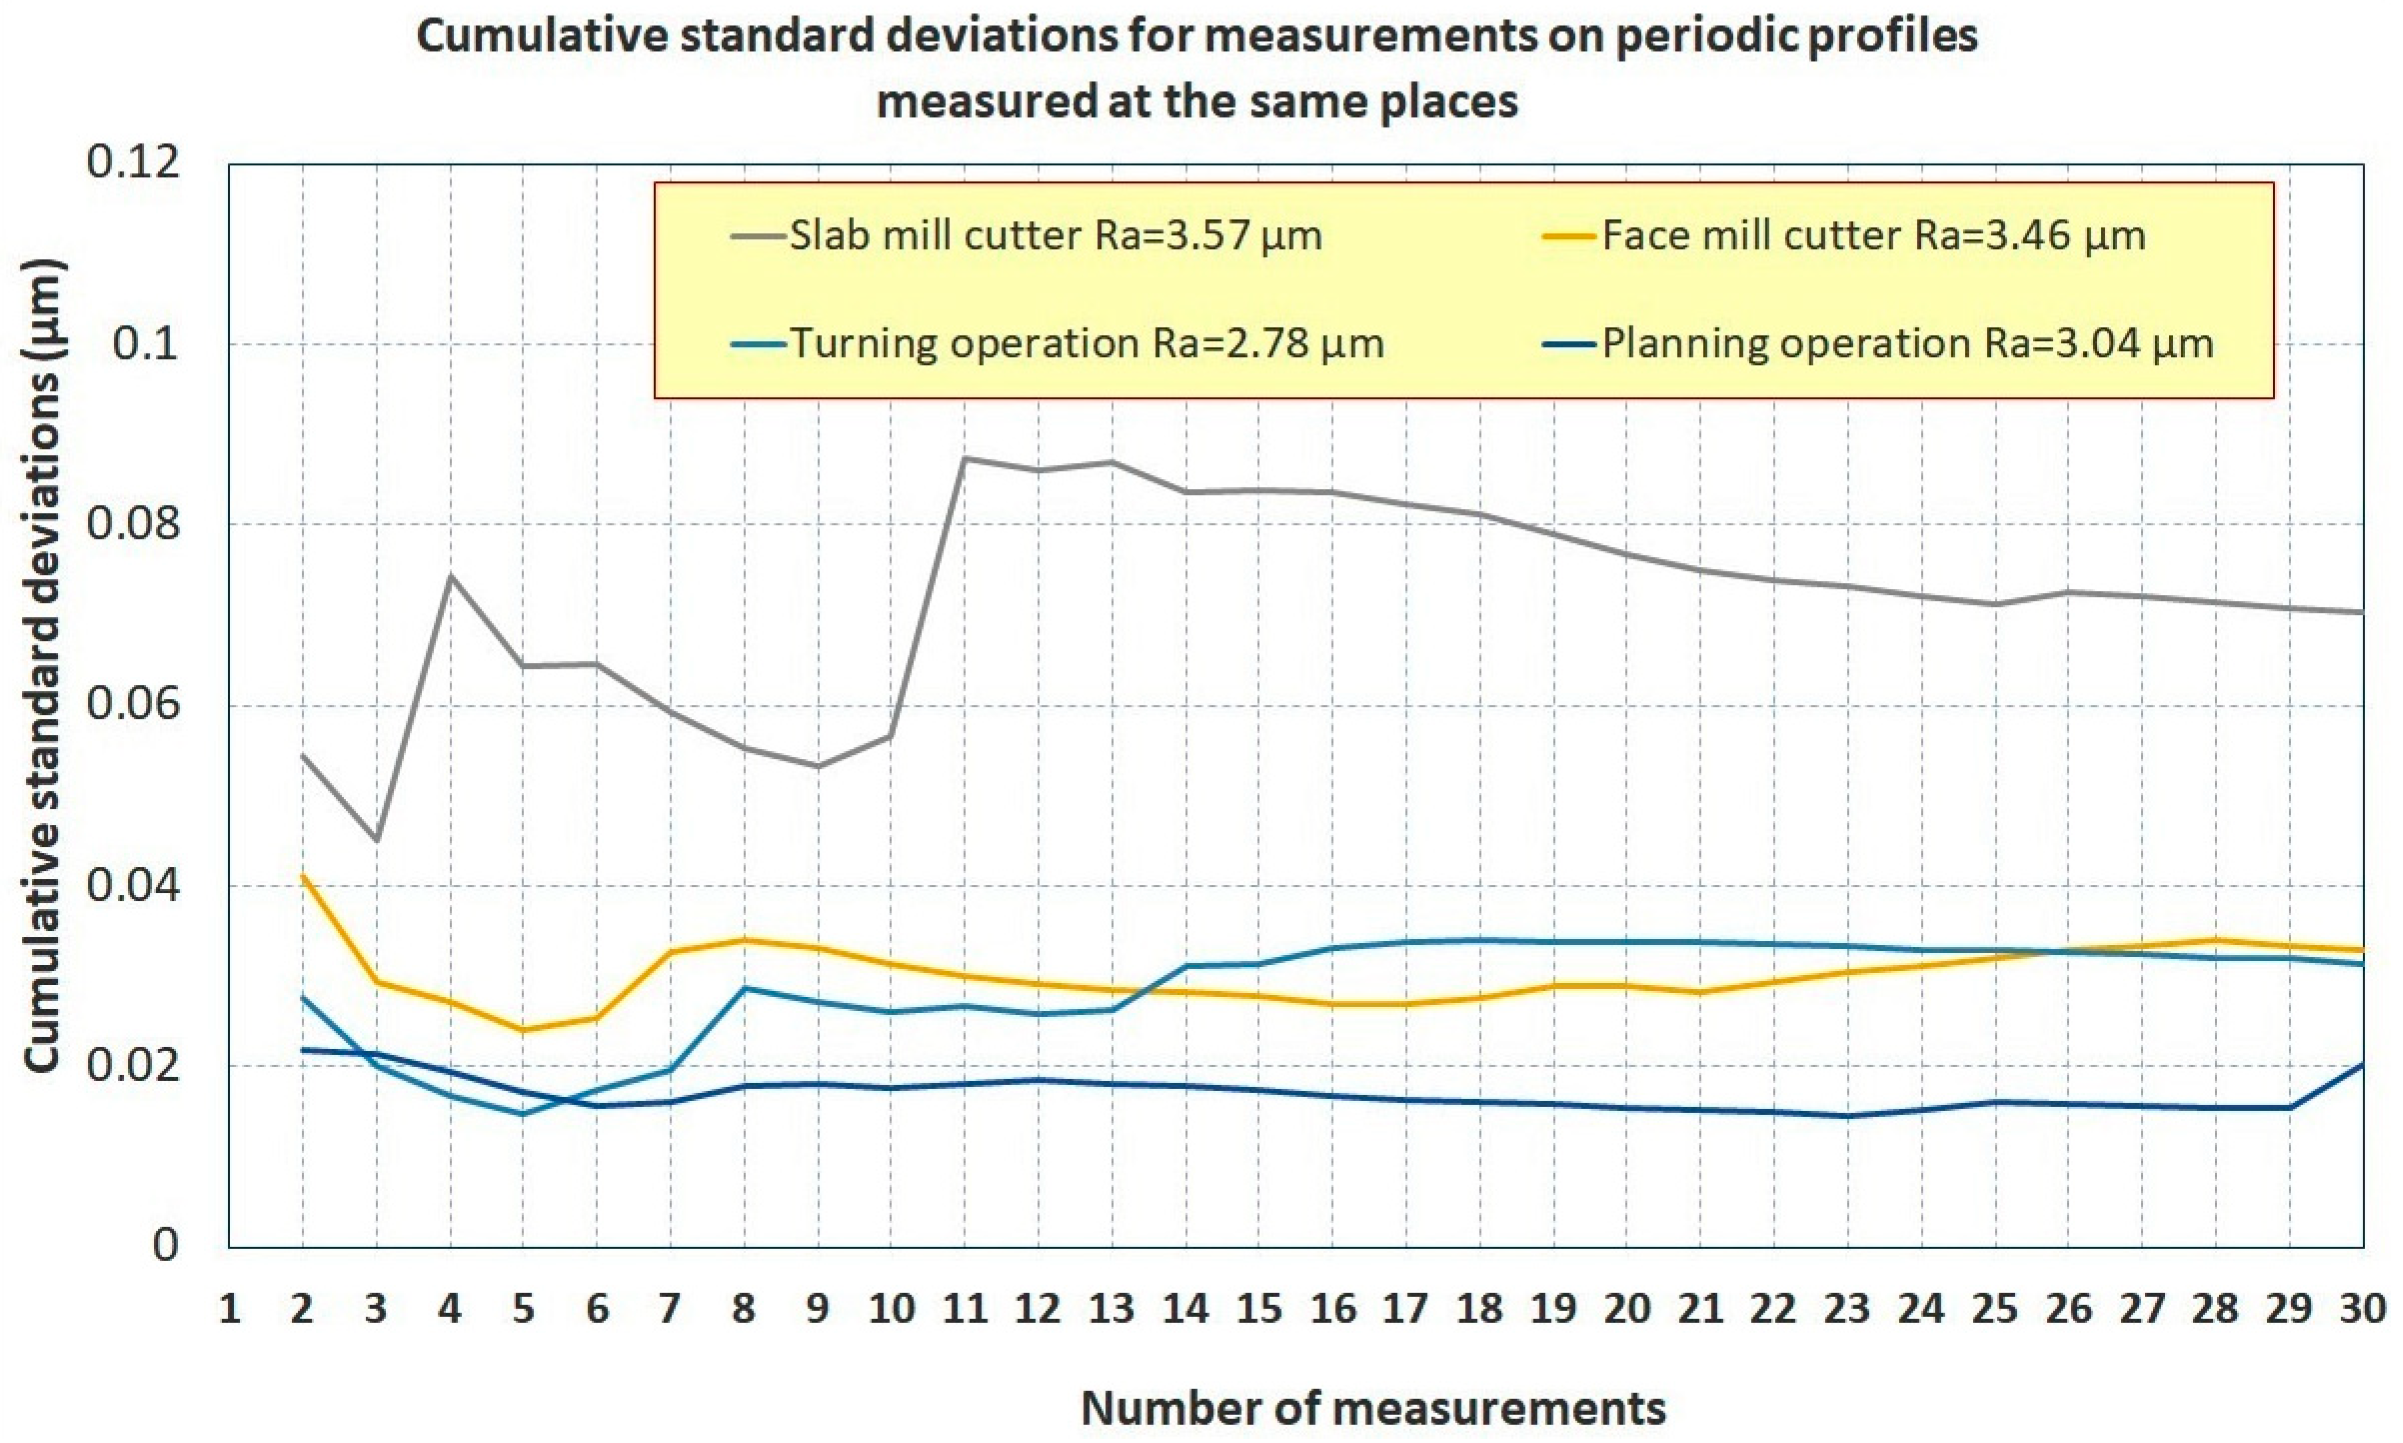
In
Figure 24, cumulative standard deviations for periodic profiles are similarly evaluated. Additionally, in this case, with these technologies, 15 measurements are sufficient to obtain the value of the quantity
Ra.
4. Discussion
The roughness of the surface is defined by the micro-geometry of the surface of the components, and to define this micro-geometry, a range of quantities are used, which are determined in this contact type of measurement from the identified surface profile. Since these are micro-dimensions, high demands are placed on the resolution and precision of the stylus and evaluation unit of the surface roughness tester.
The surface roughness and its quantities are characterized by a high degree of variability, and this is also related to the fact that it is quite difficult to implement the individual surfaces of the components so that their surface roughness is the same in every place of this surface.
The variability of the measured and evaluated data in this type of measurement is also related to the fact that the measurements are carried out indirectly, i.e., the profile of the surface of the examined surface of the contact method is measured using a stylus, and a very small displacement is seen in the vertical and horizontal direction.
The preparation and setting of the measurement parameters require a lot of attention, and poor implementation will cause incorrect measurement and evaluation results to be obtained. This can introduce additional errors and uncertainties into the measurement process; therefore, it is necessary to solve this problem with research such as that in this article, which can provide guidance on how to correctly implement the measurement process and evaluation of the quantity Ra.
Before carrying out the measurement, it is necessary to check the surface tester using a reference specimen and, if necessary, to carry out the calibration of the meter, and we recommend carrying out this check continuously during a large number of measurements or at least at the end of a set of measurements in order to eliminate measurement errors related to the detuning of the surface tester. The internal structure of the stylus contains fine mechanics and sensor and actuator systems that are extremely sensitive to improper handling and unsuitable environmental conditions; therefore, measurements and calibrations must be approached very carefully and sensitively, as rough handling often results in damage to the surface tester or reference specimen.
Determining the uncertainty for the roughness surface tester is, in this case, a very difficult task that exceeds the scope of this work, but it is possible to make at least an estimate of the measurement uncertainty using the resolution values of the displacement measurement for both axes X, Z. Evaluation of the uncertainty Ra based on data on errors and uncertainties of the sensor and positioning of the stylus system is, therefore, a task that may be addressed in further future research.
In order to determine at least a rough estimate of the uncertainty of the gauge, 100 measurements were made at the same place under unchanged measurement conditions, and the values of the quantity Ra were evaluated. The cumulative standard deviation method was used to monitor the influence of the number of measurements as well as the statistical model of the distribution of the measured data. From these measurements and evaluations, it can be concluded that the used surface tester is in excellent condition, and the maximum standard deviation did not exceed 0.005 µm. The distribution of the measured values did not match the Gaussian normal law of the distribution of random values, so for the further use of the device and the evaluation of the surface roughness values, a uniform law of the distribution of the measured values will be considered.
The actual measurement of the surface structure usually takes only a few seconds and is determined by the feed speed and the scanned length, and other settings, but the measurement preparation time is considerably longer, on which the success of the measurement depends. Before the measurement and evaluation process, it is necessary to set several input parameters for the measurement, which can have a very significant impact on the actual measurement and evaluation of individual surface roughness quantities. The effort was to solve this problem, and thus the influence of individual settings of the surface tester on the process of measurement and evaluation was investigated; however, due to the difficulty of this issue, this article focuses mainly on the quantity Ra, which is evaluated by the used surface tester. The effect of the selection of the evaluation standard, the effect of the speed of the stylus movement, and the effect of the cut-off filter value on the resulting Ra value were monitored for different types of machined parts surfaces, where standard samples with a known Ra value were used.
To investigate the influence of the stylus speed and the choice of standard, experimental measurements were carried out on a standard sample of surface roughness for grinding with nominal values of Ra = 1.6 µm and 3.2 µm, where for each combination of the selected speed of the sensor and the evaluation standard, ten measurements were carried out on it in a certain place to exclude the variability of the standard sample. The influence of the choice of the evaluation standard and the choice of the sensor movement speed can have a significant impact on the resulting Ra value, and it can be concluded that for some standards, this influence is negligible, but for some standards, it can be seen that increasing the sensor movement speed tends to reduce the resulting Ra value and this influence it is mainly visible in samples with a larger Ra value. A good choice seems to be to use a speed of movement of the sensor with a value of 0.5 mm/s, and the evaluation standard can be selected according to the country where the evaluation is carried out. For our conditions, it was preferred in the experiments and then also the evaluation according to the ISO 1997 standard. To assess the impact of the choice of the evaluation standard and the choice of speed of movement of the sensor, the variability of the measured and evaluated Ra data obtained under the same conditions is also an interesting indicator.
The variability of the data, depending on the choice of the evaluation standard and the speed of the sensor movement, is expressed as a percentage with respect to the average evaluated Ra values, and from its evaluation, it follows that the variability of the Ra data is a maximum of 18% in percentage terms.
Another monitored and problematic setting is the setting of the filter cut-off value Lc, and this can be seen from the conducted experiments, where it is clear that if, for example, we choose a too-small Lc value for the sample, then the result is Ra with an almost zero size. However, if we choose a value of Lc that is too large, then the value of Ra may also include the influence of waviness, and this may distort the value of Ra, so the errors that we make with a bad free cut-off may be huge and may have a fatal impact on the result of evaluating the roughness of the surface being assessed parts.
The ISO 3274:1996 [
35] standard contains guidelines on how to set the cut-off value of the
Lc filter for non-periodic surface roughness profiles, while the EN ISO 4288 [
34] standard recommends setting the cut-off parameter
Lc or of the basic length
lr and the evaluated length ln according to the
Ra value, while the evaluated length
ln is recommended as five times the basic length
lr. Here the problem arises of how to determine the basic length and the evaluated length according to the unknown
Ra value, which creates a problem with the measurement procedure defined in this way because the choice of the basic length has a significant impact on the result of the process of evaluating the average arithmetic deviation of the considered profile. This paradoxical recommendation can influence the result of the surface roughness evaluation to a significant extent.
The origin and conditions of the mentioned recommendations of these standards are not clear, and therefore in this article, experiments were carried out on samples produced by different technologies to verify these recommendations. It is, therefore, necessary to take into account the technology used to evaluate the surface of the component, and therefore the goal was to identify the effect of the cut-off filter setting Lc on the Ra values for individual types of reference samples processed by different technologies.
For experimentally assessed non-periodic surface roughness profiles (lapping, peripheral grinding, and face grinding), the optimal setting of the cut-off filter Lc was observed in some reference samples as the one recommended in the ISO standard, but for some samples, other recommended cut-off settings were found off filter Lc (for samples with larger Ra values). However, on the basis of the above results, it can be concluded that the guidelines according to the standard for the settings of the cut-off filter Lc are generally applicable for obtaining relevant results for the evaluation of the surface roughness quantity Ra; however, the company that produces machined parts must verify these settings for its technology in order to achieve reliable results of measurement and evaluation of surface roughness values.
In the article, a methodology was proposed as one of the options for determining the surface roughness of the examined part by comparing the surface roughness profile with the surface roughness profile of the standard sample whose nominal Ra value is known. For this purpose, it is possible to use the Comparex comparative monocular microscope, with which experimental measurements were carried out in the work, and then based on these measurements, it is possible to estimate the value of Ra and then subsequently set the cut-off parameter Lc for the subsequent measurement and evaluation of Ra using Stylus-based surface roughness tester.
For periodic profiles (turning, milling, planing) the ISO 4288:1996 standard [
34] recommends monitoring the quantity—the average distance of the profile elements
RSm as a parameter for choosing the cut-off filter
Lc, and thus the problem arises again in that the cut-off setting of the filter
Lc depends on the value of the parameter in this case
RSm, which, however, will be available only as a result of the evaluation of the surface roughness measurement. The experimental results of measurements and evaluation of
Ra for individual technologies for periodic profiles were subjected to the above analyses, and the optimal setting of the cut-off filter
Lc for each technology was determined. For some samples, slight disproportions are visible in the intervals suitable for the free cut-off values of the
Lc filter; however, these interval shifts may be related to measurement uncertainties.
The analysis of surface roughness profiles, RSm values, and Ra values shows the interesting fact that for all samples of periodic surface irregularities, it is advisable to proceed in such a way that to determine the parameter RSm, it is advisable to carry out measurements at all settings of the cut-off filter Lc (similarly to what was done in the case of individual technologies of periodic profiles) and according to the detected surface roughness profiles, it is then possible to determine the value of RSm. When evaluating RSm, the character of the course of the surface roughness profile must be monitored and whether there are signs of periodicity typical for the given type of machining, and whether the influence of the waviness of the surface profile is no longer visible.
For the RSm value determined in this way, it is then possible to select the filter cut-off parameter Lc for further repeated measurements according to the recommendations in the ISO 4288/1996 standard. With this procedure, it is then possible to obtain the correct Ra value and, in addition, it is also possible to carry out comparative measurements using the Comparex comparison microscope for the verification of the correct determination of the value of Ra, similar to what was done with non-periodic samples, and thus it is possible to confirm the correct selection of the cut-off filter value Lc.
The existence of newer standards of the ISO 21920-1, ISO 21920-2, and ISO 21920-3 series [
37,
38,
39] brings the methodology of non-discrimination of periodic and non-periodic profiles and unifies the recommended gauge settings for measuring surface roughness quantities. For non-periodic profiles, the recommended settings are slightly shifted to smaller
Ra values, and it can be stated that the new methodology, according to the ISO 21920-3 standard [
39], is in agreement with the experimental values from the previous standards ISO 4287 [
33], ISO 4288 [
34]. For periodic profiles, the situation is more complicated, as the previous standard ISO 4288 [
34] used the
RSm parameter to determine the optimal settings, but by comparing the experimentally determined optimal settings, it was found that, except for planing technology, all values for periodic profiles are in accordance with the recommendations of the ISO 21920-3 standard [
39] and therefore the investigation of planning technology will be the subject of further research.
Another problem addressed in this article is how to determine the necessary number of repeated measurements needed to determine the value of the quantity Ra, and to solve this problem, a method of successive evaluation of the standard deviation of repeated measurements and evaluation of the quantity Ra is proposed. After each additional measurement, the standard deviation will be recalculated with the addition of each new value to the set of measured data. That is why this method was called cumulative standard deviation, which will thus capture the impact of the increasing number of performed measurements on the value of the standard deviation of the quantity Ra.
One hundred measurements were carried out at different measurement points on selected reference samples from each technology for which samples were available, while the quantity Ra was evaluated, and from these experiments, it follows that the optimal number of measurements is 30 for all used samples from the available technologies. In the next stage, repeated measurements and evaluations of the quantity Ra were carried out again for the same reference samples, but the measurements took place at the same place of each sample under the same measurement conditions, and from the calculated values of the cumulative standard deviations, it follows that the optimal number of measurements for this case on all samples is 15 measurements.
5. Conclusions
In this work, specific problems related to the process of measurement and evaluation of surface roughness quantities were solved, and samples of non-periodic surface roughness profiles with different Ra values processed using technology were selected for experimental investigation, including lapping operation samples, peripheral grinding operation samples, and face grinding operation samples.
Additionally, samples of periodic surface roughness profiles with different Ra values were processed using the following technologies: milling operation with slab mill cutter, milling operation with face mill cutter, turning operation, and planing operation.
The novelty and contribution of the article is:
(a) Assessment of the condition of the used surface tester by the proposed methodology for determining the variability of the obtained results.
(b) Identification of the influence of individual surface tester parameter settings. A methodology was proposed for assessing the influence of parameters on the resulting value of Ra.
(c) Verification of the standard recommended settings of the cut-off filter for the determination of the quantity Ra and determination of the methodology for the process of measurement and evaluation for periodic and non-periodic profiles.
(d) Experimental determination of the optimal number of repeated measurements and proposal of a methodology for determining these data.
The results of the work confirmed the validity of assessing the condition of the gauge, and the proposed method is a relatively quick method to implement it.
In conclusion, it should be said that the experiments have shown that for individual technologies, it is appropriate to experimentally verify the methodology for the selection of measurement parameters and the evaluation of surface roughness quantities in order to avoid potential errors in the evaluation of surface quality.
It should be said that all experiments were carried out on a specific surface tester, so it is possible that another device may behave differently. Consequently, it is in the interest of each laboratory to know the status of its surface tester in this way. Additionally, it is also necessary to emphasize that this condition must be regularly checked, and, if necessary, a service intervention must be undertaken.
So far, we have not found studies of a similar type, so it was not possible to compare our results to the results of other studies. The scarcity of similar studies is why this research was conducted. The goal was to solve problems that we encountered in common tasks of evaluating surface roughness.
It should be emphasized that these results are tied to specific reference samples and a specific surface tester. Further experiments on other surface testers and other samples will be necessary to generalize these results. For practical use, it is essential that users identify their surface tester and the manufacturing capabilities of their products in terms of process stability and surface roughness variability. Therefore, in this article, we have tried to solve some practical and scientific problems associated with the assessment of surface roughness.
Many research works solve this problem; however, the influence of surface roughness and frictional forces tend to be neglected, and problems are solved without these important factors. Thus, the real situation can differ very dramatically from mathematical models and simulations where contact surfaces without surface roughness and frictionless were considered forces, and this can result in serious problems in real systems. As a result, many authors have focused on identifying surface roughness and planning technologies to achieve it and also take into account the effect on frictional forces. These are mainly applied in the field of mechanical engineering, mechatronics, robotics, production engineering, machining, biomedical engineering, automotive engineering, tribology, microsystems, precision mechanics, etc. [
66,
67,
68,
69,
70,
71,
72,
73,
74,
75,
76,
77,
78,
79,
80,
81,
82,
83,
84,
85].
In future research, we plan to develop a method for a more precise evaluation of measurement uncertainties for surface roughness quantities because, for practical use, a suitable methodology is needed to effectively determine the measurement uncertainty.


 ) symbol shows the value of Lc, which is optimal according to the performed experiments when the determined value of Ra is the closest nominal value of sample Ra. The displayed results show that the recommendations of the ISO standard are not in agreement with all experimental observations. These are mainly samples with larger Ra values.