Featured Application
Deep learning-based diagnosis of a suspicious lesion using a simple handheld device such as smartphone. Awareness and frequency of diagnosis of malignant melanoma will be increased thereafter, increasing the chances of detection of skin cancer at an early stage. Out motivation is to deploy the deep learning algorithm using a smartphone application.
Abstract
Melanoma is the deadliest type of cancerous cell, which is developed when melanocytes, melanin producing cell, starts its uncontrolled growth. If not detected and cured in its situ, it might decrease the chances of survival of patients. The diagnosis of a melanoma lesion is still a challenging task due to its visual similarities with benign lesions. In this paper, a fuzzy logic-based image segmentation along with a modified deep learning model is proposed for skin cancer detection. The highlight of the paper is its dermoscopic image enhancement using pre-processing techniques, infusion of mathematical logics, standard deviation methods, and the L-R fuzzy defuzzification method to enhance the results of segmentation. These pre-processing steps are developed to improve the visibility of lesion by removing artefacts such as hair follicles, dermoscopic scales, etc. Thereafter, the image is enhanced by histogram equalization method, and it is segmented by proposed method prior to performing the detection phase. The modified model employs a deep neural network algorithm, You Look Only Once (YOLO), which is established on the application of Deep convolutional neural network (DCNN) for detection of melanoma lesion from digital and dermoscopic lesion images. The YOLO model is composed of a series of DCNN layers we have added more depth by adding convolutional layer and residual connections. Moreover, we have introduced feature concatenation at different layers which combines multi-scale features. Our experimental results confirm that YOLO provides a better accuracy score and is faster than most of the pre-existing classifiers. The classifier is trained with 2000 and 8695 dermoscopic images from ISIC 2017 and ISIC 2018 datasets, whereas PH2 datasets along with both the previously mentioned datasets are used for testing the proposed algorithm.
1. Introduction
Rapid growth of atypical skin cells due to alteration or inherited abnormality of damaged Deoxyribonucleic acid (DNA) causes skin cancer, which is the deadliest type of cancerous cell, contributing to 1/3 of total cancer cases worldwide as reported by World Health Organization (WHO) []. Skin cancer is caused due to genetic and environmental factors such as prolonged exposure to harmful ultraviolet (UV) radiation, collectively UV-A (with long wavelength) and UV-B (with short wavelength), from the sun which led to unresistant growth of melanocytes-the pigment producing cell of skin. Malignant melanoma (MM), basal cell carcinoma (BCC) and Squamous cell carcinoma (SCC) are commonly reported skin cancerous cells []. Among these various skin lesions, BCC and SCC are non-melanocytic cancer and are considered to be innocuous, whereas the malignant melanoma is most threatening with maximum death cases []. According to the reports by the National Skin-Cancer Institute, the highest number of diagnoses cases is for skin cancer, with most cases being reported in the USA []. According to the reports of federal data, 63,000 melanoma lesions were diagnosed in the USA from 2007 to 2011. According to the American cancer society’s (ACS) 2017 report, every 54–60 min a person passes away due to melanoma []. ACS’s annual report of 2019 estimates 96,480 new melanoma cases with 7230 deaths from melanoma []. However, melanoma can be cured if diagnosed and detected at an early stage []. The survival rate of melanoma is 95% when diagnosed in situ (Stage 0), whereas the rate decreases below 15% if diagnosed in an advance stage [], if the tumor is not treated at its early state, it might metastases to lung or liver tumor, thereby decreasing the mortality rate to less than 20% even after surgery. The report draws a clear conclusion that timely identification and treatment of melanocytic lesion is directly proportional to survival rate. Thereby, identification of melanoma lesions in its premature phase is imperative (although the nature and intense growth of the lesion makes this a formidable task).
As stated by dermatologists, the melanoma lesion can be visually similar to a mole, pigmentation or/and non-melanocytic lesions, which makes it difficult to detect. Malignant lesions are irregular and ameboid surfaced, rapidly growing lump, generally more than 5 mm in dimension, asymmetrical in shape, and can appear in shades of brown, black, or deep gray. Lesion visually appears such as a contour of various color pigmented as a cluster. Rapid development of the melanoma lesion may lead to itching, inflammation, ulceration, or even bleeding. However, dermatologists also agree that a melanoma lesion might not show any systematic sign and can grow in any area irrespective of exposure to sun’s direct radiation. The dawn of twentieth century has witnessed traditional methods of diagnosis and identification of skin cancer by physical screening and visual examination of lesions. Clinical inspection of skin cancer by dermatologists depends on visual changes in size, shape, and/or color. These conventional approaches are complex, susceptible, and time consuming due to the visual complexities of skin lesions. Physical inspection demands a proficient specialist for accurate detection of the lesion. However, the reports for a particular lesion varies for different dermatologist due to inter observation variation. Thus, the accuracy of lesion detection ranges between 74% and 85% when diagnosed by an untrained dermatologist []. Thereafter, the process of manual diagnosis was replaced with radioscopy, immunotherapy and invasive methods such as anatomical pathology, which is a surgical incision for detection of malignant tumor wherein skin tissues are incised and examined by a pathologist. Invasive methods are not preferred to be practiced by clinical patients as these are painful and might take 3–12 weeks. Thus, with passing years, non-invasive methods have gained significance, and modern economical equipment such as Epiluminescence microscopy and dermoscopy are employed more often which produces superior accuracy over previous methods []. Various in state-of-the-art (SOTA) noninvasive diagnosis techniques have been described such as digital photography, dermatoscopy, multispectral imaging, optical coherence tomography (OCT), magnetic resonance imaging (MRI), confocal laser scanning-microscopy, laser-based systems, ultrasound, conventional microscope, and multiphoton tomography. However, dermatoscopy is much efficient device for lesion detection. Dermoscopic devices are used to magnify and illuminate the images of effected skin region, thereby increasing the clarity of the diagnosed pigment and reducing reflection on the skin surface. Diagnosis performances are improved significantly with the use of these modern dermoscopy devices.
Visual inspection is standardized and modernized with the help of contemporary methods and algorithms such as CASH (color, architecture, symmetry, homogeneity), ABCDE rule (asymmetry, border, color, diameter, evolving), Menzies method, and Seven-point checklist [,,,]. Although dermatologists use modern dermoscopy devices and visual inspection methods are unable to gain high accuracy marks due to low contrast images between skin and lesion which makes it difficult to differentiate a melanoma from non-melanoma skin lesion. In addition, various skin conditions such as hair, blood vessels, skin tone, and the presence of air bubbles and ruler marks in the dermoscopy image makes it challenging for a dermatologist to detect the lesion accurately. Thus, the processes of identification of a lesion can become slow and time consuming for a dermatologist. Therefore, our predominant goal should be the development of a swift, efficient, and accurate method for diagnosis of malignant lesion in its early stage. Thus, a noninvasive computer aided diagnosis (CAD) system must be considered for regular practice, which will not only relieve the patients from complication of invasive pathology but also increase the accuracy and speed of diagnosis []. Advancement in machine learning algorithms and segmentation techniques has ameliorated CAD systems and classification of deadly skin cancerous lesion over past decade. CAD systems have shifted from workstations and desktops to smart phones and enables the pathologist to detect malignant lesion which are not visible to human eyes [].
Banerjee et al. has proposed a deep learning method for digital diagnosis of melanoma where the lesion is segmented using neutrosophic logic and convolutional neural network (CNN) is used for classification []. The CNN based architecture is not efficient as it primarily focuses on local features within repetitive field of each convolutional layer, therefore it does not capture enough contextual information. Moreover, the CNN models are sensitive to variations such as the presence of hair follicle or other artifacts along with noise in the image. A fully deep learning-based CAD method is employed by Alenezi et al., where VGG net based fully connected network (FCN) is used for segmentation of lesion and a series of convolutional, pooling and fully connected layers are used to classification []. However, it has some limitation, FCN models down samples the input image multiple times to extract high-level features and generate segmentation maps. This down sampling reduces the spatial resolution of the segmentation output, making it challenging to accurately capture fine details and boundaries of small melanoma lesions. The loss of spatial information can affect the segmentation accuracy, especially when dealing with small or intricate lesions. Khan et al. has used an intelligent fusion-based method for smart healthcare with 30 CNN layers []. Encapsulation of series of CNN layers tends to overfit the model and effect the speed of overall system thereby making it ineffective to be used as real-world application. InceptionNet is being employed by Gajera et al. extraction of patch based local features []. The InceptionNet architecture relies on convolutional operations of varying kernel sizes to capture information at different scales. However, it struggles to capture global contextual information and long-range dependencies that are important in melanoma classification. The lack of explicit modelling of spatial relationships and context does limit its ability to accurately classify melanoma lesions based on complex patterns and structures. Therefore, a robust and accurate deep learning-based CAD system is the need of the hour, which can not only capture the global contextual information but also able to classify the lesion without overfitting the model.
This research paper utilizes a computer-vision approach to diagnose malignant lesions. The process involves three sequential steps: pre-processing of the lesion, segmentation of the pre-processed lesion image, and classification of the lesion. The algorithm’s flow is visually represented in Figure 1 through a flowchart. In the initial pre-processing step, the image undergoes hair and artifact removal using the dull razor method, followed by histogram equalization. The novel segmentation algorithm proposed in the paper employs dynamic threshold calculation using standard deviation techniques and L-R fuzzy logic. For classification, a deep convolutional neural network called YOLO is utilized, which outperforms other CNN models []. Although the research relies on conventional methods of CAD system for melanoma lesion identification, its originality lies in the integration of modern aspects with well-established algorithms in malignant diagnosis. The proposed method offers two significant advantages: (i) the utilization of a publicly available deep learning-based neural network called YOLO, which accelerates the classification process and reduces the false detection error rate; and (ii) the introduction of a segmentation method based on standard deviation, which roughly separates the affected region from the surrounding skin. This algorithm operates independently on all three colour channels, and an ensemble logic is employed to combine the segmented marks. To further enhance the segmentation results, a second iterative procedure incorporating L-Function fuzzy number and improved defuzzification technique is introduced. The threshold series is adjusted using fuzzy theory to achieve better results compared to the first iteration. The L-Function fuzzy number is used to handle the indistinctness aspect, and an adapted threshold assessment rate is employed. These valuable algorithms significantly contribute to the detection of melanoma lesions [,,]. The remaining sections of the paper are organized as follows: the next section provides a brief introduction to fuzzy logic in the context of the research, followed by a description of the dataset and the implementation of YOLO. Then, the proposed method is presented and supported by the results and analysis sections. Our contributions can be summarised as follows:
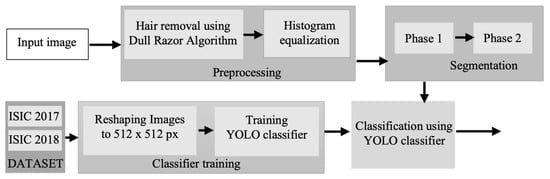
Figure 1.
Flowchart of the proposed method for digital diagnosis of melanoma.
- We have introduced a two-phase segmentation by using a novel method of fuzzy logic where triangular fuzzy number is used to calculate the threshold of the lesion.
- We have modified the architecture of YOLO to achieve higher accuracy for classification of melanoma lesion. We have increased the depth of YOLO architecture by adding more residual network to allow the model to learn more complex features. We have also introduced skip connections from different layers to combine multi-scale information, this helps the model to capture local and global features which enhances the classification accuracy.
- We have demonstrated the effectiveness of the proposed pipeline for classification of lesion using publicly available datasets (PH2, ISIC 2017, and ISIC 2018) against the state-of-the-art algorithm.
2. Preliminaries
In this section, we delve into the introduction of fuzzy logic, covering topics such as fuzzy sets, fuzzy numbers, and triangular fuzzy numbers. The section provides a concise overview of fuzzy logic, offering both mathematical and graphical explanations to help readers grasp the concept. An interval U is designated between , where R is the set of real number and and usually denoted the left and right range of the interval respectively. A fuzzy set is defined as which is usually presented by this ordered pair , here is an element of the set and
A fuzzy number is defined where R denotes the set of real number if
(i) is normal. that is, exists such that
(ii)
A triangular fuzzy number should gratify the following situations:
(1) is a continuous function which is in the interval [0,1]
(2) is strictly increasing and continuous function on the intervals .
(3) is strictly decreasing and continuous function on the intervals .
A linear triangular fuzzy number denoted as can be represented with the following definition of its membership function []. Figure 2 shows a graphical representation of linear TFN along the x and y-axis.
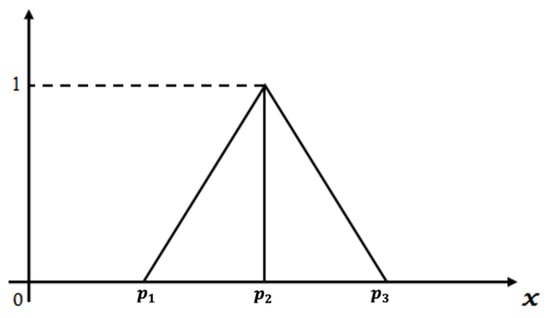
Figure 2.
Graphical representation of linear triangular fuzzy number.
Parametric form of TFN or -cut is defined as
where the decreasing function with respect to is and increasing function with respect to is .
3. Proposed Method
This section is divided into three subheadings (i.e., preprocessing of the lesion, segmentation of lesion, and classification of the suspected lesion). A novel method for each subcategory of computer aided diagnosis is noted below.
3.1. Preprocessing
The initial stage of the CAD system involves pre-processing the lesion image, which encompasses the elimination of noise and other artifacts. First phase includes intensity adjustment, morphological operation, binarization, color gray-scaling and data augmentation. More specifically, this stage deals with the removal of noises and other artefacts and enhancement of the raw images by adjusting contrast and histogram curves []. This research paper proposes three notable steps for the pre-processing of dermoscopic images. In the first step, the Dull razor algorithm [] is utilized to remove digital hair from the lesion image. A gray-morphological operation is employed to identify the hair’s location in the dermoscopic image, which is then validated by removing adjacent pixels based on the hair follicle’s thickness and length. To restore the affected pixels, a bilinear interpolation algorithm is used, followed by the application of an adaptive-median filter to smoothen them. In the second step, histogram equalization is employed to adjust the image’s contrast and brightness, thereby enhancing the overall quality of the dermoscopic image. The sequential outputs of these steps are depicted in Figure 3. Figure 3a represents the input dermoscopic image, which undergoes the hair removal algorithm to produce Figure 3b. Subsequently, histogram equalization is applied to improve the image’s quality, resulting in well-defined lesion features, as shown in Figure 3c.
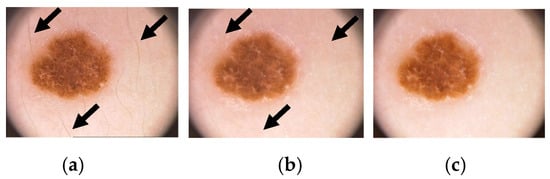
Figure 3.
Illustrates the pre-processing of a skin lesion, showcasing the following stages: (a) the original dermoscopic image (arrows shows hairs on skin lesion), (b) the removal of hair using the Dull Razor algorithm (arrows reflect to same points where hairs are removed digitally), and (c) the image enhancement achieved through histogram equalization (the contrast of the lesion is increased and the outer skin is brightened in this enhanced image such that a visual distinction between skin and malignant lesion can be drawn).
3.2. Segmentation
Segmentation involves identifying the boundary of a lesion from the pre-processed dermoscopic image. This step aims to digitally dissect the affected area from the surrounding regular skin with a high level of correlation and focus on the region-of-interest (RoI). There are seven categories of segmentation methods, which include thresholding, clustering, active contours, quantization, pattern clustering, merging threshold, and fuzzy methods. However, literature suggests that conventional segmentation methods such as region enhancing, thresholding, and clustering face challenges when processing complex lesion images due to their computational and time complexity, leading to algorithmic failures. To address this limitation, many researchers have turned to segmentation methods based on deconvolutional networks, fuzzy methods, saliency, and k-mean algorithms [,]. Juanjuan et al. have employed GAN based method for segmentation of CT scan image for classification COVID-19 []. Chen et al. have integrated feature pyramid with U-Net++ model for automatic segmentation of coronary arteries invasive coronary angiography []. The proposed method described here adopts a segmentation approach that involves two iterations. To reduce the computational burden, a sub-matrix window of size 5 × 5 is utilized for processing.
Phase-1
Step 1: The input image can be expressed as a matrix of size (I × J), where the location of each pixel can be identified as:
Step 2: The process is executed on the R, G and B planes and the instance of the red plane ri,j be the intensity value of the pixel location. Concurrently a (I × J) binary flag image is created taking all of the values of the pixels fr(i, j) = 0.
Step 3: A 5 × 5 window will be created taking center pixel taking where
Step 4: For a specific window having center the pixel values are rk−2,l−2; …; rk,l; … rk+2,l+2;
Step 5: If (|rk−2,l−2 − rk,l| ≥ T) where T = σ then fr(k−2,l−2) = 1 else fr(k−2,l−2) = 0, where, selected region’s standard deviation is represented as σ.
Step 6: Thereafter, If (|rk+2,l+2 − rk,l| ≥ T) then fr(k+2,l+2) = 1 else fr(k+2,l+2) = 0
Step 7: By following this procedure, updated binary flag images will be generated from the Green (fg) and Blue (fb) planes. These flag images will be used to create the final binary flag image (ff) using the following operation.
Step 8: If the condition (fr(a,b) && fg(a,b) && fb(a,b)) == 1) is satisfied, then ff(a,b) will be set to 1, indicating the presence of the segmented region in the pre-processed image. The border line of the segmented region can be identified by performing the following operation: If ff(a,b) = 0, mark the region; otherwise, continue the process. Here, a = (1, 2, …, I) and b = (1, 2, …, J).
Figure 4 illustrates the visual depiction of the initial stage of segmentation for an example image. The pre-processed image undergoes segmentation using dynamic threshold calculation based on standard deviation methods and ensemble logics. This process generates a binary mask (depicted in Figure 4b) and identifies the segmented region of the lesion (shown in Figure 4a) through the utilization of the algorithm.
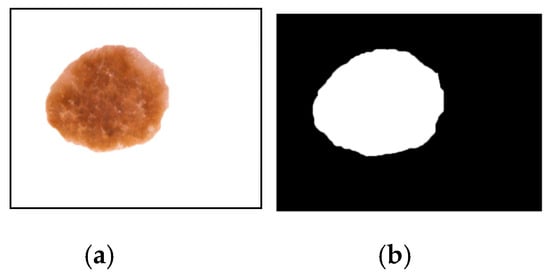
Figure 4.
The segmentation outcome following the initial iteration is depicted as follows: (a) The segmented output of the lesion, and (b) the segmented mask representing the lesion.
Phase-2
Once we have evaluated the affected area, we proceed to perform additional accurate image segmentation. Initially, we choose a threshold for phase-1 assessment based on the assumed ground truth. However, we observe that some non-affected regions are still included in the image segmentation results. In order to reduce this, we introduce an additional threshold assessment with a value lower than T, which defines the completely affected region. The following question remains, however: how much of the affected region lies in between the phase-1 and phase-2 threshold assessment rate? It is difficult to determine what should be the definite threshold assessment rate such that we can address the affected section and dispose of the highest non-affected region. To address the inherent uncertainty and imprecision in human perception, we introduced the concept of L-Function fuzzy number during the second iterative step of the image segmentation technique. By incorporating the L-Function fuzzy number, we aimed to tackle the uncertainty and improve the overall outcome compared to the first iteration. Additionally, we developed a defuzzification scheme specifically for the L-Function fuzzy number to convert it into a crisp value. This defuzzified result serves as the threshold assessment rate for the second phase of the segmentation process.
A fuzzy number is said to be an L-R type fuzzy number if:
Here, L is for left and R for right reference functions. are called left and right spreads, respectively.
A fuzzy number is said to be an L- type fuzzy number if:
Figure 5 illustrates the representation of the L-function fuzzy number. On the other hand, Figure 6a,b depict the left and right regions respectively during the process of defuzzification.
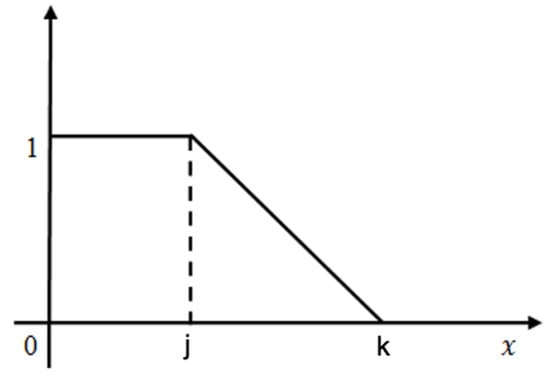
Figure 5.
The graphical depiction of the L-Function fuzzy number is illustrated.
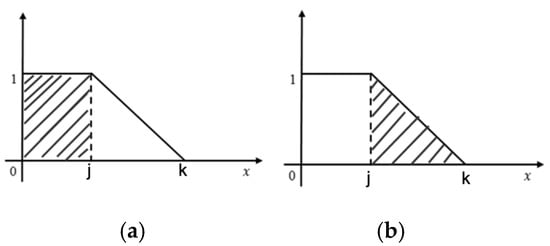
Figure 6.
(a): Left Zone (b): Right Zone.
De-fuzzification of L-Fuzzy Number: A linear L-fuzzy number can be transformed into a crisp number using the area approximation system. The mathematical formulation is,
where, AL (j) = Area of left Zone (Rectangular shape (Figure 6a))
AR (j) = Area of Right Zone (Triangular area (Figure 6b))
Thus, Defuzzification value:
Figure 7 showcases the outcome of the second sub-stage of segmentation, along with its corresponding mask. The mask in Figure 7 demonstrates a more suitable and precise representation compared to the output of the first sub-stage of segmentation.
Figure 7.
The segmentation outcome following the second phase is presented in (a) as the segmented output of the lesion, and in (b) as the segmented mask of the lesion.
3.3. Classification
3.3.1. YOLO
In this rapidly advancing technological era, the field of medical vision has experienced significant growth, leading to the development of impressive and capable strategies to handle various complexities. Object detection algorithms in computer vision encompass innovative ideas for identifying and locating multiple targets within an image []. On the other hand, classification algorithms focus on determining the presence of a specific subject in an image. These classification algorithms employ CNN classifiers passed through predefined boxes, effectively removing the need for complex processes and enhancing the performance of the image analysis. In contrast, object detection algorithms employ a more advanced technique involving deep learning, which simplifies the process by directly conceiving the boxes encompassing the entire image rather than focusing on individual segments. As a result, this algorithm provides faster processing compared to the previous approach. YOLO [] is an exceptional and ground-breaking approach in the field of computer vision, specifically designed for real-time object detection. Researchers have prioritized passing classifiers over the entire image instead of fragmented sections, enabling YOLO to process data at a remarkable rate of 45 video frames per second. YOLO incorporates CNN layers with collapsing and merging techniques, yielding unparalleled speed in object detection. This is achieved using regression and neural network techniques during the initial learning phase. The YOLO algorithm’s effectiveness is further enhanced by leveraging the knowledge of diagnostic tensors, which can be expressed mathematically as an equation.
In this context, (M × M) refers to the non-overlapping grid cells obtained by dividing the specific image. The bounding boxes, denoted as B, rely entirely on the grid cells for their predictions and calculation of confidence scores. The confidence score is represented by C. By examining the confidence score, we can determine the presence or absence of an object within the bounding box. If there is no prior existence of the object, the confidence score will be zero. This can be expressed as follows:
C = Presence (Object) ∗ IoUgroundtruthpredicted
According to the Google-Net YOLO architecture, there is a convolution layer with a total of 24 counts, resulting in tensors of size (7, 7, 1024). These tensors serve as the final output shape. Following this, there is a fully connected layer with two parameters, producing 7 × 7 × 30 parameters, which are reshaped as (7, 7, 30). This indicates that there are two boundary boxes for each location. The workflow of YOLO is summarized in Figure 8, where an input image of size M × M is depicted in Figure 8a. Bounding boxes are generated in Figure 8b. Probabilistic mapping of classes is shown in Figure 8c, and the final detection of the lesion is presented in Figure 8d.
Figure 8.
The classification process performed by YOLO is depicted using a skin lesion image, where (a) represents the input grid of size M × M. In (b), bounding boxes are generated based on the confidence score. (c) illustrates the mapping of class probabilities, and (d) shows the detection of the lesion.
To determine the arrangement of numerous bounding boxes within each grid cell, YOLO utilizes the Intersection over Union (IoU) metric to identify the highest value. The loss function in YOLO encompasses the classification loss, localization loss, and confidence loss, calculated using the sum squared error technique. YOLO also prioritizes spatial diversity to minimize false positives during its operation. The YOLO algorithm has undergone several versions, including YOLO v1, YOLO v2, and YOLO v3, each addressing limitations from previous iterations and offering effective solutions. Extensive analysis has led to the realization that class and object confidence estimations should be derived from logistic regression, a crucial innovation introduced in YOLO v3 that was absent in earlier versions. Furthermore, the practice of selecting the group of Melanoma (classes) with the highest-class scores, a key step in previous versions, has been replaced with multilabel classifications in YOLO v3. Notably, the latest version, YOLO v3, achieves exceptional speed and performance, setting a benchmark with a COCO mAP 50 score that surpasses previous versions [].
In YOLO, the input image is divided into a grid of cells. Each cell is responsible for predicting bounding boxes and class probabilities for objects within its boundaries. Prior to training, anchor boxes are defined to capture the various aspect ratios and sizes of objects. The anchor boxes are assigned to cells based on their overlap with ground-truth objects during training. For each grid cell, YOLO predicts multiple bounding boxes along with their associated class probabilities. Each bounding box consists of coordinates (x, y, width, height) relative to the grid cell. The class probabilities represent the likelihood of the object belonging to different predefined classes (e.g., melanoma, non-melanoma). YOLO typically uses a deep convolutional neural network (CNN) as its backbone architecture, such as Darknet or Darknet-53. The CNN processes the input image and extracts a feature map that is shared across all of the grid cells. YOLO uses a combination of localization loss and classification loss to train the network. The localization loss measures the accuracy of bounding box predictions, while the classification loss measures the accuracy of class probabilities. The loss function is designed to penalize errors in both bounding box coordinates and class predictions. After prediction, YOLO applies non-maximum suppression (NMS) to eliminate duplicate and overlapping bounding box detections. It selects the most confident bounding boxes based on their class probabilities and removes redundant detections that have significant overlap.
To apply YOLO for melanoma lesion detection, the algorithm needs to be trained on a dataset of melanoma and non-melanoma skin lesion images. The training process involves annotating the images with bounding box coordinates and corresponding class labels. The algorithm learns to detect and classify melanoma lesions based on the provided training data. During inference, the trained YOLO model takes an input image, passes it through the CNN backbone to obtain a feature map, and then applies the prediction process described above. It outputs bounding boxes and class probabilities for potential melanoma lesions in the image. NMS is subsequently applied to remove duplicate detections and retain the most confident and non-overlapping predictions.
YOLO is known for its speed and efficiency, as it avoids the need for exhaustive sliding window searches. The grid-based approach of YOLO allows for parallel processing and significantly reduces the computational complexity compared to sliding window approaches. This allows YOLO to capture global context and dependencies among objects, contributing to accurate predictions. YOLO is highly efficient and fast compared to CNN-based models. YOLO considers the entire image while making predictions for each grid cell. This global context enables YOLO to capture dependencies and relationships between objects and their surroundings. In the context of melanoma classification, global context can provide valuable information about the lesion’s spatial relationship with other skin regions, aiding in accurate classification. Since YOLO optimizes both the localization and classification losses simultaneously, it requires fewer iterations to converge. This can be advantageous when working with limited training data or resource constraints.
We have modified the YOLO architecture by increasing the depth of the YOLO architecture by adding more convolutional layers and residual connections. This allows the model to learn more complex features and potentially improve its accuracy. Enhance the feature fusion mechanism in YOLO. We have introduced additional feature concatenation from different layers to combine multi-scale information. This helps the model capture both local and global context, leading to better classification. We have utilized binary cross-entropy loss function for melanoma classification.
3.3.2. Training and Implementation
In the proposed algorithm, all dermoscopic images with varying resolutions are resized to 512 × 512 pixels before undergoing the training process. This resizing step is performed to reduce computational usage. The YOLO classifier is trained using the reshaped dataset with the following parameters: a batch size of 64, a subdivision of 16, a decay rate of 0.0005, a momentum of 0.9, a learning rate of 0.001, and 50,000 epochs. The weights of the classifier are saved after every 10,000th epoch to ensure efficient location detection of dermoscopic lesions. The trained classifier is then utilized to test the proposed algorithm, where the output from the last sub-stage of segmentation serves as input for the classifier to detect the lesion. Figure 9 demonstrates the detection process of the classifier, which identifies malignant lesions and forms bounding boxes around them, enabling the precise location detection of melanoma lesions.
Figure 9.
Classification of lesion using YOLO.
During the accuracy testing of the classifier, the dermoscopic image undergoes a series of pre-processing and segmentation steps, which enhance the performance of the classifier. This process is further detailed in the results and analysis section. It is important to note that the classifier is trained by solely resizing the image to 512 × 512 pixels while modifying the last layer of the YOLO classifier.
4. Results and Discussion
4.1. Dataset
Medical image processing has emerged as a crucial domain for research, particularly in the field of diagnosis of malignant lesion. The collection of relevant lesion images and training the classifier with suitable dataset is a perplexing task. The proposed algorithm was trained, tested and evaluated on three most commonly used, publicly available dataset: PH2 [], International Skin Imaging Collaboration (ISIC) 2017 [] and ISIC 2018 [] datasets. Both the ISIC datasets are used for training the classifier and testing the proposed algorithm, whereas the PH2 datasets are only used for testing and evaluating the proposed method, thereby intending it as a holdout dataset for our algorithm. These images are composed by specialized dermatologists after performing a series of dermoscopic analysis on dots, pigmented region, and streaks of the lesion image. These publicly available datasets were developed with the aim to aid researcher for their specialized research on analysis of skin lesion, classification and segmentation. The PH2 datasets are published from dermatology department of Pedro-Hispano hospital. A sum total of 200 dermoscopic lesion images are present in this dataset, with 40 instances of melanoma lesion and remaining 160 instances of atypical nevi and normal nevi divided equally into two halves. These dermoscopic images are of 768 × 560 pixels in resolution, captured with 20× magnification. Whereas a dermoscopic image resolution of ISIC 2017 dataset rages from 540 × 722 pixels to 4499 × 6748 pixels. A total number of 2000 RGB image of 8-bit are used for training the classifier and remaining 600 and 150 dermoscopic lesion images for testing and validation respectively. ISIC 2018 dataset embodies 10,015 lesion images, where 1320 images are assigned for testing and 8695 lesion images for training. Grouped dermoscopic images are of 24-bit RGB and are sourced from ISIC library and HAM10000 dataset. These datasets are annotated by expert dermatologist and have ground truth values for classification and segmentation which make it favorable for research. Table 1 provides an overall tabulated figure of each data used for training, testing, and validation.

Table 1.
List of Skin Lesion Datasets used in this paper.
4.2. Performance Evaluation Metrics
The proposed method has been evaluated in two phases; First, detection performance of the location of the lesion using sensitivity, specificity score and IoU metric are presented. The assertion of the recognised location is possible only if the score is more than 80% for the IoU. Secondly, segmentation performance is investigated based on pre-defined metrics to assess the functionality of the proposed methods. The measures used for validation can be described as follows:
- Sensitivity (Se)—The measure of accurate segment lesions.
- Specificity (Sp)—The segmented ration for the non-lesion areas.
- Dice Coefficient (Dc)—This measure is used for the purpose of quantifying the segmented lesions along with explaining the ground truth connection.
- Jaccard Index (JI)—The Jaccard Index is a metric used to measure the overlap or similarity between the obtained segmentation results and the ground truth mask.
- Accuracy (Ac)—The overall performance of pixel-wise segmentation. It quantifies how accurately the segmented pixels correspond to the ground truth labels.
The evaluation metrics mentioned above could be formulated in an equation for calculation purpose, which is as below:
True Positive (TP) is considered by a lesion pixel in the image if it was detected and segmented correctly. False Negative (FN) is referred when it is not detected correctly. The True Negative (TN) is referred when a non-lesion pixel is predicted as lesion one. Finally, if the non-lesion pixel is been detected correctly as non-lesion than it is regarded as False Positive (FP).
4.3. Analysis of Results
This section focuses on evaluating the performance of the proposed algorithm in the research paper. The system configuration used for all operations and computations consists of a Core-i7 processor, 16 GB RAM, and the Ubuntu 18.10 operating system. Python and OpenCV framework are employed for image processing, forming the basis of the entire system development. The performance analysis of the algorithm is based on four key parameters: Competency of Lesion Location Detection, Segmentation Performance, Accurateness of Feature Extraction, and Computational Time. Three publicly available datasets, namely PH2, ISIC 2017, and ISIC 2018, are utilized in the detection and segmentation processes.
To determine the effectiveness of lesion location detection, three parameters are considered: sensitivity, specificity, and intersection over union (IoU). The PH2 dataset achieves a sensitivity score of 95%, specificity score of 96.25%, and IoU value of 94%. The ISIC 2017 and ISIC 2018 datasets exhibit notably high sensitivity and specificity scores. Table 2 provides an analysis of detection using YOLO v3. A high IoU score indicates accurate lesion location detection, while elevated sensitivity and specificity scores signify precise identification of melanoma and non-melanoma lesions, respectively.
Table 2.
The performance evaluation of lesion detection using the YOLO algorithm.
After pre-processing the dermoscopic images, the segmentation process is applied to each dataset. The performance of segmentation is assessed using the metrics, namely accuracy, specificity, sensitivity, Jaccard score, and Dice index score. It is important to note that our approach involves two phases for segmentation. In the first phase, the primary objective is to select a significant area of the lesion mask to ensure that no features of melanoma are lost during this process. Subsequently, in the second phase, a fuzzy-based probabilistic thresholding method is employed to generate a more precise and accurate segmented mask, resulting in improved segmentation outcomes. Table 3 provides an overview of the results obtained from the first phase of our proposed segmentation method, while Table 4 showcases the outcomes of the second sub-stage. Figure 10 visually illustrates the steps involved in our approach. The evaluation metric scores generally indicate higher performance in the second phase, as the LR-based fuzzy logic allows for more precise and effective segmentation of the lesion. The average accuracy score after the first sub-stage of segmentation is around 95%, which significantly increases to an average of approximately 96% after the second sub-stage. This notable improvement clearly demonstrates the significance of employing L-R fuzzy logic and fuzzy thresholding in the segmentation process.
Table 3.
Segmentation results of first phase.
Table 4.
Segmentation results of second phase.
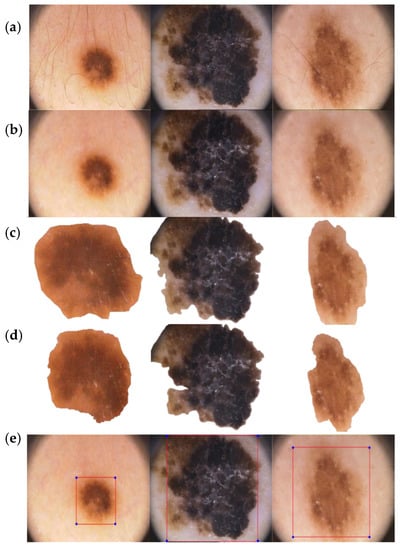
Figure 10.
(a) Initial image input. (b) Lesion after undergoing hair removal and image enhancement pre-processing. (c) Result of segmentation after the first phase. (d) Result of segmentation after the second phase. (e) Detection and bounding box formation of melanoma lesion using the YOLO classifier.
The proposed algorithm has achieved outstanding results compared to existing models through proper dataset collection, preprocessing steps, and iterative segmentation methods. In a comparison with similar datasets, our algorithm consistently demonstrates superior performance. A detailed analysis of the projected algorithm based on metrics such as Accuracy (Acc), Sensitivity (Sen), Specificity (Spe), Jaccard score (Jac), and Dice index score (Dic) for PH2, ISIC 2017, and ISIC 2018 datasets is presented in Table 5, Table 6 and Table 7, respectively. The highest and second highest scores are highlighted as bold and underlined text so that the tables are more readable. Our proposed method achieves the highest sensitivity and specificity score when compared to recent published works. The segmentation results for PH2, ISIC 2017, and ISIC 2018 datasets exhibit better accuracy values than existing approaches. This can be attributed to the highly specialized pre-processing steps and novel segmentation methods employed, which contribute to the exceptional evaluation metric scores.
The proposed work is compared with several inspiring and successful segmentation methods for the PH2 dataset, including multi-staged fully convolutional network (FCN) with parallel integration (mFCN-PI) [], semi-automated grab cut algorithms [], semantic segmentation techniques [], and synchronized segmentation with classification methods using a bootstrapping convolutional neural network model []. Ahmed et al. have integrated MaskRCNN and RetinaNet for the segmentation of lesions []. However, our proposed method achieves an accuracy score of 98.50%, surpassing most of the well-known approaches. Additionally, for the remaining four evaluation parameters, the proposed method achieves the highest scores of 97.50% for sensitivity, 98.75% for specificity, 92.86% for Jaccard score, and 96.30% for Dice score.
For the ISIC 2017 dataset, the proposed algorithm is compared with several models including deep convolutional deconvolution neural network (CDNN) [], fully convolutional network (FCN) [], a fully convolutional-residual network (FCRN) [], segmentation by assembling crowdsourced results of ISIC 2017 challenge [], transfer learning with pre-trained VGG16 or ResNet50 [], a fully convolutional network (FCN) architecture with ResNet18 and AlexNet in encoder and three deconvolution layers in decoder part [], and FrCN model for simultaneous segmentation and classification []. Among these, the accuracy performance of Hasan et al. [] is the second-best in the table with a score of 95.3%, while our proposed method achieves an accuracy score of 96.17%.
In the case of ISIC 2018 dataset, the proposed method is compared with several works including Encoder-Decoder with pyramid pooling modules [], DilatedSkinNet architecture [], encoder-decoder network with CRF [], and Encoder-decoder algorithm with Deeplab and PSPNet []. The comparative study reveals that the proposed algorithm achieves the highest scores for accuracy, Jaccard index, and dice coefficient, which are 95.9%, 85.00%, and 91.9% respectively. The specificity score for the ISIC 2018 dataset is 97.4%, which is similar to that of Shahin et al. []. Our novel method for segmentation of lesion using fuzzy logic proved to be effective and quick when compared with other deep learning method which employs complex architecture of ResNet34, deep convolutional neural network (DCNN), autoencoders, and fully convolutional neural networks (FRCN).
Table 5.
Comparison of the segmentation results obtained from the proposed method with a recent study conducted on the PH2 dataset.
Table 5.
Comparison of the segmentation results obtained from the proposed method with a recent study conducted on the PH2 dataset.
| SOTA | Year | Ac (%) | Se (%) | Sp (%) | JI (%) | Dc (%) |
|---|---|---|---|---|---|---|
| Proposed method | 2021 | 98.50 | 97.50 | 98.75 | 92.86 | 96.30 |
| Ahmed [] | 2023 | ----- | 93.20 | 96.10 | 92.90 | 94.3 |
| Hasan et al. [] | 2020 | 98.70 | 92.90 | 96.90 | ----- | ----- |
| Xie et al. [] | 2020 | 96.50 | 96.70 | 94.60 | 89.40 | 94.20 |
| Unver et. al. [] | 2019 | 92.99 | 83.63 | 94.02 | 79.40 | 88.13 |
| Bi et al. [] | 2019 | 95.03 | 96.23 | 94.52 | 85.90 | 92.10 |
Table 6.
Comparison of the segmentation results obtained from the proposed method with a recent study conducted on the ISIC 2017 dataset.
Table 6.
Comparison of the segmentation results obtained from the proposed method with a recent study conducted on the ISIC 2017 dataset.
| SOTA | Year | Ac (%) | Se (%) | Sp (%) | JI (%) | Dc (%) |
|---|---|---|---|---|---|---|
| Proposed method | 2021 | 96.17 | 91.88 | 98.26 | 88.73 | 94.03 |
| Barin et al. [] | 2022 | 93.47 | 79.25 | 97.8 | 77.54 | 87.35 |
| Hasan et al. [] | 2020 | 95.3 | 87.5 | 85.5 | ---- | ---- |
| Al-Masni et al. [] | 2020 | 81.57 | 75.67 | 80.62 | ---- | ---- |
| Soudani et al. [] | 2019 | 94.95 | 85.87 | 95.66 | 78.92 | 88.12 |
| Li et al. [] | 2018 | 93.2 | 82 | 97.8 | 76.2 | 84.7 |
| Sarker et al. [] | 2018 | 93.6 | 81.6 | 98.3 | 78.2 | 87.8 |
| Yuan et al. [] | 2017 | 93.4 | 82.5 | 97.5 | 76.5 | 84.9 |
| Bi et al. [] | 2017 | 93.4 | 80.2 | 98.5 | 76.0 | 84.4 |
Table 7.
Comparison of the segmentation results obtained from the proposed method with a recent study conducted on the ISIC 2018 dataset.
Table 7.
Comparison of the segmentation results obtained from the proposed method with a recent study conducted on the ISIC 2018 dataset.
| SOTA | Year | Ac (%) | Se (%) | Sp (%) | JI (%) | Dc (%) |
|---|---|---|---|---|---|---|
| Proposed method | 2021 | 95.9 | 91.6 | 97.4 | 85.0 | 91.9 |
| Ahmed [] | 2023 | ----- | 91.6 | 97.8 | 91.4 | 90.7 |
| Barin et al. [] | 2022 | 94.65 | 95.85 | 87.86 | 84.17 | 91.40 |
| Shahin et al. [] | 2019 | ----- | 90.2 | 97.4 | 83.7 | 90.3 |
| Ji Y et al. [] | 2018 | 94.3 | 91.8 | 96.4 | 83.4 | 90.0 |
| Koohbanan NA et al. [] | 2018 | 94.5 | 94.0 | 94.2 | 87.7 | 90.3 |
| Qian C et al. [] | 2018 | 94.2 | 90.6 | 96.3 | 83.8 | 89.8 |
The segmentation of melanoma lesion is difficult due to its asymmetrical shape, irregular border, and varied colour. We have not employed deep learning models for the segmentation of lesions as they are computationally expensive and require significant computational resources, whereas threshold based fuzzy logic for segmentation of lesion is computationally lightweight and is thus more efficient for real-time or resource-constrained environments. Moreover, fuzzy logic-based methods can handle noise and uncertainties in the image data effectively. By incorporating fuzzy sets and membership functions, we can account for variations and imperfections in the input image. Deep learning models, on the other hand, are more sensitive to noisy or imperfect input data.
We compared our proposed recognition algorithm with several well-established classifiers, namely decision tree, Support Vector Machine (SVM), k-nearest neighbor (KNN), and YOLO v3. The comparison between our method using YOLO and these classifiers was conducted using various metrics. In addition to metrics such as sensitivity, specificity, precision, accuracy, and area under curve (AUC), we also considered the time taken (in seconds) as a measure to assess the speed of our method. For the same set of datasets, we employed different variants of SVM, including Lagrangian Support Vector Machine (LSVM), Consensus Support Vector Machine (CSVM), Quantum Support Vector Machine (QSVM), and Medium Gaussian Support Vector Machine (MGSVM), to classify malignant lesions. Similarly, we utilized various methods of KNN, such as Fuzzy k-nearest neighbor (FKNN), Modified k-nearest neighbor (MKNN), Weighted k-nearest neighbor (WKNN), Cosine KNN, and Cubic KNN. Despite using similar datasets for the classification of melanoma lesions, our YOLO classifier outperformed the others in terms of accuracy and AUC value. Furthermore, it accomplished the classification task in just 7.01 s. Table 8 presents a tabular representation of the different classifiers, along with the various methods used and the evaluation parameters.
Table 8.
Contrast between the modified YOLO classifier and other widely recognized classifiers.
We have benchmarked the proposed method with classical method such as Tree, SVM, and KNN for classification of melanoma lesion. The pre-processed and segmented lesion images are passed through to each classifier for classification of lesion. We have employed classical algorithms which can handle noisy data and outliers. As is known, decision trees can handle noisy features by creating multiple splits and finding alternative paths. Similarly, SVMs can also handle noisy data by using a soft-margin approach that allows for some misclassification. This robustness is advantageous for melanoma detection as the data quality is noisy and irregular. On the other hand, deep learning models are sensitive to noisy data. Moreover, the classical methods are interpretable and valuable for medical applications. Additionally, the availability of training limited data has obligated us to employ classical methods as they perform well will limited data without a fear of exploding or vanishing gradient.
The comparison among various classifiers and our suggested method has clearly demonstrated improved efficiency and reduced detection time. As shown in Table 8, the proposed method achieved an accuracy of 98.17% with a sensitivity of 95.43% and specificity of 99.50%. The detection time for melanoma using our method was 7.01 s, which is significantly lower compared to most classifiers. Moreover, the implementation of automatic hair removal and image enhancement through pre-processing models has contributed to the enhanced accuracy of our proposed method.
The importance of segmentation is demonstrated in Table 9 and Table 10, where the accuracy, sensitivity, and specificity values are higher when the proposed segmentation is applied before the classification of lesions. The advantage of our pre-processing (PP) method is shown in Table 11, which lights the accuracy, sensitivity, and specificity of classification of lesion. The table clearly shows the importance of digitally removal of artefacts from the images and enhancement of images. This highlights the significance and advantage of the proposed pre-processing and segmentation steps. When segmentation and pre-processing techniques are employed prior to classification, the YOLO classification achieves significantly higher performance metrics. This is attributed to the enhanced image quality of the lesions and the exposure of their features, enabling more accurate detection.
Table 9.
Performance analysis of detection of lesion using YOLO without proposed segmentation.
Table 10.
Performance analysis of detection of lesion using YOLO with proposed segmentation.
Table 11.
Performance analysis of detection of lesion with/without proposed pre-processing method.
The proposed pipeline outperforms the state of art method for segmentation and classification of melanoma lesion. However, we have trained and tested our model on limited dataset and moreover an enhanced algorithm for pre-processing should be proposed to deal with removal of digital artefacts more effectively. The availability of limited data from ISIC 2017 and 2018 dataset have limited the training set, and we aim to use generative adversarial networks (GAN) for the task of high-quality synthetic data generation (which will increase the size of dataset and thereby increase the accuracy of classification). We also aim add a clinical feature extraction method (based on principles of ABCD rule) which will help decrease the specificity and assure the medical practitioners to use our algorithm.
5. Conclusions
The incidence of melanoma has been steadily increasing over the past few decades and is projected to continue rising worldwide. The characteristics of melanoma are unpredictable and influenced by factors such as age, sex, ethnicity, and geography. Our work aims to make a significant contribution to the timely and accurate detection of melanoma by proposing a custom-designed pipeline for classification of melanoma lesion wherein the dermoscopic image of a lesion is pre-processed and passed to segmentation algorithm. Threshold for segmentation of lesion is calculated by standard deviation method in phase one and by L-fuzzy logic in phase two. Furthermore, the segmented lesion image is classified by the modified YOLO classifier, which has more depth and is able to concatenate multi-label features to produces enhanced and more accurate results. By utilizing the deep learning-based YOLO classifier, we can increase the speed of the detection process without compromising the validity of the output. Our modified YOLO classifier achieves optimal results with faster detection times. We conducted testing and training on three well-known publicly available datasets: PH2, ISIC 2017, and ISIC 2018. Our work was evaluated against other notable research in the field and demonstrated moderate improvements in the evaluation parameters. While the mortality rate among melanoma patients has shown a decline, there is still a need for further advanced research to benefit all patients, regardless of the nature of their lesions.
Author Contributions
Methodology, S.K.S.; Software, S.K.S.; Validation, S.K.S.; Resources, M.H.A.; Writing—original draft, S.K.S.; Writing—review & editing, V.A. and M.H.A.; Visualization, S.K.S.; Supervision, V.A. and M.H.A. All authors have read and agreed to the published version of the manuscript.
Funding
This research received no external funding.
Institutional Review Board Statement
Not applicable.
Informed Consent Statement
Not applicable.
Data Availability Statement
Not applicable.
Conflicts of Interest
The authors declare no conflict of interest.
References
- Feng, J.; Isern, N.G.; Burton, S.D.; Hu, J.Z. Studies of secondary melanoma on C57BL/6J mouse liver using 1H NMR metabolomics. Metabolites 2013, 3, 1011–1035. [Google Scholar] [CrossRef]
- Abuzaghleh, O.; Faezipour, M.; Barkana, B.D. SKINcure: An Innovative Smartphone-Based Application to Assist in Melanoma Early Detection and Prevention. Signal Image Process. Int. J. 2014, 15, 1–13. [Google Scholar] [CrossRef]
- Kaufman, H.L. The Melanoma Book: A Complete Guide to Prevent and Treatment; Gotham Books: New York, NY, USA, 2005; Volume 1. [Google Scholar]
- Saba, T.; Khan, M.A.; Rehman, A.; Marie-Sainte, S.L. Region extraction and classifcation of skin cancer: A heterogeneous framework of deep CNN features fusion and reduction. J. Med. Syst. 2019, 43, 289. [Google Scholar] [CrossRef]
- American Cancer Society. Cancer Facts and Figures 2017. Genes Dev. 2017, 21, 2525–2538. [Google Scholar]
- Jemal, A.; Siegel, R.; Ward, E.; Hao, Y.; Xu, J.; Thun, M.J. Cancer statistics, 2019. CA Cancer. J. Clin. 2019, 69, 7–34. [Google Scholar]
- Goldsmith, L.A.; Askin, F.B.; Chang, A.E.; Cohen, C.; Dutcher, J.P.; Gilgor, R.S.; Green, S.; Harris, E.L.; Havas, S.; Robinson, J.K.; et al. Diagnosis and treatment of early melanoma: Nih consensus development panel on early melanoma. JAMA 1992, 268, 1314–1319. [Google Scholar] [CrossRef]
- Giotis, I.; Molders, N.; Land, S.; Biehl, M.; Jonkman, M.F.; Petkov, N. MED-NODE: A computer-assisted melanoma diagnosis system using non-dermoscopic images. Expert. Syst. Appl. 2015, 42, 6578–6585. [Google Scholar] [CrossRef]
- Rigel, D.S.; Russak, J.; Friedman, R. The evolution of melanoma diagnosis: 25 years beyond the ABCDs. CA Cancer J. Clin. 2010, 60, 301–316. [Google Scholar] [CrossRef] [PubMed]
- Mayer, J.E.; Swetter, S.M.; Fu, T.; Geller, A.C. Screening, early detection, education, and trends for melanoma: Current status (2007–2013) and future directions Part II. Screening, education, and future directions. J. Am. Acad. Dermatol. 2014, 71, e1–e611. [Google Scholar]
- Massone, C.; Hofmann-Wellenhof, R.; Ahlgrimm-Siess, V.; Gabler, G.; Ebner, C.; Peter Soyer, H. Melanoma Screening with Cellular Phones. PLoS ONE 2007, 2, e483. [Google Scholar] [CrossRef]
- Kroemer, S.; Frühauf, J.; Campbell, T.M.; Massone, C.; Schwantzer, G.; Soyer, H.P.; Hofmann-Wellenhof, R. Mobile teledermatology for skin tumour screening: Diagnostic accuracy of clinical and dermoscopic image tele-evaluation using cellular phones. Br. J. Dermatol. 2011, 164, 973–979. [Google Scholar] [CrossRef]
- Harrington, E.; Clyne, B.; Wesseling, N.; Sandhu, H.; Armstrong, L.; Bennett, H.; Fahey, T. Diagnosing malignant melanoma in ambulatory care: A systematic review of clinical prediction rules. BMJ Open 2017, 7, e014096. [Google Scholar] [CrossRef]
- Robinson, J.K.; Turrisi, R. Skills training to learn discrimination of ABCDE criteria by those at risk of developing melanoma. Arch. Dermatol. 2006, 142, 447–452. [Google Scholar] [CrossRef]
- Mobiny, A.; Singh, A.; Van Nguyen, H. Risk-aware machine learning classifer for skin lesion diagnosis. J. Clin. Med. 2019, 8, 1241. [Google Scholar] [CrossRef]
- Singh, S.K. Diagnosis of Skin Cancer Using Novel Computer Vision and Deep Learning Techniques. Ph.D. Thesis, University of Essex, Colchester, UK, 2022. [Google Scholar]
- Banerjee, S.; Singh, S.K.; Chakraborty, A.; Basu, S.; Das, A.; Bag, R. Diagnosis of Melanoma Lesion Using Neutrosophic and Deep Learning. Trait. Signal 2021, 38, 1327–1338. [Google Scholar] [CrossRef]
- Alenezi, F.; Armghan, A.; Polat, K. A Novel Multi-Task Learning Network Based on Melanoma Segmentation and Classification with Skin Lesion Images. Diagnostics 2023, 13, 262. [Google Scholar] [CrossRef]
- Khan, M.A.; Muhammad, K.; Sharif, M.; Akram, T.; Kadry, S. Intelligent fusion-assisted skin lesion localization and classification for smart healthcare. Neural Comput. Appl. 2021, 1–16. [Google Scholar] [CrossRef]
- Gajera, H.K.; Zaveri, M.A.; Nayak, D.R. Patch-based local deep feature extraction for automated skin cancer classification. Int. J. Imaging Syst. Technol. 2022, 32, 1774–1788. [Google Scholar] [CrossRef]
- Redmon, J.; Farhadi, A. Yolov3: An incremental improvement. arXiv 2018, arXiv:1804.02767. [Google Scholar]
- Yen, K.K.; Ghoshray, S.; Roig, G. A linear regression model using triangular fuzzy number coefficients. Fuzzy Sets Syst. 1999, 106, 166–167. [Google Scholar] [CrossRef]
- Chakraborty, A.; Mondal, S.P.; Ahmadian, A.; Senu, N.; Dey, D.; Alam, S.; Salahshour, S. The Pentagonal Fuzzy Number: Its Different Representations, Properties, Ranking, Defuzzification and Application in Game Problem. Symmetry 2019, 11, 248. [Google Scholar] [CrossRef]
- Chakraborty, A.; Maity, S.; Jain, S.; Mondal, S.P.; Alam, S. Hexagonal Fuzzy Number and its Distinctive Representation, Ranking, Defuzzification Technique and Application in Production Inventory Management Problem. Granul. Comput. 2020, 6, 507–521. [Google Scholar]
- Zaqout, I. Diagnosis of skin lesions based on dermoscopic images using image processing techniques. In Pattern Recognition—Selected Methods and Applications; IntechOpen: London, UK, 2019. [Google Scholar]
- Lee, T.; Ng, V.; Gallagher, R.; Coldman, A.; Mc Lean, D. Dullrazor®: A software approach to hair removal from images. Comput. Boil. Med. 1997, 27, 533–543. [Google Scholar] [CrossRef] [PubMed]
- Ganster, H.; Pinz, P.; Rohrer, R.; Wildling, E.; Binder, M.; Kittler, H. Automated melanoma recognition. IEEE Trans. Med. Imaging 2001, 20, 233–239. [Google Scholar] [CrossRef]
- Korotkov, K.; Garcia, R. Computerized analysis of pigmented skin lesions: A review. Artif. Intell. Med. 2012, 56, 69–90. [Google Scholar] [PubMed]
- He, J.; Zhu, Q.; Zhang, K.; Yu, P.; Tang, J. An evolvable adversarial network with gradient penalty for COVID-19 infection segmentation. Appl. Soft Comput. 2021, 113 Pt B, 107947. [Google Scholar]
- Zhao, C.; Vij, A.; Malhotra, S.; Tang, J.; Tang, H.; Pienta, D.; Xu, Z.; Zhou, W. Automatic extraction and stenosis evaluation of coronary arteries in invasive coronary angiograms. Comput. Biol. Med. 2021, 136, 104667. [Google Scholar] [CrossRef]
- Jiang, P.; Ergu, D.; Liu, F.; Cai, Y.; Ma, B. A Review of Yolo algorithm developments. Procedia Comput. Sci. 2022, 199, 1066–1073. [Google Scholar] [CrossRef]
- Diwan, T.; Anirudh, G.; Tembhurne, J.V. Object detection using YOLO: Challenges, architectural successors, datasets and applications. Multimed. Tools Appl. 2023, 82, 9243–9275. [Google Scholar] [CrossRef]
- Cheng, L.; Li, J.; Duan, P.; Wang, M. A small attentional YOLO model for landslide detection from satellite remote sensing images. Landslides 2021, 18, 2751–2765. [Google Scholar] [CrossRef]
- Mendonça, T.; Ferreira, P.M.; Marques, J.S.; Marcal, A.R.S.; Rozeira, J. PH2—A dermoscopic image database for research and benchmarking. In Proceedings of the 2013 35th Annual International Conference of the IEEE Engineering in Medicine and Biology Society (EMBC), Osaka, Japan, 3–7 July 2013; pp. 5437–5440. [Google Scholar] [CrossRef]
- Codella, N.C.; Gutman, D.; Celebi, M.E.; Helba, B.; Marchetti, M.A.; Dusza, S.W.; Kalloo, A.E.A. Skin lesion analysis toward melanoma detection: A challenge at the 2017 International Symposium on Biomedical Imaging (ISBI), hosted by the International Skin Imaging Collaboration (ISIC). arXiv 2017, arXiv:1710.05006. [Google Scholar]
- Codella, N.; Rotemberg, V.; Tschandl, P.; Celebi, M.E.; Dusza, S.; Gutman, D.; Helba, B.; Kalloo, A.; Liopyris, K.; Marchetti, M.; et al. Skin Lesion Analysis Toward Melanoma Detection 2018: A Challenge Hosted by the International Skin Imaging Collaboration (ISIC). arXiv 2018, arXiv:1902.03368. Available online: https://arxiv.org/abs/1902.03368 (accessed on 19 July 2022).
- Bi, L.; Kim, J.; Ahn, E.; Kumar, A.; Feng, D.; Fulham, M. Step-wise integration of deep class-specific learning for dermoscopic image segmentation. Pattern Recognit. 2019, 85, 78–89. [Google Scholar]
- Ünver, H.M.; Ayan, E. Skin Lesion Segmentation in Dermoscopic Images with Combination of YOLO and GrabCut Algorithm. Diagnostics 2019, 9, 72. [Google Scholar] [CrossRef] [PubMed]
- Hasan, K.M.; Dahal, L.; Samarakoon, N.P.; Tushar, I.F.; Martí, R. DSNet: Automatic dermoscopic skin lesion segmentation. Comput. Biol. Med. 2020, 120, 103738. [Google Scholar] [CrossRef]
- Xie, Y.; Zhang, J.; Xia, Y.; Shen, C. A Mutual Bootstrapping Model for Automated Skin Lesion Segmentation and Classification. IEEE Trans. Med. Imaging 2020, 39, 2482–2493. [Google Scholar] [CrossRef] [PubMed]
- Ahmed, N.; Tan, X.; Ma, L. A new method proposed to Melanoma-skin cancer lesion detection and segmentation based on hybrid convolutional neural network. Multimed. Tools Appl. 2023, 82, 11873–11896. [Google Scholar] [CrossRef]
- Yuan, Y. Automatic skin lesion segmentation with fully convolutional-deconvolutional networks. arXiv 2017, arXiv:1703.05165. [Google Scholar]
- Bi, L.; Kim, J.; Ahn, E.; Feng, D. Automatic skin lesion analysis using large-scale dermoscopy images and deep residual networks. arXiv 2017, arXiv:1703.04197. [Google Scholar]
- Li, Y.; Shen, L. Skin Lesion Analysis towards Melanoma Detection Using Deep Learning Network. Sensors 2018, 18, 556. [Google Scholar] [CrossRef]
- Sarker, M.K.; Rashwan, H.A.; Akram, F.; Banu, S.F.; Saleh, A.; Singh, V.K.; Chowdhury, F.U.H.; Abdulwahab, S.; Romani, S.; Radeva, P.; et al. SLSDeep: Skin lesion segmentation based on Dilated residual and pyramid pooling networks. In Proceedings of the International Conference on Medical Image Computing and Computer-Assisted Intervention—MICCAI 2018, Granada, Spain, 16–20 September 2018; Volume 11071. [Google Scholar]
- Soudani, A.; Barhoumi, W. An image-based segmentation recommender using crowdsourcing and transfer learning for skin lesion extraction. Expert. Syst. Appl. 2019, 118, 400–410. [Google Scholar] [CrossRef]
- Barın, S.; Güraksın, G.E. An automatic skin lesion segmentation system with hybrid FCN-ResAlexNet. Eng. Sci. Technol. Int. J. 2022, 34, 101174. [Google Scholar] [CrossRef]
- Al-masni, A.M.; Kim, D.; Kim, T. Multiple skin lesions diagnostics via integrated deep convolutional networks for segmentation and classification. Comput. Methods Programs Biomed. 2020, 190, 105351. [Google Scholar] [PubMed]
- Shahin, A.H.; Amer, K.; Elattar, M.A. Deep convolutional encoder-decoders with aggregated multi-resolution skip connections for skin lesion segmentation. In Proceedings of the 2019 IEEE 16th International Symposium on Biomedical Imaging (ISBI 2019), Venice, Italy, 8–11 April 2019; IEEE: Piscataway, NJ, USA; pp. 451–454. [Google Scholar]
- Ji, Y.; Li, X.; Zhang, G.; Lin, D.; Chen, H. Automatic Skin Lesion Segmentation by Feature Aggregation Convolutional Neural Network; ISIC: Copenhagen, Denmark, 2018. [Google Scholar]
- Koohbanani, N.A.; Jahanifar, M.; Tajeddin, N.Z.; Gooya, A. Leveraging Transfer Learning for Segmenting Lesions and Their Attributes in Dermoscopoy Images; ISIC: Copenhagen, Denmark, 2018. [Google Scholar]
- Qian, C.; Jiang, H.; Liu, T. Skin Lesion Analysis; ISIC: Copenhagen, Denmark, 2018. [Google Scholar]
Disclaimer/Publisher’s Note: The statements, opinions and data contained in all publications are solely those of the individual author(s) and contributor(s) and not of MDPI and/or the editor(s). MDPI and/or the editor(s) disclaim responsibility for any injury to people or property resulting from any ideas, methods, instructions or products referred to in the content. |
© 2023 by the authors. Licensee MDPI, Basel, Switzerland. This article is an open access article distributed under the terms and conditions of the Creative Commons Attribution (CC BY) license (https://creativecommons.org/licenses/by/4.0/).