1. Introduction
Nowadays, concrete is widely utilized in construction due to its durability, strength, and low maintenance cost. However, its production process consumes significant amounts of energy and relies heavily on non-sustainable raw material extraction, leading to considerable CO2 emissions and depleting our natural resources. In addition, the disposal of construction and demolition waste presents a significant challenge, contributing to landfills and often leading to improper disposal. In this perspective, the utilization of Ground Granulated Blast Furnace Slag (GGBFS), a byproduct of the iron and steel industry, and Recycled Coarse Aggregate (RCA), derived from constructing and demolition wastes, can be reused. Not only does this approach promote recycling, it also helps minimize the waste disposal crisis and reduces the demand for virgin materials.
Some researchers have found that RCA concrete does not perform as well mechanically or in terms of durability compared to Natural Aggregate Concrete (NAC) [
1]. This is because RCA concrete tends to possess weaker properties, often due to the presence of residual mortar and a weaker Interfacial Transition Zone (ITZ) between the aggregate and the cement paste [
2]. However, these weaknesses can be addressed by using supplementary cement-based materials. These materials can improve the properties of the RCA concrete, thereby enhancing the performance of the RCA concrete and making it more comparable to the performance of NAC. GGBFS is a valuable by-product of the iron and steel industry, notable for its latent hydraulic properties. These characteristics, when activated by hydration in the presence of lime, contribute significantly to the strength and hardened properties of concrete, making it more durable and resistant to various environmental conditions [
3].
Extensive research underscores the beneficial impacts of incorporating GGBFS into RCA concrete. Those studies show the potential of waste materials in enhancing the environmental sustainability of concrete production while significantly reducing cement consumption. One study [
4] found that using RCA in concrete decreased strength; however, strength can be improved when partially replaced with 30% Pulverized Fuel Ash (PFA) and 65% GGBFS. This composition also improved resistance to chloride ion permeability and reduced steel corrosion rates. A separate study [
5] showed that incorporation of GGBFS in RCA concrete decreases the compressive strength but significantly enhances the durability, making it a valuable additive for long-term resilience of concrete structures. Additional research by Çakır [
6] showed that GGBFS improves tensile splitting strength and bond strength in RCA concrete, particularly when used at a 60% replacement level. However, it contributes to lower density and increased water absorption. An investigation by Majhi et al. [
7] showed that concrete made with 50% RCA and 40% GGBFS improves workability, conserves materials, and achieves comparable performance to conventional concrete, making it a sustainable choice. Another study [
8] revealed enhanced structural performance in reinforced concrete beams with high volumes of GGBFS, RCA, lime, and superplasticizer. These elements significantly improve compressive and shear strength, shifting failure modes from brittle to ductile, and enhancing sustainability in the construction industry. Lastly, Response Surface Methodology (RSM) was demonstrated to accurately forecast the durability and compressive strength of RCA concrete enhanced with GGBFS and Silica Fume (SF) [
9]. Two optimized concrete mix designs were achieved: one maximizing mechanical strength and durability, the other prioritizing environmental sustainability through maximal use of GGBFS, SF, and RCA.
In this work, we introduce a novel approach that combines powerful machine learning techniques to investigate the compressive strength—a critical characteristic—of eco-friendly concrete containing GGBFS and RCA. The XGBoost algorithm was employed and further enhanced to increase its predictive accuracy by implementing a unique hyperparameter tuning procedure, the Bayesian Optimization. The applied innovative methodology is motivated by the goal of improving the design and utilization of sustainable concrete materials, thereby contributing significantly towards a more environmentally conscious construction industry.
2. Related Works
In the exploration and application of machine learning methods in concrete science and technology, researchers have developed innovative strategies for optimizing and improving RCA concrete. One study utilized machine learning models to predict and optimize RCA concrete compressive strength, using a large experimental dataset. Gradient Boosting Regression Trees (GBRT) and Deep Learning had superior predictive performance. GBRT, coupled with Particle Swarm Optimization (PSO), proposed economically and environmentally optimized mixture designs [
10]. Another study used Gene Expression Programming (GEP) and Artificial Neural Network (ANN)-supervised machine learning to predict the compressive strength of RCA concrete. GEP showed better performance than ANN [
11]. One study used hybrid machine learning algorithms to predict the compressive strength of RCA concrete. The interval type-2 fuzzy inference system (IT2FIS) outperformed type-1, with concrete age, natural fine aggregate ratio, and superplasticizer-to-binder ratio impacting positively on strength [
12]. Also, a study employed ensemble machine learning methods to predict sulfate resistance in RCA concrete. Extreme gradient boosting performed the best, indicating that RCA concrete sulfate resistance is most affected by dry-state environmental conditions. A graphical user interface was also developed for practical applications [
13]. Furthermore, a Back Propagation Neural Network (BPNN) model demonstrated superior performance in predicting rubber-modified recycled aggregate concrete’s properties, achieving correlation coefficients of 0.9721 for compressive strength and 0.9441 for peak strain [
14]. Another study utilized machine learning techniques to predict 28-day concrete compressive strength in self-compacting concrete (SCC) using recycled aggregates. The best-performing models, based on R
2 values and Mean Squared Error (MSE), are Category Boosting, K-Nearest Neighbors, and Extra Trees [
15]. Last but not least, an interesting study used machine learning to explore the relationship between recycled aggregate properties, mix proportion, and compressive strength of recycled aggregate concrete. Two optimized hybrid models (PSO-SVR and GWO-SVR) outperformed standard algorithms (ANN and SVR), but GWO-SVR risked overfitting. Cement content, water content, natural fine aggregates, and water absorption were identified as significant influencing factors [
16].
In recent research efforts to predict the compressive strength of concrete made with GGBFS, machine learning has been a fundamental tool. One study used a range of machine learning techniques and a substantial dataset made up of 625 experimental outcomes [
17]. The accuracy of these models was thoroughly assessed using performance indicators and sensitivity analyses. The end result of this thorough analysis was the formulation of equations intended to assist in estimating easily the strength. Other research successfully predicted the compressive strength of environmentally friendly alkaline-activated slag concrete (AASC) using ANN, with the most accurate model having an R
2 of 0.9817 [
18]. This promotes sustainability and stimulates the usage of AASC in the construction industry. In a separate investigation, the predictive capabilities of a regularized multivariate polynomial regression (MPR) model was harnessed to estimate the compressive strength of GGBFS–metakaolin-based geopolymer pastes [
19]. Providing robust estimations, the model exhibited commendable performance with R
2 values of 0.946 and 0.927 for the 7-day and 28-day strengths, respectively, thereby confirming its reliability in this specific context. Lastly, the Random Forest (RF) model was highly accurate in predicting the compressive strength of concrete with GGBFS, with a correlation coefficient of 0.9729, a Root Mean Squared Error (RMSE) of 4.9585, and a Mean Absolute Error (MAE) of 3.9423 on the testing dataset [
20].
Existing research exploring the combined effect of using GGBFS and RCA on the primary properties of concrete is limited. To begin with, one study used machine learning to accurately predict concrete’s compressive strength utilizing a dataset of 125 different materials, including waste by-products for eco-friendly concrete. The most efficient ensemble models were LRF and CNN-LSTM [
21]. Building on this, another study aimed to develop a Multivariate Polynomial Regression (MPR) model for predicting the compressive strength of eco-friendly concrete containing RCA and GGBFS. The MPR outperformed linear regression and SVM models in accuracy [
22]. Continuing this trend of advancement, a subsequent study created a Multivariate Adaptive Regression Splines (MARS) machine learning model to predict the compressive strength of eco-friendly concrete, which outperformed SVM and RF models according to R
2 and RMSE metrics [
23]. Further enhancing the field, a GBRT model integrated with grid search cross-validation was utilized to precisely predict the compressive strength of eco-friendly concrete. Remarkably, this Grid Search Cross-Validation GBRT (GSC-GBRT) model surpassed the default GBRT model, providing improved accuracy metrics [
24]. More recently, a study developed an ANN model to predict the mechanical and durability properties of concrete incorporating waste materials. Experimental results showed that while increased recycled aggregate deteriorates concrete properties, adding GGBFS can counteract these negative effects, improving both mechanical characteristics and long-term durability [
25].
3. Research Significance
This study focuses on enhancing sustainable construction by accurately predicting the compressive strength of eco-friendly concrete. To achieve this, it employs machine learning algorithms, specifically eXtreme Gradient Boosting (XGBoost), known for its superior performance in regression and classification tasks [
26,
27,
28,
29,
30,
31]. It utilizes multiple decision trees to uncover complex non-linear relationships within the data, thereby making accurate strength predictions.
A significant aspect of machine learning is the configuration of hyperparameters, which greatly affects the model’s performance and the precision of predictions. Hence, optimizing these parameters is crucial. Traditional methods of hyperparameter optimization such as brute force search or random search are often inefficient and may lead to suboptimal results. Conversely, Bayesian optimization (BO) offers a structured and efficient approach, using probability to direct the search towards optimal hyperparameters. This ensures not only enhanced predictive capabilities but also a more proficient optimization process.
Additionally, the study emphasizes the importance of comparing the performance of XGBoost with other machine learning models, like K-Nearest Neighbors (KNN) and Support Vector Machine (SVM). Such a comparative analysis provides insights into the strengths and weaknesses of each model, assisting in choosing the best model for the task.
Ultimately, by using advanced machine learning techniques and robust optimization methods, the research aims to improve the field of sustainable construction through the accurate prediction of the compressive strength of eco-friendly concrete, leading to cost-efficient and effective sustainable building practices.
4. Materials and Methods
4.1. XGBoost Algorithm
Chen and Guestrin [
32] introduced XGBoost, a robust machine learning framework that leverages tree boosting. Its scalability has found diverse applications across numerous engineering domains, delivering superior performance. This can be attributed to its capacity for efficient tree pruning, regularization, and the ability to process tasks in parallel. Gradient boosting, serving as the foundational model for XGBoost, iteratively amalgamates the estimations of several “weak” learners to create a singular “strong” learner. XGBoost employs a unique method to optimize the loss function by leveraging residuals for calibrating the previous prediction at each iteration [
33,
34]. This calibration process is an integral part of enhancing the accuracy of the model. Moreover, to curtail the risk of overfitting—a common pitfall in machine learning models—XGBoost ingeniously integrates regularization directly into its objective function, which can be described by Equation (1). This inclusion of regularization serves as a penalty term, mitigating model complexity, thereby enhancing the generalizability and robustness of the model.
In Equation (1),
signifies the parameters that the model learns from the provided dataset. ‘
’ is the regularization term, a strategy that helps to control the model’s complexity to prevent it from overfitting to the training data. ‘
’ symbolizes the training loss functions, including square loss and logistic loss, which serve to assess the fit of the model to the training data. Equation (2) serves as the model’s predictive function; according to decision tree theory, the model’s output
is derived from either a voting system or the average from a set ‘
’ consisting of ‘
’ trees.
The objective function at the
t-th iteration can be detailed using a more particular mathematical formulation, as expressed by:
In this case,
n signifies the quantity of predictions, and
can be characterized as:
Chen and Guestrin [
32] demonstrated that the regularization term
for the decision tree is expressed as follows:
‘
’ modulates the penalty factor, while ‘
’ denotes the number of leaf nodes in the Decision Tree (DT). The complexity of each of these leaf nodes is symbolized by ‘
’, and ‘
’ serves as a vector housing the scores of each leaf node. The Loss Function (LOF) in XGBoost then implements a second-order Taylor expansion, diverging from the typical first-order approach used in general gradient boosting, as discussed by Chen and Guestrin [
32] and Xia et al. [
35]. If we assume the MSE to be the LOF, the objective function can be derived through the equation provided below:
In Equation (6), and stand for the first and second derivatives of the MSE loss function, respectively. Meanwhile, the function is responsible for mapping each data point to its corresponding leaf.
Evidently, the LOF represented by Equation (7) is the aggregate of loss values for each individual data sample. Given that each data sample aligns with a single leaf node, the sum of the loss values across all leaf nodes can likewise express the LOF. This can be denoted as follows:
Accordingly,
and
are defined as:
In essence, the process of optimizing the objective function can be portrayed as the act of seeking the lowest point in a quadratic function. Essentially, the objective function evaluates the alteration in the model’s performance after a specific node in the DT is split. If this split enhances the model’s performance compared to its previous state, it will be employed; otherwise, the split will be discontinued. Furthermore, regularization plays a significant role in warding off overfitting.
4.2. Bayesian Optimization
Bayesian Optimization (BO) is a strategy utilized in machine learning for hyperparameter tuning. It outperforms random search techniques with fewer iterations by finding the minimum value of an objective function. This is accomplished by creating a surrogate function, a less computationally intensive probabilistic model derived from past evaluations of the objective function. The surrogate guides the selection of the next input values to evaluate, optimizing overall performance.
The Gaussian Process (GP), grounded in the Bayesian approach, optimizes its operation by leveraging existing data, exhibiting robust resilience in handling diverse data scenarios. The algorithm primarily relies on input (known information) and output data (predicted information). It aims to fit the posterior distribution of the objective function, continually refined using an increasing number of data points. A significant part of GP’s operation involves optimizing model hyperparameters, which are predetermined before the learning process and have a profound impact on the outcome. The process begins with an initial ‘prior’ distribution, which is updated each time a new sample point is evaluated on the target function. In the final phase, the algorithm analyzes the global posterior distribution to determine the most probable output value. The simplicity of calculating the estimated distribution of the target underpins the widespread usage of GP in Bayesian probabilistic models.
When a GP is employed as the foundational model, the objective function
f(θ) is defined as
GP(m(x), k(x, x’)). In this formulation,
m(x) and
k(x, x’) correspond to the mean and covariance functions, respectively. The covariance function,
k(x, x’), plays a pivotal role in determining the intrinsic characteristics of the objective function
f(θ). These characteristics may include elements such as smoothness, the presence of additive noise, and amplitude. The covariance function’s output, interestingly, is the covariance of
f(θ) and
f(θ’). The probabilistic nature of the GP model implies that each feature’s probability must be estimated independently before their incorporation into the overarching Gaussian model. This step is crucial in accurately representing the complex interplay of features within the model. Another critical step in developing the GP model involves the establishment of a covariance matrix. The probability values associated with all eigenvectors are employed within this matrix, contributing to the structure of the multivariate Gaussian probability model. To fully appreciate the mechanics of the GP model, one can visualize it as follows:
Here, signifies the average value, while designates the covariance.
Acquisition functions hold a critical role within BO, as they are tasked with suggesting potential locations for sampling within the expansive search space. This complex process involves initially drawing a random assortment of candidate samples from the entire domain. Following this step, each of these candidate samples undergoes evaluation through the application of the acquisition function. The next stage of this process involves maximizing the acquisition function or, alternatively, selecting the candidate sample that emerges with the highest score from the evaluation. It is important to note that there is a variety of probabilistic acquisition functions available for use, each presenting its own unique balance between exploitative and explorative tendencies. To break down these tendencies, exploitation typically involves the act of sampling in specific areas where the surrogate model predicts a high target. On the other hand, exploration refers to the act of sampling within regions that are characterized by a significant level of prediction uncertainty. Both of these strategies are aligned with the pursuit of high acquisition values. The overarching objective of this approach is to enhance the acquisition breadth in order to optimally select the next sample point. In a typical scenario, the objective function, represented as
f(
x), will be sampled in accordance with the following equation:
in which
is the acquisition function and
are the
t − 1 samples drawn from
f(
x).
The process of BO can be summarized as such. Firstly, the next sampling point, , is determined by optimizing the acquisition function based on the GP): . Next, calculate a sample, , which could potentially contain noise, using the objective function f(x).
In this research, the acquisition function is defined by the Expected Improvement (
), which is outlined as follows:
in which
is the value of the best sample and
refers to the location of the sample. For example,
. The expected improvement can be evaluated analytically under the GP model:
in which
determines the amount of exploration during optimization and higher value results in more exploration.
4.3. The Suggested BO-XGBoost Algorithm for Smart Prediction of Compressive Strength
In this ongoing research, the aim was to merge XGBoost and BO into a unified BO-XGBoost model. This hybrid model is designed to predict the compressive strength of environmentally friendly concrete. XGBoost is the core predictive component within this model, formulating a function that estimates the compressive strength based on several parameters. As justified in
Section 5, these include the superplasticizer content (in kg), water/binder ratio (W/B), GGBFS material percentage from total binder used in the mixture (GGBFS%), the recycled aggregate percentage from total aggregate in the mixture (RA%), and the curing time (Age). However, it is important to note that the performance of the XGBoost algorithm is contingent upon the choice of these parameters. This is where BO is used to identify the optimal set of these parameters. Once identified, these optimal parameters are integrated into the XGBoost model, which is then used for training. This optimized model subsequently delivers more precise and reliable predictions.
Figure 1 provides a comprehensive visualization of the workflow for the BO-XGBoost model. This process is broken down into three crucial phases: preprocessing of data, optimizing parameters, and making the final prediction. During the first stage, preprocessing, a unique dataset has been compiled for a new type of concrete that incorporates both RCA and GGBFS materials, in addition to other standard concrete components. This dataset was created via a thorough literature review conducted over the period from 2010 to 2023. Also in this stage, the complete dataset is divided into two distinct subsets: a training set and a testing set. The training set is employed for model training and parameter optimization, while the testing set is reserved exclusively for evaluating the performance of the already trained models. During the parameter optimization phase in the BO-XGBoost model, BO must find the optimal XGBoost parameters. This requires a way to assess the efficacy of parameter sets, achieved by formulating an objective or cost function using RMSE and k-fold cross-validation. The training data is divided into ‘
k’ equally sized subsets or ‘folds’. For each parameter set, the corresponding XGBoost model undergoes a training-testing cycle ‘
k’ times, each time with different subsets. The model trains on data from ‘
k − 1’ folds and validates against the remaining fold. The Cost Function (CF), calculated as the average RMSE from all validation rounds (see Equation (14)) gives a quantifiable performance measure of each parameter set, enabling BO to locate the most optimal parameters
represents the validation RMSE linked with the ith fold, where the training set is comprised of the remaining folds:
In this context, signifies the index set connected to the ith fold. The symbol |.| is used to indicate the cardinality, or the number of elements, of a given set. refers to the actual outcome for the jth data set, while represents the corresponding estimated or predicted result.
The BO stops its search once the cost function ceases to show improvement (decrease) after a specific number of iterations or when the predetermined maximum number of iterations is met. Once the optimal parameter set is identified, the corresponding XGBoost model is then utilized in the final stage of prediction. Subsequently, the forecasted values of compressive strength can be gathered and recorded.
4.4. Performance Metrics
Evaluating the performance of a machine learning model is a crucial aspect of the overall machine learning modeling procedure. This critical step provides a precise depiction of the model’s effectiveness and efficiency in making accurate predictions. For the purpose of this research, three distinct statistical measures were employed to carry out this task:
(Equation (15),
(Equation (16)), and
(Equation (17)) [
36]. These measures were calculated using their respective mathematical expressions, providing quantitative assessments of the model’s predictive capability and accuracy.
In the context of the discussed model: is the true value or the actual output from the dataset, represents the predicted result yielded by the machine learning model, is the mean or average value of all the correct output values present in the dataset, and signifies the total number of data points or observations included within the training dataset used for developing the model.
Figure 1.
The functioning process of the BO-XGBoost model.
Figure 1.
The functioning process of the BO-XGBoost model.
5. Dataset Used
This research study draws its data from eleven separate previous investigations [
5,
7,
37,
38,
39,
40,
41,
42,
43,
44,
45]. The primary focus is on building machine learning models, and the predictive variables taken into consideration for the construction of these models encompass several aspects. These aspects include the proportion of Recycled Aggregate (RA) employed as a substitute for Natural Aggregate (NA) in the mixture (expressed as a percentage of RA—RA%), the proportion of GGBFS from the total binder used in the mix and expressed as a percentage of GGBFS (GGBFS%), the amount of superplasticizer in kilograms (Sp (kg)), the ratio of water to binder (W/B), and the age of the concrete (in days). The response variable, in this case, is the Compressive Strength (CS) of what we refer to as ‘eco-friendly concrete’. A concerted effort was made to consolidate the results. The data were selectively gathered from studies that examined the effect of both GGBFS and RCA on the concrete CS. Additionally, while collating this data, the selection was limited to specimens that were strictly cube-shaped and measured either 100 mm or 150 mm in length. To standardize the CS across varying cube sizes, the proposed expressions from [
46] were used. These expressions enable the conversion of the CS from a 100 mm cube mold to its equivalent in a 150 mm cube mold. Within the gathered data, it was noted that five of the records did not include either RA or GGBFS in their mixture proportions, which suggests these were standard concrete mixtures.
Figure 2 showcases histograms of input and output variables that were used in the creation of the predictive models for CS.
Table 1, on the other hand, presents descriptive data for all variables involved in the construction of the model. This table also outlines the typical mixing proportions used in the production of eco-friendly concrete, which incorporates both RA and GGBFS. As revealed in
Table 1, the CS of concrete varies significantly, ranging from 9 MPa to 68 MPa, and corresponds to 7-day and 90-day specimens, respectively. Given that a regression tree forms the fundamental learning component of XGBoost, it eliminates the need for normalizing data samples [
47]. This implies that the prediction outcome will remain unaffected even when features originate from diverse units.
The factors presented in
Table 1 are employed to create eco-friendly concrete. To ensure thorough understanding, a succinct explanation of each parameter is offered below.
The W/B ratio played a critical role in determining concrete strength. Study [
25] suggested that higher W/B ratios and lower binder concentrations can lessen the adverse effects of RCA on the CS of concrete. However, study [
48] indicated a decrease in compressive strength with increasing W/B ratios across all tested mixes. Notably, in a 30% RCA mix, compressive strength dropped significantly over 28 days as the W/B ratio increased from 0.3 to 0.4 and 0.5. Moreover, research [
49] has shown negative impacts of increasing W/B ratio on the compressive strength of geopolymeric recycled aggregate concrete (GRAC). It was found that static compressive strength fell by 17%, 16%, and 28% when the W/B ratio increased from 0.3 to 0.4 in GRAC mixes with 0%, 50%, and 100% RCA, respectively. Therefore, appropriate selection of the W/B ratio is crucial to maintain the CS of various concrete mixes.
Studies also revealed distinct differences in the properties of RAC with 100% RA and NAC, with the former displaying significant property loss. However, RAC composed of 75% NA and 25% RA showed negligible changes [
50]. Research also suggested that a low W/B ratio can negatively impact the strength of RCA, indicating that the concrete strength is dependent on both the RCA and the W/B ratio [
51]. As such, RCA is considered an essential element in our dataset due to its impact on concrete strength.
The application of a superplasticizer enhances the quality of RCA, making it more suitable for structural usage. An increase in the dosage of the superplasticizer leads to a corresponding rise in the CS of the concrete. In particular, when standard superplasticizer was incorporated into concrete made with Fine Recycled Aggregates Concrete (FRCA), there was a significant improvement in CS: an increase of 47% was noted after seven days, 35% after 28 days, and 43% after 56 days, as per the findings of study [
52].
The longevity and durability of concrete are intrinsically linked to its aging process. As the quantities of GGBFS and RCA increase, there is a marked decline in both the short-term and long-term CS of the concrete [
53]. Yet, intriguingly, the rate at which strength develops with age amplifies when both GGBFS and RCA are heightened. This escalation in the strength growth rate can be attributed to the latent hydraulic activity of GGBFS and the amplified hydration of unhydrated cement particles present in RCA [
53].
For the creation of an accurate model, it is vital to take into account the variables that have a significant influence on the desired output. Identifying the parameters with the greatest and least impact on the output requires determining the correlation among these parameters. Various types of correlations have been proposed over time, such as Intra-class and Rank correlations. However, the Pearson method has become a popular choice among researchers (as stated by [
54,
55]). The Pearson Correlation Coefficient (PCC) is essentially defined as the quotient obtained when the covariance of two parameters, cov(
X,
Y), is divided by the product of their standard deviations, as given in the equation below:
In this context,
and
denote the averages of the X and Y datasets, respectively. The PCC, symbolized as
, falls within the range of −1 to 1. A correlation coefficient of
= 1 indicates a strong correlation between the variables, while a value of
= 0 suggests that
X and
Y are linearly independent. However, it is essential to understand that a correlation coefficient of zero does not necessarily imply a complete lack of correlation. The variables might still be related, but in a non-linear manner, as pointed out by Kotu and Deshpande in [
56]. Furthermore, as Berman highlighted in [
57], a negative correlation coefficient indicates an inverse relationship between the two variables, meaning that as one variable increases, the other decreases, and vice versa.
Figure 3 provides a matrix of the PCCs for the input and output variables as a heatmap. As per the data in
Figure 3, the variables W/B ratio, Age of concrete, and superplasticizer Sp (in kg) display the strongest correlation with CS, underscoring their substantial impact on the concrete strength. Conversely, among all the input variables, the GGBFS% and RA% have the lowest correlation.
6. Model Results
6.1. Hyperparameter Optimization: BayesSearchCV
This paper’s forecasting model employs the Scikit-Learn library, the preeminent machine learning library for Python, utilized specifically on the Python 3.7 platform. In this research, the XGBoost algorithm was utilized to create a predictive model for cubic CS resulting from machine measurements. By utilizing the BayesSearchCV method from the Skopt package for the parameter search, it was feasible to identify the parameters that best fit the predictive model attributes. Locating parameters that yield the highest model prediction accuracy becomes more streamlined with the Python BayesSearchCV function [
58]. The perfect blend of XGBoost hyperparameters was derived by setting the values and ranges of the XGBoost prediction model hyperparameter and employing the BayesSearchCV function. The effectiveness of different hyperparameters in XGBoost can vary depending on the specific dataset and problem at hand. However, some hyperparameters are generally considered more crucial to optimize. Here are a few:
n_estimators and learning_rate: These parameters control the number of sequential trees to be modeled (n_estimators) and the contribution of each tree to the final outcome (learning_rate). They can have a significant effect on the model’s performance and are often tuned together.
max_depth: This parameter sets the maximum depth of a tree and can help control overfitting, as it makes the model more specific to the training data. Generally, a smaller max_depth is preferred to prevent the model from learning relations which might be highly specific to the particular sample selected for a tree.
subsample: This is the fraction of observations to be randomly sampled for each tree. Lower values make the algorithm more conservative and prevent overfitting but too small values might lead to under-fitting.
colsample_bytree: This is the subsample ratio of columns when constructing each tree. Subsampling occurs once for every tree constructed.
Table 2 provides a view of the search parameters’ range and the most suitable hyperparameters identified for the XGBoost model.
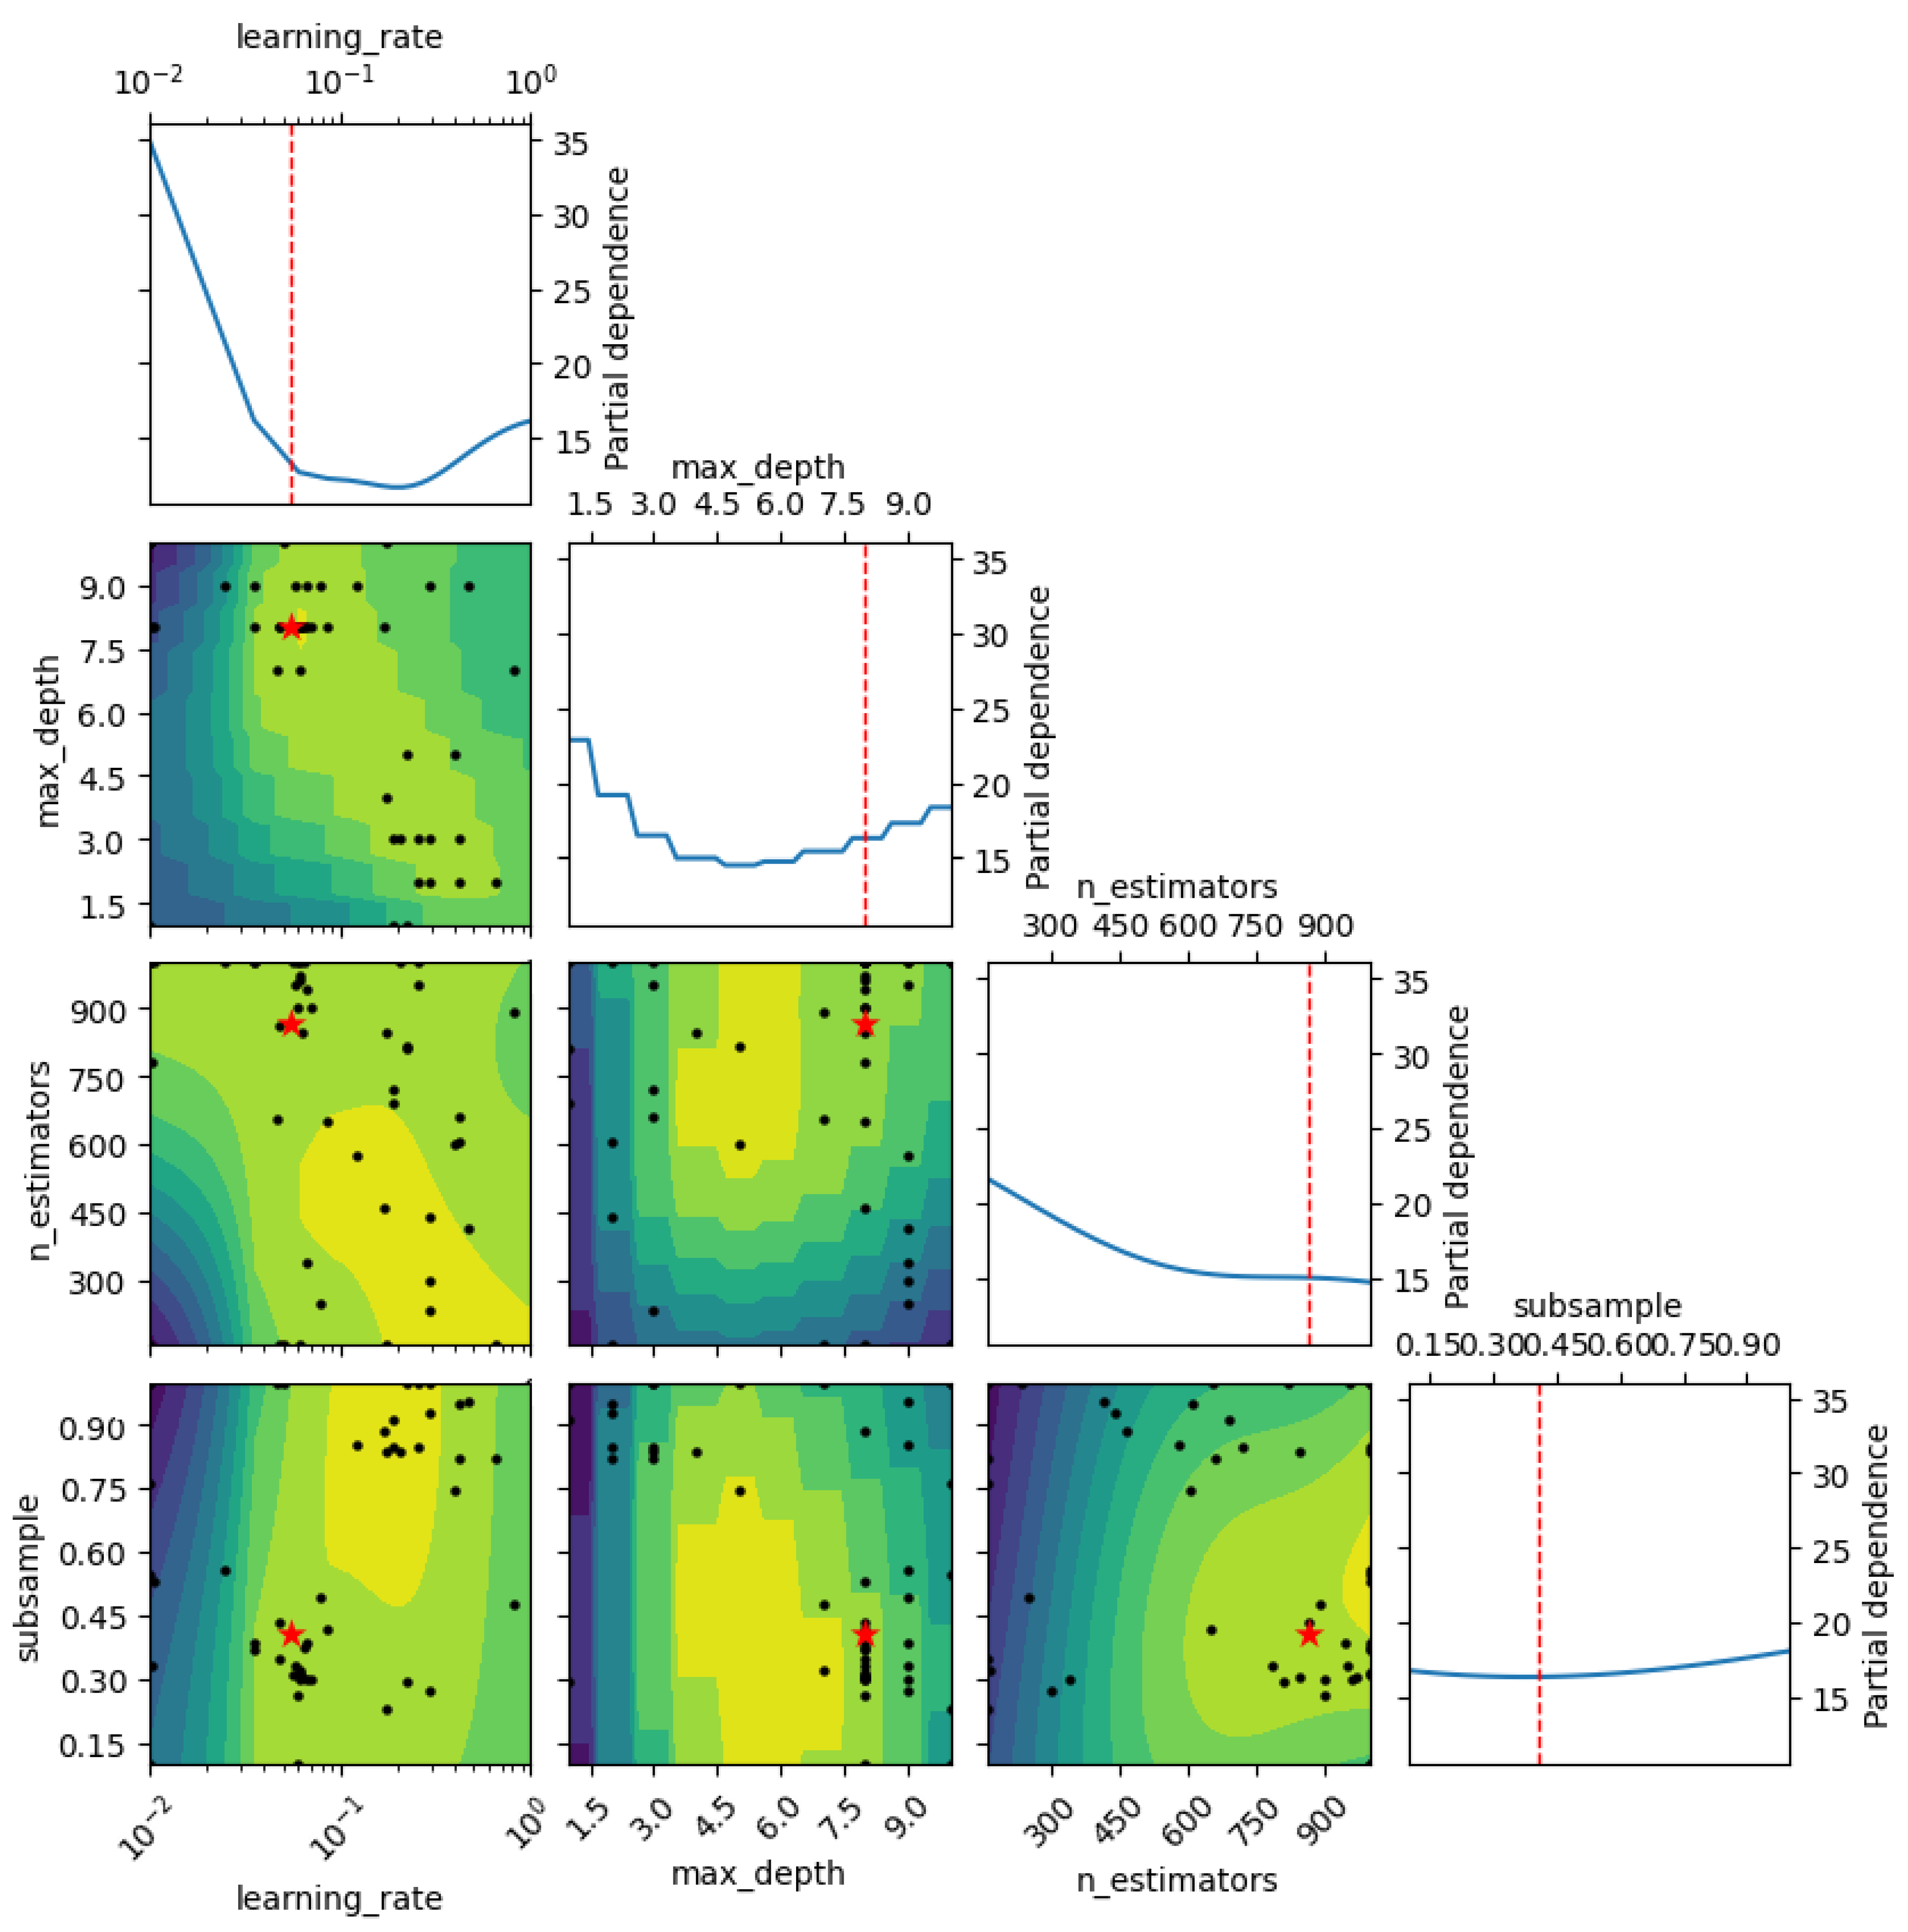
Figure 4 illustrates the Bayesian search procedure applied to the model’s parameters. The parameter associated with the least mean square error was chosen as the model’s hyperparameter. In the figure, the coordinate axes depict the search span of various parameters. The black dot in the graph signifies a particular combination of hyperparameters that were evaluated during the search process, while the red star on the graph denotes the combination of hyperparameters that gave the best result from search process.
6.2. Results from Single 8-2 Validation Tests
To begin with, the results from a single 8–2 split are presented, in which the dataset is divided such that 80% serves as the training set and the remaining 20% as the testing set.
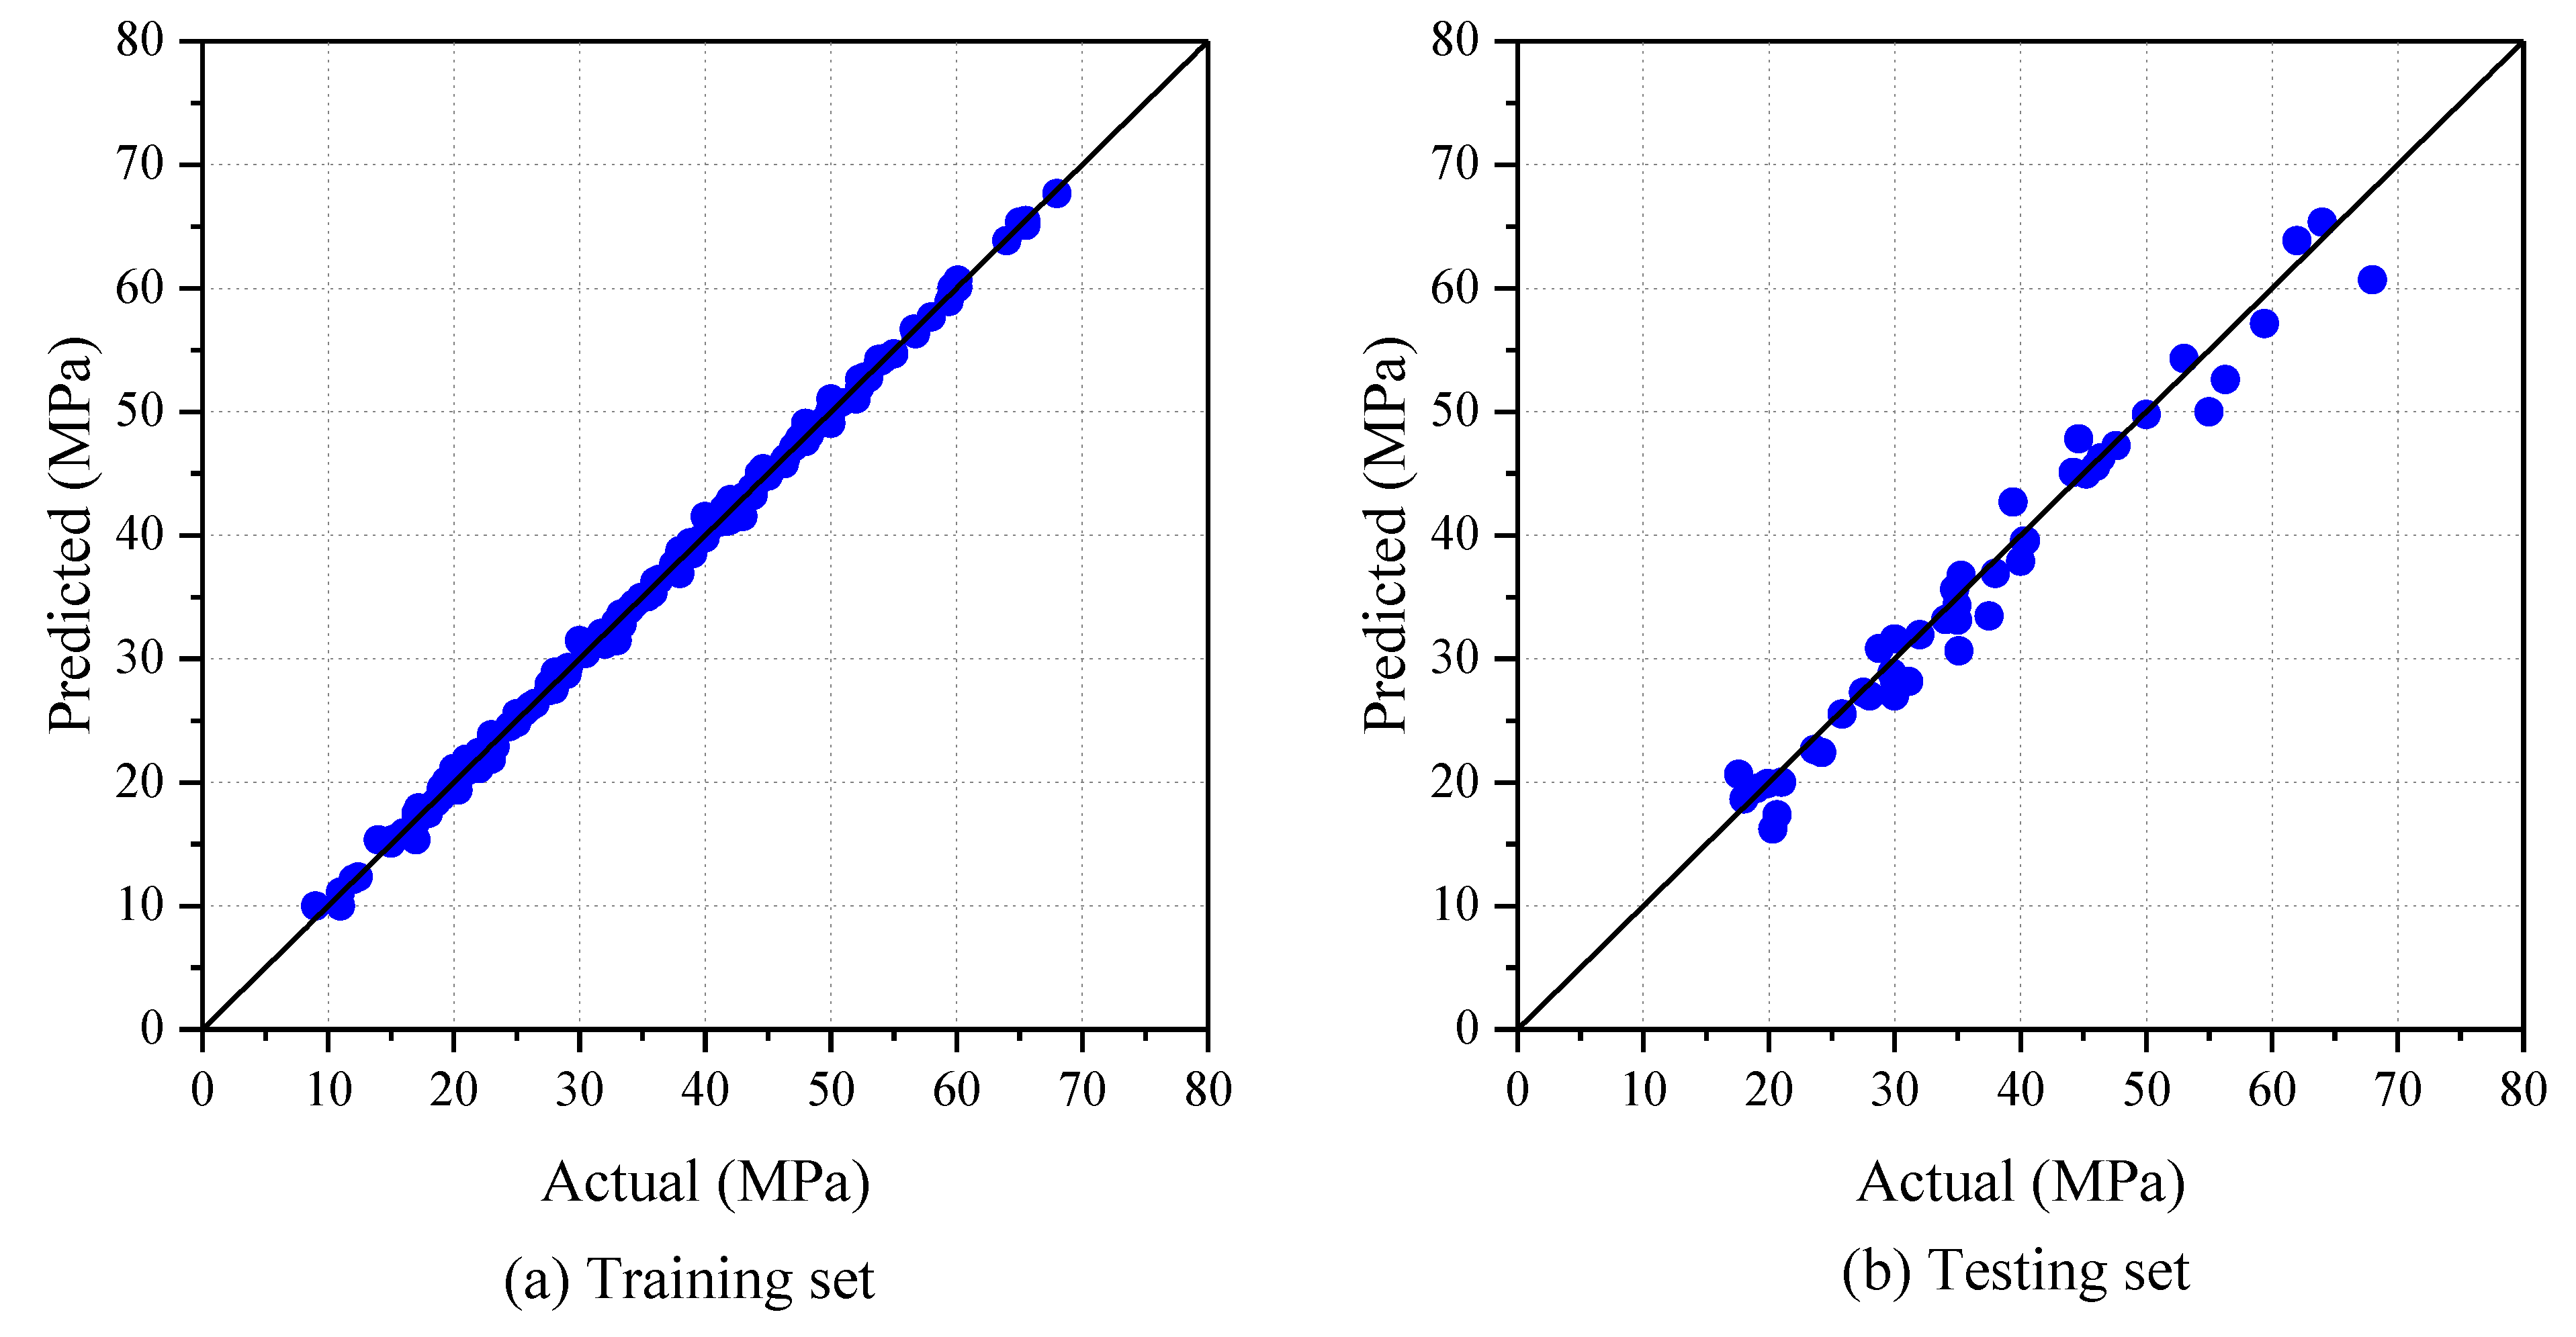
Figure 5 shows the relationship between the values predicted by the model and the actual tested values for both the testing and training datasets. It is evident that there is a linear correlation between the tested and predicted values. When the model’s predictions are compared to the actual values for the training set, they are very close, demonstrating a high level of accuracy. The scatter points align closely with the ideal black lines shown in the figures, signifying a high level of prediction accuracy. On the other hand, there is a somewhat slight level of dispersion for the testing set.
Figure 4.
Conducting a Bayesian search for XGBoost parameters.
Figure 4.
Conducting a Bayesian search for XGBoost parameters.
The evaluation results of the model are summarized in
Table 3, presenting the three chosen metrics for both the training and testing sets. The model exhibits outstanding performance in forecasting CS values. In the case of the training data set, an R
2 value of 0.9993 signifies an almost perfect alignment with the actual values. Furthermore, the model achieves a MAE of just 0.3544 MPa and a RMSE of 0.4991, reinforcing the model’s exceptional learning and predictive capabilities. When evaluated on the testing data, the model maintains a robust performance with an R
2 value of 0.9756, which is remarkably close to 1. The MAE is slightly higher at 1.7737, yet this increase remains within acceptable limits from an engineering practice perspective. Overall, the BO-XGBoost model accurately predicts the CS, demonstrating its high efficacy.
6.3. Five-Fold Cross-Validation Results
In an BO-XGBoost model, the five-fold cross-validation technique is commonly used to estimate the level of bias associated with the model’s performance on the training data set. It does this by first dividing the dataset into five subsets, and then uses four subsets for training the model and the remaining subset for validation. This process is repeated five times, each time with a different subset used for validation. The final performance metric is the average accuracy of the five times the validation process was conducted. Consequently, the five-fold cross-validation method provides a more reliable estimate of the model performance, as it reduces the effect of random variations in the data [
59].
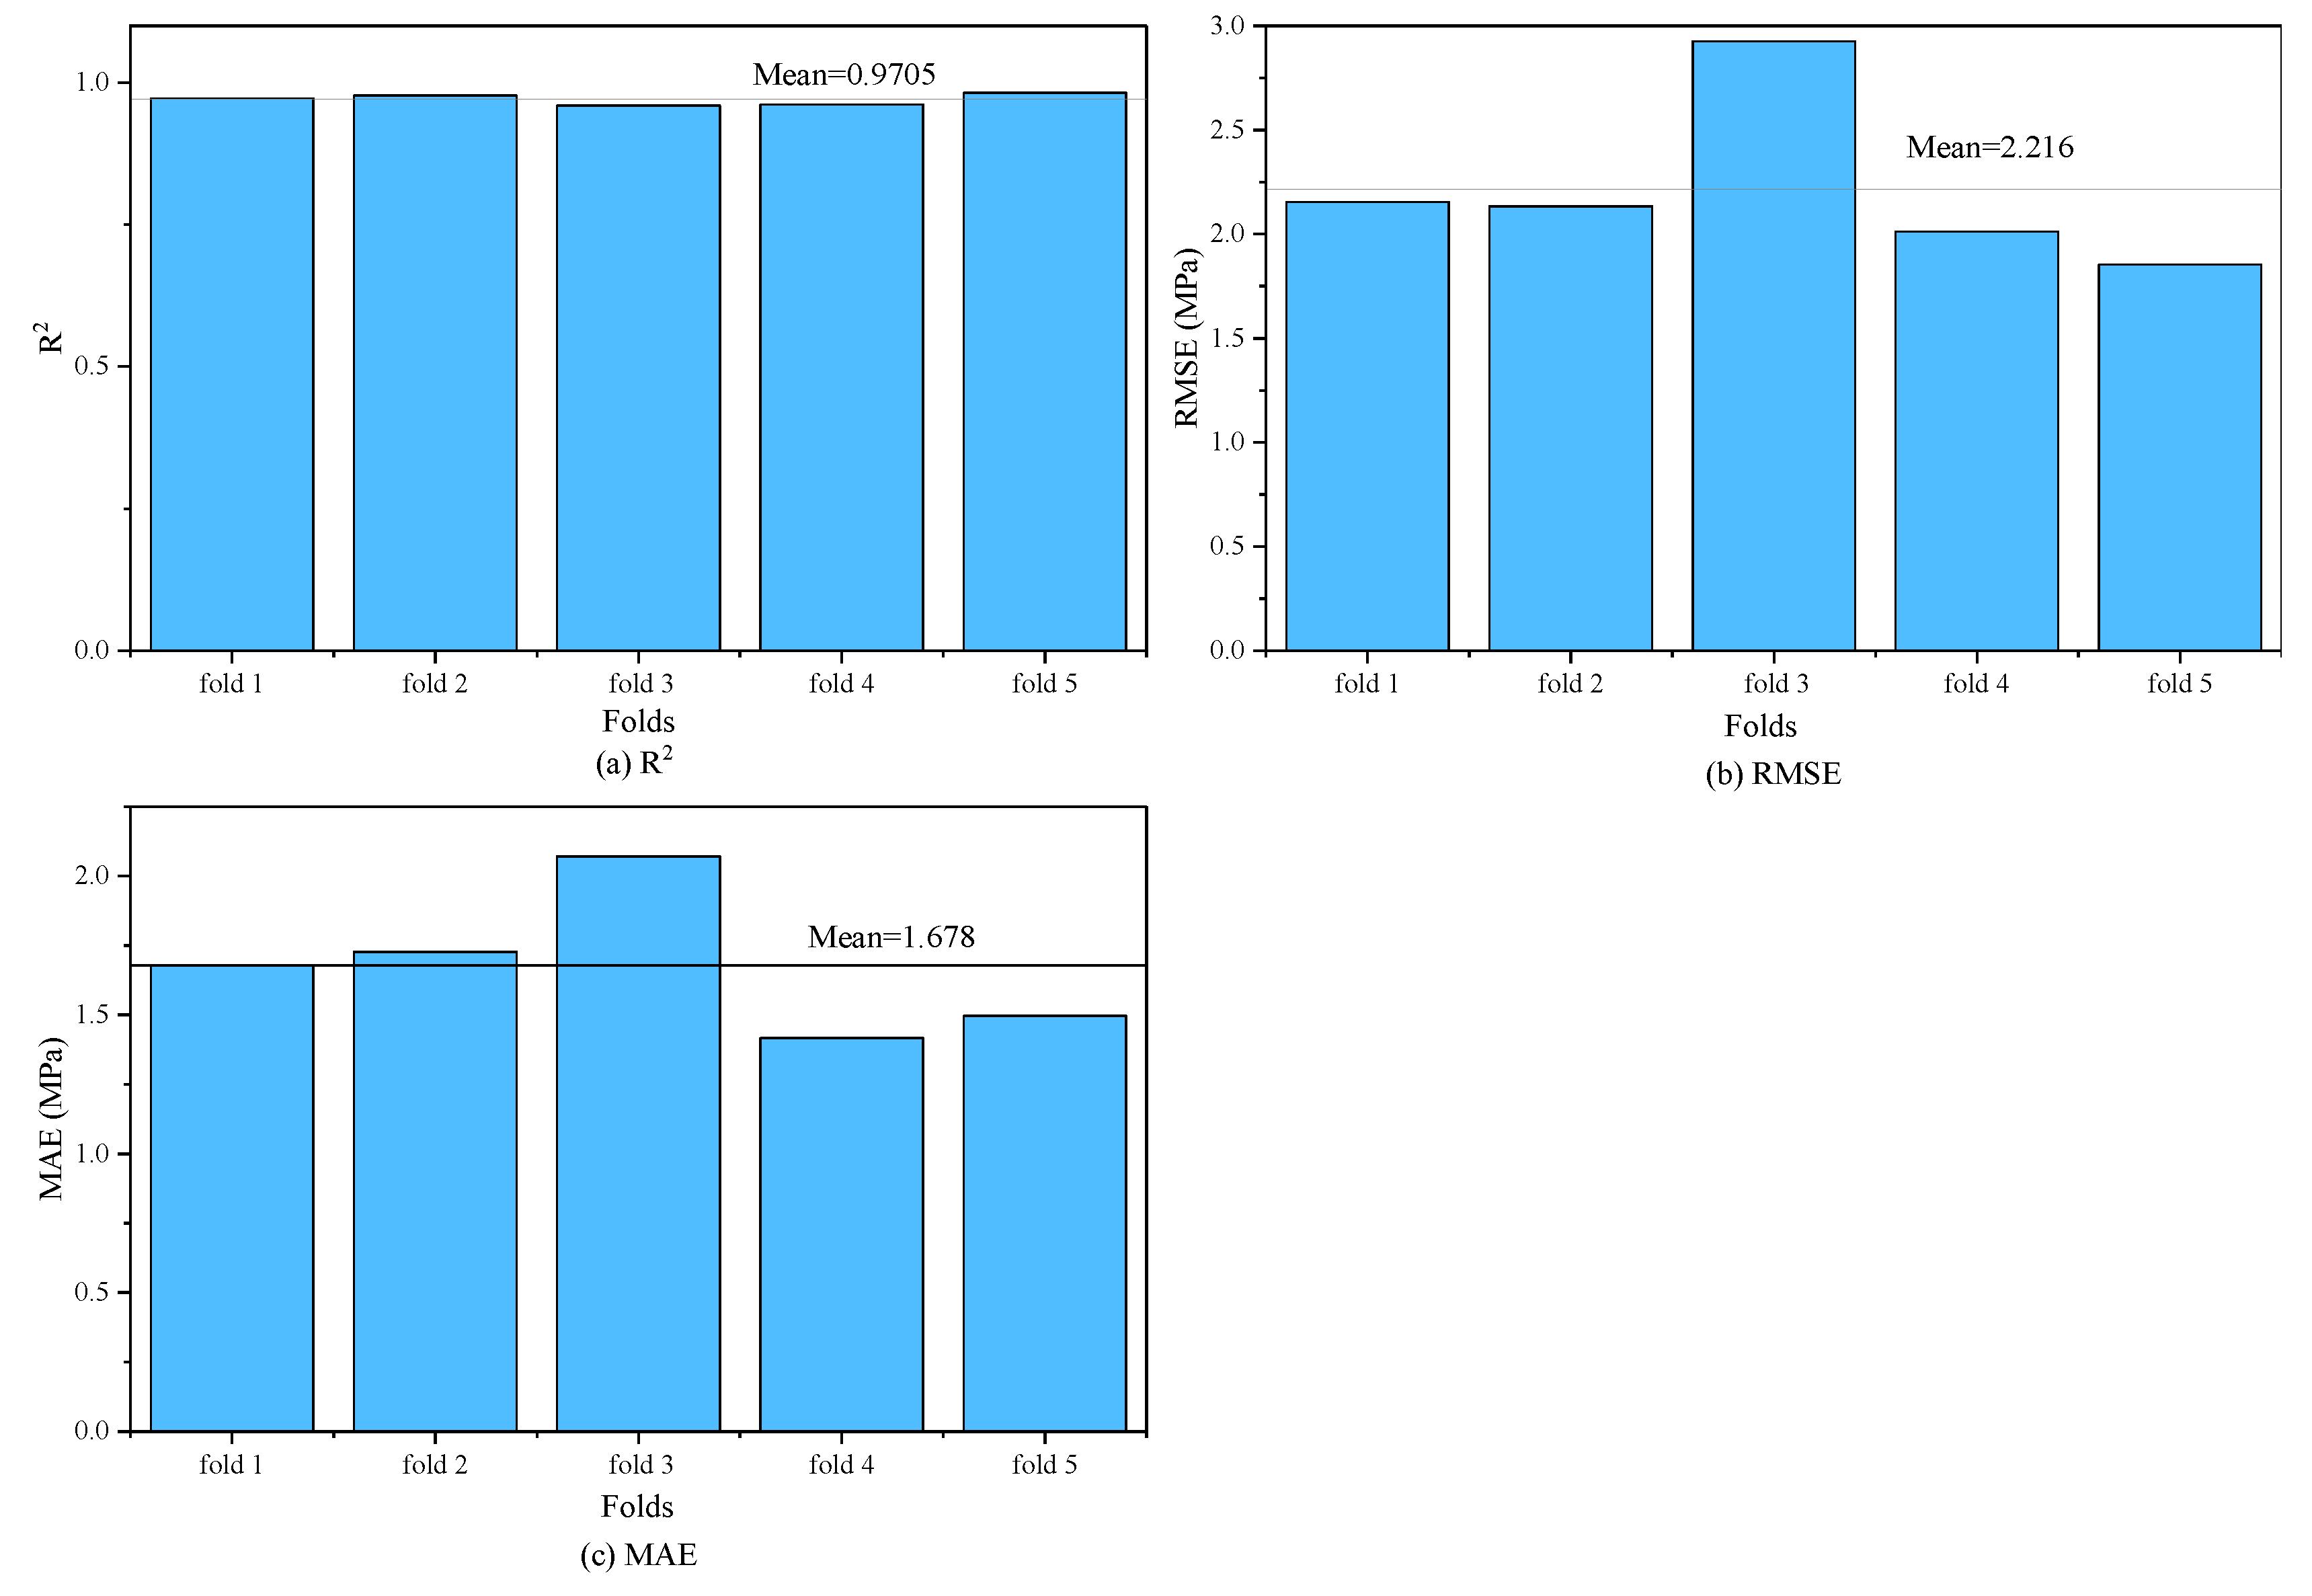
Figure 6 visually presents the performance measures for each iteration within the five-fold cross-validation process. It reveals minor variations across the five iterations. However, the model consistently exhibits high precision. For instance, the lowest detected R
2 value stands at 0.9598, while the highest peaks at 0.9819. The smallest recorded MAE is 1.4167, and the highest reaches 2.0709.
Table 4 systematically offers a detailed account of the results from each iteration. The average R
2 value over all iterations is 0.9705, with a standard deviation (SD) of 0.0097, yielding a very small coefficient of variation (COV) of 1.00%. The average RMSE is 2.2158 MPa, which is quite modest when compared to the mean CS value of 35.70 MPa.
6.4. Comparing with Other Machine Learning Models
In order to fully demonstrate the capabilities of the BO-XGBoost algorithm, a well-known ensemble learning technique, this study also incorporates two widely used individual learning methods, namely KNN and Support Vector Regression (SVR). The procedure for establishing the model parameters is analogous to the one applied for BO-XGBoost. This involves setting preliminary values for these parameters, followed by the utilization of BayesSearchCV to identify the best possible values. SVRs are a type of machine learning model used for both classification and regression tasks. They work by finding the hyperplane (a subspace of one dimension less than the ambient space) that best separates the classes of data, maximizing the margin between the closest points (the “support vectors”) of different classes. The best hyperparameters to optimize in SVR are the regularization parameter “C”, the kernel type, the gamma value if using the ‘rbf’ or ‘poly’ kernel, the degree of the polynomial for the ‘poly’ kernel, and the epsilon parameter. The penalty coefficient, often referred to as “C” in machine learning, especially in algorithms like SVM and SVR, is a regularization parameter that controls the trade-off between achieving a low training error and a low testing error, that is, the ability to generalize the model to unseen data. In the context of Support Vector Machines (SVM) and SVR, the kernel type refers to the function used to transform the input data into a higher-dimensional space, making it easier to classify or fit a regression line to the data. This process is known as the kernel trick. In the context of the Radial Basis Function (RBF) kernel and the Polynomial kernel, gamma defines how far the influence of a single training example reaches, which in turn affects the flexibility of the decision boundary.
On other hand, KNN is a type of instance-based learning, or lazy learning, where the function is only approximated locally and all computation is deferred until prediction. The KNN works by finding a predefined number of training samples closest in distance to a new point and predicting the label from these. The label assigned to the new instance is computed using the mean of the labels of its nearest neighbors.
Here are the most important parameters to tune in KNeighborsRegressor:
n_neighbors: The number of neighbors to use for prediction. This is typically the ‘k’ in KNN. A small value of ‘k’ means that noise will have a higher influence on the result and a large value will make it computationally expensive.
weights: The weight function used in prediction. It can take the values of ‘uniform’, ‘distance’ or any other user-defined function. ‘Uniform’ means all points in each neighborhood are weighted equally, whereas ‘distance’ means points are weighted by the inverse of their distance.
algorithm: The algorithm used to compute the nearest neighbors. It can be ‘ball_tree’, ‘kd_tree’, ‘brute’ or ‘auto’. If ‘auto’ is chosen, the algorithm tries to decide the most appropriate algorithm based on the values passed to the fit method.
leaf_size: Leaf size passed to BallTree or KDTree. This can affect the speed and memory usage of the construction and query, as well as the memory required to store the tree.
p: Power parameter for the Minkowski metric. When p = 1, this is equivalent to using manhattan_distance, and euclidean_distance for p = 2.
The choice of KNN and SVM as benchmarks is based on the principle of diversity in model comparison. KNN and SVM are indeed examples of single-learner algorithms, where a single hypothesis is learned from the training data and used for predictions. By comparing XGBoost with these single-learner models, we aim to demonstrate the advantages of using an ensemble method. Ensemble methods like XGBoost are known for their superior performance in terms of accuracy and robustness because they aggregate the predictions of multiple models to minimize the variance and bias. This comparison will highlight these benefits of XGBoost over single-learner algorithms.
Figure 7 provides a summary of the three metrics used to evaluate the predictions on the test sets for the three models. R
2, RMSE, and MAE are measures of the prediction error among the three models: BO-XGBoost, BO-SVR, and BO-KNN. BO-XGBoost demonstrated the least prediction error, followed by BO-SVR, then BO-KNN. Specifically, BO-XGBoost yielded an RMSE of 2.3525 and an MAE of 1.7737, signifying it has the smallest prediction error. The BO-SVR model’s prediction error was less than that of the BO-KNN model. Considering R
2, which gauges how well the models fit the independent variables, the models ranked as follows: BO-XGBoost performed the best, followed by BO-SVR, and then BO-KNN. In particular, BO-XGBoost achieved an R
2 of 0.9756, implying the best fit. Overall, based on the aforementioned prediction metrics, BO-XGBoost provides the most accurate predictions for CS of eco-friendly concrete. The reason may be that both SVR and KNN are individual learning algorithms, while XGBoost is an ensemble learning method. In essence, XGBoost constructs multiple weak learners (in this case, decision trees) and combines their output to create a single, more accurate prediction. This methodology allows it to correct its errors with each iteration, progressively enhancing the model’s performance.
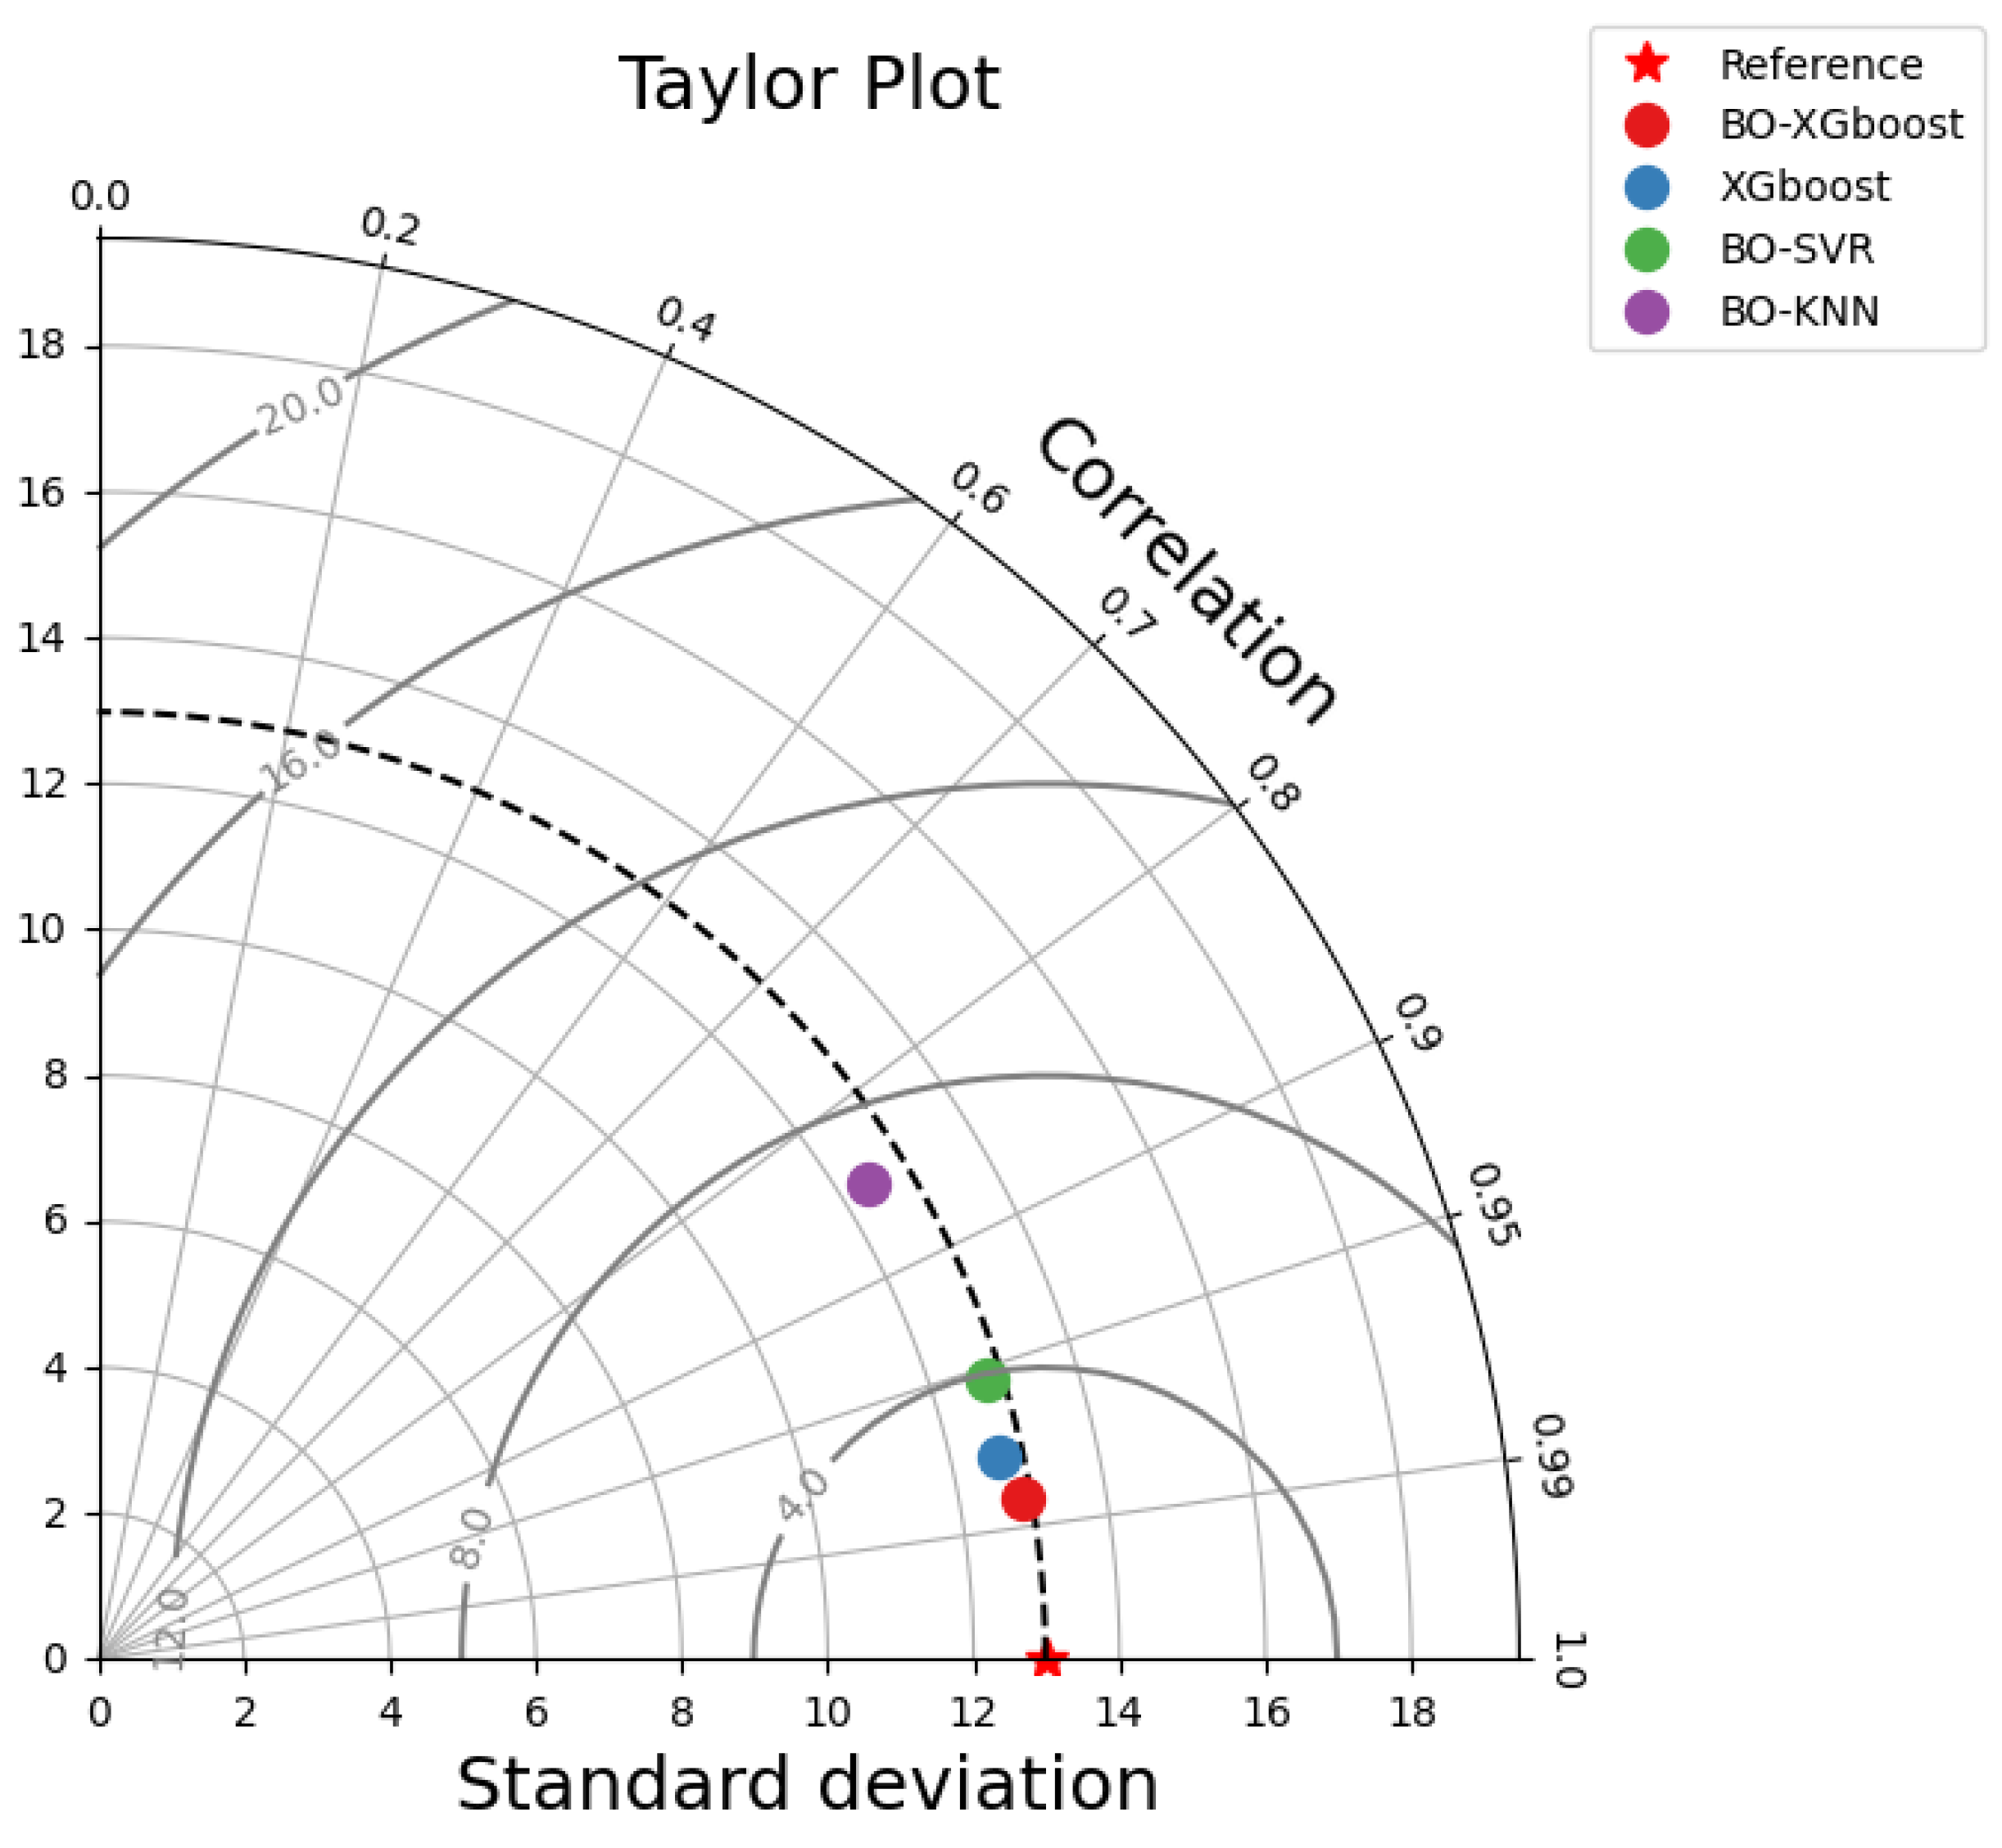
Furthermore, a Taylor plot was applied to compare the realistic characteristics of the three models by measuring the distance between each model and the point marked “actual” (see
Figure 8). It can be seen that the BO-XGboost model was situated closest to the “actual” point with a comparatively higher correlation coefficient and lower RMSE value, indicating that this model performed better in predicting CS values of eco-friendly concrete. As for the other two models, KNN lay farthest from the “actual” point due to a larger RMSE and standard deviation as well as lower correlation coefficient, suggesting poorer predictive performance of this model.
6.5. Partial Dependence Analysis
A Partial Dependence Plot (PDP) is a data visualization tool that illustrates the marginal effect of a feature on the predicted outcome of a machine learning model. It essentially displays the variation in prediction of the model, on average, as a specific feature changes, while keeping other features constant. The concept of “partial” is derived from the process in which the plot averages the predictions of the model across all instances in the dataset, thereby “partially” factoring in the impact of other variables. The plot is constructed by calculating the model’s prediction for several fixed values of a selected feature, while maintaining constant values for other features. These predictions are then averaged over all instances and plotted as a function of the fixed values of the chosen feature. PDPs offer insights into the interaction between features and the target variable and can indicate whether these relationships are linear, monotonic, or more complex in nature. The slope of the PDP can be interpreted to understand the influence of the feature on the prediction: a steep slope indicates strong influence, while a flat slope suggests little impact.
Figure 8.
A Taylor chart illustrating different models used for predicting CS.
Figure 8.
A Taylor chart illustrating different models used for predicting CS.
Looking at the data of PDP plot in
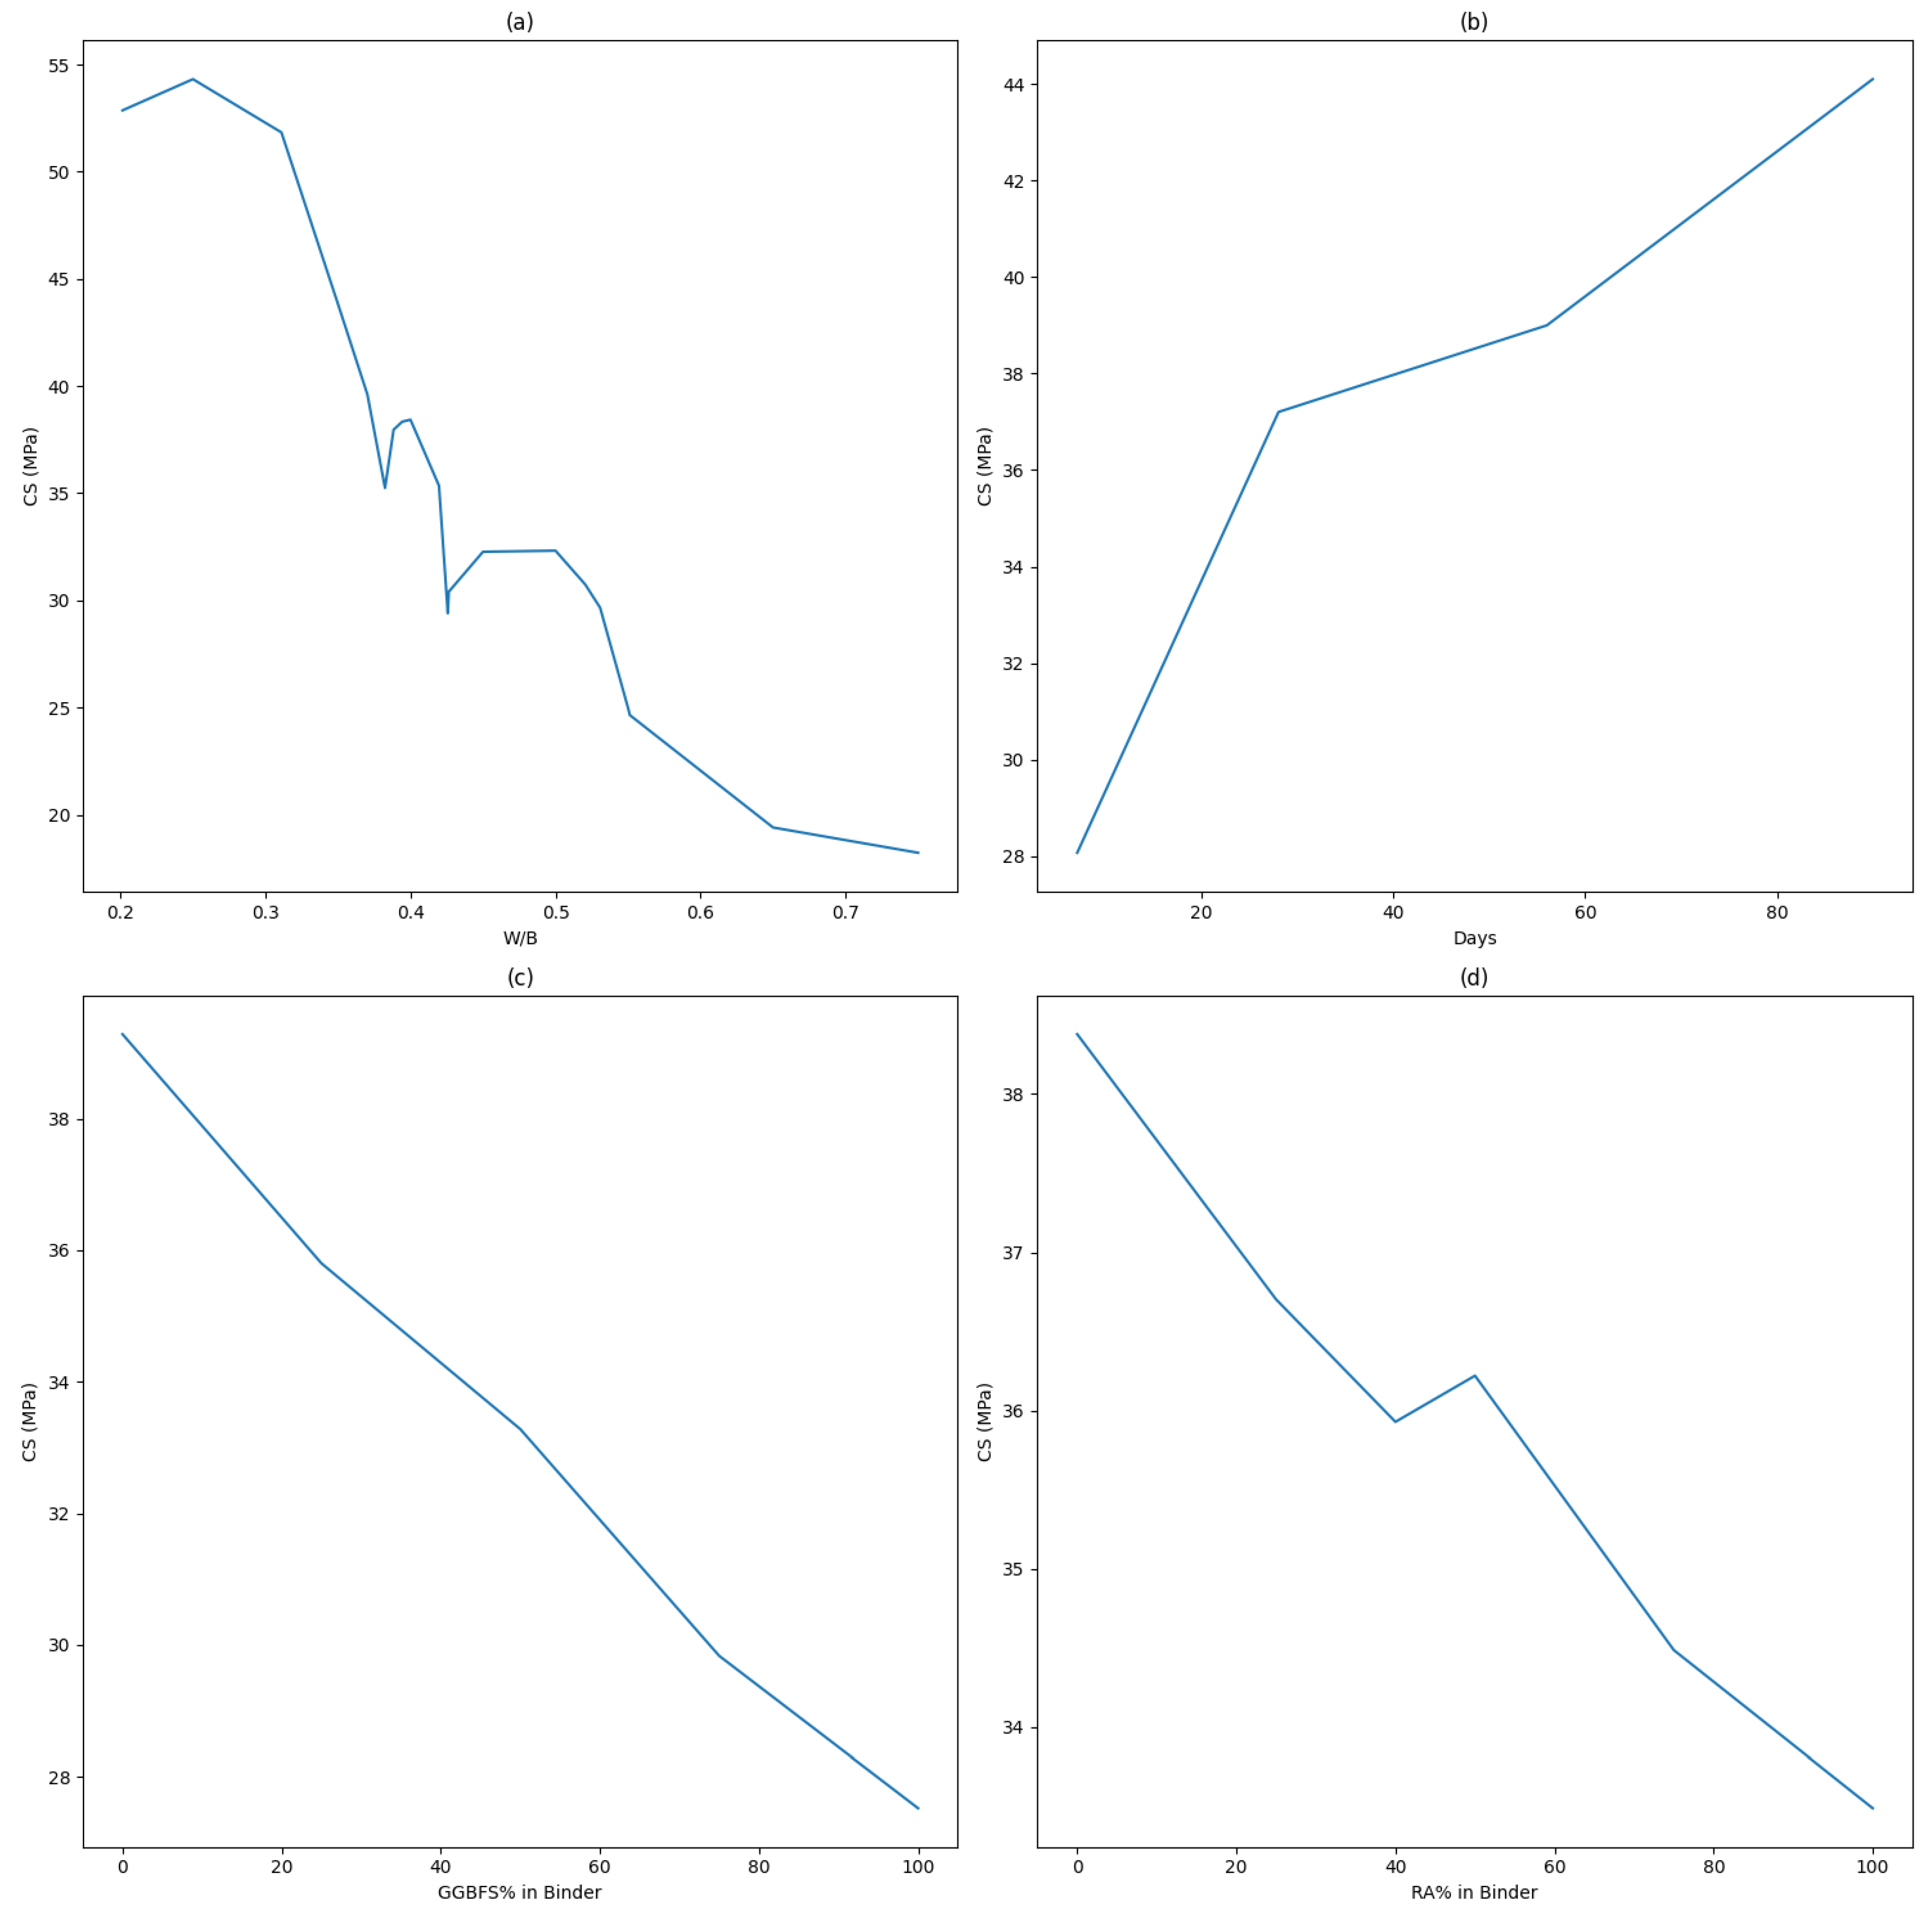
Figure 9, the CS seems to peak around a W/B ratio of 0.25, and then begins to decline. This might be because, at lower W/B ratios, there is insufficient water for the hydration process, which would limit the CS. At a W/B ratio of 0.25, there may be an optimal balance of water and binder for the hydration process, which maximizes the CS. As the W/B ratio increases beyond this point, the excess in water could create larger capillary pores as it evaporates, which would weaken the structure and reduce the CS. There is a slight increase in CS again around the W/B ratio of 0.38–0.4, which may be due to specific properties of the mixture used, such as the presence of certain additives or the particle-size distribution. However, the general trend is that the CS decreases with increasing W/B ratio. This is consistent with the known behavior of cement-based materials, where a higher W/B ratio typically leads to a lower CS due to the increased porosity [
60].
As the age at testing increases, so does the CS. This is in line with the understood property of concrete that it gains strength over time due to the ongoing hydration process of the cement, which progressively forms more crystalline hydrate products responsible for concrete’s strength. Looking at the model’s predictions, at 7 days, the early stage of concrete curing, the average CS is approximately 28.07 MPa. At 28 days, a common industry benchmark, the average CS increases to about 37.20 MPa, reflecting the designed strength of standard concrete mixes. The average CS rises to about 38.99 MPa at 56 days and 44.10 MPa at 90 days, showing that the concrete continues to cure and gain strength, albeit at a slower pace. These numbers align with the known behavior of concrete, which strengthens over time due to the continued hydration process. However, the exact rates and values can differ based on factors such as the specific concrete mix used and the curing conditions.
When interpreting these numbers, it is evident that at 0% GGBFS, where only regular cement is used, the average predicted CS is approximately 39.29 MPa. As the percentage of GGBFS increases to 25%, replacing regular cement, there is a slight decrease in the predicted average CS to around 35.80 MPa. This trend of decreasing CS continues as the GGBFS percentage increases. At 100% GGBFS, the lowest average predicted CS of about 27.52 MPa is observed. These findings suggest that increasing the GGBFS proportion in the binder results in a decrease in the immediate average predicted CS of concrete, as per the model’s predictions. This could be attributed to the slower reaction rate of GGBFS compared to regular cement, leading to slower immediate strength gains. However, the usage of GGBFS can contribute to long-term strength gains, improved durability, and environmental sustainability.
Finally, a Partial Dependence Plot (PDP) indicating an only slight impact of RCA on concrete compressive strength allows engineers to judiciously use RCA without majorly affecting structural integrity. This adaptability provides cost-efficient, eco-friendly alternatives, supporting sustainable construction practices.
7. Conclusions
This study concludes with robust findings that significantly advance our understanding of the compressive strength (CS) of eco-friendly concrete. The hyperparameter optimization process, executed via the Bayesian search, demonstrated its efficiency in fine-tuning the model’s parameters, leading to the selection of the most optimal hyperparameters that resulted in the minimum mean square error.
The proposed BO-XGBoost model showed exceptional learning and predictive capabilities, evidenced by its almost perfect alignment with actual values in the training set. This high efficacy was further corroborated when evaluated on the test data, where it showed a robust performance, implying that the proposed model is accurate and reliable.
In addition, the five-fold cross-validation reinforced the model’s consistency and precision, with minor variations across the iterations. The coefficient of variation remained very small, suggesting a strong stability of the model. These findings indicate that the proposed model is not only precise but also reliable across different data subsets.
Further comparisons with other machine learning models, namely BO-SVR and BO-KNN, revealed the superiority of the BO-XGBoost model. It consistently demonstrated the least prediction error and the best fit, making it the most accurate model for predicting the CS of eco-friendly concrete among the models tested.
The PDP analysis elucidated the relationships between various input features and the CS. The findings suggested that the CS peaks at an optimal W/B ratio, affirming the critical role of water content in the hydration process. Furthermore, it was found that the CS increased with the age of the concrete, reinforcing the known property of cement-based materials that harden and strengthen over time. Interestingly, an increase in the GGBFS percentage in the binder led to an immediate decrease in the CS, presumably due to its slower reaction rate compared to regular cement.


 ,
, 


