Featured Application
This article presents a numerical simulation model built using COMSOL software to study the thermophysical properties of different breast sizes. Specifically, the effects of varied blood perfusion, tumor size, location depth, and thermal conductivity were studied in relation to breast size. Pennes’ bioheat formula was applied to illustrate thermal distribution by applying thermal conductivity characteristics in each layer in the breast using COMSOL software. This was followed by an emulation experiment to demonstrate the effectiveness of using situ-cooling gel on the breast surface area in providing better temperature contrast and amplifying heat detection. Simulation results demonstrated that both large breast size and small breast size both have heat detection issues, while experimental results showed how situ-cooling can help mitigate these issues. The findings offer valuable insights for future research in this field.
Abstract
This article presents a numerical simulation model using COMSOL software to study breast thermophysical properties. It analyzes tumor heat at different locations within the breast, records breast surface temperatures, investigates the effects of factors such as blood perfusion, size, depth, and thermal conductivity on breast size, and applies Pennes’ bioheat formula to illustrate thermal distribution on the breast skin surface. An analysis was conducted to examine how changes in tumor location depth, size, metabolism, blood flow, and heat conductivity affect breast skin surface temperature. The simulation model results showed that the highest variations in skin temperatures for breasts with tumors and without tumors can range from 2.58 °C to 0.274 °C. Further, large breast size with a large surface area consistently reduces the temperature variations on the skin and might have difficulty in yielding observable temperature contrast. For small breast sizes, however, heat from tumor sizes below 0.5 cm might be quite difficult to detect, while tumors located deep within the breast layers could not produce observable temperature variations. Motivated by the above interesting results, an emulation experiment was conducted to enhance the observable heat and temperature background contrast, using situ-cooling gel applied to silicon breasts, while the tumor source was emulated using LEDs. The experiment was used to evaluate the effectiveness of adding situ-cooling to the breast surface area, and to study the modulated effect of tumor size and depth. Experimental results showed that situ-cooling enhances thermal contrast in breast thermal images. For example, for a tumor location at a depth of 10 cm, a difference of 6 °C can still be achieved with situ-cooling gel applied, a feat that was not possible in the simulation model. Furthermore, changes in tumor size and location depth significantly impacted surface temperature distribution.
1. Introduction
Breast cancer is one of the most common cancers, with 11.6% of the total cancer cases, followed by colorectal cancers with 10.2%. Low human development index countries see greater mortality rates due to their delayed diagnosis and a lack of treatment [1]. Breast cancer detection can be accomplished in many ways, such as through thermography, mammography, CT scan, MRI, ultrasound, and biopsy. However, mammography techniques expose the human body to ionization radiation and it is difficult to detect cancer within a dense breast [2]. Additionally, mammography is used exclusively in some countries as a screening technique. Thermography is a non-invasive, relatively inexpensive method that is based on the investigation of the temperature profile on the breast surface. Thermography’s fundamentals are based on the constant emissivity of human skin temperature and the measurement of infrared radiation emitted by objects with a temperature greater than absolute zero. These enable the determination of the skin’s temperature profile via the infrared radiation emitted by humans [3]. Breast cancer has a higher metabolic rate and a higher heat generation rate than normal cells, so infrared thermography is sensitive enough to detect or flag a cancer cell growth through tiny temperature contrast [4]. Medical infrared thermography can be utilized in breast abnormality detection because of advantages such as its radiation-free, non-invasive, and painless nature. It is an alternative breast imaging modality that can detect minute early changes or tumors that cannot be detected by X-ray mammography at this stage. Thermography, however, has its limitations. The resolution of thermography is limited by the size of the detector used to measure infra-red radiation. This can result in a lack of detail in the images produced. Further, thermal cameras have a limited temperature range that they can measure accurately. This may make it difficult to measure temperatures outside of this range or in objects with extreme temperatures [5]. However, this does not limit their use as an added diagnostic tool that completements existing techniques, such as X-ray mammography, available for medical specialists.
2. Related Work
The authors in [6] used a semicircular breast with a length of 7.2 cm from the nipple to the central breast, with the skin, fatty tissue, muscle fat, glands layer, and muscle with the thoracic wall measured at 1.5 cm, 3.5 cm, 5 cm, and 7.2 cm from the nipple, respectively. The Crank Nicolson method was used to obtain the required nodal temperatures. The results indicated that body temperature rises by 1.42 °C, 0.35 °C, and 0.15 °C more than the healthy cell of the breast, when tumors are placed deep at 1.5 cm, 2.5 cm, and 3 cm below the nipple, respectively. According to the temperature profile, the breast skin surface temperature rises when the tumor is located closer to the surface of the skin and declines when it is located deep in the breast.
Studies conducted by [7] used a mannequin’s breast with a length of 80 cm, a chest measurement of 83.8 cm, and a waist measurement of 63.5 cm. Fluke Ti29 thermographic cameras were used to observe the different temperatures of silicone breasts. Moreover, tumors were used in the silicon breast with different sizes of 0.75 cm, 1.11 cm, and 1.5 cm, respectively. In addition, the thermophysical properties of the breast were analyzed, such as skin surface temperature, tumor, and bioheat by using the Pennes equation. The results show that the tumor within the breast produces various temperatures based on analytical results, such as the tumor position, breast shape, and size.
In [8], researchers used a strong table with a small hole (size 22.86 cm) for breast imaging where the patient lies on the table. First, a clinical procedure is required for the patient, such as undressing, lying on the imaging table for 10 min with one breast placed in the hole, and replicating the procedure on the other breast. Then, thermal images were taken within 1.5 and 2 min for each breast. Finally, Pennes’ bioheat equation and ANSYS software were utilized to study thermophysical properties and numerical simulation of temperature variation on the breast skin surface and tumor. The screening method is quick, precise, and has proven to be a useful complement in breast cancer detection, especially for dense-tissue breasts. The study in [9] included 26 patients who had tumors. In addition, a gel bag at 4 to 8 degrees was used in the breast area for 2 min and thermal images were taken for each patient. Then, the breast skin surface was examined for at least 2 min to look for a thermal recovery response. Thermal images were evaluated using SmartViewTM Desktop Software application v4.3. The results were analyzed using SPSS software. Finally, sensitivity, specificity, and positive and negative predictive scores were calculated for each thermal imaging, and a p value less than 0.05 was considered as statistically significant. The results illustrate that the sensitivity and false-negative rates were 83% and 16%, respectively.
Thermal imaging was utilized in [10] as a non-radiative technique for measuring thermophysical properties in normal female breasts in China. Additionally, 35 patients who had sequential IRTI and mammography (without those who have positive results on clinical examination or mammography) were assessed, and each breast was analyzed as a separate instance. Moreover, the warmth of the breasts was recorded in the upper outer quadrant (Q1), lower outer quadrant (Q2), lower inner quadrant (Q3), higher inner quadrant (Q4), center region (CR), and breast region (BR). Analytical statistics SPSS 16.0 was used to conduct statistical analysis. Additionally, average and standard deviation were utilized to express the measurement data. The BMI, breast gland, and skin temperature were analyzed using descriptive statistical analysis and t-tests. In addition, BMI, mucosal tissue types, and skin temperature were calculated using Spearman correlation analysis. The results showed that normal women’s breast temperatures were equal and had similar average temperatures on both sides. The nipple has the lowest temperature compared to all breast areas and temperatures in the bilateral axillary, and inframammary folds were very high. In [11], studied heat distribution on the breast skin surface using different sizes of tumors in different locations (1 cm, 1.5 cm, and 2 cm) in the center of the breast, i.e., tumor depth variation. Moreover, the properties of the healthy breast thermogram, including blood flow, thermal transfer, and fat layer thickness were analyzed using the bioheat Pennes equation and COMSOL 4.3 b software. The results show that the surface temperature of the breast was changed according to size, position, metabolism, blood perfusion, and thermal transfer of the tumor in the breast. Finally, because of these findings, it is possible to estimate the geometric center of cancers from thermal images without knowing exactly the size, metabolism, blood flow, or thermal transfer of cancer.
The researchers in [12] used a specific protocol to take thermal images from patients, with patients undressed above the waist and sitting approximately 1 m away from the infrared camera. Additionally, FLIR Research IR Max 4.40.8.28 software was used to analyze thermal images that were preprocessed in MATLAB 2019b. Furthermore, the bioheat Pennes equation, COMSOL 5.4 software, and ANSYS Fluent 2019 R2 software were used to compare the results. The results illustrate that the patient had an average temperature difference between breasts of 1.2 °C. In addition to overall hyperthermia, the patient’s left breast had three distributed areas of heightened temperature: the nipple region (roughly 8 cm), over the nipple, and (roughly 5 cm) in the middle of the nipple. The underlying cancerous lesion created the nipple and superior hotspots; that is, the malignancy was exactly behind these two locations.
Authors in [13] created and modeled extremely dense and mostly fatty dense breasts. Moreover, the bioheat Pennes equation and COMSOL 4.4 software were utilized to study thermophysical properties and numerical simulations for tumor and breast skin surface temperature. Additionally, the temperature values along all skin surfaces of the breast were recorded. Moreover, the surface temperature at the peaks was calculated, and several thermal pictures were compared. The results show that there was a change in temperature peak whether the tumor was placed distant from the center of the breast or near the skin. Finally, when using thermography for early breast cancer diagnosis, the size and location of the tumor at various degrees of breast density should be regarded as a significant contributor to the thermal profile of the breast. The research in [14] suggested a highly simple numerical two-dimensional finite element techniques model by using clinical ultrasonography data for breasts. A FLIR ThermaCAMTM S45 thermal infrared camera was used to take thermal images for the patient at a 1-m distance, which were then evaluated using the FLIR Research IRTM Toolbox. Besides that, the bioheat Pennes equation and COMSOL 4.4 software were utilized. Furthermore, the mean value of temperature for the left and right breasts was measured. The simulation model includes two types of cancers (benign and malignant) as well as different rates of the heat transfer rate of benign and malignant cancers. According to the numerical simulations, the variations in thermal conductivity on the breast skin in the presence of a tumor can range between 0.5 °C and 3 °C in contrast to healthy breasts, based on the tumor distance from the skin surface, size, and cancer type.
For several researchers, such as [15], thermography has been used as a diagnostic technique in the detection of tumors in young patients. Additionally, a relation between breast heat transfer and the age of the patient was suggested. Furthermore, the mathematical calculation was conducted by using the commercial Computational Fluid Dynamics application FLUENT, along with the bioheat Pennes equation, which utilized the finite element method. Moreover, the inverse heat transfer problem was solved using sequential quadratic programming to determine the thermal conductivity and blood perfusion of breast tissues and cancers. The data confirmed through the implementation of the research technique demonstrated that thermophysical properties can be estimated using infrared images. Finally, the empirical correlation between breast thermal conductivity and patient age provided a satisfactory response for the cases analyzed. Studies conducted by [16] refer to the use of numerical simulations of breast cancer using the Pennes equation and COMSOL software to analyze the temperature change of breast surface and factors that affect temperature variation. In addition, two locations of cancer were used in the breast, with depths of 4.5 cm and 5.5 cm. Moreover, normal- and high-density breast tissue were specified with tumors with different sizes of 1 cm, 1.5 cm, 2 cm, and 2.5 cm. In addition to simulating breast layers, perfusion rate, density, and the specific heat capacity of the blood were also simulated. The results indicated that the temperature range changed on the surface of the breast from 0.1 °C to 1.41 °C.
In [17], researchers referred to the development of a standard protocol for taking thermal images and the challenges facing numerical calculation in the changing temperature in healthy breasts. In addition, a 43 m2 room was used to take thermal images from the patients, with a 1-m distance from the thermal camera, while adjusting room humidity and temperature. Moreover, breast tissue density was added in order to study physical parameters using ultrasound. Additionally, the software FLUENTTM was used to simulate numerical factors affecting temperature changes of the breast surface. The software analyses thermographic images enable the temperature at any point of an acquired digital image to be known. The results showed that it is possible to determine these physical properties using the maximum temperature from the program. The work in [18] used numerical simulation of factors that affect heat transfer, such as specific mass, specific heat, blood perfusion rate, and thermal conductivity of the tissue. In addition, the COMSOL program and Pennes equation for thermal representation were used, and factors affecting heat transfer in the breast were studied. However, only three positions were used to simulate breast cancer to a depth of up to 3.8 cm. In addition, the values of these factors were changed to study the change in heat transfer to the surface of the breast. Moreover, a thermal camera was used to take thermal images of fake tissue equipped with electrical resistors to simulate the effect of breast cancer heat. The results indicated that the thermal conduction of healthy tissue surrounding the tumor does not affect tumor location, with an error rate up to ±1 mm.
The researcher in [19] simulated breast cancer in terms of tumor size and location in the breast, using the COMSOL software. In addition, the Pennes bioheat transfer equation and artificial networks were used to achieve high detection accuracy. In addition, heat was generated to simulate the tumor in two models. The first generates a constant temperature and the second generates variable heat, thereby generating 447 temperature data vectors in each case. Moreover, different values of noise were added to thermal images. The results indicated that the detection accuracy of breast cancer is 98% using artificial intelligence networks. In addition, given that the breast thermogram is within 0.1 noise levels, a neural network approach can be adopted to retrieve the tumor location and radius with reasonable accuracy. The study’s main goal in [20] was to identify and calculate the geometric centers of breast tumors using skin surface temperatures. To determine the distribution of skin temperature among the three main forms of breast cancer, the 2D anatomical geometry of the breast was simulated using COMSOL software. However, the simulated temperature values included 2% of errors. Additional temperature profiles were obtained without any prior information on the tumor’s thermophysical characteristics or the exception of the average values of thermal conductivity and perfusion of layers of healthy breast tissue. The results showed that the error rate of tumor location was 0.32 cm.
In [21], the realistic female torso model is used. In addition, the thermal simulation of a realistic torso was carried out using COMSOL software and a bioheat transfer equation. This Bennis bioheat equation is used to calculate the temperature distribution over the breast surface. Moreover, the first simulation without a tumor or cyst was performed to compare the results of the thermal simulation with the real thermal properties of a healthy woman. This distinctive thermal pattern consists of a warmer area in the upper part of the breast and torso, and a colder area in the lower breast. The nipple is the coldest area of the breast; the ability to model this thermal pattern will allow for a more accurate prediction. The results indicate simulations of benign breast tumors and masses resulted in a 20% deviation from the thermal simulation using a hemispherical model of the breast. Finally, simulations can be useful to better understand thermal processes that occur in the breast and can be useful in distinguishing between benign and malignant breast lumps from refractory patterns. Studies conducted in [22] utilized the Pennes equation and the COMSOL program to simulate a three-dimensional model of the natural breast. The simulation consisted of three stages of thermal procedure: stationary, hypothermia, and thermal recovery. The surface temperature of the breast was adjusted to four different values: 0, 5, 10, and 15 degrees Celsius to reflect the changes in temperature that occur when the body temperature drops. Additionally, refrigeration was applied for a duration of 20 min to observe the thermal recovery after the refrigeration was removed. The findings indicate that cooling the breast to 0 degrees Celsius can increase the thermal contrast percentage by 136% when utilizing a thermal camera to detect a tumor with a diameter of 1 cm. If the same tumor is positioned in a deeper area, the thermal contrast percentage reached 37%. The researchers in [14] proposed a highly simplified numerical 2D FEM model constructed based on the clinical ultrasound data of breasts, which is inexpensive and available in real-time, unlike MRI data. Moreover, the database used for ultrasound was derived from 14 women. The results indicated the potential for classifying healthy breast types in accordance with clinical classification and thermal results. Furthermore, the results demonstrated that the numerical simulation successfully monitored the temperature difference on the surface of the breast, ranging from 3 °C to 0.5 °C. A comprehensive literature review study on the application of thermography in conjunction with artificial inelegance to facilitate early breast cancer detection is presented in [4], while the thermal and physiological properties of human breast tissue are reviewed in [23].
3. Motivation and Novelty
Currently, several imaging modalities, particularly mammography, magnetic resonance imaging, and ultrasonography, are helpful in the diagnosis of different forms of cancer. The primary breast cancer screening method, mammography, has several drawbacks, such as the release of ionizing radiation and a high rate of false-negative or false-positive results. It is particularly ineffective for people with dense breasts, especially young women. As a result, the findings of this study offer helpful simplifications for the early diagnosis of breast cancer using infrared thermography, given that one of the major limitations in the estimation of tumors from thermographic images is related to the challenges of previously knowing the thermophysical properties of human tissues. Moreover, most of the research papers studied thermophysical characteristics in normal breast size, while this study has considered different breast sizes. The findings were further validated using experimental setups, and the use of situ-cooling to provide better temperature contrast was also studied.
4. Contribution
This paper aims to investigate the use of numerical simulation in conjunction with thermography for the detection of breast cancer. It studies tumors at different locations of the breast area and the effect of the physical properties of the tumor on the surface temperature of breast skin. The study is divided into two parts: the first part examines the effect of tumor heat generation on the surface temperature of the breast at different locations by using the bioheat Pennes equation [24] and COMSOL 5.3 software. The study considered a variety of thermophysical characteristics, including the size and shape of the breast, tumor size, and position within the breast. The effects of tumor properties on the breast surface temperature profiles are investigated through this work, and findings may contribute to the advancement of thermography-based breast cancer detection. The main contributions of this paper are as follows. To accommodate women’s breasts in terms of size and tissue density, a large and dense tissue breast type was modeled using the extra fine mesh in COMSOL, instead of the normal mesh model used in previous studies. Additionally, a large size of the breast of approximately 17 cm was used, and thermophysical properties were analyzed. The second part uses an infrared camera and a situ-cooling gel to investigate the temperature profiles on the surface of healthy and tumorous anthropomorphic silicone breast models. The results were evaluated using the FLIR Research IRTM Toolbox. The cooling gel was used to study thermal variation and its effect to increase the detection accuracy of breast cancer at an early stage. In addition, nine different tumor locations, with different 3D cartesian coordinates to accommodate for depth and position, were studied.
5. Materials and Methods
Both experiments and simulations are important in detecting breast cancer because they serve different purposes and can provide complementary insights into the disease. Experiments involve collecting data from real-world observations or measurements, such as imaging techniques such as thermography. This data can provide indicative evidence of the possibility of the presence or absence of cancerous cells or tumors in the breast tissue, which can then be used to make a diagnosis. Simulations, on the other hand, involve creating computer models of breast tissue and simulating the behavior of cancerous cells or tumors in that model. Simulations can help researchers and doctors to understand the underlying mechanisms of cancer growth and to test the effectiveness of new diagnostic methods in a controlled and repeatable environment. By combining data from experiments with insights from simulations, researchers and doctors can gain a more comprehensive understanding of breast cancer and develop more effective diagnostic strategies. Capitalizing on the above argument, the research presented in this manuscript follows both approaches. First, a simulation model for breast cancer was developed using COMSOL. The developed model was designed such that the thermophysical properties of different breast sizes can be studied. An analysis is then followed to examine how changes in tumor location depth, size, metabolism, blood flow, and heat conductivity affect the different-sized breast skin surface temperature. The details of the breast model used in the COMSOL and the varied thermophysical properties studied are presented below in Section 5.1 and Section 5.2. Second, an experiment to emulate the presence and absence of breast cancer was conducted using a silicon breast mounted on a mannequin and fitted with a LED light bulb. Using the assumption that the presence, absence, shape, and size of the tumor, as well as the thickness of the different layers beneath the breast skin, are represented by the amount of heat generated from the LED lying deep underneath the silicon breast. The exact location of the LED, however, is the exact same location assumed in the COMSOL simulation. By carefully varying the intensity of the LED light, through a voltage control circuit, the equivalent heat level is generated and detected using the FLIR One Pro thermal camera mounted in front the silicon breast at a one-meter distance. More details of the experiment are presented in Section 5.3. Finally, the heat detected from the emulation experiment is compared to the one produced by the COMSOL simulation model as a function of tumor size and location. This has facilitated detecting the minute temperature contrast attributed to the different thermophysical properties of the breast, as discussed below in Section 6.
5.1. Mathematical Modeling
The Pennes equation is a mathematical equation that describes the transfer of heat in biological tissue. The equation was first proposed by Gunnar Pennes, a Norwegian physicist, in 1948 [24]. It is used to model the heat transfer between blood vessels and surrounding tissue in the body. It takes into account various factors, such as blood flow, metabolic heat generation, and tissue perfusion. The equation states that the rate of heat transfer is proportional to the temperature difference between the blood and surrounding tissue, as well as the blood flow rate, tissue perfusion rate, and metabolic heat generation. The equation also includes a term for thermal conductivity, which describes the ability of tissue to conduct heat. The Pennes equation is often used in medical applications, such as hyperthermia treatments for cancer. It can help predict the temperature distribution in tissue during treatment, which can help optimize treatment parameters and avoid overheating or underheating of the tissue [25]. Overall, the Pennes equation provides a mathematical framework for understanding and modelling the heat transfer in biological tissue, which has important implications for medical treatments and other applications.
There are four layers in the breast and tumor, so there are five values for I, which are as follows: muscle, i = 1; gland, i = 2; fat, i = 3; skin, i = 4; and tumor, i = 5. In addition, there are two other variables: blood perfusion rate, , and thermal conductivity of the tissues, , as well as the specific mass, , the specific heat, , and the arterial temperature of the blood, Tb. Furthermore, in each tissue layer, there are metabolic heat generation, , and temperature, Ti.
The equation is a form of the heat transfer equation, which describes how energy is transferred through a medium. Here is an explanation of each term in the equation:
- ki is the thermal conductivity of the material in which the temperature field, Ti, is defined.
- is the Laplacian operator of the temperature field, Ti,, which describes how the temperature varies spatially.
- Pb is the density of the surrounding fluid or medium, and Cb is its specific heat capacity. The term Pb Cb represents the thermal capacity of the medium.
- ωb,i is the volume fraction of the fluid or medium in which the temperature field, Ti, is defined.
- Tb is the temperature of the surrounding fluid or medium, and Qi is any heat source within the breast in which the temperature field, Ti, is defined.
Together, these terms describe how energy is transferred through a material and its surroundings. The first term on the left-hand side represents heat conduction within the material, while the second term represents the exchange of energy between the material and its surroundings due to convection. The term Qi represents any internal heat sources within the breast. By solving this equation, one can determine the temperature distribution within a breast as it interacts with its surroundings.
Equation (1) can be solved by suitable boundary conditions on the breast skin, temperature, and heat flux continuity conditions at each tissue layer. Core body temperature was determined in the lower layer of the muscle, and the heat flux at the lower layer of the skin was taken as zero. In addition, the skin surface is subjected to convection.
The following equation shows the continuum of temperature and heat flux between tissue layers:
The muscle layer remains at a constant temperature of 37 degrees, but the layer adjacent to the muscle is as follows:
The thermal boundary condition on the breast skin is specified as
where h is the thermal convection coefficient and was 5 (W/m2K); room temperature was 25 °C. For a steady-state problem, mash density, breast size, and situ cooling are easier tasks compared to transient issues. The variation to extra fine mesh was conducted in less than 0.5% difference in outcomes; therefore, the selected mesh, breast size, and situ cooling were suitable for our evaluation.
5.2. Thermophysical Characteristics of the Simluated Breast Model
The heat transfer system is depicted in Figure 1, Equation (1), and their associated boundary conditions were solved by utilizing COMSOL Multiphysics 5.3 software. Moreover, the sizes and properties of the tissue are listed in Table 1. COMSOL’s bioheat transfer system was used to simulate thermophysical properties and boundary conditions. Extra fine mesh size was used because it was appropriate for breast tissues with a high density of the breast. A previous study proposed estimating breast tumors from surface-level temperature changes by relying on theoretical calculations that employ some form of the optimization process to identify tumor characteristic features such as depth, size, heat generation, thermal conductivity, and blood perfusion. However, such features were typically estimated based on a variety of other thermal conductivities of cancer and healthy tissue. In Figure 2, the hemispherical 3D breast model is represented numerically by a mesh. Breast tissue is composed of multiple layers. The thermal model of the breast was analyzed in various scenarios in this project. The surface temperature on the breast skin was reviewed first, followed by the change in temperature between tumor cells and healthy breasts. Finally, the normalized temperature changes were evaluated.
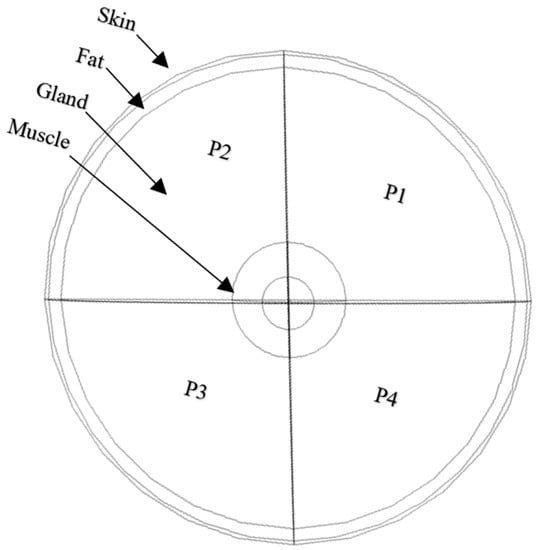
Figure 1.
Breast tissues layers and partitions.

Table 1.
Biological tissues layers of the breast [11,26,27,28] used in COMSOL simulation model.
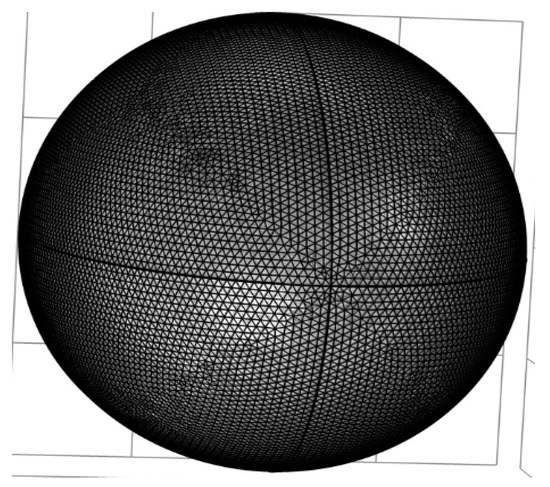
Figure 2.
Breast extra fine mesh.
In the literature reviews, most of the studies suggest tumors in the breast from surface temperatures, which are based on numerical simulation using some optimization methods. All of the following are required in order to identify the characteristics of tumors: depth, size, heat generation, thermal conductivity, and blood perfusion. This study examines the breast’s characteristics under various conditions. This study first examines the thermal form of the skin of the breast. It then compares the breast thermal images with cancer and without cancer. Finally, it evaluates the standard thermal changes by separating each temperature by its specific high rate. This study carries out the following analysis steps:
- It examines the changes in tumor location by analyzing thermal profiles on the breast surface for nine different scenarios in which the tumor is located at nine different depths, as depicted in Figure 3 as tumors T1–T9.
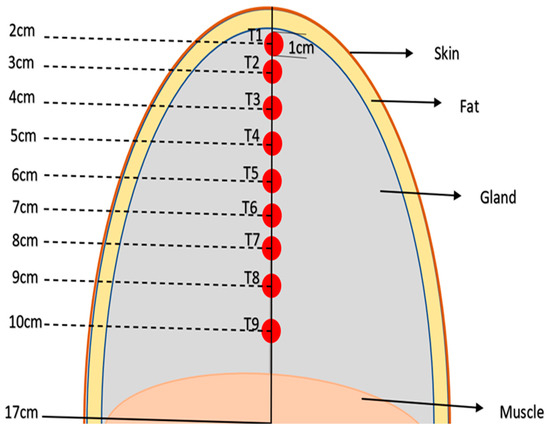 Figure 3. Diagram of different tissue layers and different tumor depths (T1, …T9) in the simulated breast model.
 - It examines the changes in tumor size by analyzing three various tumor sizes at the same geometric center, T3, and the diameter of tumor T3 was changed from 2 cm, 1 cm, and 0.5 cm with the same settings.
- It examines the temperature production of a tumor (T3) by evaluating three various temperature generation rates: 29,500, 50,500, and 65,900 W/m3. These values were chosen according to previous research on tumor temperature creation.
- It investigates the blood flow in a tumor (T3) by analyzing three various values of blood flow rates: , , and , per second. These rates were selected by taking the high and low rates from the average value reported in previous studies.
- It analyses the thermal conductivity of T3 in the breast and looks at three different values, which are , , and , (W/mK). These rates were determined by taking the range of thermal conductivity values found in the literature and selecting high and low values.
- It examines the blood flow in the normal breast by evaluating three various values of blood flow rate. It would be clearer to specify that the study examines the blood flow in all layers of the normal breast tissue, assuming they are equal to values of , and , per second, and compares the heat of the T3 tumor on the breast skin to the primary blood flow settings to see if there is any change.
- Finally, the study evaluates the thermal conductivity of the normal breast by using three various values of the thermal conductivity coefficient in the normal layers of the breast. The study considers the thermal conductivity of the layers in the normal breast to be equal to 210 and 480 milli (W/mK) and compares the heat conduct in the T3 tumor on the skin to the initial thermal conductivity tuning in Table 1 to see if there is any change. Figure 4 shows the steps involved in the proposed work approach.
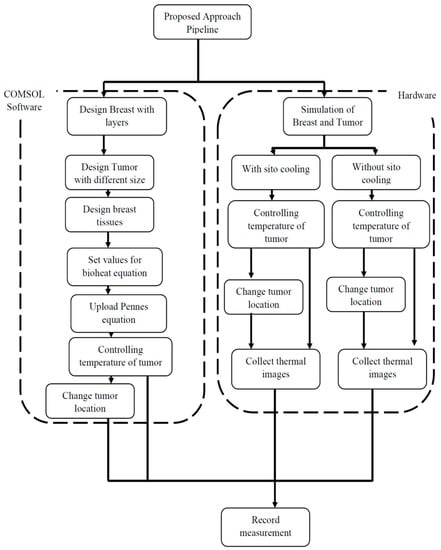 Figure 4. Proposed COMSOL simulation approach.
5.3. Breast Cancer Emulation Experiment
Figure 5 shows breasts on a 1.5 m high mannequin; 0.6 m chest and 0.4 m waist dimensions were used, as shown in Figure 1. Furthermore, different locations of cancer were defined and quantified using predefined X, Y, and Z coordinates, as shown in Figure 2. In this research, a FLIR One Pro thermographic camera, connected to a mobile phone, was utilized to monitor temperature variations on the silicone breasts’ surfaces. The FLIR One Pro is a thermal imaging camera that is designed to attach to a smartphone, allowing users to capture and analyze thermal images and videos. The camera uses a combination of thermal and visible light cameras to create images that highlight temperature differences in the scene. The thermal camera has a temperature range of −4 °F to 752 °F (−20 °C to 400 °C) and a thermal sensitivity of 70 mK, and it can detect temperature differences as small as 0.18 °F (0.1 °C). The camera has a resolution of 160 × 120 pixels, with a thermal pixel size of 12 µm, frame rate of 8.7 Hz, focus range of 15 cm–infinity, a wavelength spectral range of 8–14 µm, and a field of view of 55 degrees. The FLIR One Pro also includes features such as adjustable thermal span and level, as well as FLIR’s patented MSX technology, which overlays visible light details onto thermal images to provide additional context [29]. Additionally, the infra-red camera recorded the temperature profiles of a silicone breast every 5 min, and these images can be downloaded onto a PC. In addition, the room temperature was kept between 22 °C and 26 °C while using situ-cooling gel. The distance between the FLIR camera and the breast was 1 m. Finally, tumor size was set to 1 cm and located at different positions in the breast, with depths of 2 cm, 3 cm, 4 cm, 5 cm, 6 cm, 7 cm, 8 cm, 9 cm, and 10 cm.
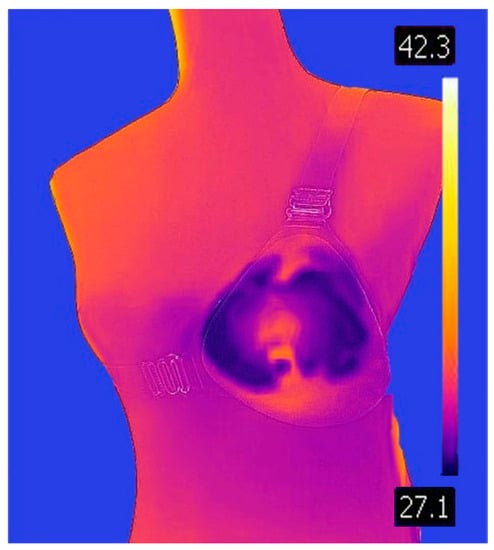
Figure 5.
Anthropomorphic with Breast silicone (temperature degrees in Celsius).
Figure 6 shows the above-mentioned mannequin measurements while simulating the level of the human chest. In addition, a silicone breast, 17 cm in length, was used. In addition, a lamp with a 1-cm diameter was utilized to simulate the tumor (12 volts and 5 watts) and connected to a DC power supply to change voltage values on a set of different measurements. Internal sensors were placed with the tumor and on the breast’s surface to record temperature values with voltage change. However, two holders were used (one to hold a lamp inside the breast according to the required coordinates and the other to hold the thermal camera. Additionally, a thermal camera was placed one meter away from the mannequin, and a cooling gel with an area of 50 cm was added to cool the surface of the breast.
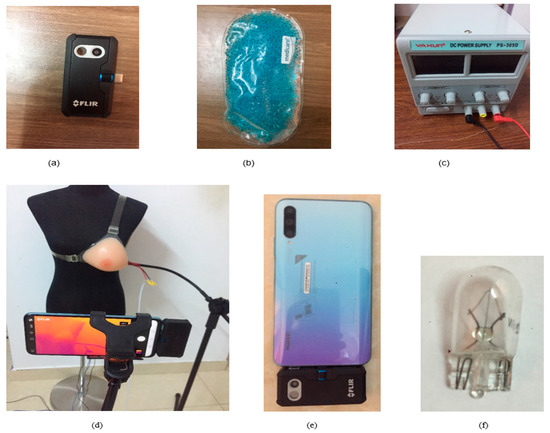
Figure 6.
Materials used: (a) FLIR One Pro thermal camera, (b) cooling gel, (c) DC power supply, (d) 1-m distance between the breast and the thermal camera, (e) FLIR One Pro connected to mobile phone, and (f) lamp (12 V, 5 W) with 1 cm Diameter.
6. Results
The effect of different thermophysical properties of the breast on the breast surface temperature using the COMSOL simulation model is studied below. Figure 7 shows the steady-state distribution of skin temperatures on the healthy breast surface, Figure 7a, and unhealthy breast (with tumor size 1 cm and depth 2 cm), Figure 7b. Because the unhealthy breast has a tumor depth of 2 cm from the skin of the breast, this modulation is capable of increasing the skin temperature to around 1 °C. Figure 8 shows tumor location emulated image captured with thermal camera and simulated in COMSOL.
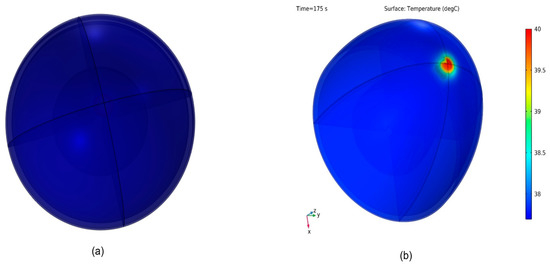
Figure 7.
Temperature distribution in the breast: (a) normal breast, (b) abnormal breast.
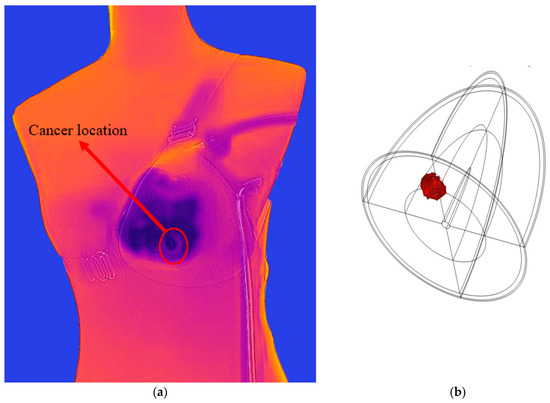
Figure 8.
Tumor location (a) emulated image captured with thermal camera and (b) simulated in COMSOL.
6.1. The Effect of Tumor Depth
Figure 9 illustrates the skin temperatures for the simulations model of an unhealthy breast. In addition, each tumor has a different thermal form, and when it is deeper from the breast surface, the temperature between the tumor and the healthy surface is almost the same. Therefore, it will be difficult to detect cancer. This study aimed to explore the association between tumor depth variation in the breast and corresponding changes in skin surface temperature. Table 2 presents the measured skin surface temperatures and the corresponding temperature variations from the healthy breast for each tumor location and breast size. The healthy breast exhibited a consistent skin surface temperatures of 33.35 °C across all breast sizes. As tumor depth increased, the temperature variations from the healthy breast also increased gradually. For the T1 tumor location, a temperature variation of 0.99 °C (2.97%) was observed at 7.5 cm depth, increasing to 0.98 °C (2.94%) and 0.97 °C (2.91%) at 10 cm and 17 cm depths, respectively. The temperature variations showed a similar increasing trend for T2, T3, and T4 tumor locations, with corresponding percentages of 2.67%, 2.49%, and 1.95%, respectively. At deeper tumor locations (T5, T6, T7, T8, and T9), the temperature variations exhibited relatively smaller increments. For instance, at 17 cm depth, the temperature variation for T5, T6, T7, T8, and T9 were 0.46 °C (1.38%), 0.32 °C (0.96%), 0.21 °C (0.63%), 0.11 °C (0.33%), and 0.02 °C (0.06%), respectively.
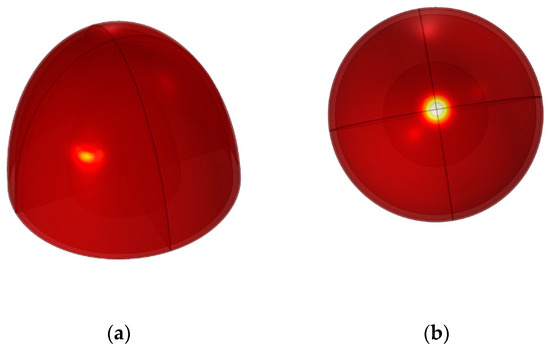
Figure 9.
Tumor in different positions in the breast: (a) tumor T8, (b) tumor T1.
Table 2.
Tumor depth variation in the breast.
6.2. The Effect of Tumor Size
The findings in Table 3 reveal the relationship between tumor size, breast size, and skin surface temperature at various depths within the breast tissue. It is interesting to note that the skin temperature varies according to variations in tumor size and breast size. Specifically, in Table 3a at the surficial T1 depth of 2 cm, the temperature variations range from 0.73 °C (2.19%) for a tumor size of 0.5 cm and a smallest breast size of 7.5 cm to 1.75 °C (5.25%) for a tumor size of 2 cm and a largest breast size of 17 cm. Similarly, at T3 depth in Table 3b, the temperature variations range from 0.02 °C (0.06%) to 1.15 °C (3.45%), and at the T9 10 cm depth, in Table 3c, they range from 0.02 °C (0.06%) to 0.35 °C (1.05%). The results indicate that as the tumor size increases, there is a corresponding increase in the skin surface temperature. However, the temperature variations are relatively smaller compared to the variations observed at shallower depths (T1 and T3). In addition, tumor size at T9 (10 cm) depth causes a limited change in skin surface temperature compared to surficial shallower tumor depths. However, increasing breast size causes the breast skin temperature to decrease due to the large skin surface area that allows for further heat transfer and lesser skin surface heat. This is of course true for any tumor size. On the other hand, Increasing the tumor size generates more heat and causes the breast skin surface temperature to rise, regardless of the breast size.
Table 3.
(a) Tumor size variation on the breast at T1 (2 cm) depth, (b) tumor size variation on the breast at T3 (4 cm) depth, and (c) tumor size variation on the breast at T9 (10 cm) depth.
6.3. The Effect of Tumor Metabolism
Table 4 provides insights into the relationship between tumor heat generation and skin surface temperature at different depths within the breast tissue and for different breast sizes (e.g., different breast surface areas). At T1 depth in Table 4a, the temperature variations range from 0.74 °C (2.22%) for a tumor heat generation rate of 29,000 W/m3 on the smallest breast size of 7.5 cm to 0.86 °C (2.58%) for a rate of 65,500 W/m3 and largest breast size of 17 cm. Whereas at T3 depth in Table 4b, the temperature variations range from 0.18 °C (0.54%) to 0.31 °C (0.93%), and at T9 depth in Table 4c, they range from 0.02 °C (0.06%) to 0.05 °C (0.15%). These results show that as the tumor heat generation rate increases, the detectable temperature variations from the healthy breast also increase. This suggests that tumor characteristics, such as their metabolic activity and heat generation, can influence the skin surface temperature. However, as the tumor depth increases from 2 cm to 10 cm beneath the skin, its detectability ranges from difficult to not possible (see Table 4c). Furthermore, increasing the breast size also decreases the detectable breast surface temperature, making the detection of the tumor presence more difficult. The fact is that deeply located tumors beneath the skin pose a challenge to patients with larger breast sizes, but their chances of detecting the presence of the tumor is still better than patients with smaller breast size. However, monitoring these temperature variations progression regularly over time can potentially aid in the detection and assessment of breast tumors.
Table 4.
(a) Tumor heat generation on the breast (T1 depth), (b) tumor heat generation on the breast (T3 depth), and (c) tumor heat generation on the breast (T9 depth).
6.4. The Effect of Tumor Blood Perfusion
Table 5 shows the temperature variations resulting from different tumor blood perfusion rates at different depths within the breast tissue and different breast sizes. At T1 depth and for a small breast size of 7.5 cm, the temperature variations range from 0.88 °C (2.64%) for a tumor blood perfusion rate of s−1 to 0.04 °C (0.12%) for a rate of s−1. Similarly, at T3 depth, the temperature variations range from 0.85 °C (2.55%) to 0.02 °C (0.06%). However, at T9 of 10 cm depth, no temperature variation is detected at all for a small breast size of 7.5 cm. Only a difference of 0.01–0.03 °C can be detected for larger breast sizes of 10 cm and 17 cm. Albeit slightly different, increasing either blood perfusion rate or the breast size leads to decreased detectability of temperature variation on the skin surface of the breast. Finally, it is worth noting that the negative correlation between breast size and temperature variations on the breast skin persists, with larger breasts showing relatively smaller detectable temperature.
Table 5.
(a) Tumor blood perfusion (T1 depth), (b) tumor blood perfusion (T3 depth), and (c) tumor blood perfusion (T9 depth).
6.5. The Effect of Tumor Thermal Conductivity
Table 6 shows the relationship between tumor thermal conductivity and skin surface temperature at different depths within the breast tissue and different breast sizes. At T1 depth, the temperature variations range from 0.82 °C (2.46%) for a tumor thermal conductivity of 5 milli (W/mK) and a small breast size of 7.5 cm to 1.12 °C (3.36%) for a conductivity of 1000 (W/mK) and a large breast size of 17 cm. Similarly, at T3 depth, the temperature variations range from 0.74 °C (2.22%) to 1.1 °C (3.3%). However, at T9 depth, they range from 0 °C (0%) variation to 0.09 °C (0.27%) variation. Temperature variations, however, are not detectable at this depth for the small breast size. These results indicate that as the tumor thermal conductivity increases, the temperature variations from the healthy breast also increase. Higher thermal conductivity allows for better heat transfer, leading to a more significant detectable temperature difference.
Table 6.
(a) Tumor thermal conductivity (T1 depth), (b) tumor thermal conductivity (T3 depth), and (c) tumor thermal conductivity (T9 depth).
Because the thermal conductivity of biological materials describes how well the material conducts heat, these results show that the tumor thermal conductivity has a similar behavioral trend as the tumor heat generation rate discussed above, and hence a similar argument applies. As the thermal conductivity increases, the detectable temperature variations from the healthy breast also increase. This suggests that tumor characteristics, such as their physical property of thermal conductivity, can influence the skin surface temperature. However, as the tumor depth or the breast size increases, its detectability ranges from difficult to challenging.
6.6. The Effect of Healthy Tissue Blood Perfusion Rate
The findings in Table 7 reveal the temperature variations caused by different healthy tissue blood perfusion rates at various depths within the breast tissue and breast sizes. At T1 depth, the temperature variations range from 0.9 °C (2.7%) for a blood perfusion rate of 0.16/s to 0.4 °C (1.2%) for a rate of 0.54/s. Similarly, at T3 depth, the temperature variations range from 0.87 °C (2.61%) to 0.2 °C (0.6%), whereas at T9 depth, they range from 0.85 °C (2.55%) to 0.1 °C (0.3%). However, breast size has no detectable effect on the breast surface temperature as the healthy tissue blood perfusion rate is increased. Increasing the tumor depth may also result in undetectable heat variation, especially for smaller breast sizes.
Table 7.
(a) Healthy tissue blood perfusion rate (T1 depth), (b) healthy tissue blood perfusion rate (T3 depth), and (c) healthy tissue blood perfusion rate (T9 depth).
6.7. The Effect of Healthy Tissue Thermal Conductivity
Understanding the thermal characteristics of healthy breast tissue is crucial for the accurate interpretation of temperature variations associated with breast abnormalities, such as tumors. This study focused on examining the thermal conductivity rates of healthy tissue at different depths within the breast. By establishing the baseline thermal properties, it becomes possible to differentiate between healthy and abnormal tissue, aiding in the detection and diagnosis of breast conditions. The study utilized a sample of breast sizes, ranging from 7.5 cm to 17 cm. Thermographic imaging was employed to measure the skin surface temperature at various depths, namely T1, T3, and T9. The temperature variations from the healthy breast were recorded for each breast size and depth. Table 8 presents the measured skin surface temperatures and the corresponding temperature variations from the healthy breast for each breast size and depth. For T1 depth, the skin surface temperature of healthy tissue remained consistent at 33.35 °C across all breast sizes. At this depth, the temperature variations increased gradually as breast size increased. For instance, at thermal conductivity of 210, the temperature variations were 0.98 °C (2.94%), 0.97 °C (2.91%), and 0.96 °C (2.88%) for 7.5 cm, 10 cm, and 17 cm depths, respectively. Similarly, for T3 depth, the skin surface temperature of healthy tissue remained stable at 33.35 °C. The temperature variations increased slightly as thermal conductivity increased, with percentages ranging from 2.49% to 2.82%. At T9 depth, the skin surface temperature of healthy tissue was not applicable (NA) because it represents a deeper region within the breast. However, the temperature variations from the healthy breast were recorded. As breast size increased, the temperature variations at T9 depth remained relatively small, with percentages ranging from 0.06% to 0.12%.
Table 8.
(a) Healthy tissue thermal conductivity rate (T1 depth), (b) healthy tissue thermal conductivity rate (T3 depth), and (c) healthy tissue thermal conductivity rate (T9 depth).
6.8. The Effect of Fat Layer Thickness
Table 9 illustrates the temperature variations caused by different fat layer thicknesses at various depths within the breast tissue. At T1 depth, the temperature variations range from 0.38 °C (1.14%) to 1.2 °C (3.6%) for a fat layer thickness of 3 mm to 9 mm, respectively. Similarly, at T3 depth, the temperature variations range from 0.24 °C (0.72%) to 1.1 °C (3.3%), and at T9 depth, they range from 0.01 °C (0.03%) to 0.55 °C (1.65%). These results suggest that as the fat layer thickness increases, the temperature variations between the breast skin temperature variations also increase. Thicker fat layers provide better insulation, resulting, however, in less heat transfer and smaller temperature differences between the two conditions. On the other hand, thinner fat layers allow for more heat transfer, leading to more significant temperature differences. On the other hand, increasing the breast size does not affect the observable surface temperature. Hence, it is the thickness of the fat layer that is more important than the breast size in determining the breast surface temperature variations.
Table 9.
(a) Fat layer thickness variation (T1 depth), (b) fat layer thickness variation (T3 depth), and (c) fat layer thickness variation (T9 depth).
6.9. The Effect of Heat Convection Coefficient
Table 10 presents the measured skin surface temperatures and the corresponding temperature variations from the healthy breast for each breast size and depth. The heat convection coefficient rates were calculated based on these temperature variations. At T1 depth, the heat convection coefficient rates ranged from 0.4 W/m2K to 11 W/m2K. As breast size increased, the heat convection coefficient rates increased accordingly. For instance, at a breast size of 5, the heat convection coefficient rates were 1 W/m2K, 0.99 W/m2K, and 0.98 W/m2K for 7.5 cm, 10 cm, and 17 cm depths, respectively. Similarly, at T3 depth, the heat convection coefficient rates ranged from 0.4 W/m2K to 11 W/m2K. The rates exhibited a slight increase with larger breast sizes. For a breast size of 5, the heat convection coefficient rates were 0.84 W/m2K, 0.83 W/m2K, and 0.82 W/m2K for 7.5 cm, 10 cm, and 17 cm depths, respectively. At T9 depth, the heat convection coefficient rates ranged from 0.4 W/m2K to 11 W/m2K. As breast size increased, the heat convection coefficient rates showed a consistent increase. For a breast size of 11, the rates were 1.1 W/m2K, 1.09 W/m2K, and 1.08 W/m2K for 7.5 cm, 10 cm, and 17 cm depths, respectively. The findings suggest that larger breast sizes tend to exhibit higher heat convection coefficient rates, indicating a potentially higher heat dissipation capacity. However, because the breast surface area is increased by increasing breast size, temperature variations on the skin decrease. This trend has been consistent throughout the different simulation studies conducted.
Table 10.
(a) Heat convection coefficient rate (T1 depth), (b) heat convection coefficient rate (T3 depth), and (c) heat convection coefficient rate (T9 depth).
6.10. The Effect of Ambient Air Temperature
The ambient air temperature plays a significant role in modulating the heat transfer processes occurring in the breast tissue. Understanding the relationship between ambient air temperature and skin surface temperature variations is important for accurate thermographic interpretations. A range of ambient air temperatures, ranging from 18 °C to 29 °C, was selected for the study. The temperature variations from the healthy breast were recorded for each breast size and depth. The ambient air temperature rates were calculated based on the temperature variations and the known values of the skin surface temperature. Table 11 presents the measured skin surface temperatures and the corresponding temperature variations from the healthy breast for each breast size and depth at different ambient air temperatures. The ambient air temperature rates were calculated based on these temperature variations.
Table 11.
(a) Ambient air temperature rate (T1 depth), (b) ambient air temperature rate (T3 depth), and (c) ambient air temperature rate (T9 depth).
At T1 depth, the ambient air temperature rates ranged from 18 °C to 29 °C. As the ambient air temperature increased, the skin surface temperature variations also increased. For instance, at an ambient air temperature of 22 °C, the temperature variations were 1 °C, 0.99 °C, and 0.98 °C for 7.5 cm, 10 cm, and 17 cm depths, respectively. Similarly, at T3 depth, the ambient air temperature rates ranged from 18 °C to 29 °C. The rates showed a consistent increase with higher ambient air temperatures. For an ambient air temperature of 29 °C, the temperature variations were 0.77 °C, 0.76 °C, and 0.75 °C for 7.5 cm, 10 cm, and 17 cm depths, respectively. At T9 depth, the ambient air temperature rates ranged from 18 °C to 29 °C. The rates exhibited minimal variations across different ambient air temperatures. For an ambient air temperature of 18 °C, the temperature variations were 0.17 °C, 0.08 °C, and 0.02 °C for 7.5 cm, 10 cm, and 17 cm depths, respectively. The ambient air temperature has a significant influence on the skin surface temperature variations within the breast tissue. Higher ambient air temperatures result in increased temperature variations, indicating a greater heat exchange between the skin surface and the environment. This suggests that external temperature plays a role in modulating the thermoregulation processes of the breast and motivates the use of situ-cooling, as presented in the emulation experiment results below in Section 6.11.
6.11. The Emulation Experimental Results
Throughout the simulation studies presented above, it was a consistent trend that larger breast size with larger breast surface area tends to spread out more heat and, hence, reduces the focal skin temperature. In Fact, in many presented results, small breast size might, when combined with deep tumor location (e.g., T9), render the breast skin surface temperature variation non-existent. This repetitive result renders detecting temperature abnormalities on the skin a challenging task, if not impossible.
This has motivated us to study the added advantage of applying situ-cooling to the breast surface area to provide a sharper temperature contrast that can help detect these temperature abnormalities more accurately and render them well announced.
Furthermore, so far, the two most pronounced parameters affecting the breast skin surface temperature variations are the tumor size and the depth of the location. Hence, the designed emulation experiment conducted serves to prove this hypothesis by studying both effects. The tumor size variations are emulated using different applied voltage to the LED to control its intensity and hence its generated heat. This emulated source of heat is varied by varying the applied voltage to it (such that 0 v represents the case of a healthy breast and any other voltage applied represent the varied tumor size of an unhealthy breast). Once the applied voltage is changed at a rate of 0.5 volt per step, the measurements using the camera sensor for the breast skin temperature is conducted only once the reading on the sensor stabilizes (e.g., usually a delay between 1–2 min to allow for the chemical reaction to take place). Furthermore, the depth of the LED is also varied from T1, 2 cm depth, to T9, 10 cm. This is to facilitate some degree of correlation between the results obtained by the simulation results above and the experimental results below.
Figure 10 shows the temperature difference between healthy and worst-case unhealthy breast (e.g., when applied voltage is at its maximum of 10 v during the emulation experiment) without the use of situ-cooling. Figure 11 shows the same results for the case with situ-cooling. Figure 10 results, for the case of no situ-cooling applied, indicate that as the tumor is located deeper, the breast skin surface temperature tends to diminish towards the healthy breast case temperature levels. For example, at T1 depth, the difference was approximately 16.4 °C, whereas at T9 depth, the difference diminished to a mere 1.3 °C.
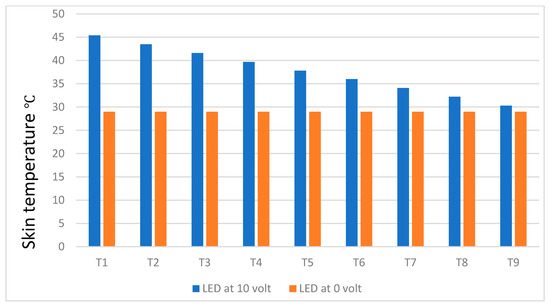
Figure 10.
Temperature difference between healthy and unhealthy breast without situ-cooling.
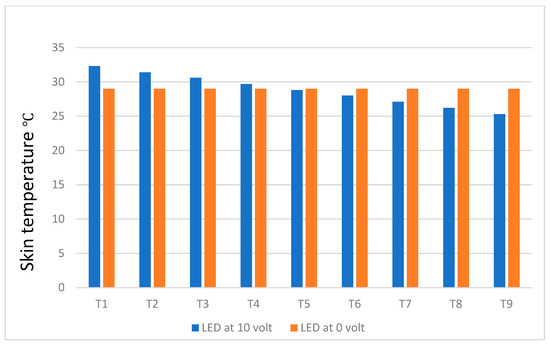
Figure 11.
Temperature differences between healthy and unhealthy breasts with situ-cooling.
Figure 11, on the other hand, shows that the use of cooling gel reduces the skin surface temperature of the breast by a large amount. For example, at T1 depth, the temperature difference from a healthy breast was 3.3 °C, whereas for the depth of T9, the temperature difference was −3.7 °C. The negative sign indicates that the strong cooling gel effect expectingly reduces the temperature to levels below a healthy breast skin.
Figure 12 results present a comparative analysis of breast surface temperature measurements with and without cooling, focusing on both healthy areas and tumor depths. The study aims to explore the effects of cooling on breast surface temperature and its potential implications for the differentiation between healthy and tumorous breasts. The temperatures were measured at different tumor depths (e.g., T1 to T9) and corresponding surrounding healthy areas on the breast skin surface.
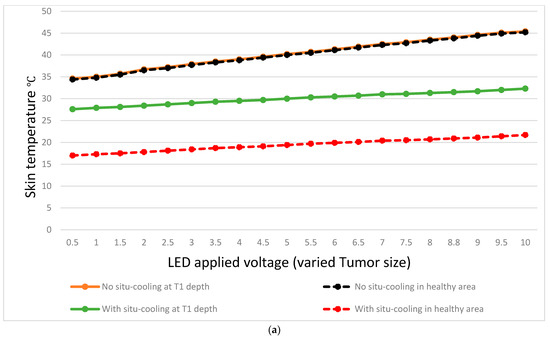
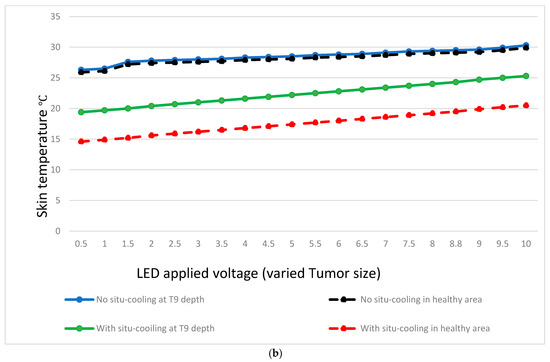
Figure 12.
Temperature variation at different tumor depths and different tumor sizes.
The collected data revealed distinct temperature patterns between breast surface temperatures without cooling and those with cooling, both in healthy areas and tumor regions. Without cooling, the average breast surface temperature gradually decreased from 34.6 °C at T1 to 45.4 °C at T9 for healthy areas, while in tumor regions, the temperatures ranged from 26.3 °C at T1 to 30.3 °C at T9. With cooling, the average breast surface temperature decreased to lower levels in both healthy areas and tumor regions. For healthy areas, the temperatures ranged from 14.6 °C at T1 to 20.5 °C at T9, while in tumor regions, the temperatures ranged from 19.2 °C at T1 to 25.3 °C at T9.
Furthermore, when comparing the temperature differences between healthy areas and tumor regions, it was observed that without situ-cooling, the temperature difference between tumor location and healthy area at T1 was very low at 0.2 °C. However, with situ-cooling, the temperature difference exhibited a more pronounced increase of 10.6 °C, as shown in Figure 12a. On the other hand, the temperature difference between the healthy areas and tumor regions can be observed clearly in the case of with situ-cooling. For example, at a depth of T9, the temperature difference was maintained at 0.4 °C, whereas for an extreme depth of T9, the temperature difference was still at a high level of 4.8 °C as shown in Figure 12b.
7. Discussion
The above findings provide insights into the influence of cooling on breast surface temperature and its potential application in differentiating healthy and tumor regions. This study investigates the impact of cooling on breast surface temperature measurements, focusing on healthy areas and various tumor depths. Understanding the effects of cooling on breast surface temperature could contribute to improved tumor localization and detection accuracy.
When benchmarking against the simulation results from COMSOL, several observations stand out.
- -
- First, at a large tumor size and a surficial depth of T1, in the case of COMSOL simulation, very small differences are detected. However, temperature differences are well pronounced throughout the experiments without situ-cooling. Increasing the depth to T9 causes the temperature difference to disappear during the COMSOL simulation, whereas it is still well pronounced during the experiments. However, as cooling gel is applied at T9 depth, the temperature difference becomes higher. This is not the case during simulation as temperature difference was not detected at all in many cases as tumor size or breast size are changed.
- -
- Second, the observed experimental temperature difference values were maintained throughout the experiments, regardless of the tumor size (e.g., voltage applied). This is true for both cases with and without situ-cooling and for any tumor depth (see Table A1 in the Appendix A). The latter situation can probably be resolved using a higher resolution thermal camera sensor.
- -
- Finally, with situ-cooling, the temperature differences were 10.6 °C at T1 and 4.8 °C at T9, indicating a sufficient contrast is maintained at any depth between healthy and tumor regions, which can be capitalized on further to detect even smaller tumor sizes in small breasts.
The experimental results have demonstrated that, at a fixed tumor size, temperature variations are observed with increasing depth. For example, as the tumor depth increases, the temperature tends to decrease, confirming the same results obtained from the simulation. This can be seen by comparing the temperature measurements at the same tumor size but at different depths. This is true for both cases of with and without situ-cooling. These temperature differences provide valuable information for potential tumor localization and differentiation.
In the study reported in [30], the highest variations in skin temperature between healthy and unhealthy breasts can scope from 0.274 °C to 2.58 °C for breast sizes of 16.7 cm. With bigger breast sizes, the variations become low, as confirmed by our results. The results in [30] also confirm that the depth of tumor, its size, and its shape do affect the heat transfer across the breast layers, including the skin. Other investigations have confirmed this supposition, and found that the depth of tumor, its size, and the breast size are more significant than any other characteristics. By changing the depth and location of the tumor, (location coordinates of tumor in the breast, see Figure 9) and its size, breast surface temperature changes according to these variables (size location and depth). In addition, the numerical simulation from the COMSOL simulation model and emulation experiment both repeat the same observed results.
Table 12 provides a benchmarking comparison of the various methods employed in early breast cancer detection. The methods evaluated include the Pennes bioheat equation, SmartViewTM Desktop Software application, analytical statistics, COMSOL software, FLIR Research IR Max software, and ANSYS Fluent software, among others.
Table 12.
Benchmarking with related works on early breast detection.
Based on the results, it is evident that different methods and camera models yield varying outcomes in terms of tumor size, tumor depth, and temperature differences compared to healthy cells. For instance, in Source 6, the Pennes equation with an unspecified camera model reported a tumor size of 1.5 cm, resulting in a temperature increase of 1.42 °C compared to healthy cells. On the other hand, Source 9 utilized the SmartViewTM Desktop Software and Fluke® Ti9 camera, achieving a sensitivity of 83%, but with false-negative rates of 16%. Furthermore, Source 11 employed the bioheat Pennes equation in combination with COMSOL software and reported varying tumor sizes (ranging from 1 cm to 2 cm) and depths (ranging from 0.6 cm to 2.6 cm). The corresponding temperature differences between the tumors and healthy cells were 1 °C.
In our work, we utilized FLIR Research IR Max software, MATLAB 2019b, the bioheat Pennes equation, COMSOL 5.4 software, and ANSYS Fluent 2019 software. Using the FLIR One Pro camera, we observed changes in tumor size from 1 cm to 0.5 cm, resulting in temperature differences ranging from 1.15 °C to 0.05 °C. Additionally, the tumor location varied from 2 cm to 10 cm, leading to temperature variations ranging from 1 °C to 0.027 °C.
In conclusion, the benchmarking results highlight the diversity in methods, camera models, and their respective outcomes in early breast cancer detection. Variations in tumor size, depth, and resulting temperature differences indicate the complex nature of thermographic analysis. The presented findings contribute to the understanding of the different techniques used for early breast cancer detection and emphasize the importance of considering multiple factors, such as camera model, software, and methodology, when interpreting thermographic results. It is important to note that the benchmarking results should be considered in the context of their respective sources and limitations.
Conducting long-term follow-up studies can be challenging and resource-intensive. It may require substantial time, funding, and effort to track patients over extended periods and collect comprehensive data on long-term outcomes. Long-term follow-up studies may also involve withholding potentially more effective diagnostic approaches from patients for an extended period, which could raise ethical concerns. Moreover, studies with shorter follow-up periods, such as our study, can serve as preliminary investigations that contribute to the existing knowledge base and guide future research directions.
Potential bias is a valid concern when conducting simulation modeling or experimental setup testing for any type of research. In our case, the COMSOL simulation tool was selected due to its superiority over other available commercial tools as it allows you to use, for example, FEM and DFDT for different application scenarios (e.g., static or time-variant mesh network behavior). COMSOL’s FEM capabilities allow for accurate modeling and analysis of complex geometries and physical phenomena. It also provides a robust numerical framework for solving partial differential equations and simulating the behavior of systems with varying parameters, and this flexibility is particularly valuable when studying dynamic or time-dependent phenomena, which is essential in our research. DFDT, on the other hand, is crucial for investigating fractured or porous materials, enabling the simulation of fluid flow and transport through complex networks of fractures or pore spaces. In our case, it is worth noting that the selection of the COMSOL simulation tool was based on careful consideration of the issue of breast cancer based and existing knowledge within the research community in the field. However, it is recommended for future work to repeat the experiments conducted in our study using different commercial tools other than COMSOL to avoid any degree of potential bias in the results.
8. Conclusions and Future Work
This study effectively evaluates numerical breast designs to improve the accuracy of breast cancer detection using personalized data such as 3D breast images, thermograms, and situ-cooling of the breast. The methodology and simulations that were constructed and evaluated can be highly effective for precise breast cancer classification using infrared techniques. By using the COMSOL software, analyses on silicon breasts were performed and numerical simulations were utilized to verify the breast designs with modeled tumors. The simulation study establishes that tumors within the breast can result in varied heat transfers based on parameters such as tumor depth, size, and breast shape. Furthermore, the situ-cooling feature was utilized to enhance temperature contrast and improve the accuracy of breast cancer detection. This is critical because the advancement of finite elements based on variation infrared modeling has the potential to significantly improve the accuracies of tumor detection using thermography. In summary, the following conclusions are observed.
- -
- Large breast size with large surface area tends to consistently reduce the temperature variations on the skin and, therefore, one needs to consider that larger breast sizes might have difficulty in yielding observable temperature contrasts in comparison to smaller ones.
- -
- Furthermore, smaller tumor size below 0.5 cm might be quite difficult to detect, especially for small breast size.
- -
- Lastly, tumors located deep within the breast layers may pose challenges in producing observable temperature variations, particularly for smaller breast sizes.
- -
- However, experimental results suggest that it may be possible to mitigate the effects of small tumor size and deep tumor locations in small breasts by applying situ-cooling to the breast skin surface. Actually, it can yield an appreciable temperature contrast of up to 4.8 °C, even at a tumor depth of 10 cm and for a breast size of 17 cm.
The results of the emulation experiment and COMSOL simulation demonstrate a strong correlation between the breast surface temperature distribution and intensity versus the tumor depth and size. Further, detection of breast skin surface temperature variations for a tumor size smaller than 0.5 cm can be achieved using a high resolution sensitive thermal camera and/or by applying situ-cooling. Situ-cooling allows one to increase thermal contrast for tumors located deep beneath skin surface, and not detectable by COMSOL simulation, by a considerable amount. For example, for all tumor depths, situ-cooling maintained a temperature contrast of 4.8 °C. Therefore, our future work will attempt to add the situ-cooling layer to the COMSOL simulation model and observe its effect on the different breast layers and interacting thermophysical properties of the breast with tumor aggressiveness in detail. In addition, we will recommend extending the research scope to encompass various types of breast cancer, including but not limited to, breast abnormalities such as fibroadenomas or cysts and glandular density. This expansion would enable a more comprehensive understanding of the diverse manifestations of breast cancer and contribute to the advancement of diagnostic and treatment strategies tailored to specific subtypes.
Breast implants can alter the breast’s natural characteristics and may introduce a big challenge to image acquisition procedures. It would be important in future studies to emphasize the need for a sufficiently large and diverse sample of patients with different breast profiles to account for individual variability and ensure the generalizability of the findings. It is also necessary to discuss the importance of including women with breast implants in the study population to evaluate the method’s effectiveness and safety in this specific subgroup. Moreover, it is necessary to assess any potential risks or complications associated with the proposed image acquisition procedures, particularly in the context of different breast profiles and implants. In addition, conducting comparative analyses between different breast profiles or implant types is needed to evaluate any variations in the effectiveness or challenges associated with the proposed image acquisition procedures and their long-term outcomes and reliability. Finally, future works should encourage collaboration between medical experts and professionals, and researchers from various disciplines to ensure a comprehensive evaluation of the proposed image acquisition procedure and breast cancer detection methods to address the specific considerations related to breast profiles and implants. By considering these aspects, future studies can contribute to the development and refinement of techniques that are effective, safe, and applicable across a wide range of breast profiles, including women with breast implants.
Studying the individual variability in breast characteristics when evaluating the effectiveness of diagnostic methods is needed as there are some limitations to this study, such as working on a larger sample size that includes breast implants and studying the potential bias associated with the specific simulation tools used in the study. In addition, they may indicate the need for future research to evaluate the effectiveness of the proposed method in a larger, more diverse sample for the generalizability of findings. Finally, by collaborating between multiple centers in different geographical locations while recruiting participants with diverse breast characteristics, it is possible to assess more accurately the effectiveness of the proposed methods. In conclusion, while initial studies may have limitations in terms of sample size, breast implants, deformities, or specific patient profiles, acknowledging the need for future research involving larger and more diverse populations is important.
In future work, it is important to conduct studies or clinical trials to assess the level and duration of discomfort experienced by patients during and after the application of situ-cooling. This data can also help identify any patterns or variations in discomfort levels due to chemical reactions (if any as the chemical gel is sealed in a rubber pad providing no direct contact to the breast skin) from the breast skin and inform strategies to minimize or manage patient discomfort effectively. However, developing comprehensive safety protocols is essential when using situ-cooling on the human breast’s surface, and these protocols should include guidelines for patient selection, proper application techniques, and monitoring during and post-procedure.
Situ-cooling has a uniform impact on breast surface temperature across different tumor depths. The temperature reduction observed in tumor regions suggests that cooling may enhance the differentiation between healthy and tumor areas based on temperature patterns. Additionally, cooling can help minimize the masking effect caused by elevated surface temperatures near tumor regions, potentially improving the accuracy of tumor localization.
The data obtained provides insights into the temperature variations associated with various tumor characteristics. Thermographic analysis has emerged as a promising technique to help diagnose early breast cancer detection. By measuring temperature differences between tumor regions and surrounding healthy tissue, it is possible to identify potential abnormalities indicative of breast cancer.
Furthermore, the combination of thermal imaging, situ-cooling, and deep learning can potentially lead to a straightforward and non-invasive procedure for early-stage breast cancer detection, irrespective of breast characteristics.
Author Contributions
All authors have contributed equally to the article. All authors have read and agreed to the published version of the manuscript.
Funding
The authors extend their appreciation to the Deanship of Scientific Research at King Khalid University for funding this work through the Research Group Program under Grant Number (R.G.P.2/400/44).
Institutional Review Board Statement
Not applicable.
Informed Consent Statement
Not applicable.
Data Availability Statement
Authors declare no available data to share.
Conflicts of Interest
The authors declare no conflict of interest.
Appendix A
Table A1.
Observed Experimental Temperature for different applied voltage values.
Table A1.
Observed Experimental Temperature for different applied voltage values.
| Voltage (V) | Breast Surface Temperature without Situ-Cooling ( ) °C | Breast Surface Temperature with Situ-Cooling (2 min) ( ) °C | Breast Surface Temperature without Situ-Cooling (2 min) ( ) °C | Breast Surface Temperature with Situ-Cooling (2 min) ( ) °C | ||||||||
|---|---|---|---|---|---|---|---|---|---|---|---|---|
| T1 | Healthy Area | Differences | T1 | Healthy Area | Differences | T9 | Healthy Area | Differences | T9 | Healthy Area | Differences | |
| 0.5 | 34.6 | 34.4 | 0.2 | 27.6 | 17 | 10.6 | 26.3 | 25.9 | 0.4 | 19.4 | 14.6 | 4.8 |
| 1 | 35 | 34.8 | 0.2 | 27.9 | 17.3 | 10.6 | 26.5 | 26.1 | 0.4 | 19.7 | 14.9 | 4.8 |
| 1.5 | 35.7 | 35.5 | 0.2 | 28.1 | 17.5 | 10.6 | 27.6 | 27.2 | 0.4 | 20 | 15.2 | 4.8 |
| 2 | 36.7 | 36.5 | 0.2 | 28.4 | 17.8 | 10.6 | 27.8 | 27.4 | 0.4 | 20.4 | 15.6 | 4.8 |
| 2.5 | 37.2 | 37 | 0.2 | 28.7 | 18.1 | 10.6 | 27.9 | 27.5 | 0.4 | 20.7 | 15.9 | 4.8 |
| 3 | 37.9 | 37.7 | 0.2 | 29 | 18.4 | 10.6 | 28 | 27.6 | 0.4 | 21 | 16.2 | 4.8 |
| 3.5 | 38.5 | 38.3 | 0.2 | 29.3 | 18.7 | 10.6 | 28.1 | 27.7 | 0.4 | 21.3 | 16.5 | 4.8 |
| 4 | 39 | 38.8 | 0.2 | 29.5 | 18.9 | 10.6 | 28.3 | 27.9 | 0.4 | 21.6 | 16.8 | 4.8 |
| 4.5 | 39.6 | 39.4 | 0.2 | 29.7 | 19.1 | 10.6 | 28.4 | 28 | 0.4 | 21.9 | 17.1 | 4.8 |
| 5 | 40.2 | 40 | 0.2 | 30 | 19.4 | 10.6 | 28.5 | 28.1 | 0.4 | 22.2 | 17.4 | 4.8 |
| 5.5 | 40.7 | 40.5 | 0.2 | 30.3 | 19.7 | 10.6 | 28.7 | 28.3 | 0.4 | 22.5 | 17.7 | 4.8 |
| 6 | 41.3 | 41.1 | 0.2 | 30.5 | 19.9 | 10.6 | 28.8 | 28.4 | 0.4 | 22.8 | 18 | 4.8 |
| 6.5 | 41.9 | 41.7 | 0.2 | 30.7 | 20.1 | 10.6 | 28.9 | 28.5 | 0.4 | 23.1 | 18.3 | 4.8 |
| 7 | 42.5 | 42.3 | 0.2 | 31 | 20.4 | 10.6 | 29.1 | 28.7 | 0.4 | 23.4 | 18.6 | 4.8 |
| 7.5 | 42.9 | 42.7 | 0.2 | 31.1 | 20.5 | 10.6 | 29.3 | 28.9 | 0.4 | 23.7 | 18.9 | 4.8 |
| 8 | 43.5 | 43.3 | 0.2 | 31.3 | 20.7 | 10.6 | 29.4 | 29 | 0.4 | 24 | 19.2 | 4.8 |
| 8.8 | 44 | 43.8 | 0.2 | 31.5 | 20.9 | 10.6 | 29.5 | 29.1 | 0.4 | 24.3 | 19.5 | 4.8 |
| 9 | 44.6 | 44.4 | 0.2 | 31.7 | 21.1 | 10.6 | 29.6 | 29.2 | 0.4 | 24.7 | 19.9 | 4.8 |
| 9.5 | 45.1 | 44.9 | 0.2 | 32 | 21.4 | 10.6 | 29.9 | 29.5 | 0.4 | 25 | 20.2 | 4.8 |
| 10 | 45.4 | 45.2 | 0.2 | 32.3 | 21.7 | 10.6 | 30.3 | 29.9 | 0.4 | 25.3 | 20.5 | 4.8 |
References
- WHO: Latest Global Cancer Data: Cancer Burden Rises to 18.1 Million New Cases and 9.6 Million Cancer Deaths in 2018. Available online: https://www.iarc.who.int/wp-content/uploads/2018/09/pr263_E.pdf (accessed on 15 October 2022).
- Wishart, G.; Campisi, M.; Boswell, M.; Chapman, D.; Shackleton, V.; Iddles, S.; Hallett, A.; Britton, P. The accuracy of digital infrared imaging for breast cancer detection in women undergoing breast biopsy. Eur. J. Surg. Oncol. (EJSO) 2010, 36, 535–540. [Google Scholar] [CrossRef]
- Antony, L.; Arathy, K.; Sudarsan, N.; Muralidharan, M.N.; Ansari, S. Breast tumor parameter estimation and interactive 3D thermal tomography using discrete thermal sensor data. Biomed. Phys. Eng. Express 2020, 7, 015013. [Google Scholar] [CrossRef] [PubMed]
- Al Husaini, M.A.S.; Habaebi, M.H.; Hameed, S.A.; Islam, R.; Gunawan, T.S. A Systematic Review of Breast Cancer Detection Using Thermography and Neural Networks. IEEE Access 2020, 8, 208922–208937. [Google Scholar] [CrossRef]
- Gonzalez-Hernandez, J.-L.; Recinella, A.N.; Kandlikar, S.G.; Dabydeen, D.; Medeiros, L.; Phatak, P. Technology, application and potential of dynamic breast thermography for the detection of breast cancer. Int. J. Heat Mass Transf. 2018, 131, 558–573. [Google Scholar] [CrossRef]
- Shrestha, S.; Kc, G.; Gurung, D.B. Transient Bioheat Equation in Breast Tissue: Effect of Tumor Size and Location. J. Adv. Appl. Math. 2020, 5, 51002. [Google Scholar] [CrossRef]
- Mukhmetov, O.; Igali, D.; Mashekova, A.; Zhao, Y.; Ng, E.; Fok, S.; Teh, S. Thermal modeling for breast tumor detection using thermography. Int. J. Therm. Sci. 2020, 161, 106712. [Google Scholar] [CrossRef]
- Gonzalez-Hernandez, J.-L.; Recinella, A.N.; Kandlikar, S.G.; Dabydeen, D.; Medeiros, L.; Phatak, P. An inverse heat transfer approach for patient-specific breast cancer detection and tumor localization using surface thermal images in the prone position. Infrared Phys. Technol. 2020, 105, 103202. [Google Scholar] [CrossRef]
- Sarigoz, T.; Ertan, T. Role of dynamic thermography in diagnosis of nodal involvement in patients with breast cancer: A pilot study. Infrared Phys. Technol. 2020, 108, 103336. [Google Scholar] [CrossRef]
- Zeng, J.; Lin, L.; Deng, F. Infrared thermal imaging as a nonradiation method for detecting thermal expression characteristics in normal female breasts in China. Infrared Phys. Technol. 2020, 104, 103125. [Google Scholar] [CrossRef]
- Figueiredo, A.A.; Fernandes, H.C.; Malheiros, F.C.; Guimaraes, G. Influence analysis of thermophysical properties on temperature profiles on the breast skin surface. Int. Commun. Heat Mass Transf. 2020, 111, 104453. [Google Scholar] [CrossRef]
- Lozano, A.; Hayes, J.C.; Compton, L.M.; Azarnoosh, J.; Hassanipour, F. Determining the thermal characteristics of breast cancer based on high-resolution infrared imaging, 3D breast scans, and magnetic resonance imaging. Sci. Rep. 2020, 10, 10105. [Google Scholar] [CrossRef]
- Delestri, L.F.U.; Ito, K.; Seng, G.H.; Shakhih, M.F.M.; Wahab, A.A. Thermal profiling analysis for asymmetrically embedded tumour with different breast densities. Malaysian J. Med. Heal. Sci. 2020, 16, 6–12. [Google Scholar]
- Korczak, I.; Romowicz, A.; Gambin, B.; Pałko, T.; Kruglenko, E.; Dobruch-Sobczak, K. Numerical prediction of breast skin temperature based on thermographic and ultrasonographic data in healthy and cancerous breasts. Biocybern. Biomed. Eng. 2020, 40, 1680–1692. [Google Scholar] [CrossRef]
- Bezerra, L.; Ribeiro, R.; Lyra, P.; Lima, R. An empirical correlation to estimate thermal properties of the breast and of the breast nodule using thermographic images and optimization techniques. Int. J. Heat Mass Transf. 2020, 149, 119215. [Google Scholar] [CrossRef]
- Wahab, A.A.; Salim, M.I.M.; Ahamat, M.A.; Manaf, N.A.; Yunus, J.; Lai, K.W. Thermal distribution analysis of three-dimensional tumor-embedded breast models with different breast density compositions. Med Biol. Eng. Comput. 2016, 54, 1363–1373. [Google Scholar] [CrossRef]
- Bezerra, L.; Oliveira, M.; Rolim, T.; Conci, A.; Santos, F.; Lyra, P.; Lima, R. Estimation of breast tumor thermal properties using infrared images. Signal Process. 2013, 93, 2851–2863. [Google Scholar] [CrossRef]
- Figueiredo, A.A.A.; Fernandes, H.C.; Guimaraes, G. Experimental approach for breast cancer center estimation using infrared thermography. Infrared Phys. Technol. 2018, 95, 100–112. [Google Scholar] [CrossRef]
- Mitra, S.; Balaji, C. A neural network based estimation of tumour parameters from a breast thermogram. Int. J. Heat Mass Transf. 2010, 53, 4714–4727. [Google Scholar] [CrossRef]
- Figueiredo, A.A.A.; Nascimento, J.G.D.; Malheiros, F.C.; Ignacio, L.H.D.S.; Fernandes, H.C.; Guimaraes, G. Breast tumor localization using skin surface temperatures from a 2D anatomic model without knowledge of the thermophysical properties. Comput. Methods Programs Biomed. 2019, 172, 65–77. [Google Scholar] [CrossRef]
- González, F.J. Thermal Simulations of Cancerous Breast Tumors and Cysts on a Realistic Female Torso. J. Biomech. Eng. 2021, 143, 4049957. [Google Scholar] [CrossRef]
- Barros, T.C.; Figueiredo, A.A.A. Three-dimensional numerical evaluation of skin surface thermal contrast by application of hypothermia at different depths and sizes of the breast tumor. Comput. Methods Programs Biomed. 2023, 236, 107562. [Google Scholar] [CrossRef] [PubMed]
- Camilleri, J.S.; Farrugia, L.; Curto, S.; Rodrigues, D.B.; Farina, L.; Dingli, G.C.; Bonello, J.; Farhat, I.; Sammut, C.V. Review of Thermal and Physiological Properties of Human Breast Tissue. Sensors 2022, 22, 3894. [Google Scholar] [CrossRef] [PubMed]
- Pennes, H.H. Applied Physiology. Med. J. Aust. 1946, 2, 844. [Google Scholar] [CrossRef]
- Charny, C.K. Bioengineering Heat Transfer. Adv. Heat Transf. 1992, 22, 19–155. Available online: http://www.sciencedirect.com/science/article/pii/S0065271708703447 (accessed on 15 October 2022).
- Zhou, Y.; Herman, C. Optimization of skin cooling by computational modeling for early thermographic detection of breast cancer. Int. J. Heat Mass Transf. 2018, 126, 864–876. [Google Scholar] [CrossRef]
- Gautherie, M. Thermopathology of Breast Cancer: Measurement and Analysis of in vivo Temperature and Blood Flow. Ann. New York Acad. Sci. 1980, 335, 383–415. [Google Scholar] [CrossRef]
- Hossain, S.; Mohammadi, F.A. Tumor parameter estimation considering the body geometry by thermography. Comput. Biol. Med. 2016, 76, 80–93. [Google Scholar] [CrossRef]
- Teledyne Flir. Available online: https://www.flir.com/globalassets/imported-assets/document/flir-one-pro-series-datasheet.pdf (accessed on 22 March 2021).
- Koch, A.; Nicolai, J.-P.; de Vries, J. Breast cancer and the role of breast size as a contributory factor. Breast 2004, 13, 272–275. [Google Scholar] [CrossRef]
Disclaimer/Publisher’s Note: The statements, opinions and data contained in all publications are solely those of the individual author(s) and contributor(s) and not of MDPI and/or the editor(s). MDPI and/or the editor(s) disclaim responsibility for any injury to people or property resulting from any ideas, methods, instructions or products referred to in the content. |
© 2023 by the authors. Licensee MDPI, Basel, Switzerland. This article is an open access article distributed under the terms and conditions of the Creative Commons Attribution (CC BY) license (https://creativecommons.org/licenses/by/4.0/).