Article

Bioactive Phenolic Compounds from Apples during Simulated In Vitro Gastrointestinal Digestion: Kinetics of Their Release

1
Faculty of Food Technology Osijek, Josip Juraj Strossmayer University of Osijek, Franje Kuhača 18, 31000 Osijek, Croatia
2
Faculty of Agriculture and Food Technology, University of Mostar, Biskupa Čule bb, 88000 Mostar, Bosnia and Herzegovina
3
Department of Statistics and Data Science, Yale University, 24 Hillhouse Avenue, New Haven, CT 06511, USA
*
Author to whom correspondence should be addressed.
Appl. Sci. 2023, 13(14), 8434; https://doi.org/10.3390/app13148434
Submission received: 22 June 2023 / Revised: 17 July 2023 / Accepted: 19 July 2023 / Published: 21 July 2023
(This article belongs to the Special Issue Bioactive Compounds from Natural Products - Volume II)

Abstract

:
Bioactive phenolic compounds in their natural form show beneficial effects on the gastrointestinal system. The kinetics of their release are important for understanding those effects. The aim was to study the kinetics of the release of phenolic compounds from apples during in vitro simulated gastrointestinal digestion by using modified equations of first- and second-order kinetics. 35% and 67% of total phenolic compounds were released in the gastric phase, and 26% and 27% in the intestinal phase (peel and flesh, respectively). Intensive release of anthocyanins, flavan-3-ols, dihydrochalcones, phenolic acids, and flavonols occurred in the first 10 min of gastric digestion. In intestinal digestion, flavan-3-ols and anthocyanins were not identified; the dihydrochalcone amount decreased, while phenolic acids and flavonols showed stability. Concentrations at the endpoint of the release (c) were determined with kinetic equations fitted well to the experimental data (cexp) (r2 = 0.9973 and 0.9946 for first- and second-order). The half-life for released phenolic subgroups in gastric digestion was up to 3.5 (first-order kinetics) or 2.5 min (second-order), or in intestinal digestion up to 20.9 (first-order) or 32.3 min (second-order). Modified equations reported here for the first time fit well with the experimental data.

1. Introduction

Phenolic compounds are introduced into the body by consuming plant food. In the digestive tract, they are released from the food matrix in their natural chemical form [1,2,3,4,5]. They can also degrade due to the environment of the digestive system, with the low pH in the stomach and a higher pH in the small intestine. Those that are absorbed undergo biotransformation, which creates many different metabolites that are finally found in the bloodstream [6,7] or excreted with urine [6,7]. Studies conducted on humans identified many such phenolic compound metabolites in plasma and urine after the consumption of plant food, fruit juices, or tea [8,9,10,11]. Natural phenolic compounds that are not absorbed in the small intestine can reach the colon, where they can be transformed by the gut microbiota into different catabolites. Many catabolites are identified in human urine and plasma [9,10]. Catabolites that are not absorbed in the colon are eliminated from the body with feces [6,7].
Although phenolic compounds are intensively metabolized and catabolized, they still appear in the digestive system in their natural form, in which they are present in fruit. Moreover, their concentrations in natural forms are relatively high. For this reason, the potential beneficial actions of native phenolic compounds in the digestive system are being intensively studied. Studies have been investigating the effects of phenolic compounds in the mouth and on the teeth [12,13], in the stomach [14,15], or in the small intestine [16,17]. Many similar effects are described in the review paper [18]. Natural phenolic compounds have the potential to inhibit harmful lipid peroxidation in the stomach, to help in the healing of gastric ulcers, or to inhibit Helicobacter pylori infection [18]. In the small intestine, phenolic compounds showed the potential to maintain the proper intestinal barrier function or to help regulate postprandial glucose levels [18]. The fate of phenolic compounds and the rate of their release might help in understanding those beneficial effects.
Up until now, the fate of phenolic compounds in the digestive tract is still not completely known. Degradation products are not completely identified, and the effects of other food components on the release of phenolic compounds are not completely known. Furthermore, the digestive process is a process in which the release of compounds from the food matrix happens in time. The rate at which the phenolic compounds are released is not well known. The release of phenolic compounds in the digestive tract can be studied with chemical kinetics.
The aim of this paper was to study the simulated in vitro gastrointestinal digestion of apples in different time periods and to model the results of this process (concentrations of released phenolic compounds vs. time) with non-linear regression, using equations of first- and second-order kinetics. Those equations were modified to fit the release of phenolic compounds in gastric and intestinal digestion. The modification of these equations is developed and applied here.

2. Materials and Methods

2.1. Chemicals

Chemicals were purchased from several companies: Gram mol (Zagreb, Croatia) (potassium chloride, potassium dihydrogen phosphate, sodium hydrogen carbonate, calcium chloride, and magnesium chloride), Kemika (Zagreb, Croatia) (ammonium carbonate), Carlo Erba Reagents (Val de Reuil, France) (sodium chloride), Fluka (Buchs, Switzerland) (orto-phosphoric acid, 85% HPLC-grade), J.T. Baker (Gliwice, Poland) (methanol HPLC grade), Sigma–Aldrich (St. Louis, MO, USA) (α-amylase (A3176, 13 U/mg), pepsin (P7000, 632 U/mg), pancreatin (P7545, 8 USP), and bile salt (B 8756, microbiology grade). Phenolic compound standards were purchased from Sigma–Aldrich (St. Louis, MO, USA) (quercetin dihydrate, quercetin-3-glucoside, (+)-catechin hydrate, (−)-epicatechin, chlorogenic acid) and Extrasynthese (Genay, France) (quercetin-3-galactoside, quercetin-3-rhamnoside, procyanidin B2, phloretin, phloretin-2′-O-glucoside, and cyanidin-3-galactoside chloride).

2.2. Reagents Preparation

Stock solutions of electrolytes (KCl (0.5 M), KH2PO4 (0.5 M), NaHCO3 (1 M), MgCl2 (0.15 M), (NH4)2CO3 (0.5 M), NaCl (2 M), and CaCl2 (0.3 M)) were used to prepare simulated salivary fluid electrolyte solution (SSF), simulated gastric fluid electrolyte solution (SGF) and simulated intestinal fluid electrolyte solution (SIF) [19]. Each of these solutions (SSF, SGF, and SIF) was prepared in volumetric flasks of 100 mL by pipetting appropriate volumes of stock solutions of electrolytes and adding distilled water to make up the final volume of 100 mL. The final concentrations of electrolytes were: SSF (18.875 mmol L−1 KCl, 4.625 mmol L−1 KH2PO4, 17 mmol L−1 NaHCO3, 0.056 mmol L−1 MgCl2, and 0.06 mmol L−1 (NH4)2CO3 adjusting pH to 7 with 1 M HCl or 1 M NaOH if required); SGF (8.625 mmol L−1 KCl, 1.125 mmol L−1 KH2PO4, 31.25 mmol L−1 NaHCO3, 0.15 mmol L−1 MgCl2, 0.625 mmol L−1 (NH4)2CO3, and 59 mmol L−1 NaCl, pH was adjusted to 3 with 1 M HCl), SIF (8.5 mmol L−1 KCl, 1 mmol L−1 KH2PO4, 106.25 mmol L−1 NaHCO3, 0.4125 mmol L−1 MgCl2), and 48 mmol L−1 NaCl, pH was adjusted to 7 with 1 M HCl.
Enzyme solutions were prepared daily and preincubated at 37 °C before use (α-amylase 1000 mg L−1 in SSF, pepsin 31,660.61 mg L−1 in SGF, pancreatin 8000 mg L−1 in SIF). Bile salts were prepared in SIF (25,000 mg L−1).

2.3. Apple Samples

Apples were purchased in a local supermarket. About 1 kg was peeled, the peel was pooled together, and homogenized in a coffee grinder. The flesh was cut without the core, pooled, and homogenized with a stick blender. Homogenized samples of flesh and peel were stored in plastic bags at −18 °C and analyzed the same week when prepared.

2.4. The Extraction of Phenolic Compounds

Phenolic compounds were first extracted with a solution consisting of methanol and water. About 0.15 g of apple peel and 1.5 mL of 80% methanol in water were added to a plastic tube. The solution was homogenized in a vortex (PV-1, Grant Instruments, Cambridgeshire, UK), put in an ultrasonic bath (Bandelin Sonorex RK 100, Berlin, Germany) for 15 min, centrifuged (Eppendorf Minispin, Eppendorf, Hamburg, Germany) for 10 min at 10,000 rpm. The extract was separated from the residue by pipetting. The residue was extracted one more time using the same procedure and 0.5 mL of 80% methanol. The two extracts were combined, filtered (0.20 μm PTFE syringe filter), and analyzed with high-performance liquid chromatography (HPLC).
The residue remaining after the extraction was further extracted with an enzyme-assisted extraction. Distilled water (1.05 mL), bile salt (60 μL), pancreatin (30 μL), and pepsin (15 μL) were added to the peel residue. The solution was vortexed and incubated in a dry block thermostat (Bio TDB-100, Biosan, Riga, Latvia) at 37 °C for 2 h with vortexing every 10 min. The solution was then put in an ice bath (5 °C) for 5 min, centrifuged for 5 min at 10,000 rpm, and again put in an ice bath (5 °C) for 5 min. The extract was then separated from the residue, filtered (0.20 μm PTFE syringe filter), and analyzed with HPLC.
The amounts after extraction with 80% methanol in water and with additional enzyme-assisted extractions were added, and the sum represented the initial concentration of phenolic compounds (the concentration before the digestion).
The flesh of apples was extracted using the same procedure.

2.5. Simulated Digestion

The experiment was conducted according to earlier studies [1,19] with some modifications.
For studying the gastric digestion in time, around 0.15 g of the peel was weighed into each of the five plastic tubes. The simulated digestion started with the oral phase of digestion that lasted 30 s in each tube and continued with the gastric phase in different time periods for each tube (10, 20, 30, 60, and 120 min, respectively). The volumes of reagents were as described next. For the oral digestion phase, 175 μL of SSF, 48.8 μL of H2O, 1.25 μL of CaCl2, and 25 μL of α-amylase were added to the peel, and vortexed for 30 s. The gastric phase continued by adding 375 μL of SGF, 14.8 μL of H2O, 0.25 μL of CaCl2, 10 μL of HCl (1 M), and 100 μL of pepsin. The solutions were vortexed and put in a dry block thermostat at 37 °C for the periods described earlier. The vortexing was conducted every 5 min.
For studying intestinal digestion in time, around 0.15 g of the peel was weighed into each of the five plastic tubes. The simulated digestion started with the oral phase of digestion (30 s), continued with the gastric phase that lasted 2 h in each tube, and vortexing was conducted each 5 min, after which the intestinal phase of digestion took place in different time periods for each tube (10, 20, 30, 60, and 120 min, respectively). The oral and gastric phases were conducted as already described. The intestinal phase continued by adding 550 μL of SIF, 180.5 μL of H2O, 2 μL of CaCl2 (0.3 M), 7.5 μL of NaOH (1 M), 250 μL of pancreatin, and 10 μL of bile salt to the solutions after oral and gastric digestion. Solutions were vortexed and put in a dry block thermostat at 37 °C for different time periods. The vortexing was conducted every 5 min.
After conducted gastric and intestinal digestion in different time periods, the tubes were put in an ice bath and then in a freezing vial storage box. After that, the tubes were centrifuged (10,000 rpm for 5 min). An aliquot was pipetted from each, filtered through a 0.20 μm PTFE syringe filter, and directly injected into the HPLC system.
The recovery was calculated as follows:
r e c o v e r y   % = γ d i g e s t i o n   p h a s e ( m g   k g 1 ) γ b e f o r e   d i g e s t i o n   ( m g   k g 1 )   100
where γdigestion phase is the concentration of a phenolic compound after a particular digestion phase (mg kg−1 fresh weight (FW)), γbefore digestion is a phenolic compound concentration in fruit before digestion determined with chemical and enzyme-assisted extraction (mg kg−1 FW).
The digestion of apple flesh was conducted according to the same procedure.

2.6. Reversed-Phase High Performance Liquid Chromatography (RP-HPLC)

All the samples after the extraction in 80% methanol in water and enzyme-assisted extractions and all the samples after simulated digestion were analyzed using RP-HPLC (HPLC system 1260 Infinity II, a quaternary pump, a PDA detector, and a vial sampler) (Agilent Technology, Santa Clara, CA, USA). For the characterization of phenolic compounds, a Poroshell 120 EC C-18 column (4.6 mm × 100 mm, 2.7 μm) and a Poroshell 120 EC-C18 4.6 mm guard column were used. Phenolic compounds were separated using 0.1% H3PO4 (mobile phase A) and 100% methanol (mobile phase B) with a gradient 0 min 5% B, 5 min 25% B, 14 min 34% B, 25 min 37% B, 30 min 40% B, 34 min 49% B, 35 min 50% B, 58 min 51% B, 60 min 55% B, 62 min 80% B, 65 min 80% B, 67 min 5% B, and 72 min 5% B [20]. Flow was 0.5 mL min−1, and each sample was injected in 10 μL. Phenolic compounds were identified by spiking samples with authentic standards and by comparing the UV/Vis spectra of standards with the spectra of peaks in apple samples (200 to 600 nm). Chlorogenic acid isomer, quercetin derivative, and quercetin-3-xyloside were tentatively identified with the help of literature [21,22] and their UV/Vis spectra. Calibration curves of (+)-catechin, procyanidin B2, (−)-epicatechin, phloretin-2-glucoside, chlorogenic acid, quercetin, quercetin-3-galactoside, quercetin-3-glucoside, quercetin-3-rhamnoside, and cyanidin-3-galactoside were prepared (r2 from 0.9978 to 0.9997) and used for the quantification. Chlorogenic acid isomer, quercetin derivative, and quercetin-3-xyloside, which were tentatively identified, were quantified by using already constructed calibration curves of chlorogenic acid and quercetin, respectively. The coefficient of variation of phenolic compounds was 1.57–9.17% (peel) and 4–17.4% (flesh).

2.7. Kinetics

The amounts of phenolic compound subgroups released in time ct (mg kg−1 fresh weight FW) vs. time t were modeled with first-order and second-order equations, modified to fit the data well. Equations and their modification are described in the results and discussion section.

2.8. Statistical Analysis

The extraction with 80% methanol and enzyme-assisted extraction was repeated in three parallel measurements and the simulated digestion in two parallel measurements. Each parallel was analyzed once with HPLC. The results are reported as mean ± standard deviation. The post hoc Tukey test was used to analyze the differences between results (Minitab LLC., State College, PA, USA). The data were analyzed with equations of first and second order by using non-linear regression in Solver add-in for MS Excel 2016 MSO (Microsoft Corporation, Redmond, WA, USA).

3. Results and Discussion

3.1. Individual Phenolic Compounds of Peel and Flesh of Apples

Table 1 shows amounts of phenolic compounds from the peel of apples before, during, and after simulated gastric and intestinal digestion. Chromatograms are shown in Figure S1. Phenolic compounds identified in apple peel before digestion belong to five subgroups usually found in the peel; anthocyanins (cyanidin-3-galactoside), flavan-3-ols ((+)-catechin, procyanidin B2, (−)-epicatechin), dihydrochalcones (phloretin-2-glucoside), phenolic acids (chlorogenic acid), and flavonols (galactoside, glucoside, xyloside, and rhamnoside of quercetin). Earlier studies identified the same main phenolic compounds in the peel in similar amounts [20,23,24,25,26].
Table 2 and Figure S2 show compounds identified and quantified in the flesh of apples before, during, and after gastric and intestinal digestion. Phenolic compounds in the flesh belong to flavan-3-ols ((+)-catechin, procyanidin B2, (−)-epicatechin), dihydrochalcones (phloretin-2-glucoside), phenolic acids (chlorogenic acid and its isomer), and flavonols (xyloside and rhamnoside of quercetin). The presence and amount of phenolic compounds agree with earlier studies [20,23,24,25,26].

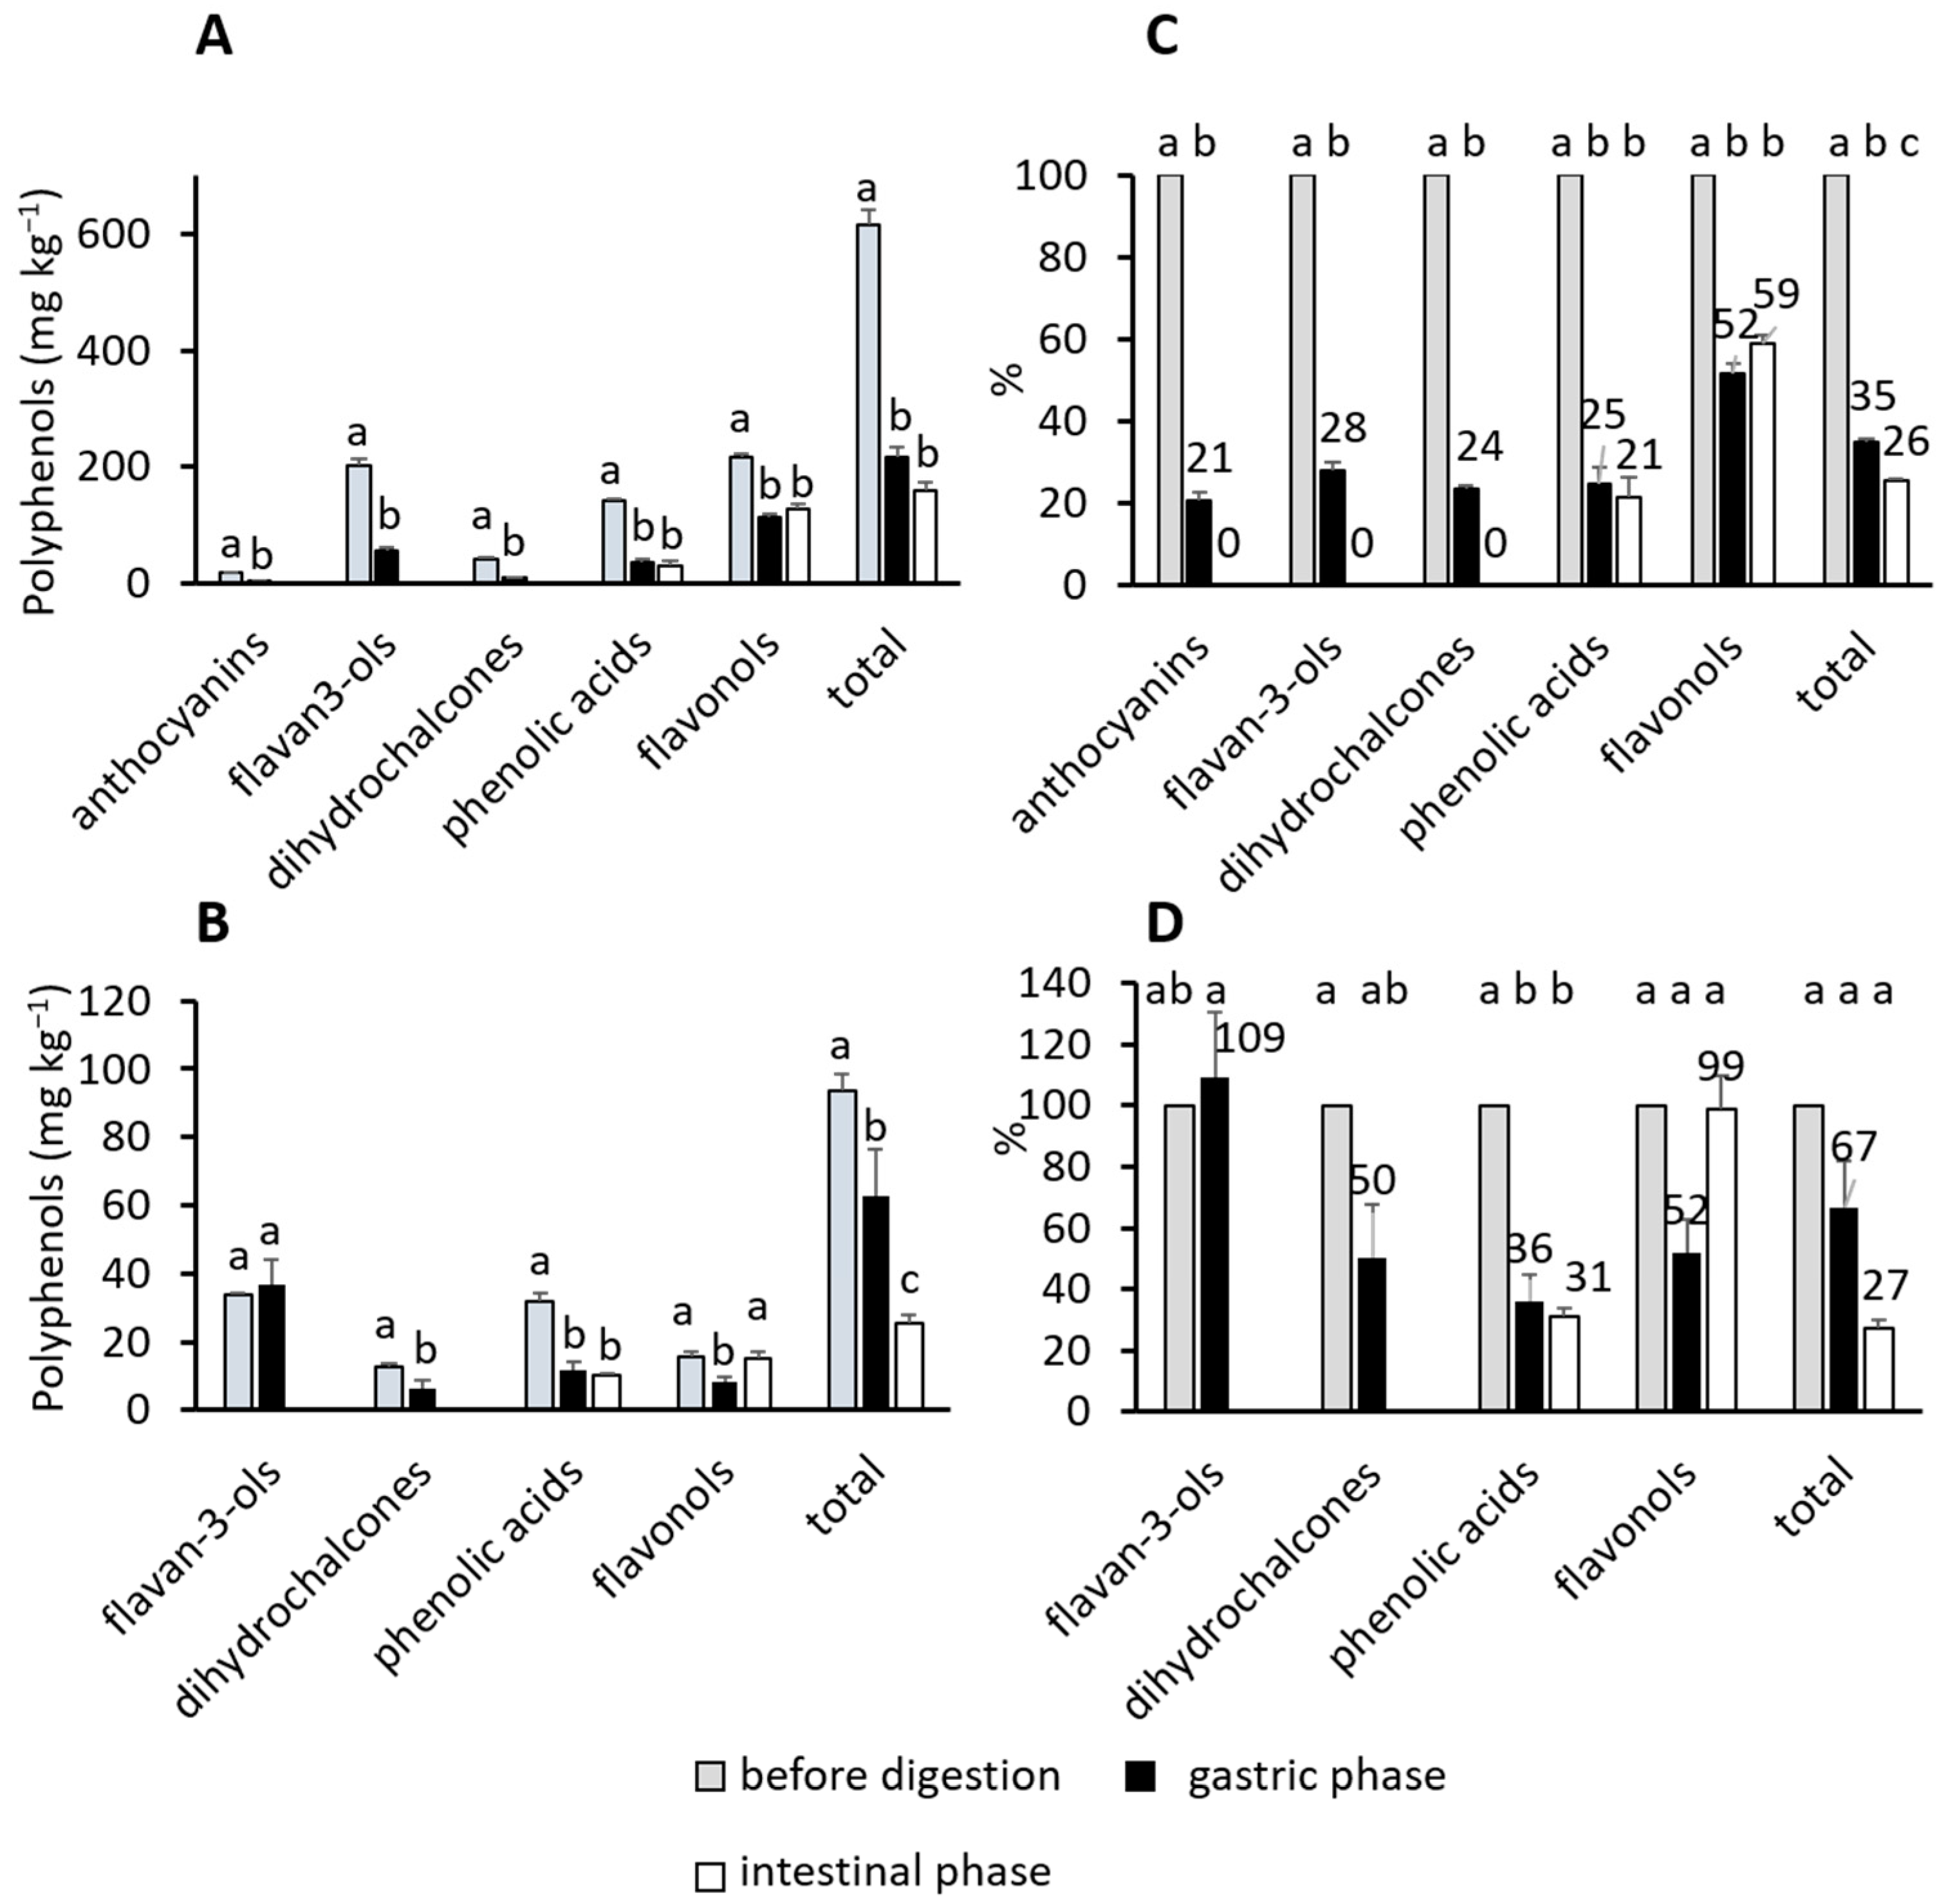
3.2. The Release of Phenolic Compounds in the Gastric Digestion

In the first 10 min of simulated gastric digestion (Table 1 and Table 2), individual and total phenolic compounds were released from the peel and flesh of apples in statistically significantly lower amounts than the amounts present in natural apples before the digestion (p < 0.05). Exceptions were the released (+)-catechin, (−)-epicatechin, and total flavan-3-ols from the flesh. Bouayed et al. (2012) [2] came to a similar conclusion. Amounts of total phenolic compounds released from apples in the gastric digestion were lower than amounts before the digestion. Fernández-Jalao et al. (2020) [27] also reported lower amounts of flavonols, phenolic acids, flavan-3-ols, and dihydrochalcones after the gastric digestion of apples in comparison to the amounts in natural apples.
In the further gastric digestion from 10 to 120 min, amounts of individual and total phenolic compounds were statistically similar to amounts released in the first 10 min (Table 1 and Table 2). Since the amount of phenolic compounds in the gastric digestion did not decrease in time, it can be suggested that anthocyanins, flavan-3-ols, dihydrochalcones, phenolic acids, and flavonols were stable in the gastric digestion. Earlier studies reported similar results. In the study of gastric digestion of apples with the use of static and dynamic simulated gastric digestion, in the static gastric digestion, which does not mimic mixing or peristalsis, amounts of released total and individual polyphenols did not change in time [28], similar to our study. However, there was a visible increase in released total and individual polyphenols in the conditions of dynamic gastric digestion, which controls gastric juice injection and mimics contractions in the stomach [28]. Moreover, procyanidin B2 and quercetin-3-galactoside were degraded [28]. Kahle et al. (2011) [29] conducted a study of the stability of apple polyphenols in gastric juice and found that hydrocinnamic acids, flavonols, dihydrochalcones, and monomeric flavan-3-ols were stable. However, procyanidin B2 was also reported to degrade [29]. Since in this study, we used static gastric digestion, our results were similar to earlier studies [28,29] showing the stability of phenolic compounds. The amount of procyanidin B2 slightly decreased during the gastric digestion, but not significantly, maybe due to the static model of the digestion.

3.3. The Release of Phenolic Compounds in the Intestinal Digestion

In the intestinal phase of the simulated digestion of peel and flesh of apples (Table 1 and Table 2), some of the compounds were not identified, the amounts of some decreased to zero, or they were not detected at all, and some compounds showed stability and were identified through the whole period of intestinal digestion.
Compounds that were not identified were anthocyanins (Table 1 and Table 2). Similarly, after the intestinal digestion of jaboticaba fruit peel, only 10% of anthocyanins were found at the end of the digestion, and only 1.3% were able to pass the cellulose dialysis membrane [4]. The reason for not detecting anthocyanins or for the decrease in their concentration could be the change of pH from low values in the gastric digestion (pH 3) to higher values in the intestinal phase (pH 7), at which anthocyanins change their chemical form from the form of a flavylium cation to a colorless carbinol pseudo-base [4]. Another subgroup of phenolic compounds that was not identified in the intestinal phase of digestion was the flavan-3-ol subgroup. Similarly, flavan-3-ols from apples were not identified in the intestinal phase of digestion [2], or their amount was lower in the intestinal phase than in the gastric phase [27]. Kahle et al. (2011) [29] also reported the degradation of flavan-3-ols in duodenal juice. The decrease in flavan-3-ol content or their complete disappearance could be the result of their degradation by autooxidation, polymerization, or complex formation in an environment of elevated pH [27]. The products of the autoxidation of various catechins after the in vitro gastrointestinal digestion were identified as different homo and heterocatechin dimers [30].
Other compounds that were not identified or their amount decreased to zero at the end of the intestinal digestion are dihydrochalcones (Table 1 and Table 2). After the intestinal digestion of apple peel, the dihydrochalcone phloretin-2-glucoside was present for up to 60 min, but at the end of the digestion, it could not be identified. The same dihydrochalcone from the flesh was not identified during the whole intestinal digestion. The release of dihydrochalcones had a somewhat different trend in earlier studies. After the intestinal digestion of apples, the number of total dihydrochalcones increased, which was the result of the increase in released phloretin-2-glucoside [27]. Dihydrochalcones were also identified in the intestinal phase of digestion of apples in the study of Bouayed et al. (2012) [2]. Dihydrochalcones showed stability in the duodenal juice [29].
Compounds that were found throughout the whole period of the intestinal phase of digestion were chlorogenic acid and flavonols (Table 1 and Table 2). Chlorogenic acid from the flesh and peel of apples was present in the first 10 min of the intestinal phase in the amount statistically similar to the amount at the end of the gastric phase. Moreover, although there were some visible fluctuations in its content with time, its amount statistically did not change significantly throughout the whole period of intestinal digestion. On the other hand, chlorogenic acid isomer was not identified in the intestinal phase. In earlier studies, chlorogenic acid was also found after the intestinal digestion of apples [2,27], and its amount was not affected by intestinal digestion compared to gastric digestion [27], similar to this study. Some studies reported a decrease in the chlorogenic acid content in the intestine [2]. Chlorogenic acid can isomerize [2,29] into cryptochlorogenic acid and neochlorogenic acid, which degrade its content by 41–77% [2]. Another group of constantly present phenolic compounds is the group of flavonols. Amounts of individual and total flavonols in the first 10 min of the intestinal phase were statistically similar to amounts after the gastric phase. Exceptions were quercetin-3-xyloside and total flavonols from flesh whose content in this intestinal phase was higher than the content at the end of gastric digestion. During the further period, the amounts of flavonols statistically did not change significantly. Similar to our study, flavonols were released in the intestinal phase of the digestion of apples [2,27]. Their amount was the most abundant [2], but it can also decrease during intestinal digestion [27]. Accordingly, it can be suggested that chlorogenic acid and all of the flavonols showed more stability in the conditions of intestinal digestion than anthocyanins, flavan-3-ols, and dihydrochalcones.

3.4. Phenolic Compounds at the End of Gastric and Intestinal Phases of Digestion

Figure 1A,B shows the amounts of total phenolic compounds and phenolic subgroups released at the end of gastric and intestinal phases of digestion. They were compared to the amounts before the digestion to see possible differences. At the end of the gastric phase, amounts of total released phenolics from peel and flesh were significantly lower than before the digestion (p < 0.05) and additionally decreased in the intestinal digestion, but statistically significant only for the flesh (p < 0.05). The same could be seen for phenolic subgroups. Total anthocyanins, flavan-3-ols, dihydrochalcones, phenolic acids, and flavonols were released in the gastric phase in significantly lower amounts than before the digestion (p < 0.05). An exception was flavan-3-ols from apple flesh, whose amounts in natural apples were similar to the amounts after gastric digestion. Anthocyanins, flavan-3-ols, and dihydrochalcones were not identified at the end of the intestinal phase. However, phenolic acids and flavonols showed stability, and the amount of flavonols even increased during intestinal digestion (significant in the apple flesh (p < 0.05)).
Figure 1C,D shows the percentage recovery of phenolic compounds. Only 35% and 67% of total phenolics were recovered during the gastric phase (peel and flesh, respectively), and that percentage decreased to 26% and 27% in the intestine (respectively). Recoveries of different subgroups were 21% to 52% (peel) and 36% to 109% (flesh) in the gastric phase. In the intestinal phase, the recovery of phenolic acids was 21% and 31% (peel and flesh, respectively), and that of flavonols 59% and 99% (peel and flesh, respectively).
In general, phenolic compounds are released in the gastric phase but in lower amounts than naturally present in apples, and their amounts additionally decrease in the intestine. Flavonols might be an exception since their amount increased from the gastric to the end of the intestinal digestion.

3.5. Kinetics

In reactions as studied in kinetics, the concentration of a reactant may decrease with time as the product forms. If ct represents the concentration of a reactant at time t, then the curve in the diagram ct vs. t is a decreasing function. The data in the diagram ct vs. t can be studied with equations of first- or second-order. For settings in which the concentration of the reactant tends eventually to 0, an equation of the first order is [31]:
c t = c 0 e k t
and of the second order:
c t = c 0 1 + c 0 k t
where ct is the concentration of a reactant at time t, with initial concentration c0 at t = 0, and the parameter k is the reaction rate constant [31].
The half-life (t1/2) of the reactant is the time needed for the initial concentration of the reactant (c0) to drop 50%, in other words, to reach c0/2. Equation (2) can be used to obtain the expression for t1/2 by putting c0/2 in place of the ct, and the expression for t obtained from that equation will be t1/2. The half-life for the first-order reaction (t1/2) becomes:
t 1 / 2 = 0.693 k
Likewise, putting c0/2 in place of ct in Equation (3), the half-life t1/2 for the second-order reaction becomes [31]:
t 1 / 2 = 1 k c 0

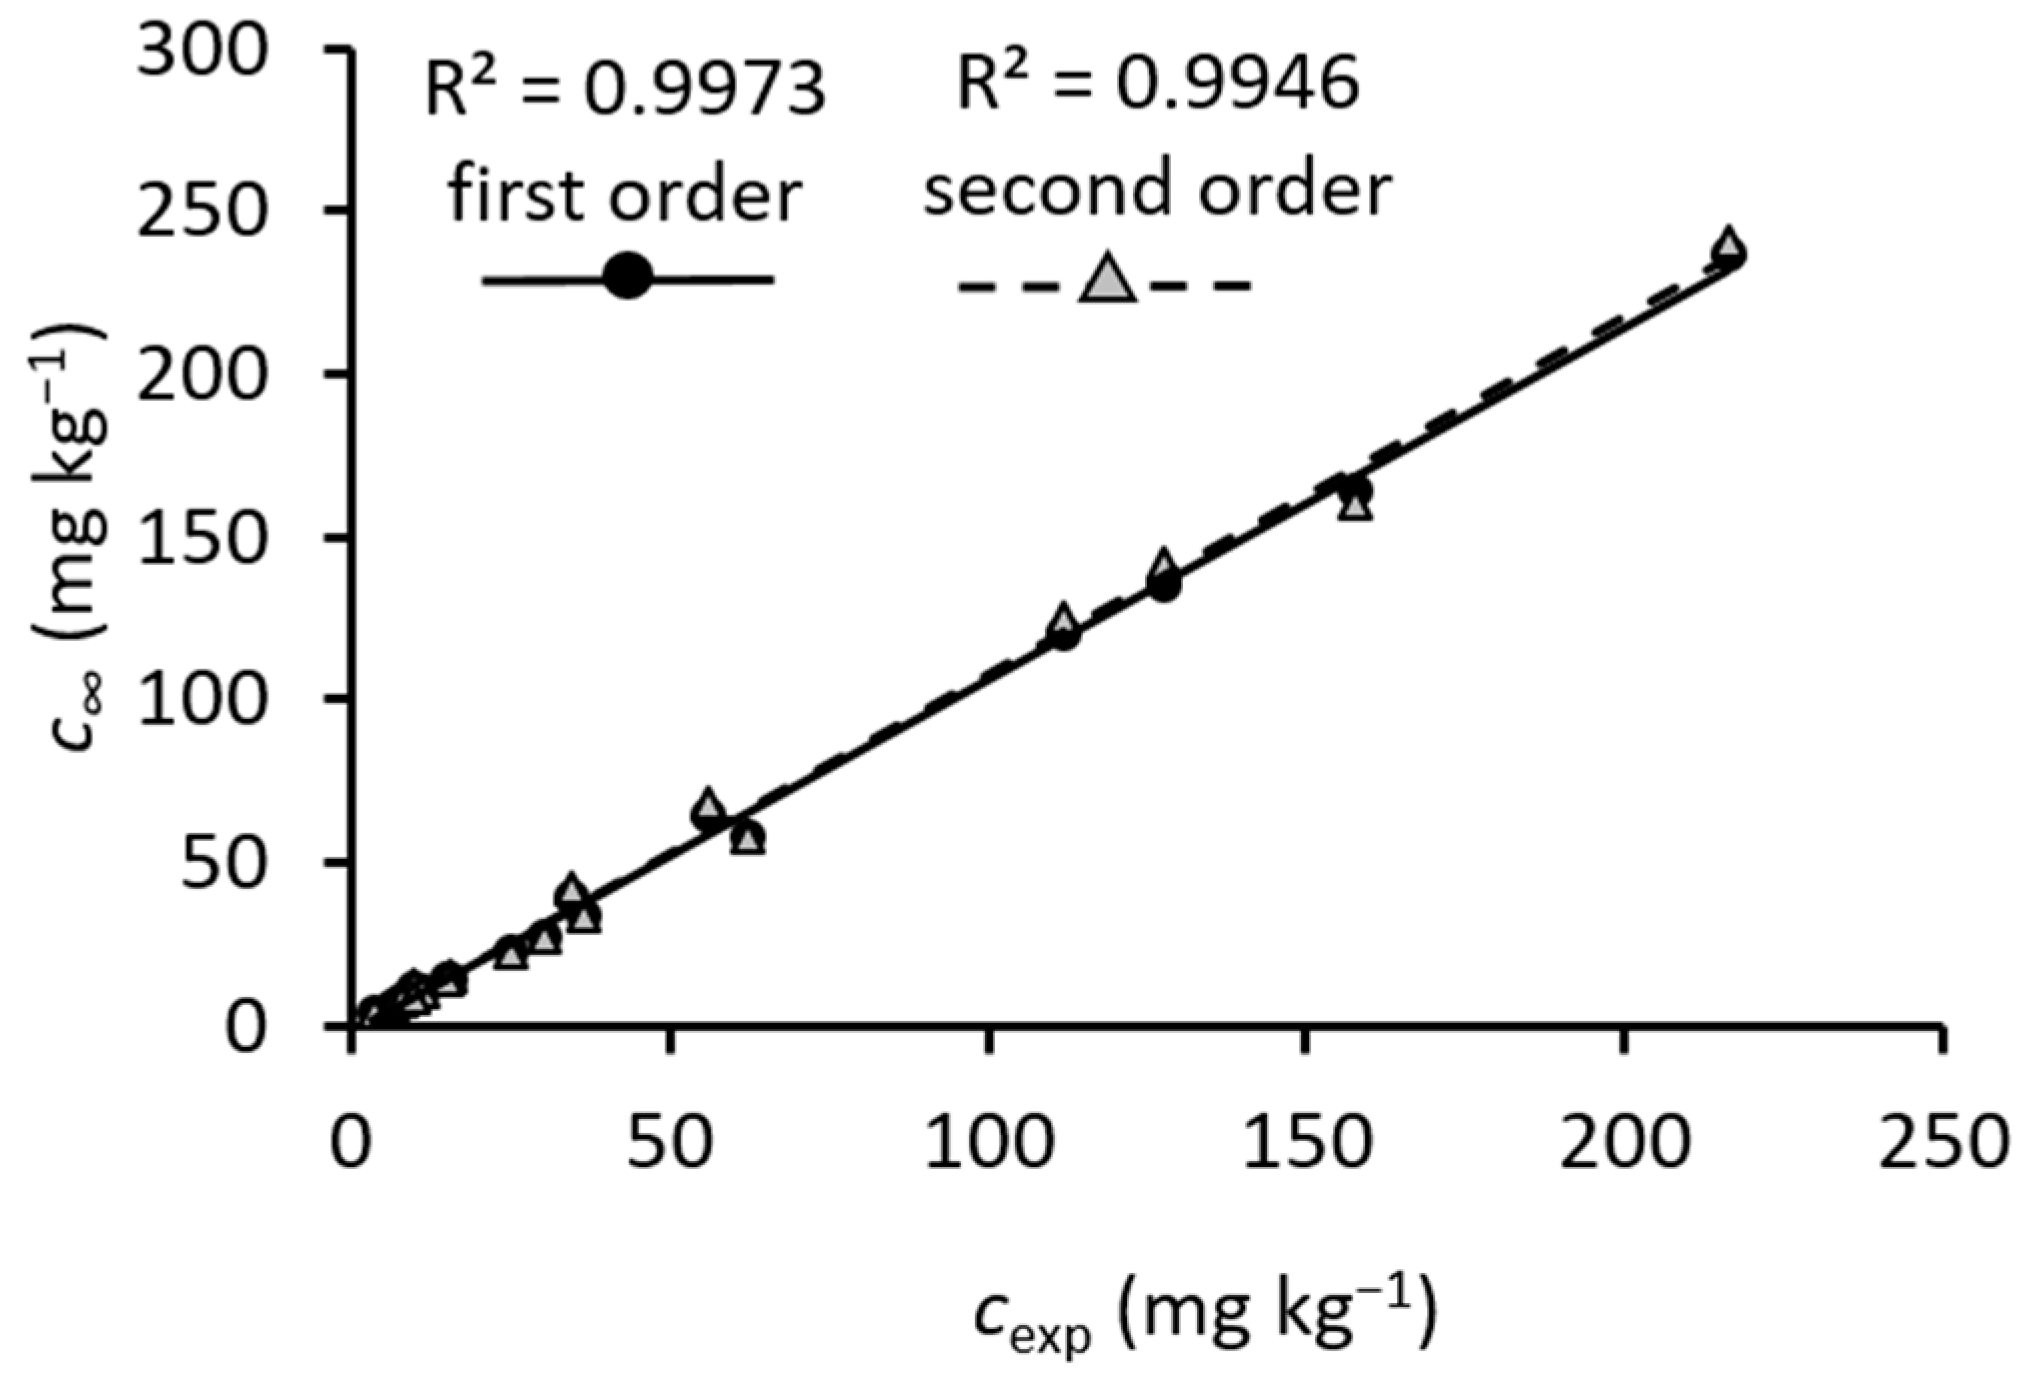
3.5.1. Kinetics in the Simulated Digestion Process

Simulated digestion processes can have a different behavior. A concentration of a compound can increase with time as the compound is released from the food matrix in the digestive tract or created from some bigger molecule as a degradation product. In this case, the curve in the diagram ct vs. t follows an increasing function. Kinetic Equations (2) and (3) can be adjusted to correspond to increasing concentrations of observed compounds. The adjustment can be seen in the replacement of the parameter c0 with c, which is the concentration of the compound at the endpoint of the reaction, and ct with cct. Now ct in the digestion process is increasing with time to the endpoint where it reaches maximum c, and, accordingly, the difference cct, which represents the part that still needs to be released, will decrease in time as expressed in the following equation.
c c t = c e k t
Rearranging this equation, we can write the equation for the first order as:
c t = c ( 1 e k t )
This equation was used for the kinetic models of starch digestion [32,33,34,35]. Such expressions are suitable for the setting in which the initial concentration is 0.
Likewise, replacing ct with cct and c0 with c in Equation (3), Equation (3) for the second order becomes:
c c t = c 1 + c k t
After rearranging Equation (8), this equation can be written as:
c t = c ( 1 1 1 + c k t )
Equations (7) and (9) are usually used for the simulated digestion processes to study the kinetics of these processes.

3.5.2. The Modification of Equations of the First and Second Order for the Gastrointestinal Digestion of Phenolic Compounds

When studying the release of phenolic compounds in digestion, their concentration can increase or decrease. In the stomach, their concentration increases since they are liberated from the matrix of food. The ct vs. t is an increasing function. We could apply Equations (7) and (9) to study the kinetics of the phenolic compound in the stomach. However, in the small intestine, phenolic compounds can be degraded or changed due to different pH, and consequently, their concentration in the natural form can decrease over time. The ct vs. t can be a decreasing function. In this case, we could apply Equations (2) and (3) to study the kinetics of the phenolic compound in the small intestine.
Instead, we modified Equations (2) and (3) to be able to use them in both cases when ct vs. t is an increasing or decreasing function, now with an allowance of non-zero initial and final concentrations. Equation (2) describes the first order that was modified by replacing c0 with c0c and by replacing ct with ctc, which represents the part of a compound that still needs to react, either for liberation or degradation. After rearranging and expressing ct, Equation (2) becomes:
c t = ( c 0 c ) e k t + c
Likewise, Equation (3) describes the second-order was modified by replacing c0 with c0c and by replacing ct with ctc. After rearranging and expressing ct, we have the equation:
c t = c 0 c 1 + c 0 c k t + c
These modifications lead the curve in the diagram ct vs. t from the value c0 at the t = 0, and level it toward the value c. In addition, when c < c0, the curve is decreasing, and when c > c0, the curve is increasing. In this way, the modified Equations (10) and (11) can adjust to the experimental data that show the increase in ct with time or the decrease in ct in time.
These equations can also be used to express the time evolution of c t c , the difference between the current and final concentrations (the part of the compounds that needs to be liberated or degraded). The terminology of first and second order for Equations (10) and (11), respectively, arises because the time derivative of this concentration difference is proportional to its current value (first order) or to the square of its current value (second order), respectively.
The expression for the half-life of reactants, in this case, is the time at which the concentration reaches a value halfway between the initial c0 and the final c. It can be obtained by replacing ct with (c0c)/2 + c in Equations (10) and (11). By expressing t from these equations, we can solve for t1/2. The expression for the first-order reaction half-life is again:
t 1 / 2 = 0.693 k
and the expression for the second-order reaction half-life becomes:
t 1 / 2 = 1 k c 0 c
For the analysis of the experimental results of phenolic compounds liberated in the stomach and then liberated or degraded in the small intestine, to express the concentration as a function of time, we used Equations (10) and (11), and to express the half-life we used Equations (12) and (13), which enabled us to determine k, c and t1/2.
It is specified that ct (mg kg−1) is the concentration of phenolic compounds at time t, c0 (mg kg−1) is the concentration of the phenolic compounds at t = 0, c (mg kg−1) is the concentration of phenolic compounds at the endpoint of the reaction, k is the reaction rate constant (min−1 for the first order kinetics, kg mg−1 min−1 for the second order kinetics), t is time (min), and t1/2 is the time when the concentration reaches 50% of the way from c0 to c.

3.5.3. Kinetics of Phenolic Compound from Apple Released in the Gastric and Intestinal Digestion

Table 3 shows the results of the kinetic of released phenolic compounds in gastric digestion. According to the c predicted with the model of the first-order, the amounts of released phenolic subgroups can reach 4.3 to 120.4 mg kg−1 after the gastric digestion of peel, or 5.7 to 33.8 mg kg−1 after the gastric digestion of flesh depending on the subgroup. The c predicted with the second-order model gave similar amounts, reaching 4.3 to 125.1 mg kg−1 after the gastric digestion of the peel or 5.8 to 33.6 mg kg−1 after the gastric digestion of flesh, again depending on the subgroup. The total released phenolics is predicted to be 236.5 mg kg−1 (peel) and 57.7 mg kg−1 (flesh) according to the first-order, or 240.4 mg kg−1 (peel) and 57.6 mg kg−1 (flesh) according to the second-order equation.
In the intestinal digestion (Table 3), the amount of released phenolic subgroups (c) predicted with the model of the first-order reached 14.5 to 135.4 mg kg−1 (peel) or 8.8 to 14 mg kg−1 (flesh) depending on the subgroup, and the amounts of total phenolics 163.8 mg kg−1 (peel) and 22.7 mg kg−1 (flesh). Again, the c predicted by the second-order model gave similar amounts of released compounds for phenolic subgroups reaching 14.7 to 141.7 mg kg−1 (peel) or 8.7 to 14.2 mg kg−1 (flesh), and for total phenolics 160.7 mg kg−1 (peel) and 22.2 mg kg−1 (flesh).
The amounts released in gastric and intestinal digestion at the endpoint, as predicted with kinetic models, correspond well to experimentally determined amounts (cexp). This can be seen from the correlation between c and cexp (r2 0.9973 and 0.9946 for first- and second-order models, respectively) (Figure 2). It can be suggested that the models and their parameters describe gastric and intestinal digestion well. To compare the first- and second-order models, it can be seen that somewhat lower standard errors (Table 3) and higher correlation with experimental results (Figure 2) were obtained for the values predicted by the model of the first-order kinetic.
Table 3 shows the half-life (t1/2) of phenolic compounds. According to t1/2 of the first-order model, half of the phenolic compounds can be released in gastric digestion in a short time period ranging from 1.6 to 3.5 min (peel) or 2.2 to 2.5 min (flesh), depending on the phenolic subgroup. Similar t1/2 were obtained with the second-order model. Half of the phenolics can be released in gastric digestion in 0.65 to 2.48 min (peel) or 0.08 to 0.47 min (flesh). It can be suggested that the release of phenolic compounds in gastric digestion takes place in the first several minutes of the digestion.
In the intestinal digestion, half of the release/decrease of phenolic compound happened from 1.7 to 20.9 min (peel) or from 0.8 to 7.3 min (flesh) according to first-order model, and from 1.25 to 32.27 min (peel) or from 0.55 to 4.42 min (flesh) according to second-order model (Table 3). A longer half-life or longer release period was shown for flavonols from the peel (20.9 or 32.3 min, for the first- and second-order models, respectively). It can be suggested that changes to the phenolic compounds in intestinal digestion take place in the first several minutes, but the exceptions are flavonols, whose release might happen over a longer period.

4. Conclusions

Due to their availability throughout the whole year, apples are present in the everyday diets of people all over the world. That is why they are an important source of phenolic compounds, particularly anthocyanins, flavan-3-ols, dihydrochalcones, phenolic acids, and flavonols. The same compounds were identified in this study. In view of their constant availability for the diet, there is interest in investigating their degradation or stability and their release from the food matrix during digestion to help understand their beneficial effects. As shown in this study, phenolic compounds are present in gastric and intestinal digestion in a lower amount than the natural amount in apples, and they are released intensively in the first 10 min of gastric digestion. In intestinal digestion, some phenolic compounds were not identified, such as anthocyanins or flavan-3-ols. Dihydrochalcones were not identified, or their amount decreased, while phenolic acids and flavonols showed stability during intestinal digestion.
The variation of the concentration of phenolic compounds with the time of digestion, as well as the prediction of their presence in the digestive system in time, can also lead to a better description of the effects of phenolic compounds. This kinetic approach has already been described as important for the exposure of the digestive tract to phenolic compounds and their true effects. Kinetic models for the analysis of the data help in the assessment of their presence in the digestive tract during digestion time. Modified equations of the first- and second-order models used here described well the behavior of phenolic compounds during their timely release in digestion. Somewhat lower standard errors and higher correlation with experimental results were obtained for the values predicted by the model of the first order. The models also predicted that phenolic compounds are released in the first several minutes of the digestion, and it can be suggested that after that, the release of phenolic compounds slows down or reaches equilibrium. The modified equations developed and applied here can be used when studying the kinetics of gastrointestinal digestion. They represent a novelty in the study of the kinetics of the release of phenolic compounds in the gastrointestinal tract.

Supplementary Materials

The following supporting information can be downloaded at: https://www.mdpi.com/article/10.3390/app13148434/s1, Figure S1: Chromatograms of phenolic compounds from apple peel (A) extracted with 80% methanol scanned at 280 nm, with smaller chromatograms scanned at 320, 360 and 510 nm to better present peaks of phenolic acids, flavonols and anthocyanins, respectively, (B) after the gastric digestion scanned at 280 nm, (C) after the intestinal digestion scanned at 280 nm, with smaller chromatograms scanned at 320 and 360 to better present peaks of phenolic acids and flavonol, respectively. Peaks: 1—(+)-catechin, 2—procyanidin B2, 3—chlorogenic acid, 5—(−)-epicatechin, 6—cyandin-3-galactoside, 7—quercetin-3-galactoside, 8—quercetin-3-glucoside, 9*—quercetin derivative, 10—phloretin-2-glucoside, 11*—quercetin-3-xyloside, 12—quercetin-3-rhamnoside. * tentative identification; Figure S2: Chromatograms of phenolic compounds from apple flesh (A) extracted with 80% methanol and scanned at 280 nm, with smaller chromatograms at 320 and 360 nm to better see peaks of phenolic acids and flavonols, respectively, (B) after the gastric digestion scanned at 280 nm, (C) after the intestinal digestion scanned at 320 nm. Peaks: 1—(+)-catechin, 2—procyanidin B2, 3—chlorogenic acid, 4—chlorogenic acid isomer, 5—(−)-epicatechin, 10—phloretin-2-glucoside, 11*—quercetin-3-xyloside, 12—quercetin-3-rhamnoside. * tentative identification.

Author Contributions

Conceptualization, L.J., P.M. and J.I.; methodology, A.R.B., P.M, and J.I.; software, L.J. and A.R.B.; formal analysis, L.J. and P.M.; writing—original draft preparation, L.J.; writing—review and editing, A.R.B., P.M. and J.I.; supervision, L.J. All authors have read and agreed to the published version of the manuscript.

Funding

This research was funded by the Croatian Science Foundation, grant number HRZZ-IP-2016-06-6777.

Institutional Review Board Statement

Not applicable.

Informed Consent Statement

Not applicable.

Data Availability Statement

Data is contained within the article.

Conflicts of Interest

The authors declare no conflict of interest. The funders had no role in the design of the study; in the collection, analyses, or interpretation of data; in the writing of the manuscript; or in the decision to publish the results.

References

  1. Bouayed, J.; Deußer, H.; Hoffmann, L.; Bohn, T. Bioaccessible and dialysable polyphenols in selected apple varieties following in vitro digestion vs. their native patterns. Food Chem. 2012, 131, 1466–1472. [Google Scholar] [CrossRef]
  2. Bergantin, C.; Maietti, A.; Cavazzini, A.; Pasti, L.; Tedeschi, P.; Brandolini, V.; Marchetti, N. Bioaccessibility and HPLC-MS/MS chemical characterization of phenolic antioxidants in Red Chicory (Cichorium intybus). J. Funct. Foods 2017, 33, 94–102. [Google Scholar] [CrossRef]
  3. Lingua, M.S.; Theumer, M.G.; Kruzynski, P.; Wunderlin, D.A.; Baroni, M.V. Bioaccessibility of polyphenols and antioxidant properties of the white grape by simulated digestion and Caco-2 cell assays: Comparative study with its winemaking product. Food Res. Int. 2019, 122, 496–505. [Google Scholar] [CrossRef]
  4. Quatrin, A.; Rampelotto, C.; Pauletto, R.; Maurer, L.H.; Nichelle, S.M.; Klein, B.; Fritzsche Rodrigues, R.; Maróstica Junior, M.R.; de Souza Fonseca, B.; Ragagnin de Menezes, C.; et al. Bioaccessibility and catabolism of phenolic compounds from jaboticaba (Myrciaria trunciflora) fruit peel during in vitro gastrointestinal digestion and colonic fermentation. J. Funct. Food 2020, 65, 103714. [Google Scholar] [CrossRef]
  5. Yu, W.; Gao, J.; Hao, R.; Yang, J.; Wei, J. Effects of simulated digestion on black chokeberry (Aronia melanocarpa (Michx.) Elliot) anthocyanins and intestinal flora. J. Food Sci. Tech. 2020, 58, 1511–1523. [Google Scholar] [CrossRef]
  6. Dias, R.; Pereira, C.B.; Pérez-Gregorio, R.; Mateus, N.; Freitas, V. Recent advances on dietary polyphenol’s potential roles in Celiac Disease. Trends Food Sci. Technol. 2021, 107, 213–225. [Google Scholar] [CrossRef]
  7. Van Duynhoven, J.; van Velzen, E.; Jacobs, D.M. Nutrikinetic assessment of polyphenol exposure. Curr. Opin. Food Sci. 2017, 16, 88–95. [Google Scholar] [CrossRef]
  8. Castello, F.; Fernández-Pachón, M.S.; Cerrillo, I.; Escudero-López, B.; Ortega, Á.; Rosi, A.; Bresciani, L.; Del Rio, D.; Mena, P. Absorption, metabolism, and excretion of orange juice (poly)phenols in humans: The effect of a controlled alcoholic fermentation. Arch. Biochem. Biophys. 2020, 695, 108627. [Google Scholar] [CrossRef]
  9. Del Rio, D.; Calani, L.; Cordero, C.; Salvatore, S.; Pellegrini, N.; Brighenti, F. Bioavailability and catabolism of green tea flavan-3-ols in humans. Nutrition 2010, 26, 1110–1116. [Google Scholar] [CrossRef]
  10. Pereira-Caro, G.; Clifford, M.N.; Polyviou, T.; Ludwig, I.A.; Alfheeaid, H.; Moreno-Rojas, J.M.; Garcia, A.L.; Malkova, D.; Crozier, A. Plasma pharmacokinetics of (poly)phenol metabolites and catabolites after ingestion of orange juice by endurance trained men. Free. Radic. Biol. Med. 2020, 160, 784–795. [Google Scholar] [CrossRef]
  11. Yuste, S.; Ludwig, I.A.; Rubió, L.; Romero, M.P.; Pedret, A.; Valls, R.M.; Solà, R.; Motilva, M.J.; Macià, A. In vivo biotransformation of (poly)phenols and anthocyanins of red-fleshed apple and identification of intake biomarkers. J. Funct. Food 2019, 55, 146–155. [Google Scholar] [CrossRef] [Green Version]
  12. Niemeyer, S.H.; Baumann, T.; Lussi, A.; Meyer-Lueckel, H.; Scaramucci, T.; Carvalho, T.S. Salivary pellicle modification with polyphenol-rich teas and natural extracts to improve protection against dental erosion. J. Dent. 2021, 105, 103567. [Google Scholar] [CrossRef]
  13. Pérez Zamora, C.M.; Michaluk, A.G.; Chiappetta, D.A.; Nuñez, M.B. Herbal buccal films with in vitro antibacterial and anti-inflammatory effects. J. Herb. Med. 2022, 31, 100527. [Google Scholar] [CrossRef]
  14. Da Silva, D.T.; Fritzsche Rodrigues, R.; Minuzzi Machado, N.; Haselein Maurer, L.; Fresinghelli Ferreira, L.; Somacal, S.; da Veiga, M.L.; de Ugalde Marques da Rocha, M.I.; Vizzotto, M.; Rodrigues, E.; et al. Natural deep eutectic solvent (NADES)-based blueberry extracts protect against ethanol-induced gastric ulcer in rats. Food Res. Int. 2020, 138, 109718. [Google Scholar] [CrossRef]
  15. Valcheva-Kuzmanova, S.; Denev, P.; Eftimov, M.; Georgieva, A.; Kuzmanova, V.; Kuzmanov, A.; Kuzmanov, K.; Tzaneva, M. Protective effects of Aronia melanocarpa juices either alone or combined with extracts from Rosa canina or Alchemilla vulgaris in a rat model of indomethacin-induced gastric ulcers. Food Chem. Toxicol. 2019, 132, 110739. [Google Scholar] [CrossRef] [PubMed]
  16. Zhang, B.; Xu, Y.; Lv, H.; Pang, W.; Wang, J.; Ma, H.; Wang, S. Intestinal pharmacokinetics of resveratrol and regulatory effects of resveratrol metabolites on gut barrier and gut microbiota. Food Chem. 2021, 357, 129532. [Google Scholar] [CrossRef]
  17. Zhang, L.; Gui, S.; Wang, J.; Chen, Q.; Zeng, J.; Liu, A.; Chen, Z.; Lu, X. Oral administration of green tea polyphenols (TP) improves ileal injury and intestinal flora disorder in mice with Salmonella typhimurium infection via resisting inflammation, enhancing antioxidant action and preserving tight junction. J. Funct. Food 2020, 64, 103654. [Google Scholar] [CrossRef]
  18. Jakobek, L.; Blesso, C. Beneficial effects of phenolic compounds: Native phenolic compounds vs metabolites and catabolites. Crit. Rev. Food Sci. Nutr. 2023; online first. [Google Scholar] [CrossRef]
  19. Minekus, M.; Alminger, M.; Alvito, P.; Ballance, S.; Bohn, T.; Bourlieu, C.; Carrière, F.; Boutrou, R.; Corredig, M.; Dupont, D.; et al. A standardised static in vitro digestion method suitable for food—An international consensus. Food Funct. 2014, 5, 1113–1124. [Google Scholar] [CrossRef] [Green Version]
  20. Jakobek, L.; Ištuk, J.; Buljeta, I.; Voća, S.; Šic Žlabur, J.; Skendrović Babojelić, M. Traditional, indigenous apple varieties, a fruit with potential for beneficial effects: Their quality traits and bioactive polyphenol content. Foods 2020, 9, 52. [Google Scholar] [CrossRef] [Green Version]
  21. Jakobek, L.; García-Villalba, R.; Tomás-Barberán, F.A. Polyphenol characterization of old local apple varieties from southeastern european region. J. Food Compos. Anal. 2013, 31, 199–211. [Google Scholar] [CrossRef]
  22. Vrhovsek, U.; Rigo, A.; Tonon, D.; Mattivi, F. Quantitation of polyphenols in different apple varieties. J. Agric. Food Chem. 2004, 52, 6532–6538. [Google Scholar] [CrossRef] [PubMed]
  23. Feliciano, R.P.; Antunes, C.; Ramos, A.; Serra, A.T.; Figueira, M.E.; Duarte, C.M.M.; de Carvalho, A.; Bronze, M.R. Characterization of traditional and exotic apple varieties from Portugal. Part 1—Nutritional, phytochemical and sensory evaluation. J. Funct. Food 2010, 2, 35–45. [Google Scholar] [CrossRef]
  24. Feng, S.; Yi, J.; Li, X.; Wu, X.; Zhao, Y.; Ma, Y.; Bi, J. Systematic review of phenolic compounds in apple fruits: Compositions, distribution, absorption, metabolism, and processing stability. J. Agric. Food Chem. 2021, 69, 7–27. [Google Scholar] [CrossRef]
  25. Šavikin, K.; Živković, J.; Zdunić, G.; Gođevac, D.; Ðorđević, B.; Dojčinović, B.; Ðorđević, N. Phenolic and mineral profiles of four Balkan indigenous apple cultivars monitored at two different maturity stages. J. Food Compos. Anal. 2014, 35, 101–111. [Google Scholar] [CrossRef]
  26. Veberic, R.; Trobec, M.; Herbinger, K.; Hofer, M.; Grill, D.; Stampar, F. Phenolic compounds in some apple (Malus domestica Borkh) cultivars of organic and integrated production. J. Sci. Food Agric. 2005, 85, 1687–1694. [Google Scholar] [CrossRef]
  27. Fernández-Jalao, I.; Balderas, C.; Sánchez-Moreno, C.; De Ancos, B. Impact of an in vitro dynamic gastrointestinal digestion on phenolic compounds and antioxidant capacity of apple treated by high-pressure processing. Innov. Food Sci. Emerg. Technol. 2020, 66, 102486. [Google Scholar] [CrossRef]
  28. Liu, D.; Dhital, S.; Wu, P.; Chen, X.D.; Gidley, M.J. In vitro digestion of apple tissue using a dynamic stomach model: Grinding and crushing effects on polyphenol bioaccessibility. J. Agric. Food Chem. 2020, 68, 574–583. [Google Scholar] [CrossRef]
  29. Kahle, K.; Kempf, M.; Schreier, P.; Scheppach, W.; Schrenk, D.; Kautenburger, T.; Hecker, D.; Huemmer, W.; Ackermann, M.; Richling, E. Intestinal transit and systemic metabolism of apple polyphenols. Eur. J. Nutr. 2011, 50, 507–522. [Google Scholar] [CrossRef]
  30. Neilson, A.P.; Hopf, A.S.; Cooper, B.R.; Pereira, M.A.; Bomser, J.A.; Ferruzzi, M.G. Catechin degradation with concurrent formation of homo- and heterocatechin dimers during in Vitro digestion. J. Agr. Food Chem. 2007, 55, 8941–8949. [Google Scholar] [CrossRef]
  31. Atkins, P. The Elemenst of Physical Chemistry, 3rd ed.; Oxford University Press: Oxford, UK, 2001; pp. 215–239. [Google Scholar]
  32. Butterworth, P.J.; Warren, F.J.; Grassby, T.; Patel, H.; Ellis, P.R. Analysis of starch amylolysis using plots for first-order kinetics. Carbohydr. Polym. 2012, 87, 2189–2197. [Google Scholar] [CrossRef]
  33. Goñi, I.; Garcia-AIonso, A.; Saura-Calixto, F. A starch hydrolysis procedure to estimate glycemic index. Nutr. Res. 1997, 17, 427–437. [Google Scholar] [CrossRef]
  34. Kan, L.; Oliviero, T.; Verkerk, R.; Fogliano, V.; Capuano, E. Interaction of bread and berry polyphenols affects starch starch digestibility and polyphenol bio-accessibility. J. Funct. Foods 2020, 68, 103924. [Google Scholar] [CrossRef]
  35. Lucas-Gonzalez, R.; Perez-Alvarez, J.A.; Moscaritolo, S.; Fernandez-Lopez, J.; Sacchetti, G.; Viuda-Martos, M. Evaluation of polyphenol bioaccessibility and kinetic of starch digestion of spaghetti with persimmon (Dyospyros kaki) flours coproducts during in vitro gastrointestinal digestion. Food Chem. 2021, 338, 128142. [Google Scholar] [CrossRef] [PubMed]
Figure 1. Phenolic subgroups and total phenolic compounds from apples before and at the end of two digestion phases (simulated gastric and intestinal digestion phases). Amounts (mg kg−1 FW) released from (A) peel and (B) flesh; percentages recovered from (C) peel and (D) flesh. Different letters above columns represent differences according to post-hoc Tukey test (p < 0.05).
Applsci 13 08434 g001
Figure 2. Correlation between c (mg kg−1 FW) predicted with the first- and second-order kinetic models and cexp (mg kg−1 FW) experimentally determined. c and cexp are concentrations of phenolic compounds at the endpoint of the reaction predicted by models or experimentally determined, respectively.
Applsci 13 08434 g002
Table 1. The amount of phenolic compounds from peel of apples before digestion and after simulated gastric and intestinal digestion (mg kg−1 FW).
BeforeGastric Digestion Intestinal Digestion
Phenolic CompoundsDigestion10 min20 min30 min60 min120 min10 min20 min30 min60 min120 min
Anthocyanins
cyanidin-3-galactoside17.2 ± 1.5 a4.3 ± 0.5 b4.2 ± 0.0 b4.5 ± 0.3 b4.5 ± 1.2 b3.6 ± 0.3 bn.d.n.d.n.d.n.d.n.d.
total17.2 ± 1.5 a4.3 ± 0.5 b4.2 ± 0.0 b4.5 ± 0.3 b4.5 ± 1.2 b3.6 ± 0.3 bn.d.n.d.n.d.n.d.n.d.
Flavan-3-ols
(+)-catechin7.2 ± 0.7 a0.8 ± 0.2 b0.7 ± 0.0 b0.7 ± 0.0 b0.8 ± 0.1 b0.9 ± 0.1 bn.d.n.d.n.d.n.d.n.d.
procyanidin B283.9 ± 10.5 a43.7 ± 10.7 b32.0 ± 2.1 b43.0 ± 8.6 b40.0 ± 6.4 b33.0 ± 1.0 bn.d.n.d.n.d.n.d.n.d.
(−)-epicatechin109.9 ± 1.7 a27.1 ± 6.1 b19.2 ± 2.6 b30.6 ± 6.6 b26.6 ± 6.2 b22.1 ± 3.9 bn.d.n.d.n.d.n.d.n.d.
total201.1 ± 12.9 a71.6 ± 17.0 b51.8 ± 4.7 b74.3± 5.2 b67.4 ± 12.7 b56.0 ± 4.8 bn.d.n.d.n.d.n.d.n.d.
Dihydrochalcones
phloretin-2-glucoside41.8 ± 0.8 a11.3 ± 2.0 b10.2 ± 0.5 b11.9 ± 0.8 b11.3 ± 1.0 b9.9 ± 0.2 b16.5 ± 5.0 b11.8 ± 2.6 b14.0 ± 0.0 b15.5 ± 0.0 bn.d.
total41.8 ± 0.8 a11.3 ± 2.0 b10.2 ± 0.5 b11.9 ± 0.8 b11.3 ± 1.0 b9.9 ± 0.2 b16.5 ± 5.0 b11.8 ± 2.6 b14.0 ± 0.0 b15.5 ± 0.0 bn.d.
Phenolic acids
chlorogenic acid141.0 ± 3.8 a42.7 ± 5.3 b33.3 ± 3.6 b,c43.0 ± 5.8 b39.1 ± 6.2 b,c34.7 ± 5.9 b,c23.1 ± 4.7 c21.6 ± 1.0 c22.3 ± 5.1 c39.9 ± 0.8 b,c30.2 ± 6.9 b,c
total141.0 ± 3.8 a42.7 ± 5.3 b33.3 ± 3.6 b,c43.0 ± 5.8 b39.1 ± 6.2 b,c34.7 ± 5.9 b,c23.1 ± 4.7 c21.6 ± 1.0 c22.3 ± 5.1 c39.9 ± 0.8 b,c30.2 ± 6.9 b,c
Flavonols
quercetin-3-galactoside14.3 ± 2.4 a8.0 ± 2.1 a,b8.4 ± 0.9 a,b8.9 ± 0.8 a,b11.0 ± 3.9 a,b8.7 ± 0.2 a,b8.0 ± 2.0 a,b6.5 ± 1.6 b7.2 ± 1.7 b7.4 ± 0.4 b6.4 ± 0.9 b
quercetin-3-glucoside48.8 ± 2.1 a21.5 ± 4.3 b22.0 ± 1.0 b23.2 ± 0.7 b26.0 ± 6.4 b21.3 ± 1.1 b22.9 ± 5.6 b18.1 ± 3.4 b25.4 ± 0.6 b31.5±4.7 b27.1±4.9 b
quercetin derivative *20.7 ± 1.2 a10.6 ± 2.2 d10.6 ± 0.0 d11.5 ± 0.2 c,d12.4 ± 2.6 b,c,d10.5 ± 0.7 d16.7 ± 3.8 a,b,c,d13.3 ± 1.7 b,c,d17.2 ± 0.1 a,b,c18.1 ± 1.0 a,b16.5 ± 0.8 a,b,c,d
quercetin-3-xyloside *42.4 ± 1.3 a16.3 ± 3.7 c16.6 ± 0.5 b,c18.1 ± 0.2 b,c19.7 ± 4.3 b,c16.8 ± 1.2 b,c23.2 ± 4.8 b,c19.9 ± 3.1 b,c23.7 ± 0.5 b,c25.7 ± 0.3 b21.6 ± 0.2 b,c
quercetin-3-rhamnoside90.0 ± 5.5 a53.6 ± 14.4 b51.3 ± 0.6 b56.5 ± 0.0 a,b70.5 ± 22.0 a,b54.5 ± 2.4 b54.6 ± 9.1 b49.2 ± 7.5 b54.8 ± 14.3 b63.6 ± 0.2 a,b55.9 ± 0.3 b
Total216.1 ± 6.0 a110.1 ± 26.7 b108.9 ± 3.0 b118.2 ± 1.9 b139.6 ± 39.1 b111.8 ± 5.2 b125.4 ± 25.3 b107.0 ± 17.3 b128.3 ± 17.3 b146.4 ± 2.8 b127.5 ± 4.2 b
TOTAL617.3 ± 23.3 a239.9 ± 51.6 b,c208.4 ± 11.9 b,c251.9 ± 24.0 b,c261.9 ± 60.3 b216.1 ± 5.0 b,c164.9 ± 35.0 b,c140.4 ± 20.9 c164.6 ± 22.4 b,c194.1 ± 9.0 b,c157.7 ± 2.7 b,c
Amounts before the digestion are mean values of three parallel experiments measured once on HPLC (n = 3), and amounts in the gastric and intestinal digestion are mean values of two parallel experiments, each measured once on HPLC (n = 2). The values in rows with different letters are significantly different according to the post hoc Tukey test (p < 0.05). * tentatively identified. n.d.—not detected.
Table 2. The amount of phenolic compounds in the flesh of apples before digestion and after simulated gastric and intestinal digestion (mg kg−1 FW).
BeforeGastric Digestion Intestinal Digestion
Phenolic CompoundsDigestion10 min20 min30 min60 min120 min10 min20 min30 min60 min120 min
Flavan-3-ols
(+)-catechin5.1 ± 0.2 b15.9 ± 0.2 a22.1 ± 2.4 a15.7 ± 0.4 a16.6 ± 3.0 a21.8 ± 5.6 an.d.n.d.n.d.n.d.n.d.
procyanidin B226.9 ± 1.1 a14.0 ± 4.1 b16.1 ± 0.2 b12.9 ± 2.3 b11.4 ± 0.8 b13.4 ± 1.8 bn.d.n.d.n.d.n.d.n.d.
(−)-epicatechin1.5 ± 0.3 a2.0 ± 0.3 a1.4 ± 0.1 a1.7 ± 0.7 a1.3 ± 0.3 a1.4 ± 0.1 an.d.n.d.n.d.n.d.n.d.
total33.6 ± 0.9 a31.9 ± 4.6 a39.5 ± 2.7 a30.2 ± 1.2 a29.4 ± 1.9 a36.6 ± 7.3 an.d.n.d.n.d.n.d.n.d.
Dihydrochalcones
phloretin-2-glucoside12.6 ± 1.1 a5.2 ± 0.6 b6.8 ± 0.0 b5.0 ± 0.0 b5.0 ± 0.6 b6.3 ± 2.2 bn.d.n.d.n.d.n.d.n.d.
total12.6 ± 1.1 a5.2 ± 0.6 b6.8 ± 0.0 b5.0 ± 0.0 b5.0 ± 0.6 b6.3 ± 2.2 bn.d.n.d.n.d.n.d.n.d.
Phenolic acids
chlorogenic acid22.7 ± 1.9 a5.6 ± 0.3 c6.6 ± 0.1 b,c5.6 ± 0.1 c5.3 ± 0.6 c6.6 ± 1.3 b,c9.7 ± 0.8 b9.6 ± 0.8 b8.9 ± 0.7 b,c7.5 ± 0.1 b,c10.0 ± 0.8 b
chlorogenic acid isomer *9.2 ± 0.5 a4.5 ± 0.5 b5.4 ± 0.1 b4.1 ± 0.0 b4.1 ± 0.4 b4.9 ± 1.5 bn.d.n.d.n.d.n.d.n.d.
total31.9 ± 2.2 a10.1 ± 0.8 b12.0 ± 0.0 b9.7 ± 0.1 b9.3 ± 1.0 b11.5 ± 2.8 b9.7 ± 0.8 b9.6 ± 0.8 b8.9 ± 0.7 b7.5 ± 0.1 b10.0 ± 0.8 b
Flavonols
quercetin-3-xyloside *9.5 ± 0.6 a4.3 ± 0.6 b5.6 ± 0.1 b4.1 ± 0.0 b4.0 ± 0.5 b5.0 ± 1.6 b11.5 ± 0.8 a11.3 ± 0.9 a9.9 ± 0.4 a9.1 ± 0.3 a11.7 ± 1.5 a
quercetin-3-rhamnoside6.0 ± 1.0 a2.7 ± 0.0 b3.1 ± 0.1 b2.7 ± 0.1 b2.8 ± 0.3 b3.0 ± 0.1 b3.3 ± 0.2 b3.4 ± 0.2 b3.1 ± 0.2 b3.0 ± 0.0 b3.6 ± 0.2 b
total15.5 ± 1.5 a7.0 ± 0.6 c8.6 ± 0.0 b,c6.8 ± 0.1 c6.8 ± 0.8 c8.0 ± 1.7 c14.8 ± 1.0 a14.6 ± 0.7 a13.1 ± 0.6 a12.1 ± 0.4 a,b15.3 ± 1.7 a
TOTAL93.5 ± 4.7 a54.2 ± 6.6 b66.9 ± 2.8 b51.7 ± 1.2 b50.5 ± 4.3 b62.5 ± 14.0 b24.4 ± 1.8 c24.2 ± 1.4 c21.9 ± 1.3 c19.6 ± 0.3 c25.3 ± 2.5 c
Amounts before the digestion are mean values of three parallel experiments measured once on HPLC (n = 3), and amounts in the gastric and intestinal digestion are mean values of two parallel experiments, each measured once on HPLC (n = 2). The values in rows with different letters are significantly different according to the post hoc Tukey test (p < 0.05). * tentatively identified. n.d.—not detected.
Table 3. Parameters of first and second order, with the use of modified equations.
First OrderSecond Order
k (min−1)t1/2 (min)c (mg kg−1)SEk (kg mg−1 min−1)t1/2 (min)c (mg kg−1)SECexp (mg kg−1)
Peel
Gastric
anthocyaninns0.401.74.30.460.3530.654.30.503.6
flavan-3-ols0.431.664.411.600.0101.4567.812.8856.0
dihydrochalcones0.203.511.21.330.0342.4811.91.529.9
phenolic acids0.223.139.36.400.0112.2741.77.0734.7
flavonols0.233.0120.413.590.0051.56125.112.94111.8
total0.401.7236.526.740.0080.50240.426.7216.1
Intestinal
dihydrochalcones0.302.314.52.580.1671.2514.72.5815.5
phenolic acids0.401.727.49.030.0662.0027.19.3430.2
flavonols0.0320.9135.413.800.00132.27141.714.14127.5
total0.302.3163.822.400.0092.00160.723.66157.7
Flesh
Gastric
flavan-3-ols0.322.233.84.990.3810.0833.65.0636.6
dihydrochalcones0.282.55.70.940.3720.475.80.966.3
phenolic acids0.322.210.61.310.5070.1910.61.3311.5
flavonols0.282.57.60.920.3260.407.60.958.0
total0.312.357.78.140.0980.1857.68.2962.5
Intestinal
phenolic acids0.107.38.81.030.0814.428.71.0710.0
flavonols0.910.814.01.560.1451.1114.21.6615.3
total0.312.322.72.510.0450.5522.22.5225.3
SE—standard error.
Disclaimer/Publisher’s Note: The statements, opinions and data contained in all publications are solely those of the individual author(s) and contributor(s) and not of MDPI and/or the editor(s). MDPI and/or the editor(s) disclaim responsibility for any injury to people or property resulting from any ideas, methods, instructions or products referred to in the content.

