Abstract
Compounds and solid solutions of bismuth ferrite (BiFeO3)—barium titanate (BaTiO3) system are of great scientific and engineering interest as multiferroic and potential high-temperature lead-free piezoelectric materials. In the present paper, the results of research on the synthesis and characterisation of 0.67Bi1.02FeO3–0.33BaTiO3 (67BFBT) ceramics in terms of crystal structure and dielectric and piezoelectric properties are reported. It was found that the produced 67BFBT ceramics were characterised by a tetragonal crystal structure described by the P4mm space group, an average crystallite size <D> ≈ 80 nm, and an average strain <ε> = 0.01%. Broad-band dielectric spectroscopy (BBDS) was employed to characterise the dielectric response of polycrystalline ceramics. The frequency range from ν = 10−1 Hz to ν = 105 Hz was used to characterise the influence of the electric field strength on dielectric response of the ceramic sample at room temperature. The dielectric spectra were checked for consistency with the Kramers–Kronig test, and the high quality of the measurements were confirmed. The electric equivalent circuit method was used to fit the dielectric spectra within the frequency range that corresponded to the occurrence of the resonant spectra of the radial mode for thin disk sample, i.e., from ν = 105 Hz to ν = 107 Hz and the temperature range from T = −20 °C to T = 50 °C. The electric equivalent circuit [RsCPE1([L1R1C1]C0)] was used, and good fitting quality was reached. The relevant calculations were performed, and it was found that the piezoelectric charge coefficient exhibited a value of d31 = 35 pC/N and the planar coupling factor was kp = 31% at room temperature. Analysis of impedance spectra performed in terms of circumferential magnetic field made it possible to establish an influence of magnetic field on piezoelectric parameters of 67BFBT multiferroic ceramics. Additionally, the “magnetic” tunability of the modulus of the complex dielectric permittivity makes 67BFBT a sensing material with vast potential.
1. Introduction
From a scientific point of view, multiferroic materials are a somewhat mysterious yet, at the same time, extremely interesting class of materials. Thanks to the unique properties of these materials, which are characteristic of both ferroelectric and ferromagnetic materials, they have a wide range of potential applications. Multiferroic materials can open new horizons in the design of modern devices, especially those whose operation is based on controlling the electrical properties of materials (and thus influencing the parameters of the electrical circuit) by changing the magnetic field and vice versa, i.e., controlling the magnetic properties of materials by changing electric field strength [1].
Let us consider the terminal elements of bismuth ferrite (BiFeO3)—barium titanate (BaTiO3) system. It is well known that BiFeO3 has an ABO3-type perovskite structure and is one of the few materials characterised by the coexistence of ferroelectric and (anti)ferromagnetic properties at room temperature. Because of this essential feature of multiferroics, BiFeO3 (BFO) is considered the most suitable among all available multiferroic materials for the development of practical spintronic devices and related technologies [2]. BaTiO3 (BT) belongs to the corner-sharing oxygen octahedral material family (structure), which was discovered during World War II. Since then, it has remained one of the most widely used and systematically studied non-linear dielectric materials and is considered the prototype for ferroelectric ceramics as well as being the first piezoelectric ceramics transducer ever developed [3]. Since the discovery of BT in the early 1940s, it has been continually used in new industrial and commercial applications. Its unique physical characteristics, e.g., values of piezoelectric (d33 ~190 pC/N) and dielectric (εr ~1700 and low dielectric losses at room temperature) parameters, enable the use of BT ceramics for capacitors, multilayer capacitors, ultrasonic transducers, pyroelectric infrared sensors, positive temperature coefficient resistors, and energy storage devices [4,5].
However, neither BFO nor BT are actually used in their pure chemical form. To optimise properties for specific applications, they are often combined with various additives that adjust and enhance their basic properties. They are also combined with each other to form either compounds or ceramic–ceramic composites, which have received a lot of scientific interest [6,7,8]. To justify the above-mentioned points, let us point out a bulk ternary BiFeO3–BaTiO3 and PbTiO3 system [9] that was fabricated and studied as a potential high-temperature piezoelectric ceramics transducer. In case of Tm-doped 0.7Bi1−xTmxFeO3–0.3BaTiO3 (x = 0–0.05) ceramics, it was found that Tm-induced structural modifications yielded improvements in the dielectric constant, remnant polarization, and remnant magnetization values [10]. On the other hand, studies of Mn-modified (1 − x)BiFeO3–xBaTiO3 ceramics showed that the addition of Mn improved dielectric losses and increased dc resistivity in bulk BiFeO3–BaTiO3, greatly enhancing the piezoelectric response; however, the poor stability of the poled domain structure caused rapid ageing and a large difference between low- and high-field piezoelectric charge coefficient d33 [11].
The main motivation to carry out the present research was the high potential for practical application that the materials of the BiFeO3–BaTiO3 system have. In addition, the issues of the physics and technology of multiferroic materials are extremely rich, interesting, and non-trivial from a scientific point of view. Novel materials of rich functionality can be created by means of combining and properly modifying bismuth ferrite and barium titanate. Therefore, the chemical composition 0.67Bi1.02FeO3–0.33BaTiO3 (67BFBT) was chosen as the research material due to its potential use as an alternative to lead-based piezoelectric materials [8,11,12].
The aim of the present research was to synthesise 0.67Bi1.02FeO3–0.33BaTiO3 (67BFBT) multiferroic ceramics and characterise the produced ceramics in terms of crystal structure, surface morphology, impedance spectroscopy, and piezoelectric properties, including modelling with the electric equivalent circuit method and the use of a circumferential magnetic field to reveal the effect of a weak magnetic field on the piezoelectric and dielectric properties of 67BFBT ceramics.
2. Materials and Methods
Ceramics of 0.67Bi1.02FeO3–0.33BaTiO3 composition were synthesised by a conventional solid-state reaction process. Chemically pure Bi2O3 (Sigma Aldrich, Burlington, MA, USA, 99.9%), Fe2O3 (Sigma Aldrich, USA, 99%), TiO2 (Sigma Aldrich, USA, 99.8%) metal oxides, and BaCO3 (Sigma Aldrich, USA, 99%) were used as raw materials. To obtain a homogeneous mixture, stoichiometric amounts of oxide and carbonate precursors were first carefully weighted. Then, they were mixed thoroughly by ball-milling in a polyethene bottle with yttria-stabilised ZrO2 (YSZ) balls for 24 h in ethanol dispersion reagent. After that, they were calcined at 900 °C for 6 h in a box furnace. Later on, the calcined powder was ball-milled again for 24 h, and then the dried powder was slightly pressed into compacts in a stainless steel die into disks with a diameter of 10 mm using a uniaxial press, followed by cold isostatic pressing (CIP) at 200 MPa for 5 min. The green pellets were sintered at 970 °C for 3 h in a box furnace.
The relative density, crystal structure, and microstructure of the sintered sample were examined by using the Archimedes method, an X-ray diffractometer (XRD, D/Max-2500, Rigaku, Japan), and a scanning electron microscope (SEM, JEOL JSM-7900F), respectively. Two-dimensional grain sizes of the sintered 67BFBT ceramics were calculated by measuring more than 100 grains area in the SEM image using ImageJ—a public domain Java image processing and analysis programme [13,14]. The obtained values were then converted to three-dimensional grain sizes by multiplying by a factor of 1.68 [15].
Broad-band dielectric spectroscopy measurements (BBDS) [16] were carried out using a system consisting of a high performance frequency analyser (Alpha-AN) and a temperature control system (Quatro Cryosystem) via Novocontrol. It is well known (see [17,18]) that, by applying the suitable strategy and alternative methods of analysing the experimental immittance data obtained as a result of the BBDS measurement, it is possible to characterise the electrical and dielectric properties of the ceramic material.
Spectroscopic measurements were carried out on disk-shaped pieces that were 7.52 mm in diameter and 0.6 mm thick. To ensure a good electric contact, the sample ends were cleaned with a soft acid solution and silver electrodes (silver paste) were deposited. Before the measurement, the system was cooled down to −20 °C with liquid nitrogen. The measurements were performed during the heating cycle up to a maximum temperature of 50 °C. Dielectric spectra were recorded at programmed temperatures with a temperature step of 10 °C 15 min after the temperature had been stabilised. The measurement software allowed a frequency run of 40 points per decade in the measuring frequency range. WinDATA Novocontrol software was used for the recording, visualization, and processing of experimental data. However, to check the consistency of the experimental data, a computer programme created by Boukamp was used [17,19]. The Kramers–Kronig test was carried out for experimental data measured at room temperature within a frequency range from ν = 10−1 Hz to ν = 105 Hz. The amplitude of the test voltage and related electric field strength were as follows: Uac = 0.1 Vrms (Eac = 166 V/m), Uac = 0.2 Vrms (Eac = 333 V/m), Uac = 1.0 Vrms, (Eac = 1666 V/m), and Uac = 2.0 Vrms (Eac = 3333 V/m) (root mean square—rms). Practical application of the impedance data validation method in the study of electroceramics was described by us in detail elsewhere (in [20] and the references cited therein). Experimental data recorded within a frequency range from ν = 105 Hz to ν = 107 Hz, which corresponded to the occurrence of radial mode resonance spectra for a sample in the form of a thin disk, were fitted to the electric equivalent circuit [RsCPE1([L1R1C1]C0)]. Complex non-linear least squares method (CNLS) was employed for fitting [17,19].
Piezoelectric parameters were calculated according to resonance (anti-resonance method) [21,22]. For this method, an accurate impedance analyser is a crucial requirement for use in testing (a Novocontrol high-performance frequency analyser was used for the current study’s experiments). The resonant frequencies (νr) and anti-resonant frequencies (νa) were detected based on spectroscopic characteristics measured in the course of BBDS experiments, and the free capacitance CT at 1 kHz was measured [23].
Calculations were performed using the classical formulas for radial vibrations of a disk-shape sample [21,22,23,24,25].
3. Results and Discussion
3.1. Morphology Studies of 0.67Bi1.02FeO3–0.33BaTiO3 Ceramics
The morphology of 0.67Bi1.02FeO3–0.33BaTiO3 ceramics sintered at 970 °C is shown in Figure 1a, whereas a histogram of the grain size distribution is shown in Figure 1b.
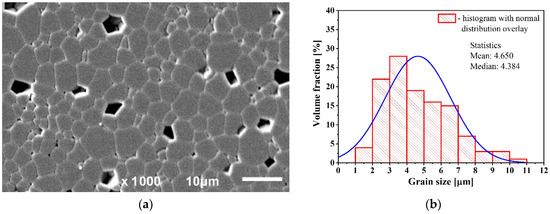
Figure 1.
(a) Morphology of 67BFBT ceramics sintered at 970 °C; (b) grain size distribution.
One can see from Figure 1a that several polygonal voids are present in the cross-section of the ceramic sample subjected to the SEM investigation preparation procedure. It is worth noting that all the voids visible in the photo (Figure 1a) exhibit regular, mostly pentagonal shapes that resemble the shape of the grains of the ceramics under study. Therefore, it is reasonable to suppose that the voids were “man-made” and created during the mechanical treatment of the cross-section surface of the ceramic sample (i.e., sample preparation for SEM investigation). It is reasonable to suppose that the grains that initially took their sites were removed from their original positions by mechanical treatment.
The grain size distribution was measured with the help of an image processing and analysis programme (ImageJ [13,14]) on the basis of SEM photos of the ceramic sample (Figure 1a), and the results are given in Figure 1b. The mean and median values of the average grain size were approximately 4.7 and 4.4 μm, respectively.
3.2. X-ray Diffraction Studies
As an example, an X-ray diffraction pattern of 67BFBT ceramics sintered at 970 °C is shown in Figure 2. The search-match process was performed using Match! software (Crystal Impact, Bonn, Germany) [26]. Phase analysis was performed, and it was found that the reference pattern of Ba0.3Bi0.7FeO2.85 [27] matches all peaks shown within the measuring range 2Θ with Figure-of-Merit (FoM) parameter FoM = 0.96.
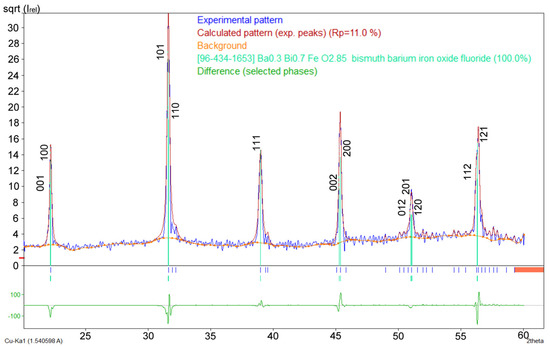
Figure 2.
X-ray diffraction pattern of 67BFBT ceramics. Ba0.3Bi0.7FeO2.85 was taken as a standard; COD ID:4341652.
It is worth noting that the reference pattern (source of entry: Crystallography Open Database; COD ID 4341652) exhibited a tetragonal structure (space group P4mm) with the following unit cell parameters: a = 3.9963 Å and c = 4.0032 Å. Based on Archimedes’ method and calculations of theoretical density, it was found that 67BFBT ceramics reached a relative density of 94.5%.
Line profile analysis was performed, and the resulting Williamson–Hall plot is shown in Figure 3.
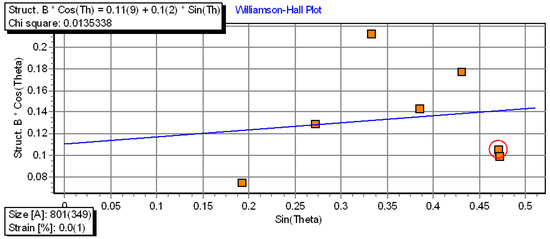
Figure 3.
Williamson–Hall plot for 67BFBT ceramics calculated based on X-ray diffraction pattern.
One can see from the Williamson–Hall plot that the average size of the crystallites is <D> = 801 Å. The average strain (<ε>), which is a measure of micro-deformations, is <ε> = 0.01%.
3.3. Data Validation of Impedance Measurements
It is commonly known (e.g., see [16,17,18,19]) that impedance spectroscopy is extremely susceptible to random disturbances. Therefore, knowing the quality of the measured impedance data is extremely important to facilitate correct analysis. Kramers–Kronig (K-K) relations are very helpful for data validation [17,19]. The Kramers–Kronig rule states that the imaginary part of a dispersion is fully determined by the form of the real part of dispersion over the frequency range ∞ ≥ ν ≥0. Similarly, the real part of dispersion is determined by the form of the imaginary part of dispersion [17]. In the present study, an analysis based on the K-K relations was performed with the use of the computer programme created by Boukamp [17,19].
Kramers–Kronig transform test results of impedance data measured for 67BFBT ceramics at room temperature (RT) within the frequency range Δν = (10−1–105) Hz are shown in Figure 4a and Figure 5a. A complex impedance diagram combined with K-K transform test results measured at a signal voltage of U = 0.1 Vrms is shown in Figure 4b. An Impedance diagram with K-K transform test results measured at a signal voltage of U = 2.0 Vrms is shown in Figure 5b. One can see in Figure 4a and Figure 5a that the data recorded at RT exhibit a small deviation from K-K behaviour (residuals are less than 0.4%). Upon inspection of the results given in Figure 4b and Figure 5b, it can be determined that there is very good agreement between the measurements (blue circles) and K-K calculations (red crosses).
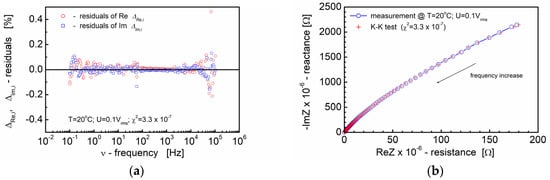
Figure 4.
Results of the Kramers–Kronig validation test for admittance measurements of 67BFTO ceramics at RT and measuring signal voltage U = 0.1 Vrms. Panel (a) shows the residuals plot; panel (b) shows the comparison of measured (blue circles) and calculated values (red crosses) for complex impedance plot (−Z” vs. Z’; free scale).
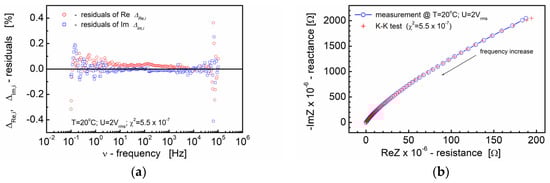
Figure 5.
Results of the Kramers–Kronig validation test for dielectric measurements of 67BFTO ceramics at RT and measuring signal voltage U = 2 Vrms. Panel (a) shows the residuals plot; panel (b) shows the comparison of measured and calculated values for complex impedance plot (−Z” vs. Z’; free scale).
The quality parameter “chi-squared” reached a value of χ2 = 3.3 × 10⁻⁷–5.5 × 10⁻⁷ for room temperature measurements taken at U = 0.1 Vrms (E = 166 V/m) and U = 2.0 Vrms (E = 3333 V/m), respectively. The above-mentioned results proved the high quality of the measurements and fully justified further analysis of the impedance data.
An alternative representation of the impedance data showing the influence increasing electric field intensity on the spectroscopic dependence of the reactance (reactance times pulsation: −Z”ω) of the piezoelectric ceramic sample 67BFTO at room temperature is shown in Figure 6a. It can be seen that the spectroscopic plots shift towards higher frequencies as the electric field strength increases. Additionally, the dependence of the real part of complex impedance (Z’) on the imaginary part of complex impedance times pulsation (−Z”ω) (Figure 6b) shows the substantial dependence on the electric field strength.
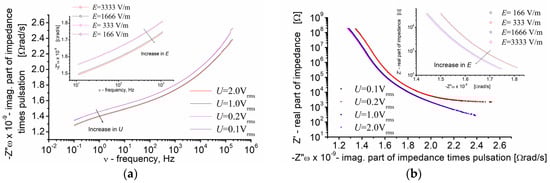
Figure 6.
Alternative representation of the impedance data collected at room temperature and signal amplitude U = 0.1 Vrms, U = 0.2 Vrms, U = 1.0 Vrms, and U = 2.0 Vrms. Panel (a) shows the dependence of reactance times pulsation (−Z”ω) on frequency (ν); panel (b) shows the dependence of resistance (Z’) on reactance times pulsation (−Z”ω).
As shown in the next paragraph of this paper (Section 3.4), an increase in the electric field strength causes an increase in the circumferential magnetic field strength. In turn, the dependence of electric (and dielectric) parameters on magnetic field strength (and vice versa) is a key feature of multiferroic materials, especially lead-free piezoelectric ceramics such as 67BFTO.
3.4. Piezoelectric Ceramics Characterisation with the Resonant Method
It is commonly known (e.g., see [21,24]) that values of the piezoelectric properties of a material can be derived from the resonance behaviour of suitably shaped specimens subjected to a sinusoidally varying electric field. Therefore, the impedance measurements were performed for 67BFBT ceramics within the following frequency range: ν = 100 kHz–10 MHz, which corresponded to the frequency ranges of resonant spectra of the radial mode and the thickness extension mode for thin disk sample [21,22].
To reveal the influence of a weak circumferential magnetic field on the resonance behaviour of multiferroic lead-free material, the measuring voltage U = 0.1 Vrms and U = 2.0 Vrms was taken. Taking into account all the impedances in the circuit, the measuring sinusoidal signal leads to electric currents (iac) through the sample of 67BFBT ceramics in the range following range: iac = 1.2 mA (at Uac = 0.1 Vrms, ν = 10 MHz)–11.7 mA (at U = 2.0 Vrms, ν = 10 MHz). The ac field amplitude (rms) generated by these currents in a radial point r on the sample can be calculated as:
where r is the radial point considered on the sample cross-section, and a is its total radius. The rms range of ac-measuring fields leads to circumferential magnetic fields (i.e., on the sample edges—the lateral surface of the disk-shaped sample—is where it is highest) between 0.05 and 0.49 A/m (at U = 0.1 Vrms and U = 2.0 Vrms, ν = 10 MHz, respectively) [28]. The results of the calculated radial magnetic field intensity Hac are given in Figure 7. It is worth noting that the resonance behaviour of the 67BFBT ceramic sample is also reflected in Figure 7. Positions of the resonances are closely related to the piezoelectric properties of the material.
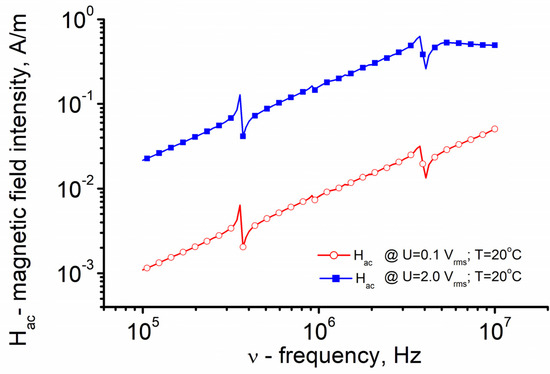
Figure 7.
Dependence of circumferential magnetic field intensity Hac on frequency of the measuring field for 67BFBT ceramics studied at temperature 20 °C; measuring voltage 0.1 Vrms and 2.0 Vrms.
Figure 8 shows the frequency response of a 0.67Bi1.02FeO3–0.33BaTiO3 ceramic thin disk that was 7.52 mm in diameter and 0.6 mm thick. Electrodes were deposited onto both faces of the disk, and then the disk was poled in the direction perpendicular to the faces of the disk. The measurements were taken within a temperature range from −20 °C to 50 °C. It should be noted that the frequency peaks visible at about 3–4 × 10⁵ Hz (Figure 8) are radial resonances, whereas the frequency peaks visible at about 3–5 × 10⁶ Hz (also in Figure 8) are related to the thickness mode resonance.
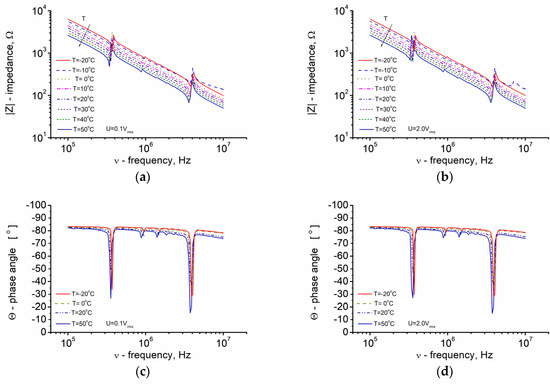
Figure 8.
Dependence of impedance modulus |Z| as well as the phase angle (Θ) on frequency for 67BFBT ceramics; measuring voltages: U = 0.1 Vrms (a,c) and U = 2.0 Vrms (b,d).
Spectroscopic plots of modulus of complex impedance |Z| exhibit the characteristic frequencies, namely νmin when the impedance |Z| is at its minimum (|Z|min) and νmax when the impedance is at its maximum (|Z|max) (Figure 8a,b). At the same time, the phase angle (Θ) given in Figure 8c,d tends to have a value of “zero.”
3.5. Modelling of Impedance—Frequency Characteristics of the Piezoelectric Equivalent Circuit
Let us first explain the notation used. In the adopted notation, square or box brackets [ ] denote that elements are in series-connected, whereas round brackets or parentheses ( ) denote the parallel connection of electric elements. According to the adopted notation, (RC) is a parallel circuit, while [RC] is a series connection of the elements R and C.
To accurately approximate the behaviour of the piezoelectric specimen close to its fundamental resonance, it can be represented by the electric equivalent circuit ([L1R1C1]C0) consisting of a “mechanical arm” (L, C, and R connected in series) and C0 (which corresponds to the electrical capacitance of the specimen) connected in parallel [24]. In this connection, it is worth remembering that the impedance of the parallel circuit can be represented by the equivalent series circuit consisting of equivalent in series-connected resistance and reactance values.
In the case of our simulation and fitting, the modified electric equivalent circuit [RsCPE1([L1R1C1]C0)] including resistance Rs and constant phase element CPE1 connected in series with the “piezoelectric” equivalent circuit was used. Figure 9 shows the electric equivalent circuit used for the simulation and fitting of the impedance response of the ceramic specimen vibrating close to its fundamental resonance.
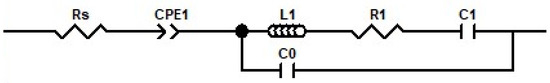
Figure 9.
Electric equivalent circuit of a piezoelectric specimen used for simulation and fitting of the dielectric response.
It should be noted that the resonance frequency νr and antiresonance frequency νa correspond to the “zero” value of reactance for the electric equivalent circuit (Figure 9). The reactance of the “mechanical arm” is zero at the series resonant frequency νs when:
where ω is the angular frequency (ω = 2 πν).
The reactance of the parallel circuit is zero at the parallel resonant frequency (νp). The parallel resonance νp occurs when the currents flowing in the two arms are in antiphase, which is when:
In this connection, it must be pointed out that the relation between the above-mentioned characteristic frequencies of the equivalent circuit is as follows: νmin < νs < νr. However, the difference between them is very small (νmin~νs~νr) [24]. Similar relation exists between antiresonance, parallel resonance, and |Z|max frequencies: νa < νp < νmax (νa~νp~νmax). What is important is that values of νmin an νmax can be readily measured using an impedance analyser (Alpha-AN High Performance Frequency Analyzer).
An example of the fitting results obtained for impedance characteristics measured under the influence of a weak circumferential magnetic field is shown in Figure 10. Figure 10a shows the spectra measured at Hac = 0.05 A/m, (E = 166 V/m; U = 0.1 Vrms) at 20 °C, whereas Figure 10b shows the results obtained for spectrum measured under the following conditions: Hac = 0.49 A/m, (E = 1333 V/m; U = 2 Vrms) at 20 °C.

Figure 10.
Impedance/frequency characteristics of 67BFBT ceramics (empty symbols) studied under the following conditions: temperature—20 °C and measuring voltages—(a) U = 0.1 Vrms.; (b) U = 2.0 Vrms. Fit result (green solid line) was limited to the frequency range of the first resonance.
Experimental data were fitted to the electric equivalent circuit using the ZView programme (Scribner Associates, Inc. Southern Pines, NC, USA). Complex non-linear least squares method (CNLS) was employed for the analysis of the impedance/frequency data of the electroceramics [17]. The fitting procedure was limited to the frequency range of the radial resonances ∆ν = (2–6) × 105 Hz. The quality of the fitting procedure was estimated according to the following parameters: “chi-squared” (χ2) and weighted sum of squares (WSS) [29]. In the case of the fitting results shown in Figure 10, the parameters were as follows: “chi-squared” was χ2 = 2.78 × 10⁻³ and χ2 = 3.23 × 10⁻³ for U = 0.1 Vrms and U = 2.0 Vrms, respectively. The weighted sum of squares was WSS = 0.314 and WSS = 0.177 for U = 0.1 Vrms and U = 2.0 Vrms, respectively.
Figure 11 shows the dependence of the fitting quality parameters, namely “chi-squared” (χ2) and weighted sum of squares (WSS), on the temperatures at which the impedance/frequency characteristics of 67BFBT ceramics were recorded.
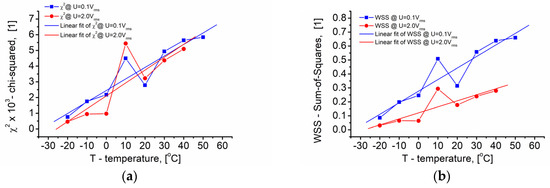
Figure 11.
Fitting quality parameters χ2 (“chi-squared”) (a) and weighted sum of squares (WSS) (b) obtained as a result of fitting the experimental resonance spectra and response of the electric equivalent circuit given in Figure 8; amplitude of the measuring signal: U = 0.1 Vrms (blue squares) and U = 2.0 Vrms (red circles).
One can see in Figure 11 that both χ2 (“chi-squared”) fitting quality parameter (Figure 11a) and WSS parameter (Figure 11b) change within one order of magnitude. Upon visual inspection, it can be seen that the linear approximations used for the χ2 and WSS data approximation show that a higher electric field strength of the measuring signal (and, at the same time, a higher value of the circumferential magnetic field strength) improves the quality of the fitting procedure. This also means that the data is less susceptible to external interference. A comparison of the statistical characteristics of the obtained “chi-squared” fitting quality parameters showed that the standard deviation was SD = 0.00192 and SD = 0.00212 for the low value of the electric field strength E = 166 V/m (U = 0.1 Vrms) and high electric field strength E = 3333 V/m (U = 2.0 Vrms), respectively. The WSS parameter showed that the standard deviation was SD = 0.21743 and SD = 0.11077 for E = 166 V/m and E = 3333 V/m, respectively. An increase in the intensity of the measuring field led to a substantial improvement in the quality of further data simulation.
3.6. Calculation of Piezoelectric Parameters of 67BFTO Ceramics
The entry parameters used to calculate the piezoelectric parameters of BFBT ceramics, namely resonant frequencies νr, anti-resonant frequencies νa, impedance, and free capacitance CT on 1 kHz were measured by using the aforementioned impedance analyser. As shown in Figure 8, a thorough analysis of the experimental data (i.e., measured impedance spectra) was also performed. The procedure for the calculation of single coefficients is described in detail in classical textbooks (e.g., see [21,24,25]), scientific papers (e.g., see [22,23]), or standards (e.g., see [30]). The results of the calculations are given in Figure 12 and Figure 13.
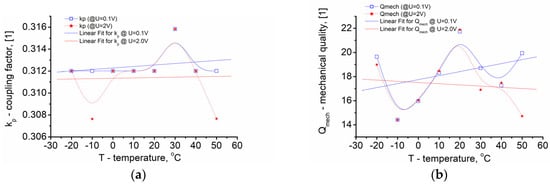
Figure 12.
(a) Dependence of the planar coupling factor kp for the vibration along the radial direction in a circle-shaped disk of 67BFTO ceramics on temperature; (b) dependence of mechanical quality factor on temperature; calculations were performed based on experimental impedance data measured under the influence of radial magnetic field Hac = 0.05 A/m (U = 0.1 Vrms) and Hac = 0.49 A/m (U = 2.0 Vrms).
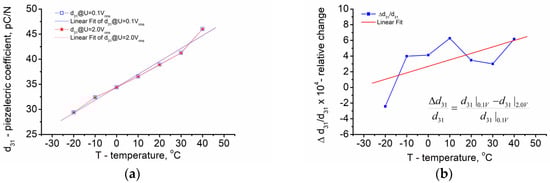
Figure 13.
(a) Dependence of piezoelectric charge coefficient d31 on temperature; (b) dependence of the relative change in d31 on temperature; the inset in Figure 13b shows the formula for calculation of the relative change in piezoelectric modulus d31.
Figure 12a shows dependence of the planar coupling factor kp for the vibration along the radial direction in a circle-shaped disk of 67BFTO ceramics on temperature. The results of the calculations of the mechanical quality factor Qm are given in Figure 12b.
One can see from Figure 12a that the coupling factor for both magnetic circumferential fields has a value of about kp = 31%. Local extremes visible on the plots at −10 °C and −30 °C differ from the average value by about 1%. Therefore, it is reasonable to use linear regression fit for data analysis. The difference between the linear fit plots is rather small but can easily be discerned. Moreover, the linear regression fit for a higher magnetic field (Hac = 0.49 A/m) shows better stability with temperature within the measured temperature range.
One can see from Figure 12b that the mechanical quality factor Qm exhibits non-monotonic behaviour with increasing temperature for both of the used values of magnetic circumferential field intensity. The local extremes are clearly visible. Within the temperature range ∆T = (−30–+20) °C, the courses of the Qm curves are almost identical. The influence of magnetic field intensity on Qm becomes noticeable at about room temperature (20 °C). The difference between the linear fit plots can easily be discerned in Figure 12b. One can see that the linear regression fit for higher magnetic field intensity (Hac = 0.49 A/m; red line in Figure 12b) shows a negative slope with temperature within the measured temperature range, whereas the linear regression fit for Qm behaviour at a smaller magnetic circumferential field exhibits a positive one (Hac = 0.05 A/m; blue squares; blue line in Figure 12b).
Figure 13a shows the dependence of piezoelectric charge coefficient d31 on the radial vibration mode of a thin disk (excited through the piezoelectric effect across the thickness of the disk). One can see from Figure 13a that the piezoelectric charge coefficient d31 increases from d31 ≈ 30 pC/N to d31 ≈ 45 pC/N at the following temperature range: ∆T = (−20–+40) °C. The courses of the d31 curves calculated for data measured at radial magnetic field Hac = 0.05 A/m (blue squares; solid line; U = 0.1 Vrms) and Hac = 0.49 A/m (U = 2.0 Vrms; red stars; dashed line) are almost identical. Additionally, the linear regression fits for the experimental data cannot easily be discerned in Figure 13a. Linear regression (Y = A + B × X) for the data measured at Hac = 0.05 A/m (U = 0.1 Vrms) exhibited the following parameters: A = 3.44221 × 10⁻¹¹; B = 2.57759 × 10⁻¹³; and R = 0.99097. Alternatively, linear regression for the data measured at Hac = 0.49 A/m (U = 2.0 Vrms) showed the following values: A = 3.4412 × 10⁻¹¹; B = 2.57385 × 10⁻¹³; and R = 0.99102. Therefore, to show the possible influence of the circumferential magnetic field on the piezoelectric charge coefficient d31, the relative change in the d31 piezoelectric modulus was introduced, and the results are plotted in Figure 13b.
One can see from Figure 13b that the plot of the relative change in the d31 piezoelectric modulus exhibits non-monotonic behaviour with increasing temperature. Within the measuring temperature range, one local maximum and one local minimum are clearly visible in the plot. One can see from Figure 13b that, according to linear fit, the relative change in the piezoelectric modulus has a positive sign within the whole measuring temperature range. This means that an increase in the intensity of the circumferential magnetic field generated by electric currents through the sample causes the suppression of the piezoelectric response of the multiferroic ceramic sample under study.
The above-mentioned influence of circumferential magnetic field on the piezoelectric charge coefficient d31 can explain the dielectric properties of multiferroic ceramics. The point is that the magnetic field influences both real (ε’) and imaginary (ε”) parts of the complex dielectric permittivity. It was found that the higher the radial magnetic field, the lower the dielectric permittivity (at a given temperature). As an example, the dependence of the real and imaginary parts of the complex dielectric permittivity on frequency (below resonance) for radial magnetic field Hac = 0.023 A/m (U = 2.0 Vrms; ν = 105 Hz) and Hac = 0.012 A/m (U = 1.0 Vrms; ν = 105 Hz) at 20 °C are shown in Figure 14.
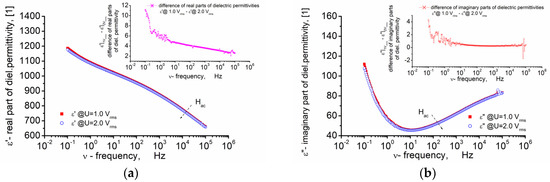
Figure 14.
(a) Dependence of the real part of complex dielectric permittivity (ε’) on frequency. (b) Dependence of the imaginary part of complex dielectric permittivity (ε”) on frequency; measurements were performed under electric field strength E = 1666 V/m (U = 1.0 Vrms) and E = 3333 V/m (U = 2.0 Vrms) corresponding to radial magnetic field Hac = 0.012 A/m and Hac = 0.023 A/m (at ν = 100 kHz, respectively).
The influence of the circumferential magnetic field on the dielectric properties of 67BFBT ceramics was also revealed when the difference of the modulus of dielectric permittivity was plotted against the difference of circumferential magnetic field caused by the electric currents (iac) flowing through the ceramic sample (Figure 15).
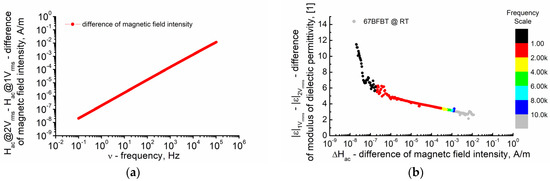
Figure 15.
Dependence of the difference of circumferential magnetic field strength on frequency of the measuring electric field (a). Dependence of modulus of complex dielectric permittivity on circumferential magnetic field strength (b).
One can see in Figure 15a that the difference in circumferential magnetic fields generated by the electric currents flowing through the sample linearly depends (in log-log scale) on the frequency of the measuring sinusoidal signal. On the other hand, Figure 15b shows that the change in magnetic field strength causes a change in the modulus of the complex dielectric permittivity. Thus, the possibility of adjusting the dielectric permittivity (and therefore capacitance value) via changes in magnetic field intensity was obtained for 67BFBT ceramics. It is worth noting that changing the capacitance of a capacitor in an electric circuit has a predictable effect on the complex impedance and phase angle in the circuit. These parameter changes can be exploited to yield tuneable impedance-matching networks, tuneable filters, phase shifters, and other functional multiferroic devices.
4. Conclusions
Multiferroic 0.67Bi1.02FeO3–0.33BaTiO3 (67BFBT) ceramics were fabricated via a solid-state reaction process and subsequent sintering in a box furnace. They were studied in terms of structure and dielectric and piezoelectric properties. The fabricated 67BFBT ceramics adopted the tetragonal crystal structure described by the P4mm space group. The average crystallite size was <D> ≈ 80 nm, and the average strain was <ε> = 0.01%. Broad-band dielectric spectroscopy (BBDS) was used for measurements whereas the electric equivalent circuit method was used to fit the impedance-frequency spectra within the frequency range of the radial resonances. Complex non-linear least squares method (CNLS) was employed to fit the parameters of the electric equivalent circuit [RsCPE1([L1R1C1]C0)]. The high quality of the fitting procedure was confirmed by “chi-squared” (χ2) and weighted sum of squares (WSS) parameters. Measurements and subsequent fitting and simulations have shown that the planar coupling factor was kp ≈ 31%, and the mechanical quality was within the range Qmech ≈ 21. The piezoelectric charge coefficient for the radial vibration mode of a thin disk (excited through the piezoelectric effect across the thickness of the disk) exhibited a value of d31 ≈ 35pC/N at room temperature.
The idea of using a measuring signal of different amplitudes (BBDS measurements) was to check the possible influence of the radial magnetic field caused by electric currents flowing through the sample on the piezoelectric properties of multiferroic 67BFBT ceramics. The rms range of ac measuring fields led to circumferential magnetic fields ranging from 0.05 A/m to 0.49 A/m. It was established that an increase in the intensity of the circumferential magnetic field caused the suppression of the real (ε’) and imaginary (ε”) parts of the complex dielectric permittivity and piezoelectric charge coefficient (d31) of the multiferroic 67BFTO ceramics within the range of the measurement parameters used (i.e., frequency, temperature, and radial magnetic field). The “magnetic” tunability of the dielectric properties of 67BFBT ceramics was also found, as evidenced by the possibility of adjusting the modulus of the complex dielectric permittivity (and thus the capacitance value) by means of the magnetic field strength. Changes in dielectric parameters can be used to obtain “magnetically” tuneable functional multiferroic devices, e.g., tuneable filters or phase shifters. Taking into account that the strength of the magnetic field used in the current study was about 6 mOe (in CGS units), one can conclude that multiferroic 67BFBT ceramics are very sensitive to magnetic field influence, which makes 67BFBT sensing material with vast potential.
Author Contributions
Conceptualization, D.C. and A.L.-C.; methodology, A.L.-C. and D.C.; software, D.C. and W.B.; validation, A.L.-C. and J.-H.J.; formal analysis, A.L.-C., D.C. and J.-H.J.; investigation, A.L.-C., D.C., T.T.Z., J.-H.J., B.G.-G. and W.B.; resources, A.L.-C., D.C., B.G.-G. and W.B.; data curation, A.L.-C., T.T.Z., J.-H.J., B.G.-G. and W.B.; writing—original draft preparation, A.L.-C. and D.C.; writing—review and editing, D.C., A.L.-C. and J.-H.J.; visualization, D.C.; supervision, D.C.; project administration, A.L.-C.; funding acquisition, A.L.-C. All authors have read and agreed to the published version of the manuscript.
Funding
This research was funded by POLISH NATIONAL SCIENCE CENTRE (NCN), grant number N N507 446934.
Institutional Review Board Statement
Not applicable.
Informed Consent Statement
Not applicable.
Data Availability Statement
The data presented in this paper are available on request from the corresponding author.
Acknowledgments
The present research was supported by Gdańsk University of Technology as part of the EINSTEINIUM SHORT-TERM INCOMING VISITS programme.
Conflicts of Interest
The authors declare no conflict of interest.
References
- Hill, N.A. Why are there so few magnetic ferroelectrics? J. Phys. Chem. B 2000, 104, 6694–6709. [Google Scholar] [CrossRef]
- Wu, J.; Fan, Z.; Xiao, D.; Zhu, J.; Wang, J. Multiferroic bismuth ferrite-based materials for multifunctional applications: Ceramic bulks, thin films and nanostructures. Prog. Mater. Sci. 2016, 84, 335–402. [Google Scholar] [CrossRef]
- Haertling, G.H. Ferroelectric Ceramics: History and Technology. J. Am. Ceram. Soc. 1999, 82, 797–818. [Google Scholar] [CrossRef]
- Kim, H.; Renteria-Marquez, A.; Islam, D.; Chavez, L.A.; Garcia Rosales, C.A.; Ahsan, A.; Tseng, T.-L.B.; Love, N.D.; Lin, Y. Fabrication of bulk piezoelectric and dielectric BaTiO3 ceramics using paste extrusion 3D printing technique. J. Am. Ceram. Soc. 2019, 102, 3685–3694. [Google Scholar] [CrossRef]
- Cheung, M.C.; Chan, H.L.W.; Choy, C.L. Study on barium titanate ceramics prepared by various methods. J. Mater. Sci. 2001, 36, 381–387. [Google Scholar] [CrossRef]
- Wodecka-Dus, B.; Czekaj, D. Synthesis of 0.7BiFeO3–0.3BaTiO3 Ceramics: Thermal, Structural and ac Impedance Studies. Arch. Metall. Mater. 2011, 56, 4. [Google Scholar] [CrossRef]
- Baloni, M.; Sharma, R.C.; Singh, H.; Khan, B.; Singh, M.K.; Sati, P.C.; Rawat, M.; Thakur, V.N.; Kumar, A.; Kotnala, R.K. Enhanced multiferroic properties and magnetoelectric coupling in Nd modified 0.7BiFeO3–0.3PbTiO3 solid solution. J. Mater. Sci. Mater. Electron. 2022, 33, 17161–17173. [Google Scholar] [CrossRef]
- Kim, S.; Nam, H.; Calisir, I. Lead-Free BiFeO3-Based Piezoelectrics: A Review of Controversial Issues and Current Research State. Materials 2022, 15, 4388. [Google Scholar] [CrossRef]
- Yao, Z.; Liu, Y.; Song, Z.; Wang, Z.; Hao, H.; Cao, M.; Yu, Z.; Liu, H. Structure and electrical properties of ternary BiFeO3-BaTiO3-PbTiO3 high-temperature piezoceramics. J. Adv. Ceram. 2012, 1, 227–231. [Google Scholar] [CrossRef]
- Zhang, L.; Li, G.; Gong, X.; Tang, J.; Lu., Y. Enhanced dielectric, ferroelectric, and ferromagnetic properties of 0.7Bi1−xTmxFeO3–0.3BaTiO3 ceramics by Tm-induced structural modification. Ceram. Int. 2022, 48, 17760–17767. [Google Scholar] [CrossRef]
- Leontsev, S.O.; Eitel, R.E. Dielectric and Piezoelectric Properties in Mn-Modified (1 − x)BiFeO3-xBaTiO3 Ceramics. J. Am. Cerac. Soc. 2009, 92, 2957–2961. [Google Scholar] [CrossRef]
- Kim, S.; Khanal, G.P.; Nam, H.-W.; Fujii, I.; Ueno, S.; Moriyoshi, C.; Kuroiwa, Y.; Wada, S. Structural and electrical characteristics of potential candidate lead-free BiFeO3-BaTiO3 piezoelectric ceramics. J. Appl. Phys. 2017, 122, 164105. [Google Scholar] [CrossRef]
- Rasband, W.S.; ImageJ, U.S. National Institutes of Health, Bethesda, Maryland, USA, 1997–2018. Available online: https://imagej.nih.gov/ij/ (accessed on 1 June 2023).
- Schneider, C.; Rasband, W.; Eliceiri, K. NIH Image to ImageJ: 25 years of image analysis. Nat. Methods 2012, 9, 671–675. [Google Scholar] [CrossRef]
- Thompson, A.W. Calculation of True Volume Grain Diameter. Metallography 1972, 5, 366–369. [Google Scholar] [CrossRef]
- Barsoukov, E.; Macdonald, J.R. (Eds.) Impedance Spectroscopy, Theory, Experiment, and Applications, 2nd ed.; John Wiley & Sons: Hoboken, NJ, USA, 2005. [Google Scholar]
- Boukamp, B.A. Electrochemical impedance spectroscopy in solid state ionics: Recent advances. Solid State Ion. 2004, 169, 65–73. [Google Scholar] [CrossRef]
- Abram, E.J.; Sinclair, D.C.; West, A.R. A Strategy for Analysis and Modelling of Impedance Spectroscopy Data of Electroceramics: Doped Lanthanum Gallate. J. Electroceram. 2003, 10, 165–177. [Google Scholar] [CrossRef]
- Boukamp, B.A. A linear Kronig-Kramers transform test for immitance data validation. J. Electrochem. Soc. 1995, 142, 1885–1894. [Google Scholar] [CrossRef]
- Lisińska-Czekaj, A.; Rerak, M.; Creak, D.; Lubina, M.; Garbarz-Glos, B.; Bąk, W. Low temperature broad band dielectric spectroscopy of multiferroic Bi6Fe2Ti3O18 ceramics. Arch. Metall. Mater. 2016, 61, 1101–1106. [Google Scholar] [CrossRef]
- Okazaki, K. Ceramic Engineering for Dielectrics; Gakken Shya: Tokyo, Japan, 1969. [Google Scholar]
- Fialka, J.; Benes, P. Comparison of methods for the measurement of piezoelectric coefficients. IEEE Trans. Instrum. Meas. 2013, 62, 1047–1057. [Google Scholar] [CrossRef]
- Li, J.-F. Fundamentals of Piezoelectricity. In Lead-Free Piezoelectric Materials, 1st ed.; WILEY-VCH GmbH: Weinheim, Germany, 2021; pp. 1–18. [Google Scholar]
- Moulson, A.J.; Herbert, J.M. Electroceramics: Materials, Properties, Applications, 2nd ed.; John Wiley & Sons Ltd.: New York, NY, USA, 2003. [Google Scholar]
- Pajewski, W. Własności piezoelektryczne tworzyw ceramicznych i ich pomiar. In Elektroceramika. Własności i Nowoczesne Metody Badań, T.1; Ranachowski, R.J., Ed.; PWN: Warszawa/Poznań, Poland, 1981; pp. 191–233. [Google Scholar]
- MATCH! Version 2.0.11, CRYSTAL IMPACT, Postfach 1251, 53002 Bonn, Germany. Available online: http://www.crystalimpact.com/match (accessed on 16 April 2023).
- Clemens, O.; Kruk, R.; Patterson, E.A.; Loho, C.; Reitz, C.; Wright, A.J.; Knight, K.S.; Hahn, H.; Slater, P.R. Introducing a Large Polar Tetragonal Distortion into Ba-Doped BiFeO3 by Low-Temperature Fluorination. Inorg. Chem. 2014, 53, 12572–12583. [Google Scholar] [CrossRef]
- Garciá, K.L.; Valenzuela, R. Domain wall pinning, bulging, and displacement in circumferential domains in CoFeBSi amorphous wires. J. Appl. Phys. 2000, 87, 5257. [Google Scholar] [CrossRef]
- Zoltowski, P. Non-traditional approach to measurement models for analysis of impedance spectra. Solid State Ion. 2005, 176, 1979–1986. [Google Scholar] [CrossRef]
- EN 50324-2:2002; Piezoelectric Properties of Ceramic Materials and Components, Part 2: Methods of Measurement—Low Power. European Committee for Standardization: Brussels, Belgium, 2002.
Disclaimer/Publisher’s Note: The statements, opinions and data contained in all publications are solely those of the individual author(s) and contributor(s) and not of MDPI and/or the editor(s). MDPI and/or the editor(s) disclaim responsibility for any injury to people or property resulting from any ideas, methods, instructions or products referred to in the content. |
© 2023 by the authors. Licensee MDPI, Basel, Switzerland. This article is an open access article distributed under the terms and conditions of the Creative Commons Attribution (CC BY) license (https://creativecommons.org/licenses/by/4.0/).