Abstract
Over time, software has become increasingly important in various fields. If the current software is more dependent than in the past and is broken owing to large and small issues, such as coding and system errors, it is expected to cause significant damage to the entire industry. To address this problem, the field of software reliability is crucial. In the past, efforts in software reliability were made to develop models by assuming a nonhomogeneous Poisson-process model (NHPP); however, as models became more complex, there were many special cases in which models fit well. Hence, this study proposes a software reliability model using deep learning that relies on data rather than mathematical and statistical assumptions. A software reliability model based on recurrent neural networks (RNN), long short-term memory (LSTM), and gated recurrent units (GRU), which are the most basic deep and recurrent neural networks, was constructed. The dataset was divided into two, Datasets 1 and 2, which both used 80% and 90% of the entire data, respectively. Using 11 criteria, the estimated and learned results based on these datasets proved that the software reliability model using deep learning has excellent capabilities. The software reliability model using GRU showed the most satisfactory results.
1. Introduction
Over time, software has become increasingly important in various fields. In the past, software helped with simple tasks or small parts in each industry; however, it has now been developed into a form that can perform basic roles in all-inclusive roles. If the current software is more dependent than in the past and is broken owing to large and small issues, such as certain coding and system errors, it is expected to cause significant damage to the entire industry. To address this problem, studies on software reliability, which measure how effectively the software works, are constantly being conducted. Software reliability tests the ability of software to not fail for a specified period and indicates how long the software can be used without failure.
Studies on software reliability have been conducted based on the software reliability model, assuming the Markov model and the non-homogeneous Poisson process (NHPP) [1]. However, since software failures follow a Poisson distribution, most related studies have been conducted based on the software reliability model, assuming NHPP. Previous studies on software reliability began when a software reliability model based on NHPP was developed by Goel and Okumoto [2]. It was assumed that software failures occur independently and do not affect each other. Subsequently, a study was conducted on an S-shaped curve model in which the number of cumulative software failures increased along the S curve [3,4,5]. In addition, a software reliability model study, assuming incomplete debugging in which the defects found in the test phase were not corrected or removed, was also conducted [6]. By expanding on this, a study on a generalized incomplete debugging defect detection rate model was conducted [7,8,9,10,11]. The defect detection rate of each proposed model is in the form of a function. In addition, since the operating environment is different for each software, it is difficult to compare them equally. Thus, the software reliability model has been studied, considering uncertain factors in the operating environment [12,13].
As software develops over time, it becomes composed of complex and intertwined structures; therefore, studies on software reliability models are being conducted, assuming that software failures occur independently [14]. A software reliability model that assumes that previous errors will continuously affect software failures if they are not well fixed has been proposed, and a dependent software reliability model that assumes an uncertain operating environment has been studied [15,16].
As research progressed, several software reliability models studied under independent and dependent assumptions developed numerous models suitable for special cases, and generalizing them has been difficult. To address this, studies on software reliability models using deep learning, which is a nonparametric method, have been performed. Among the nonparametric software reliability models using deep learning, a study on software reliability models using deep neural networks was conducted [17], and a software reliability model using deep learning that applies failure data generated through open-source software was also proposed [18]. In addition, since software failure is a sequential data characteristic, the software reliability model using the recurrent neural network (RNN) and the long short-term memory (LSTM) was studied using this characteristic [19,20,21].
The software reliability model developed by NHPP has the problem that it fits well only in special cases because it adds special mathematical assumptions. Therefore, in this study, to solve this problem, we aim at the software reliability model utilizing deep learning among machine learning methods, which is a form that relies on given failure data. Since it is a data-dependent model, it is possible to develop a generalized software reliability model that considers all failures that occur in software without relying on special cases of software failures. In addition, in the past, software reliability models utilizing deep learning have been analyzed by applying methods, but in this study, we propose to add a deeper hidden layer of deep neural networks to the recurrent neural network series. If we develop a model that utilizes 100% of the data, it may cause an overfitting problem that only fits the trained data well. As a result, we also present the results for 80% and 90% of the data sets and the resulting predictions to prove superiority using 11 criteria comparisons. Section 2 presents the theoretical background of software reliability and deep learning. Section 3 introduces numerical examples, and finally, Section 4 presents the conclusions.
2. Software Reliability Model
2.1. Generalized Software Relability Model
Software reliability refers to the probability that the software does not cause system failure for a certain period of time under specific conditions. The reliability function used to evaluate this is
This indicates the probability of an operation over time t. The pdf f(t) assumes the failure time or lifetime of the software to be a random variable T. We obtained the reliability function by assuming a distribution for the calculation. It was assumed that it follows an exponential distribution with parameter λ. Subsequently, we approach λ as an NHPP and propose a model in which λ is not a single constant value but a mean value function m(t) that changes over time [1]. N(t) is the number of failures up to time t and is a Poisson probability density function with parameter m(t).
m(t) is the integral of λ(t), which is a strength function representing the number of instantaneous failures at time t and the mean value function from 0 to time t.
The is calculated using the relationship between the number of failures a(t) at each time point and the failure detection rate b(t).
The software reliability model is developed using a differential equation, which is the basic form of the above equation. The software reliability model obtained by multiplying η in Equation (4) assumes an uncertain operating environment. Here, η is a parameter for the uncertainty of the operating environment, and N is the expected number of faults that exist in the software before testing [12].
In addition, if m(t) is multiplied again in Equation (4), a software reliability model can be derived assuming dependent failures, in which software failures at the previous time point affect failures at the next time point [14]. This is expressed in the following equation:
If each differential equation is arranged in terms of m(t) according to the conditions in Equations (4)–(6), a software reliability model that satisfies each condition can be derived. The developed software model is presented in Table 1. Models 1 to 6 are software reliability models obtained through the most basic form of differential equations; models 7 and 8 are those assuming uncertain operating environments; model 9 assumes dependent failures; and model 10 assumes the occurrence of dependent failures in an uncertain operating environment.

Table 1.
NHPP software reliability models.
2.2. Software Reliablity Model Using Deep Learning
2.2.1. Deep Neural Network
An artificial neural network is based on the biological structure of the human brain and consists of nonlinear neurons. Based on the information received by the five senses, humans think and judge last, as information moves from one neuron to the next. The neurons (nodes) present in each layer of an artificial neural network are the most basic information-processing units. The network structure consists of three layers: input, output, and hidden layers. The input layer plays the same role as the information obtained by human beings through their five senses or thoughts, whereas the output layer refers to thoughts or judgments based on this. Conversely, the hidden layer learns to think or judge while receiving signals from the previous layer and passes them to the next layer through an activation function. A deep neural network (DNN) refers to a form in which the number of hidden layers is large in an artificial neural network [22,23]. When data is inputted from the input layer, the next hidden layer moves to the next layer through an activation function after combining the input value, weight, and bias and is transmitted to the output layer. Equation (7) expresses the passing from each layer. It consists of the product of the transformed z value (input value) in the previous layer, the weight, and the sum of the biases.
For each layer, the activation function when moving to the next layer mainly uses the sigmoid, hyperbolic tangent, and ReLU functions. As the activation function used when outputting the result passed to the last output layer is a continuous variable, an identity function was used.
The final predicted value was obtained using the above process. The difference between the predicted value y and the actual value t is calculated as a loss function. To minimize the difference between these values, the function is updated to have the minimum value based on the differential value for each weight and bias.
The weight update implies that the loss function is updated by the learning rate (α) based on the partial derivative value for a specific weight using the backpropagation algorithm. The deep neural network learns through a series of processes and outputs a predicted value that approximates the actual value.
2.2.2. Recurrent Neural Network
The recurrent neural network is a model specialized for sequential data structures. It has cells that can remember the information of a previous point in the hidden layer of the most basic deep neural network. Therefore, it is suitable for time-series data because it is designed to remember information from the past and influence future events. Figure 1a shows an image of the RNN model, and the formula is shown in Equation (10) [24].
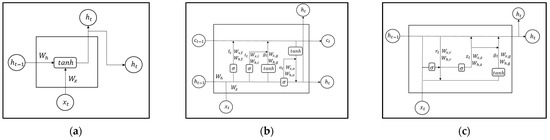
Figure 1.
(a) Structure of RNN model; (b) Structure of LSTM model; (c) Structure of GRU model.
Its network structure reflects past time; however, it has a vanishing gradient problem that prevents it from accurately reflecting the information about the time that existed a long time ago as the time point becomes longer [25]. To address this problem, LSTM, which has a structure that can learn long-term dependence, was built. It contains the same hidden layer as the RNN structure; however, its internal structure differs. In LSTM, a memory cell c exists. This cell has a forget gate that determines how much previous information is reflected, an input gate that includes new information g, which indicates how much new information is reflected, and an output gate that indicates how much previous information is transferred to the next layer. The activation functions used at this time were the sigmoid function and the hyperbolic tangent. Information about the past is delivered by passing through three gates and memory cells. Through this, the gradient loss problem can be solved. Each gate follows Equation (11). Figure 1b shows the LSTM model [26].
LSTM can solve the gradient loss problem in RNN; however, when going to the next step, LSTM goes through four operation processes if only one operation is performed. Processing big data may be inefficient because the number of computations increases fourfold. Complementing this, the gated recurrent unit (GRU) transmits a value to the next layer through three calculation processes in one layer. The GRU integrates the forget and input gates in the LSTM to create an update gate. In addition, it replaces the output gate with a reset gate, which determines the amount of previous information to be forgotten. The update gate determines how long the previous information should be kept. Through Equation (12), the network learns while transferring to the next layer. Figure 1c shows an image of the GRU model [27].
The software reliability model proposed in this study adds a deep neural network layer to add training depth to the predicted model, which reflects the past viewpoint through the hidden layer of the recurrent neural network. It proposes a learning model that goes through a deeper hidden layer to reflect the results of the past rather than just reflecting the past time of RNN series. This allows us to propose a software reliability model that can be generalized by solving problems that are only well suited to special cases of previously developed software reliability models. Among the software reliability models using deep learning, DNNs have three hidden layers, and RNNs have two. The number of nodes in the hidden layer was configured as the number of data points. Based on the given data, the number of nodes in the model should be limited to the number of data points to avoid estimating too many parameters compared to the data. The parameter optimization method used in the software reliability model using deep learning is Adam. Adam is a deep learning optimization method that combines the momentum method, which uses the acceleration of previous training, and the RMSprop method, which has a structure where the learning rate changes with each training instead of being constant. The formula is as follows:
Let β1 and β2 be an exponential moving average of momentum and RMSprop. After obtaining the parameters u and s of momentum and RMSprop, update the weights by the learning rate α. In this study, to optimize the hyper-parameters, we set a range of hyper-parameters and iterated to find the optimal results. We want to find the optimal value by increasing the learning rate α by 5-times units from 0.0000001 to 0.01, and utilizing β1 and β2 of 0.9 and 0.99, respectively. Figure 2 shows the software reliability model that combines recurrent neural network types and deep neural networks among software reliability models using deep learning.
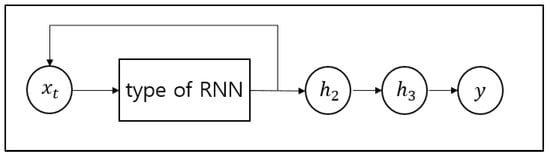
Figure 2.
Software reliability model combining DNNs and type of RNN.
3. Numerical Example
3.1. Data Information
The dataset used in this study is the software failure data from PLC4X (https://plc4x.apache.org, accessed on 7 February 2022)) and Apache Camel (http://camel.apache.org, accessed on 7 February 2022). Dataset 1 is from PLC4X, which is a set of libraries for communicating with industrial programmable logic controllers (PLCs) using a variety of protocols with a shared API. The data represent the cumulative number of failures occurring between December 2017 and January 2022. Dataset 2 is from Apache Camel, which is an open-source integration framework that empowers you to quickly and easily integrate various systems consuming or producing data. Dataset 2 presents the cumulative number of failures between April 2011 and January 2022. Table A1 and Table A2 show datasets 1 and 2. The software uses the Apache IoTDB (Database for the Internet of Things), which is a native IoT database with high performance for data management and analysis, deployable on the edge and in the cloud. Errors, such as bugs, code modifications, and database management errors, were recorded. It records defects and failures caused by bugs, new features, improvements, and tasks while operating the Apache IoTDB and is intended to estimate and predict software reliability models. Both datasets 1 and 2 used 80% and 90% of the entire data, which were utilized as training data necessary for training and parameter estimation, respectively. The remaining 20% and 10% of the data were used to compare predictions by substituting them for the training and estimated models.
3.2. Criteria
The software reliability models utilizing NHPP and deep learning were compared using 11 criteria based on the difference between the actual and predicted values. The mean squared error (MSE) and mean absolute error (MAE) were defined as the sum of the squared distances and absolute values of the distances between the estimated and actual values, divided by the difference between the number of observations and parameters [28,29].
The predictive ratio risk (PRR) was defined by dividing the distance between the actual and predicted values by the predicted value, and the predictive power (PP) was defined by dividing the distance between the actual and predicted values by the actual value [30].
R2 is the coefficient of determination of the regression equation and determines the explanatory power by considering the number of parameters [31].
The predicted relative variation (PRV) is the standard deviation of the prediction bias, where the bias is and defined as [32]:
The root mean square prediction error (RMSPE) estimates the closeness with which the model predicts the observations [32]:
The mean error of prediction (MEOP) sums the absolute value of the deviation between the actual data and the estimated curve and is defined as [29]:
The Theil statistic (TS) is the average percentage of deviation over all periods with respect to the actual values. This is defined as follows [29]:
This criterion increases the penalty when a parameter is added to the model for a small sample [33].
The preSSE (predicted sum squared error) refers to the sum of the differences between the predicted result value and the actual value, and the degree of estimation can be identified [34].
Based on the above criteria, we compared the software reliability model utilizing NHPP with that using deep learning. For the same comparison, the number of criterion parameters affected by the number of parameters was set to zero. The closer R2 is to 1, the better the result, and the closer it is to 0 for the other 10 criteria, the better the result. The goodness of the model fit was compared by calculating the criteria using R and MATLAB R2018b.
3.3. Results
3.3.1. Results of Dataset 1
Using Dataset 1, Table 2 shows the results of the parameter estimation of the software reliability model assuming NHPP and the structure of the software reliability model using deep learning. In addition, Dataset 1 was divided into 80% and 90%, and parameter estimation and model fitting were performed on the divided dataset. The structure of the software reliability model using deep learning consisted of three hidden layers, and the number of nodes in each layer was set according to the size of the training dataset. For the software reliability model of the recurrent neural network type, two deep neural networks were added, except for the recurrent neural network hidden layer. Here, Adam was used as the optimization method. The learning rate was set to 0.005 for the DNN and 0.0001 for the RNN, LSTM, and GRU.
Table 2.
Parameter estimation and structure of model using Dataset 1.
Table 3 lists the result values of the criteria using 80% of Dataset 1. The values for MSE, PRV, RMSPE, TS, and PC in LSTM were the lowest at 2.0069, 0.1345, 1.4168, 4.9250, and 14.5574, respectively. GRU showed the lowest values of 0.6706 and 1.1032 in PRR and PP, and the lowest values of MAE and MEOP of 1.21164 and 1.186 were observed in UDPF, respectively. The R2 value was the highest for LSTM and GRU at 0.9929. In LSTM, 6 out of 10 criteria showed good results. For the predictions of 10% and 20%, the DPF model with a preSSE value of 47.645 had the lowest result among the software reliability models assuming NHPP. In contrast, most software reliability models using deep learning showed values in the 20-point range, and the LSTM model showed the smallest value of 21.570.
Table 3.
Comparison of all criteria using 80% of Dataset 1.
Table 4 lists the result values of the criteria using 90% of Dataset 1. MSE, RMSPE, TS, and PC were the lowest in GRU at 1.9961, 0.9948, 1.413, 4.1991, and 16.1831, respectively, and PRV was the smallest in LSTM at 0.1251. In addition, PRR and PP in UDPF showed the lowest values of 0.6386 and 0.9113, and MAE and MEOP were 1.3714 and 1.3409 in DPF, respectively. The R2 value was the largest at 0.9948. In GRU, 5 out of 10 criteria showed good results. In preSSE, the TC, DS, and Vtub models showed very small values of 6.367, 6.537, and 7.340, respectively. In the software reliability model using deep learning, RNN showed the smallest value of 11.397, followed by LSTM at 11.755. The resulting values showed good results for the software reliability model, assuming NHPP.
Table 4.
Comparison of all criteria using 90% of Dataset 1.
3.3.2. Results of Dataset 2
Using Dataset 2, Table 5 shows the results of the parameter estimation of the software reliability model assuming NHPP and the structure of the software reliability model using deep learning. Similar to Dataset 1, Dataset 2 was divided into 80% and 90%, and parameter estimation and model fitting were performed on the divided dataset. The structure of the software reliability model using deep learning consists of three hidden layers, as in Dataset 1, and the number of nodes in each layer was set according to the size of the training dataset. The learning rates were set to 0.000001 for DNN and 0.00001 for RNN, LSTM, and GRU.
Table 5.
Parameter estimation and structure of model using Dataset 2.
Table 6 shows the result values of the criteria using 80% of Dataset 2. The values of MSE, MAE, PRV, RMSPE, MEOP, TS, and PC in GRU were the lowest at 4.5494, 2.0688, 0.5218, 2.1336, 2.0489, 2.2311, and 79.0128, respectively, and R2 of 0.9988 in GRU and LSTM appeared the highest. PRR showed the lowest value of 1.5342 in DNN, and PP showed the smallest value of 1.7716 in TP. In GRU, 8 out of 10 criteria showed good results. Among the software reliability models assuming NHPP, the model with the lowest result was the Vtub model, with a preSSE value of 159,551.23. In contrast, most software reliability models using deep learning showed smaller values than the existing software reliability models; among them, the RNN model showed the smallest value of 71.06.
Table 6.
Comparison of all criteria using 80% of Dataset 2.
Table 7 shows the result values for the criteria using 90% of Dataset 2. MSE, PRV, RMSPE, TS, and PC showed the smallest values of 8.8655, 0.9189, 2.9787, 2.3336, and 1237.5573, respectively, in GRU, and R2 showed the largest value of 0.9988 in the same model. MAE and MEOP had the smallest values of 2.8168 and 2.7928, respectively, in RNN. PRR was 1.6236 in DNN, and PP was the smallest at 1.4301 in Vtub. In GRU, 6 out of 10 criteria showed good results. Regarding the preSSE value, the GRU model showed the smallest value of 468.03 among the software reliability models using deep learning.
Table 7.
Comparison of all criteria using 90% of Dataset 2.
Figure 3 and Figure 4 are graphs that combine the estimated and trained values for 80% and 90% of the data above with the predicted values for the remaining 20% and 10%. The points before the black line are estimated values, and the points after the black line are predicted values.
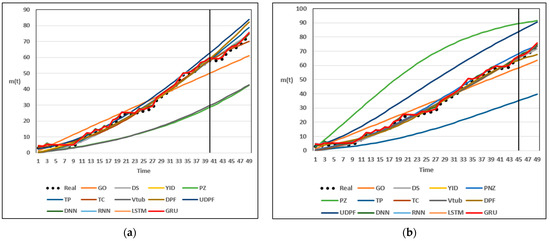
Figure 3.
(a) Estimated and predicted value for 80% of Dataset 1; (b) Estimated and predicted value for 90% of Dataset 1.
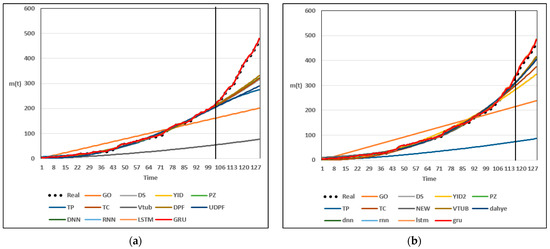
Figure 4.
(a) Estimated and predicted value for 80% of Dataset 2; (b) Estimated and predicted value for 90% of Dataset 2.
3.4. Confidence Interval
In this study, GRU, the software reliability model that showed the best results among the proposed models, was used to obtain the confidence interval. In addition, the difference in the distribution between the predicted and actual data values of the other models was compared. The confidence interval follows Equation (22). Since software failures follow a Poisson distribution, we take the mean and variance as . is defined as the 100()/2 percentile of the standard normal distribution [35]. A 95% confidence interval was used.
Table A3 and Table A4 show the predicted values and corresponding confidence intervals for the remaining 20% and 10% of the data based on the estimated and trained models for 80% and 90% of Dataset 1. The bolded values indicate that the actual data values do not fall within the prediction intervals. For 80% of Dataset 1, the other NHPP software reliability models, except for PNZ, PZ, and Vtub, and the software reliability models using deep learning, predicted well within the 95% confidence interval. For 90% of Dataset 1, the other NHPP software reliability models (except PNZ, PZ, TP, and UDPF) and the software reliability models using deep learning performed well within the 95% confidence interval.
Table A5 and Table A6 show the predicted values and corresponding confidence intervals for the remaining 20% and 10% of the data based on the estimated and trained models for 80% and 90% of Dataset 2. For 80% of Dataset 2, the GO, PNZ, and TP models showed results where the actual data was not within the prediction confidence interval at all, while the DS model showed results where the actual data was within the 95% prediction confidence interval up to the 108th time, the YID, TC, DPF, and UDPF models up to the 109th time, and the PZ, Vtub model up to the 110th time. For 90% of Dataset 2, the NHPP software reliability models showed that the PZ, Vtub, DPF, and UDPF models resulted in the actual data falling within the 95% prediction confidence interval up to the 118th time. Except for the PZ, Vtub, DPF, and UDPF models, none of the NHPP software reliability models had the actual data fall within the predicted confidence interval. The software reliability models using deep learning performed well, with predictions within the 95% confidence interval. Except for the models that do not fall within the 95% confidence intervals shown in Table A3, Table A4, Table A5 and Table A6, the remaining models showed good results in following the data trend, and the software reliability models using deep learning showed good estimation and prediction results in following the data trend.
4. Conclusions
In this study, the software reliability models using NHPP and deep learning were compared. Regarding the software reliability model using deep learning, a model composed of deep neural networks and recurrent neural networks (RNN, LSTM, and GRU) that have been applied to time-series data characteristics was used. It was constructed by including the hidden layer of the neural network. Using Datasets 1 and 2, it was confirmed that this model showed better estimation and predictive power than existing software reliability models. Among them, the software reliability of the recurrent neural network series showed better results, and as a result of fitting with 80% and 90% datasets, the software reliability model with the deep neural network added to the GRU showed the best results. In addition, the software reliability model of the recurrent neural network showed good results when the predicted values were compared with the remaining datasets. The NHPP software reliability model showed results that relatively fit the data well with a small number of time points; however, it showed a significant increase as the number of time points increased. On the other hand, the software neural network using deep learning showed results that fit the data trend well, even when the time point was large.
However, software reliability models using deep learning always face the problem of overfitting. Therefore, to address this, we plan to conduct research on software reliability models based on mathematical and statistical assumptions by grafting them together with the NHPP software reliability models. Through this, we aim to create a stable, data-dependent, and complementary model with a more mathematical basis.
Author Contributions
Conceptualization, K.Y.S. and I.H.C.; funding acquisition, K.Y.S. and I.H.C.; software, Y.S.K.; writing—original draft, Y.S.K.; writing—review and editing, K.Y.S. and I.H.C. All authors have read and agreed to the published version of the manuscript.
Funding
This research was supported by the Basic Science Research Program through the National Research Foundation of Korea (NRF), funded by the Ministry of Education (NRF-2021R1F1A1048592, NRF-2021R1I1A1A01059842).
Institutional Review Board Statement
Not applicable.
Informed Consent Statement
Not applicable.
Data Availability Statement
Data is available in a publicly accessible repository.
Acknowledgments
This study was supported by the National Research Foundation of Korea (NRF).
Conflicts of Interest
The authors declare no conflict of interest.
Appendix A
Table A1.
Cumulative number of software failures in Dataset 1.
Table A1.
Cumulative number of software failures in Dataset 1.
| Index | Failures | Cumulative Failures | Index | Failures | Cumulative Failures | Index | Failures | Cumulative Failures |
|---|---|---|---|---|---|---|---|---|
| 1 | 3 | 3 | 18 | 4 | 19 | 35 | 0 | 49 |
| 2 | 0 | 3 | 19 | 1 | 20 | 36 | 1 | 50 |
| 3 | 1 | 4 | 20 | 4 | 24 | 37 | 2 | 52 |
| 4 | 0 | 4 | 21 | 0 | 24 | 38 | 3 | 55 |
| 5 | 0 | 4 | 22 | 0 | 24 | 39 | 1 | 56 |
| 6 | 0 | 4 | 23 | 0 | 24 | 40 | 2 | 58 |
| 7 | 0 | 4 | 24 | 2 | 26 | 41 | 0 | 58 |
| 8 | 0 | 4 | 25 | 0 | 26 | 42 | 0 | 58 |
| 9 | 0 | 4 | 26 | 1 | 27 | 43 | 1 | 59 |
| 10 | 2 | 6 | 27 | 1 | 28 | 44 | 4 | 63 |
| 11 | 2 | 8 | 28 | 5 | 33 | 45 | 2 | 65 |
| 12 | 3 | 11 | 29 | 2 | 35 | 46 | 1 | 66 |
| 13 | 0 | 11 | 30 | 2 | 37 | 47 | 2 | 68 |
| 14 | 2 | 13 | 31 | 2 | 39 | 48 | 3 | 71 |
| 15 | 0 | 13 | 32 | 2 | 41 | 49 | 3 | 74 |
| 16 | 2 | 15 | 33 | 4 | 45 | 50 | 2 | 76 |
| 17 | 0 | 15 | 34 | 4 | 49 |
Table A2.
Cumulative number of software failures in Dataset 2.
Table A2.
Cumulative number of software failures in Dataset 2.
| Index | Failures | Cumulative Failures | Index | Failures | Cumulative Failures | Index | Failures | Cumulative Failures | Index | Failures | Cumulative Failures |
|---|---|---|---|---|---|---|---|---|---|---|---|
| 1 | 1 | 1 | 34 | 0 | 25 | 67 | 0 | 85 | 100 | 3 | 197 |
| 2 | 0 | 1 | 35 | 1 | 26 | 68 | 1 | 86 | 101 | 6 | 203 |
| 3 | 1 | 2 | 36 | 0 | 26 | 69 | 2 | 88 | 102 | 3 | 206 |
| 4 | 0 | 2 | 37 | 0 | 26 | 70 | 3 | 91 | 103 | 6 | 212 |
| 5 | 2 | 4 | 38 | 1 | 27 | 71 | 1 | 92 | 104 | 9 | 221 |
| 6 | 0 | 4 | 39 | 0 | 27 | 72 | 3 | 95 | 105 | 6 | 227 |
| 7 | 0 | 4 | 40 | 3 | 30 | 73 | 6 | 101 | 106 | 3 | 230 |
| 8 | 1 | 5 | 41 | 3 | 33 | 74 | 9 | 110 | 107 | 12 | 242 |
| 9 | 0 | 5 | 42 | 1 | 34 | 75 | 2 | 112 | 108 | 6 | 248 |
| 10 | 0 | 5 | 43 | 2 | 36 | 76 | 6 | 118 | 109 | 13 | 261 |
| 11 | 1 | 6 | 44 | 3 | 39 | 77 | 3 | 121 | 110 | 8 | 269 |
| 12 | 0 | 6 | 45 | 0 | 39 | 78 | 4 | 125 | 111 | 10 | 279 |
| 13 | 0 | 6 | 46 | 6 | 45 | 79 | 4 | 129 | 112 | 5 | 284 |
| 14 | 2 | 8 | 47 | 5 | 50 | 80 | 4 | 133 | 113 | 3 | 287 |
| 15 | 0 | 8 | 48 | 4 | 54 | 81 | 0 | 133 | 114 | 11 | 298 |
| 16 | 1 | 9 | 49 | 2 | 56 | 82 | 3 | 136 | 115 | 15 | 313 |
| 17 | 0 | 9 | 50 | 1 | 57 | 83 | 1 | 137 | 116 | 12 | 325 |
| 18 | 2 | 11 | 51 | 0 | 57 | 84 | 4 | 141 | 117 | 10 | 335 |
| 19 | 1 | 12 | 52 | 3 | 60 | 85 | 1 | 142 | 118 | 15 | 350 |
| 20 | 0 | 12 | 53 | 1 | 61 | 86 | 0 | 142 | 119 | 16 | 366 |
| 21 | 1 | 13 | 54 | 1 | 62 | 87 | 3 | 145 | 120 | 12 | 378 |
| 22 | 2 | 15 | 55 | 3 | 65 | 88 | 4 | 149 | 121 | 8 | 386 |
| 23 | 2 | 17 | 56 | 1 | 66 | 89 | 3 | 152 | 122 | 12 | 398 |
| 24 | 0 | 17 | 57 | 1 | 67 | 90 | 6 | 158 | 123 | 8 | 406 |
| 25 | 0 | 17 | 58 | 2 | 69 | 91 | 7 | 165 | 124 | 6 | 412 |
| 26 | 0 | 17 | 59 | 3 | 72 | 92 | 6 | 171 | 125 | 10 | 422 |
| 27 | 0 | 17 | 60 | 3 | 75 | 93 | 2 | 173 | 126 | 10 | 432 |
| 28 | 1 | 18 | 61 | 1 | 76 | 94 | 4 | 177 | 127 | 17 | 449 |
| 29 | 1 | 19 | 62 | 2 | 78 | 95 | 5 | 182 | 128 | 6 | 455 |
| 30 | 1 | 20 | 63 | 0 | 78 | 96 | 1 | 183 | 129 | 21 | 476 |
| 31 | 3 | 23 | 64 | 3 | 81 | 97 | 3 | 186 | 130 | 26 | 502 |
| 32 | 2 | 25 | 65 | 1 | 82 | 98 | 6 | 192 | |||
| 33 | 0 | 25 | 66 | 3 | 85 | 99 | 2 | 194 |
Table A3.
95% Prediction confidence interval of software reliability models from 80% of Dataset 1.
Table A3.
95% Prediction confidence interval of software reliability models from 80% of Dataset 1.
| Time | Real | GO | DS | YID | ||||||
| Prediction | Upper | Lower | Prediction | Upper | Lower | Prediction | Upper | Lower | ||
| 40 | 58 | 49.98 | 63.84 | 36.13 | 57.58 | 72.46 | 42.71 | 59.04 | 74.10 | 43.98 |
| 41 | 58 | 51.22 | 65.24 | 37.19 | 59.51 | 74.63 | 44.39 | 61.44 | 76.80 | 46.07 |
| 42 | 58 | 52.45 | 66.64 | 38.26 | 61.44 | 76.80 | 46.08 | 63.88 | 79.54 | 48.21 |
| 43 | 59 | 53.68 | 68.04 | 39.32 | 63.36 | 78.96 | 47.76 | 66.36 | 82.33 | 50.39 |
| 44 | 63 | 54.91 | 69.44 | 40.39 | 65.27 | 81.10 | 49.43 | 68.88 | 85.15 | 52.62 |
| 45 | 65 | 56.14 | 70.83 | 41.46 | 67.17 | 83.23 | 51.11 | 71.45 | 88.01 | 54.88 |
| 46 | 66 | 57.37 | 72.22 | 42.53 | 69.06 | 85.35 | 52.77 | 74.05 | 90.92 | 57.19 |
| 47 | 68 | 58.60 | 73.60 | 43.60 | 70.94 | 87.45 | 54.43 | 76.70 | 93.86 | 59.53 |
| 48 | 71 | 59.83 | 74.99 | 44.67 | 72.81 | 89.54 | 56.09 | 79.38 | 96.85 | 61.92 |
| 49 | 74 | 61.05 | 76.37 | 45.74 | 74.67 | 91.61 | 57.73 | 82.11 | 99.87 | 64.35 |
| Time | Real | PNZ | PZ | TP | ||||||
| Prediction | Upper | Lower | Prediction | Upper | Lower | Prediction | Upper | Lower | ||
| 40 | 58 | 163.96 | 189.05 | 138.86 | 28.51 | 38.97 | 18.04 | 58.28 | 73.24 | 43.31 |
| 41 | 58 | 168.86 | 194.33 | 143.39 | 29.87 | 40.58 | 19.16 | 60.47 | 75.71 | 45.23 |
| 42 | 58 | 173.80 | 199.64 | 147.96 | 31.28 | 42.24 | 20.31 | 62.69 | 78.21 | 47.17 |
| 43 | 59 | 178.77 | 204.97 | 152.56 | 32.73 | 43.94 | 21.52 | 64.93 | 80.72 | 49.13 |
| 44 | 63 | 183.77 | 210.34 | 157.20 | 34.24 | 45.70 | 22.77 | 67.19 | 83.26 | 51.13 |
| 45 | 65 | 188.81 | 215.74 | 161.88 | 35.79 | 47.52 | 24.06 | 69.48 | 85.81 | 53.14 |
| 46 | 66 | 193.88 | 221.17 | 166.59 | 37.40 | 49.38 | 25.41 | 71.78 | 88.39 | 55.18 |
| 47 | 68 | 198.98 | 226.63 | 171.33 | 39.05 | 51.30 | 26.80 | 74.11 | 90.99 | 57.24 |
| 48 | 71 | 204.12 | 232.12 | 176.11 | 40.76 | 53.28 | 28.25 | 76.46 | 93.60 | 59.32 |
| 49 | 74 | 209.28 | 237.64 | 180.93 | 42.53 | 55.31 | 29.75 | 78.83 | 96.24 | 61.43 |
| Time | Real | TC | Vtub | DPF | ||||||
| Prediction | Upper | Lower | Prediction | Upper | Lower | Prediction | Upper | Lower | ||
| 40 | 58 | 57.84 | 72.75 | 42.94 | 29.64 | 40.31 | 18.97 | 58.94 | 73.98 | 43.89 |
| 41 | 58 | 59.53 | 74.65 | 44.40 | 31.00 | 41.91 | 20.08 | 61.33 | 76.68 | 45.98 |
| 42 | 58 | 61.13 | 76.45 | 45.80 | 32.38 | 43.54 | 21.23 | 63.78 | 79.43 | 48.13 |
| 43 | 59 | 62.64 | 78.15 | 47.13 | 33.80 | 45.19 | 22.40 | 66.28 | 82.23 | 50.32 |
| 44 | 63 | 64.07 | 79.76 | 48.38 | 35.23 | 46.87 | 23.60 | 68.82 | 85.08 | 52.56 |
| 45 | 65 | 65.42 | 81.27 | 49.57 | 36.69 | 48.57 | 24.82 | 71.41 | 87.97 | 54.85 |
| 46 | 66 | 66.68 | 82.68 | 50.67 | 38.18 | 50.29 | 26.07 | 74.05 | 90.92 | 57.19 |
| 47 | 68 | 67.86 | 84.00 | 51.71 | 39.68 | 52.02 | 27.33 | 76.75 | 93.92 | 59.57 |
| 48 | 71 | 68.95 | 85.23 | 52.68 | 41.20 | 53.78 | 28.62 | 79.49 | 96.96 | 62.01 |
| 49 | 74 | 69.97 | 86.36 | 53.57 | 42.74 | 55.55 | 29.92 | 82.28 | 100.06 | 64.50 |
| Time | Real | UDPF | DNN | RNN | ||||||
| Prediction | Upper | Lower | Prediction | Upper | Lower | Prediction | Upper | Lower | ||
| 40 | 58 | 62.68 | 78.19 | 47.16 | 60.01 | 75.20 | 44.83 | 59.46 | 74.57 | 44.34 |
| 41 | 58 | 64.97 | 80.77 | 49.18 | 59.02 | 74.07 | 43.96 | 59.24 | 74.32 | 44.15 |
| 42 | 58 | 67.29 | 83.37 | 51.21 | 59.02 | 74.07 | 43.96 | 59.19 | 74.27 | 44.11 |
| 43 | 59 | 69.62 | 85.97 | 53.26 | 61.01 | 76.32 | 45.70 | 60.24 | 75.45 | 45.03 |
| 44 | 63 | 71.96 | 88.58 | 55.33 | 64.39 | 80.12 | 48.66 | 64.71 | 80.48 | 48.95 |
| 45 | 65 | 74.31 | 91.20 | 57.41 | 67.01 | 83.06 | 50.97 | 66.64 | 82.64 | 50.64 |
| 46 | 66 | 76.67 | 93.83 | 59.50 | 68.01 | 84.18 | 51.85 | 67.41 | 83.50 | 51.32 |
| 47 | 68 | 79.03 | 96.46 | 61.61 | 70.01 | 86.41 | 53.61 | 69.44 | 85.77 | 53.11 |
| 48 | 71 | 81.41 | 99.10 | 63.73 | 71.70 | 88.30 | 55.11 | 72.65 | 89.35 | 55.94 |
| 49 | 74 | 83.79 | 101.73 | 65.85 | 74.70 | 91.65 | 57.76 | 75.82 | 92.88 | 58.75 |
| Time | Real | LSTM | GRU | |||||||
| Prediction | Upper | Lower | Prediction | Upper | Lower | |||||
| 40 | 58 | 59.51 | 74.63 | 44.39 | 59.72 | 74.86 | 44.57 | |||
| 41 | 58 | 59.42 | 74.53 | 44.31 | 59.27 | 74.36 | 44.18 | |||
| 42 | 58 | 59.36 | 74.46 | 44.26 | 59.13 | 74.20 | 44.06 | |||
| 43 | 59 | 60.33 | 75.55 | 45.10 | 60.26 | 75.47 | 45.04 | |||
| 44 | 63 | 64.53 | 80.27 | 48.78 | 64.78 | 80.56 | 49.00 | |||
| 45 | 65 | 66.53 | 82.52 | 50.55 | 66.78 | 82.80 | 50.77 | |||
| 46 | 66 | 67.46 | 83.55 | 51.36 | 67.54 | 83.65 | 51.43 | |||
| 47 | 68 | 69.45 | 85.78 | 53.11 | 69.70 | 86.06 | 53.34 | |||
| 48 | 71 | 72.54 | 89.24 | 55.85 | 72.61 | 89.31 | 55.91 | |||
| 49 | 74 | 75.55 | 92.58 | 58.51 | 75.50 | 92.53 | 58.47 | |||
Table A4.
95% Prediction confidence interval of software reliability models from 90% of Dataset 1.
Table A4.
95% Prediction confidence interval of software reliability models from 90% of Dataset 1.
| Time | Real | GO | DS | YID | ||||||
| Prediction | Upper | Lower | Prediction | Upper | Lower | Prediction | Upper | Lower | ||
| 45 | 65 | 58.35 | 73.32 | 43.38 | 65.02 | 80.82 | 49.21 | 66.13 | 82.07 | 50.19 |
| 46 | 66 | 59.64 | 74.78 | 44.50 | 66.73 | 82.74 | 50.72 | 68.13 | 84.31 | 51.96 |
| 47 | 68 | 60.93 | 76.23 | 45.63 | 68.42 | 84.63 | 52.21 | 70.15 | 86.56 | 53.73 |
| 48 | 71 | 62.22 | 77.68 | 46.76 | 70.10 | 86.51 | 53.69 | 72.17 | 88.82 | 55.52 |
| 49 | 74 | 63.51 | 79.14 | 47.89 | 71.76 | 88.36 | 55.16 | 74.19 | 91.08 | 57.31 |
| Time | Real | PNZ | PZ | TP | ||||||
| Prediction | Upper | Lower | Prediction | Upper | Lower | Prediction | Upper | Lower | ||
| 45 | 65 | 68.29 | 84.49 | 52.10 | 89.44 | 107.98 | 70.90 | 35.16 | 46.78 | 23.54 |
| 46 | 66 | 69.86 | 86.25 | 53.48 | 90.03 | 108.62 | 71.43 | 36.28 | 48.09 | 24.48 |
| 47 | 68 | 71.38 | 87.94 | 54.82 | 90.57 | 109.23 | 71.92 | 37.40 | 49.39 | 25.41 |
| 48 | 71 | 72.85 | 89.58 | 56.12 | 91.08 | 109.79 | 72.38 | 38.51 | 50.67 | 26.35 |
| 49 | 74 | 74.27 | 91.16 | 57.38 | 91.55 | 110.31 | 72.80 | 39.61 | 51.95 | 27.28 |
| Time | Real | TC | Vtub | DPF | ||||||
| Prediction | Upper | Lower | Prediction | Upper | Lower | Prediction | Upper | Lower | ||
| 45 | 65 | 65.76 | 81.65 | 49.86 | 65.89 | 81.80 | 49.98 | 63.71 | 79.35 | 48.06 |
| 46 | 66 | 67.66 | 83.78 | 51.53 | 67.78 | 83.91 | 51.64 | 64.82 | 80.60 | 49.04 |
| 47 | 68 | 69.56 | 85.90 | 53.21 | 69.66 | 86.02 | 53.30 | 65.85 | 81.75 | 49.94 |
| 48 | 71 | 71.45 | 88.02 | 54.89 | 71.53 | 88.11 | 54.95 | 66.80 | 82.82 | 50.78 |
| 49 | 74 | 73.35 | 90.13 | 56.56 | 73.39 | 90.19 | 56.60 | 67.68 | 83.81 | 51.56 |
| Time | Real | UDPF | DNN | RNN | ||||||
| Prediction | Upper | Lower | Prediction | Upper | Lower | Prediction | Upper | Lower | ||
| 45 | 65 | 83.99 | 101.95 | 66.03 | 66.72 | 82.73 | 50.71 | 66.52 | 82.50 | 50.53 |
| 46 | 66 | 85.64 | 103.78 | 67.51 | 68.57 | 84.80 | 52.34 | 67.43 | 83.52 | 51.33 |
| 47 | 68 | 87.28 | 105.59 | 68.97 | 69.72 | 86.08 | 53.35 | 69.45 | 85.78 | 53.11 |
| 48 | 71 | 88.89 | 107.36 | 70.41 | 71.70 | 88.30 | 55.11 | 72.54 | 89.23 | 55.85 |
| 49 | 74 | 90.47 | 109.11 | 71.83 | 74.70 | 91.64 | 57.76 | 75.61 | 92.65 | 58.57 |
| Time | Real | LSTM | GRU | |||||||
| Prediction | Upper | Lower | Prediction | Upper | Lower | |||||
| 45 | 65 | 66.55 | 82.54 | 50.56 | 66.52 | 82.51 | 50.54 | |||
| 46 | 66 | 67.46 | 83.56 | 51.37 | 67.45 | 83.55 | 51.36 | |||
| 47 | 68 | 69.50 | 85.84 | 53.16 | 69.50 | 85.84 | 53.16 | |||
| 48 | 71 | 72.57 | 89.27 | 55.87 | 72.61 | 89.31 | 55.91 | |||
| 49 | 74 | 75.58 | 92.62 | 58.54 | 75.69 | 92.74 | 58.64 | |||
Table A5.
95% Prediction confidence interval of software reliability models from 80% of Dataset 2.
Table A5.
95% Prediction confidence interval of software reliability models from 80% of Dataset 2.
| Time | Real | GO | DS | YID | ||||||
| Prediction | Upper | Lower | Prediction | Upper | Lower | Prediction | Upper | Lower | ||
| 104 | 221 | 162.41 | 187.39 | 137.43 | 210.86 | 239.32 | 182.40 | 212.33 | 240.89 | 183.77 |
| 105 | 227 | 163.96 | 189.06 | 138.87 | 214.68 | 243.40 | 185.96 | 216.29 | 245.12 | 187.47 |
| 106 | 230 | 165.52 | 190.73 | 140.30 | 218.53 | 247.50 | 189.55 | 220.29 | 249.38 | 191.20 |
| 107 | 242 | 167.07 | 192.40 | 141.74 | 222.40 | 251.63 | 193.17 | 224.32 | 253.67 | 194.96 |
| 108 | 248 | 168.62 | 194.07 | 143.17 | 226.31 | 255.79 | 196.82 | 228.38 | 258.00 | 198.76 |
| 109 | 261 | 170.18 | 195.74 | 144.61 | 230.24 | 259.98 | 200.50 | 232.48 | 262.36 | 202.60 |
| 110 | 269 | 171.73 | 197.41 | 146.04 | 234.21 | 264.20 | 204.21 | 236.61 | 266.76 | 206.47 |
| 111 | 279 | 173.28 | 199.08 | 147.48 | 238.20 | 268.45 | 207.95 | 240.78 | 271.20 | 210.37 |
| 112 | 284 | 174.83 | 200.75 | 148.92 | 242.22 | 272.73 | 211.72 | 244.99 | 275.67 | 214.31 |
| 113 | 287 | 176.38 | 202.41 | 150.35 | 246.27 | 277.03 | 215.52 | 249.23 | 280.17 | 218.28 |
| 114 | 298 | 177.94 | 204.08 | 151.79 | 250.35 | 281.37 | 219.34 | 253.50 | 284.71 | 222.29 |
| 115 | 313 | 179.49 | 205.75 | 153.23 | 254.46 | 285.73 | 223.20 | 257.81 | 289.28 | 226.34 |
| 116 | 325 | 181.04 | 207.41 | 154.67 | 258.60 | 290.12 | 227.08 | 262.15 | 293.88 | 230.41 |
| 117 | 335 | 182.59 | 209.08 | 156.11 | 262.76 | 294.53 | 230.99 | 266.53 | 298.52 | 234.53 |
| 118 | 350 | 184.14 | 210.74 | 157.54 | 266.96 | 298.98 | 234.93 | 270.94 | 303.20 | 238.68 |
| 119 | 366 | 185.69 | 212.40 | 158.98 | 271.18 | 303.45 | 238.90 | 275.38 | 307.91 | 242.86 |
| 120 | 378 | 187.24 | 214.06 | 160.42 | 275.42 | 307.95 | 242.90 | 279.86 | 312.65 | 247.07 |
| 121 | 386 | 188.79 | 215.73 | 161.86 | 279.70 | 312.48 | 246.92 | 284.38 | 317.43 | 251.33 |
| 122 | 398 | 190.35 | 217.39 | 163.30 | 284.00 | 317.03 | 250.97 | 288.93 | 322.24 | 255.61 |
| 123 | 406 | 191.90 | 219.05 | 164.74 | 288.34 | 321.62 | 255.05 | 293.51 | 327.09 | 259.93 |
| 124 | 412 | 193.45 | 220.71 | 166.19 | 292.69 | 326.23 | 259.16 | 298.13 | 331.97 | 264.28 |
| 125 | 422 | 195.00 | 222.37 | 167.63 | 297.08 | 330.86 | 263.30 | 302.78 | 336.88 | 268.67 |
| 126 | 432 | 196.55 | 224.02 | 169.07 | 301.49 | 335.53 | 267.46 | 307.46 | 341.83 | 273.10 |
| 127 | 449 | 198.10 | 225.68 | 170.51 | 305.93 | 340.22 | 271.65 | 312.18 | 346.81 | 277.55 |
| 128 | 455 | 199.65 | 227.34 | 171.95 | 310.40 | 344.93 | 275.87 | 316.94 | 351.83 | 282.04 |
| 129 | 476 | 201.19 | 229.00 | 173.39 | 314.90 | 349.68 | 280.11 | 321.73 | 356.88 | 286.57 |
| Time | Real | PNZ | PZ | TP | ||||||
| Prediction | Upper | Lower | Prediction | Upper | Lower | Prediction | Upper | Lower | ||
| 104 | 221 | 487.7756 | 531.063 | 444.488 | 215.524 | 244.299 | 186.750 | 54.79 | 69.30 | 40.28 |
| 105 | 227 | 495.2823 | 538.902 | 451.663 | 219.663 | 248.712 | 190.614 | 55.61 | 70.23 | 40.99 |
| 106 | 230 | 502.8471 | 546.799 | 458.896 | 223.824 | 253.147 | 194.501 | 56.43 | 71.16 | 41.71 |
| 107 | 242 | 510.4698 | 554.753 | 466.186 | 228.005 | 257.600 | 198.409 | 57.26 | 72.10 | 42.43 |
| 108 | 248 | 518.1506 | 562.766 | 473.535 | 232.205 | 262.072 | 202.338 | 58.10 | 73.04 | 43.16 |
| 109 | 261 | 525.8893 | 570.837 | 480.942 | 236.421 | 266.558 | 206.284 | 58.94 | 73.99 | 43.90 |
| 110 | 269 | 533.6859 | 578.965 | 488.407 | 240.654 | 271.059 | 210.248 | 59.79 | 74.95 | 44.64 |
| 111 | 279 | 541.5405 | 587.152 | 495.929 | 244.900 | 275.572 | 214.227 | 60.65 | 75.91 | 45.38 |
| 112 | 284 | 549.4528 | 595.396 | 503.510 | 249.157 | 280.095 | 218.219 | 61.51 | 76.88 | 46.14 |
| 113 | 287 | 557.423 | 603.698 | 511.148 | 253.425 | 284.627 | 222.223 | 62.38 | 77.86 | 46.90 |
| 114 | 298 | 565.4509 | 612.058 | 518.844 | 257.701 | 289.165 | 226.237 | 63.25 | 78.84 | 47.67 |
| 115 | 313 | 573.5364 | 620.476 | 526.597 | 261.983 | 293.708 | 230.259 | 64.14 | 79.83 | 48.44 |
| 116 | 325 | 581.6795 | 628.951 | 534.408 | 266.270 | 298.253 | 234.288 | 65.03 | 80.83 | 49.22 |
| 117 | 335 | 589.88 | 637.483 | 542.277 | 270.560 | 302.800 | 238.321 | 65.92 | 81.84 | 50.01 |
| 118 | 350 | 598.138 | 646.073 | 550.203 | 274.851 | 307.345 | 242.356 | 66.82 | 82.85 | 50.80 |
| 119 | 366 | 606.4533 | 654.721 | 558.186 | 279.140 | 311.887 | 246.393 | 67.73 | 83.87 | 51.60 |
| 120 | 378 | 614.8259 | 663.425 | 566.226 | 283.427 | 316.424 | 250.430 | 68.65 | 84.89 | 52.41 |
| 121 | 386 | 623.2555 | 672.187 | 574.324 | 287.709 | 320.954 | 254.463 | 69.57 | 85.92 | 53.23 |
| 122 | 398 | 631.7421 | 681.006 | 582.479 | 291.984 | 325.476 | 258.493 | 70.51 | 86.96 | 54.05 |
| 123 | 406 | 640.2856 | 689.881 | 590.690 | 296.251 | 329.987 | 262.516 | 71.44 | 88.01 | 54.88 |
| 124 | 412 | 648.8858 | 698.813 | 598.958 | 300.508 | 334.485 | 266.531 | 72.39 | 89.06 | 55.71 |
| 125 | 422 | 657.5427 | 707.802 | 607.283 | 304.753 | 338.969 | 270.537 | 73.34 | 90.13 | 56.56 |
| 126 | 432 | 666.256 | 716.847 | 615.665 | 308.985 | 343.437 | 274.532 | 74.30 | 91.20 | 57.41 |
| 127 | 449 | 675.0257 | 725.949 | 624.102 | 313.200 | 347.888 | 278.513 | 75.27 | 92.27 | 58.26 |
| 128 | 455 | 683.8516 | 735.107 | 632.596 | 317.399 | 352.318 | 282.480 | 76.24 | 93.36 | 59.13 |
| 129 | 476 | 692.7334 | 744.320 | 641.147 | 321.579 | 356.727 | 286.431 | 77.23 | 94.45 | 60.00 |
| Time | Real | TC | Vtub | DPF | ||||||
| Prediction | Upper | Lower | Prediction | Upper | Lower | Prediction | Upper | Lower | ||
| 104 | 221 | 212.53 | 241.10 | 183.96 | 215.13 | 243.88 | 186.38 | 210.95 | 239.42 | 182.48 |
| 105 | 227 | 216.44 | 245.27 | 187.60 | 219.32 | 248.34 | 190.29 | 214.13 | 242.82 | 185.45 |
| 106 | 230 | 220.38 | 249.48 | 191.28 | 223.54 | 252.85 | 194.24 | 217.27 | 246.16 | 188.38 |
| 107 | 242 | 224.35 | 253.71 | 194.99 | 227.80 | 257.39 | 198.22 | 220.36 | 249.46 | 191.27 |
| 108 | 248 | 228.35 | 257.97 | 198.73 | 232.10 | 261.97 | 202.24 | 223.41 | 252.70 | 194.11 |
| 109 | 261 | 232.38 | 262.26 | 202.50 | 236.44 | 266.58 | 206.30 | 226.40 | 255.89 | 196.91 |
| 110 | 269 | 236.44 | 266.58 | 206.30 | 240.82 | 271.23 | 210.40 | 229.34 | 259.02 | 199.66 |
| 111 | 279 | 240.53 | 270.93 | 210.13 | 245.23 | 275.92 | 214.53 | 232.23 | 262.09 | 202.36 |
| 112 | 284 | 244.65 | 275.31 | 213.99 | 249.67 | 280.64 | 218.70 | 235.06 | 265.11 | 205.01 |
| 113 | 287 | 248.80 | 279.71 | 217.88 | 254.16 | 285.40 | 222.91 | 237.83 | 268.06 | 207.61 |
| 114 | 298 | 252.97 | 284.15 | 221.80 | 258.67 | 290.20 | 227.15 | 240.55 | 270.95 | 210.15 |
| 115 | 313 | 257.18 | 288.61 | 225.75 | 263.23 | 295.03 | 231.43 | 243.21 | 273.78 | 212.65 |
| 116 | 325 | 261.41 | 293.10 | 229.72 | 267.81 | 299.89 | 235.74 | 245.81 | 276.54 | 215.09 |
| 117 | 335 | 265.68 | 297.62 | 233.73 | 272.44 | 304.79 | 240.09 | 248.36 | 279.25 | 217.47 |
| 118 | 350 | 269.97 | 302.17 | 237.76 | 277.09 | 309.72 | 244.47 | 250.84 | 281.89 | 219.80 |
| 119 | 366 | 274.29 | 306.75 | 241.82 | 281.78 | 314.68 | 248.88 | 253.27 | 284.46 | 222.08 |
| 120 | 378 | 278.63 | 311.35 | 245.91 | 286.51 | 319.68 | 253.33 | 255.63 | 286.97 | 224.30 |
| 121 | 386 | 283.01 | 315.98 | 250.03 | 291.26 | 324.71 | 257.81 | 257.94 | 289.42 | 226.46 |
| 122 | 398 | 287.41 | 320.64 | 254.18 | 296.05 | 329.78 | 262.33 | 260.19 | 291.80 | 228.57 |
| 123 | 406 | 291.84 | 325.32 | 258.35 | 300.87 | 334.87 | 266.87 | 262.37 | 294.12 | 230.63 |
| 124 | 412 | 296.29 | 330.03 | 262.55 | 305.72 | 340.00 | 271.45 | 264.50 | 296.38 | 232.63 |
| 125 | 422 | 300.77 | 334.77 | 266.78 | 310.61 | 345.15 | 276.07 | 266.57 | 298.57 | 234.57 |
| 126 | 432 | 305.28 | 339.53 | 271.04 | 315.52 | 350.34 | 280.71 | 268.58 | 300.70 | 236.46 |
| 127 | 449 | 309.82 | 344.32 | 275.32 | 320.47 | 355.56 | 285.38 | 270.54 | 302.77 | 238.30 |
| 128 | 455 | 314.38 | 349.13 | 279.63 | 325.44 | 360.80 | 290.09 | 272.43 | 304.78 | 240.08 |
| 129 | 476 | 318.97 | 353.97 | 283.96 | 330.45 | 366.08 | 294.82 | 274.27 | 306.73 | 241.81 |
| Time | Real | UDPF | DNN | RNN | ||||||
| Prediction | Upper | Lower | Prediction | Upper | Lower | Prediction | Upper | Lower | ||
| 104 | 221 | 207.30 | 235.52 | 179.08 | 224.90 | 254.29 | 195.51 | 223.38 | 252.67 | 194.09 |
| 105 | 227 | 210.58 | 239.02 | 182.13 | 231.12 | 260.92 | 201.32 | 229.02 | 258.68 | 199.36 |
| 106 | 230 | 213.86 | 242.52 | 185.20 | 232.86 | 262.76 | 202.95 | 233.04 | 262.96 | 203.12 |
| 107 | 242 | 217.14 | 246.02 | 188.26 | 245.66 | 276.38 | 214.94 | 243.36 | 273.94 | 212.78 |
| 108 | 248 | 220.43 | 249.53 | 191.33 | 252.12 | 283.24 | 221.00 | 249.67 | 280.64 | 218.70 |
| 109 | 261 | 223.72 | 253.03 | 194.40 | 264.58 | 296.46 | 232.70 | 262.29 | 294.03 | 230.54 |
| 110 | 269 | 227.01 | 256.54 | 197.48 | 272.98 | 305.36 | 240.59 | 270.43 | 302.66 | 238.20 |
| 111 | 279 | 230.30 | 260.05 | 200.56 | 282.82 | 315.78 | 249.86 | 280.34 | 313.16 | 247.52 |
| 112 | 284 | 233.60 | 263.55 | 203.64 | 288.04 | 321.30 | 254.77 | 285.86 | 319.00 | 252.72 |
| 113 | 287 | 236.89 | 267.06 | 206.73 | 289.86 | 323.22 | 256.49 | 289.90 | 323.27 | 256.53 |
| 114 | 298 | 240.19 | 270.56 | 209.81 | 301.74 | 335.79 | 267.69 | 299.40 | 333.31 | 265.48 |
| 115 | 313 | 243.48 | 274.07 | 212.90 | 316.42 | 351.28 | 281.55 | 314.27 | 349.02 | 279.52 |
| 116 | 325 | 246.78 | 277.57 | 215.99 | 328.66 | 364.19 | 293.13 | 326.29 | 361.70 | 290.89 |
| 117 | 335 | 250.08 | 281.07 | 219.08 | 338.82 | 374.90 | 302.74 | 336.33 | 372.28 | 300.39 |
| 118 | 350 | 253.37 | 284.57 | 222.17 | 353.42 | 390.27 | 316.57 | 351.27 | 388.01 | 314.54 |
| 119 | 366 | 256.67 | 288.07 | 225.27 | 369.34 | 407.00 | 331.67 | 367.27 | 404.83 | 329.71 |
| 120 | 378 | 259.96 | 291.56 | 228.36 | 381.66 | 419.95 | 343.37 | 379.29 | 417.46 | 341.12 |
| 121 | 386 | 263.25 | 295.06 | 231.45 | 389.98 | 428.68 | 351.27 | 387.43 | 426.01 | 348.85 |
| 122 | 398 | 266.54 | 298.54 | 234.55 | 401.66 | 440.94 | 362.38 | 399.30 | 438.46 | 360.13 |
| 123 | 406 | 269.83 | 302.03 | 237.64 | 409.98 | 449.66 | 370.29 | 407.43 | 446.99 | 367.87 |
| 124 | 412 | 273.12 | 305.51 | 240.73 | 416.12 | 456.10 | 376.14 | 413.69 | 453.55 | 373.82 |
| 125 | 422 | 276.41 | 308.99 | 243.82 | 425.82 | 466.27 | 385.37 | 423.36 | 463.68 | 383.03 |
| 126 | 432 | 279.69 | 312.47 | 246.91 | 435.82 | 476.74 | 394.90 | 433.34 | 474.14 | 392.54 |
| 127 | 449 | 282.97 | 315.94 | 250.00 | 452.26 | 493.94 | 410.57 | 450.27 | 491.86 | 408.68 |
| 128 | 455 | 286.24 | 319.40 | 253.08 | 459.12 | 501.12 | 417.12 | 456.64 | 498.53 | 414.76 |
| 129 | 476 | 289.52 | 322.86 | 256.17 | 478.93 | 521.83 | 436.04 | 477.26 | 520.08 | 434.44 |
| Time | Real | LSTM | GRU | |||||||
| Prediction | Upper | Lower | Prediction | Upper | Lower | |||||
| 104 | 221 | 224.52 | 253.89 | 195.15 | 224.46 | 253.82 | 195.09 | |||
| 105 | 227 | 230.52 | 260.27 | 200.76 | 230.47 | 260.23 | 200.72 | |||
| 106 | 230 | 233.63 | 263.59 | 203.67 | 233.09 | 263.02 | 203.17 | |||
| 107 | 242 | 245.44 | 276.14 | 214.73 | 245.49 | 276.20 | 214.78 | |||
| 108 | 248 | 251.49 | 282.58 | 220.41 | 251.49 | 282.58 | 220.41 | |||
| 109 | 261 | 264.28 | 296.14 | 232.42 | 264.73 | 296.62 | 232.84 | |||
| 110 | 269 | 272.32 | 304.67 | 239.98 | 272.77 | 305.14 | 240.40 | |||
| 111 | 279 | 282.19 | 315.11 | 249.26 | 282.79 | 315.75 | 249.83 | |||
| 112 | 284 | 287.44 | 320.67 | 254.21 | 287.72 | 320.96 | 254.47 | |||
| 113 | 287 | 290.57 | 323.98 | 257.16 | 290.25 | 323.64 | 256.86 | |||
| 114 | 298 | 301.38 | 335.41 | 267.36 | 301.60 | 335.64 | 267.56 | |||
| 115 | 313 | 316.31 | 351.17 | 281.46 | 316.73 | 351.62 | 281.85 | |||
| 116 | 325 | 328.25 | 363.76 | 292.74 | 328.79 | 364.33 | 293.25 | |||
| 117 | 335 | 338.21 | 374.25 | 302.16 | 338.78 | 374.85 | 302.70 | |||
| 118 | 350 | 353.18 | 390.02 | 316.35 | 353.75 | 390.62 | 316.89 | |||
| 119 | 366 | 369.30 | 406.97 | 331.64 | 369.74 | 407.43 | 332.05 | |||
| 120 | 378 | 381.25 | 419.52 | 342.98 | 381.69 | 419.98 | 343.40 | |||
| 121 | 386 | 389.30 | 427.97 | 350.63 | 389.72 | 428.41 | 351.02 | |||
| 122 | 398 | 401.13 | 440.39 | 361.88 | 401.67 | 440.96 | 362.39 | |||
| 123 | 406 | 409.25 | 448.90 | 369.60 | 409.70 | 449.38 | 370.03 | |||
| 124 | 412 | 415.37 | 455.31 | 375.42 | 415.78 | 455.75 | 375.82 | |||
| 125 | 422 | 425.18 | 465.59 | 384.76 | 425.76 | 466.20 | 385.32 | |||
| 126 | 432 | 435.14 | 476.03 | 394.26 | 435.72 | 476.64 | 394.81 | |||
| 127 | 449 | 452.25 | 493.93 | 410.56 | 452.72 | 494.43 | 411.02 | |||
| 128 | 455 | 458.45 | 500.42 | 416.49 | 458.79 | 500.77 | 416.81 | |||
| 129 | 476 | 479.47 | 522.38 | 436.55 | 479.79 | 522.72 | 436.86 | |||
Table A6.
95% Prediction confidence interval of software reliability models from 90% of Dataset 2.
Table A6.
95% Prediction confidence interval of software reliability models from 90% of Dataset 2.
| Time | Real | GO | DS | YID | ||||||
| Prediction | Upper | Lower | Prediction | Upper | Lower | Prediction | Upper | Lower | ||
| 117 | 335 | 215.85 | 244.65 | 187.06 | 284.80 | 317.88 | 251.73 | 285.07 | 318.16 | 251.98 |
| 118 | 350 | 217.69 | 246.61 | 188.77 | 289.52 | 322.87 | 256.17 | 289.81 | 323.18 | 256.45 |
| 119 | 366 | 219.53 | 248.57 | 190.49 | 294.27 | 327.89 | 260.65 | 294.59 | 328.24 | 260.95 |
| 120 | 378 | 221.37 | 250.53 | 192.21 | 299.06 | 332.95 | 265.16 | 299.41 | 333.33 | 265.50 |
| 121 | 386 | 223.21 | 252.49 | 193.93 | 303.88 | 338.05 | 269.71 | 304.26 | 338.45 | 270.08 |
| 122 | 398 | 225.05 | 254.45 | 195.65 | 308.74 | 343.18 | 274.30 | 309.16 | 343.62 | 274.69 |
| 123 | 406 | 226.89 | 256.41 | 197.37 | 313.63 | 348.34 | 278.92 | 314.08 | 348.82 | 279.35 |
| 124 | 412 | 228.73 | 258.37 | 199.08 | 318.56 | 353.54 | 283.58 | 319.05 | 354.05 | 284.04 |
| 125 | 422 | 230.57 | 260.33 | 200.80 | 323.52 | 358.78 | 288.27 | 324.05 | 359.33 | 288.76 |
| 126 | 432 | 232.40 | 262.28 | 202.53 | 328.52 | 364.05 | 293.00 | 329.08 | 364.64 | 293.53 |
| 127 | 449 | 234.24 | 264.24 | 204.25 | 333.56 | 369.35 | 297.76 | 334.16 | 369.98 | 298.33 |
| 128 | 455 | 236.08 | 266.20 | 205.97 | 338.63 | 374.69 | 302.56 | 339.27 | 375.37 | 303.16 |
| 129 | 476 | 237.92 | 268.15 | 207.69 | 343.73 | 380.07 | 307.39 | 344.41 | 380.79 | 308.04 |
| Time | Real | PNZ | PZ | TP | ||||||
| Prediction | Upper | Lower | Prediction | Upper | Lower | Prediction | Upper | Lower | ||
| 117 | 335 | 637.8859 | 687.388 | 588.383 | 312.9409 | 347.614 | 178.36 | 74.02 | 90.88 | 57.15 |
| 118 | 350 | 648.5408 | 698.455 | 598.627 | 320.3052 | 355.383 | 179.16 | 74.99 | 91.96 | 58.01 |
| 119 | 366 | 659.313 | 709.640 | 608.986 | 327.825 | 363.313 | 179.95 | 75.97 | 93.05 | 58.88 |
| 120 | 378 | 670.2031 | 720.944 | 619.462 | 335.505 | 371.406 | 180.74 | 76.95 | 94.14 | 59.76 |
| 121 | 386 | 681.2118 | 732.368 | 630.056 | 343.347 | 379.665 | 181.51 | 77.94 | 95.24 | 60.64 |
| 122 | 398 | 692.3398 | 743.912 | 640.768 | 351.355 | 388.094 | 182.28 | 78.94 | 96.35 | 61.52 |
| 123 | 406 | 703.5877 | 755.577 | 651.598 | 359.532 | 396.697 | 183.04 | 79.94 | 97.47 | 62.42 |
| 124 | 412 | 714.956 | 767.364 | 662.548 | 367.883 | 405.476 | 183.79 | 80.95 | 98.59 | 63.32 |
| 125 | 422 | 726.4455 | 779.273 | 673.618 | 376.411 | 414.437 | 184.54 | 81.97 | 99.72 | 64.23 |
| 126 | 432 | 738.0568 | 791.305 | 684.809 | 385.119 | 423.582 | 185.27 | 83.00 | 100.85 | 65.14 |
| 127 | 449 | 749.7904 | 803.460 | 696.121 | 394.011 | 432.916 | 186.00 | 84.03 | 101.99 | 66.06 |
| 128 | 455 | 761.647 | 815.739 | 707.555 | 403.091 | 442.443 | 186.72 | 85.07 | 103.14 | 66.99 |
| 129 | 476 | 773.6271 | 828.143 | 719.111 | 412.364 | 452.165 | 187.43 | 86.11 | 104.30 | 67.92 |
| Time | Real | TC | Vtub | DPF | ||||||
| Prediction | Upper | Lower | Prediction | Upper | Lower | Prediction | Upper | Lower | ||
| 117 | 335 | 300.84 | 334.83 | 266.84 | 315.55 | 350.37 | 280.74 | 314.95 | 349.74 | 280.17 |
| 118 | 350 | 306.57 | 340.89 | 272.26 | 322.66 | 357.87 | 287.45 | 322.44 | 357.63 | 287.24 |
| 119 | 366 | 312.37 | 347.01 | 277.73 | 329.85 | 365.45 | 294.25 | 330.07 | 365.68 | 294.46 |
| 120 | 378 | 318.23 | 353.20 | 283.27 | 337.12 | 373.10 | 301.13 | 337.86 | 373.89 | 301.83 |
| 121 | 386 | 324.15 | 359.44 | 288.86 | 344.46 | 380.84 | 308.09 | 345.80 | 382.25 | 309.35 |
| 122 | 398 | 330.13 | 365.74 | 294.51 | 351.88 | 388.65 | 315.12 | 353.90 | 390.77 | 317.03 |
| 123 | 406 | 336.16 | 372.10 | 300.23 | 359.37 | 396.53 | 322.22 | 362.16 | 399.46 | 324.86 |
| 124 | 412 | 342.26 | 378.52 | 306.00 | 366.93 | 404.48 | 329.39 | 370.58 | 408.31 | 332.85 |
| 125 | 422 | 348.42 | 385.00 | 311.83 | 374.56 | 412.49 | 336.63 | 379.17 | 417.33 | 341.00 |
| 126 | 432 | 354.63 | 391.54 | 317.72 | 382.25 | 420.57 | 343.93 | 387.92 | 426.52 | 349.31 |
| 127 | 449 | 360.91 | 398.14 | 323.67 | 389.99 | 428.70 | 351.29 | 396.83 | 435.88 | 357.79 |
| 128 | 455 | 367.25 | 404.81 | 329.69 | 397.79 | 436.89 | 358.70 | 405.92 | 445.41 | 366.43 |
| 129 | 476 | 373.64 | 411.53 | 335.76 | 405.65 | 445.12 | 366.17 | 415.18 | 455.12 | 375.25 |
| Time | Real | UDPF | DNN | RNN | ||||||
| Prediction | Upper | Lower | Prediction | Upper | Lower | Prediction | Upper | Lower | ||
| 117 | 335 | 313.06 | 347.74 | 278.38 | 342.30 | 378.56 | 306.04 | 344.31 | 380.68 | 307.94 |
| 118 | 350 | 319.88 | 354.94 | 284.83 | 357.85 | 394.93 | 320.77 | 359.54 | 396.70 | 322.38 |
| 119 | 366 | 326.81 | 362.24 | 291.37 | 373.93 | 411.83 | 336.03 | 375.59 | 413.58 | 337.61 |
| 120 | 378 | 333.83 | 369.64 | 298.02 | 385.60 | 424.09 | 347.11 | 387.48 | 426.06 | 348.90 |
| 121 | 386 | 340.96 | 377.15 | 304.77 | 392.86 | 431.70 | 354.01 | 395.19 | 434.15 | 356.22 |
| 122 | 398 | 348.19 | 384.77 | 311.62 | 405.60 | 445.08 | 366.13 | 407.38 | 446.94 | 367.82 |
| 123 | 406 | 355.53 | 392.49 | 318.57 | 412.86 | 452.68 | 373.03 | 415.14 | 455.07 | 375.20 |
| 124 | 412 | 362.97 | 400.31 | 325.63 | 417.20 | 457.23 | 377.16 | 420.72 | 460.92 | 380.52 |
| 125 | 422 | 370.52 | 408.25 | 332.79 | 429.30 | 469.91 | 388.69 | 431.01 | 471.71 | 390.32 |
| 126 | 432 | 378.17 | 416.29 | 340.06 | 439.30 | 480.38 | 398.22 | 441.16 | 482.33 | 400.00 |
| 127 | 449 | 385.93 | 424.44 | 347.43 | 457.00 | 498.90 | 415.10 | 458.57 | 500.55 | 416.60 |
| 128 | 455 | 393.80 | 432.70 | 354.91 | 460.20 | 502.24 | 418.15 | 464.02 | 506.24 | 421.80 |
| 129 | 476 | 401.78 | 441.06 | 362.49 | 484.30 | 527.43 | 441.17 | 485.63 | 528.82 | 442.44 |
| Time | Real | LSTM | GRU | |||||||
| Prediction | Upper | Lower | Prediction | Upper | Lower | |||||
| 117 | 335 | 344.69 | 381.08 | 308.30 | 341.00 | 377.20 | 304.81 | |||
| 118 | 350 | 359.89 | 397.08 | 322.71 | 356.47 | 393.48 | 319.47 | |||
| 119 | 366 | 376.04 | 414.05 | 338.04 | 372.84 | 410.68 | 334.99 | |||
| 120 | 378 | 388.18 | 426.80 | 349.56 | 384.75 | 423.19 | 346.30 | |||
| 121 | 386 | 396.10 | 435.10 | 357.09 | 392.09 | 430.91 | 353.28 | |||
| 122 | 398 | 408.02 | 447.61 | 368.43 | 404.27 | 443.68 | 364.86 | |||
| 123 | 406 | 415.90 | 455.87 | 375.93 | 411.73 | 451.50 | 371.95 | |||
| 124 | 412 | 421.43 | 461.67 | 381.20 | 416.92 | 456.94 | 376.90 | |||
| 125 | 422 | 431.44 | 472.15 | 390.73 | 427.32 | 467.83 | 386.80 | |||
| 126 | 432 | 441.49 | 482.67 | 400.31 | 437.55 | 478.54 | 396.55 | |||
| 127 | 449 | 458.83 | 500.81 | 416.85 | 455.32 | 497.14 | 413.50 | |||
| 128 | 455 | 464.67 | 506.92 | 422.42 | 460.27 | 502.32 | 418.22 | |||
| 129 | 476 | 485.82 | 529.02 | 442.62 | 482.13 | 525.17 | 439.09 | |||
References
- Jelinski, Z.; Moranda, P. Software reliability research. In Statistical Computer Performance Evaluation; Elsevier: Amsterdam, The Netherlands, 1972; pp. 465–484. [Google Scholar]
- Goel, A.L.; Okumoto, K. Time-dependent error-detection rate model for software reliability and other performance measures. IEEE Trans. Reliab. 1979, 28, 206–211. [Google Scholar] [CrossRef]
- Yamada, S.; Ohba, M.; Osaki, S. S-shaped reliability growth modeling for software error detection. IEEE Trans. Reliab. 1983, 32, 475–484. [Google Scholar] [CrossRef]
- Ohba, M. Inflection S-shaped software reliability growth model. In Stochastic Models in Reliability Theory; Osaki, S., Hatoyama, Y., Eds.; Springer: Berlin, Germany, 1984; pp. 144–162. [Google Scholar]
- Zhang, X.M.; Teng, X.L.; Pham, H. Considering fault removal efficiency in software reliability assessment. IEEE Trans. Syst. Man. Cybern. Part Syst. Hum. 2003, 33, 114–120. [Google Scholar] [CrossRef]
- Yamada, S.; Tokuno, K.; Osaki, S. Imperfect debugging models with fault introduction rate for software reliability assessment. Int. J. Syst. Sci. 1992, 23, 2241–2252. [Google Scholar] [CrossRef]
- Pham, H.; Zhang, X. An NHPP software reliability models and its comparison. Int. J. Reliab. Qual. Saf. Eng. 1997, 4, 269–282. [Google Scholar] [CrossRef]
- Pham, H.; Nordmann, L.; Zhang, X. A general imperfect software debugging model with S-shaped fault detection rate. IEEE Trans. Reliab. 1999, 48, 169–175. [Google Scholar] [CrossRef]
- Teng, X.; Pham, H. A new methodology for predicting software reliability in the random field environments. IEEE Trans. Reliab. 2006, 55, 458–468. [Google Scholar] [CrossRef]
- Kapur, P.K.; Pham, H.; Anand, S.; Yadav, K. A unified approach for developing software reliability growth models in the presence of imperfect debugging and error generation. IEEE Trans. Reliab. 2011, 60, 331–340. [Google Scholar] [CrossRef]
- Roy, P.; Mahapatra, G.S.; Dey, K.N. An NHPP software reliability growth model with imperfect debugging and error generation. Int. J. Reliab. Qual. Saf. Eng. 2014, 21, 1450008. [Google Scholar] [CrossRef]
- Chang, I.H.; Pham, H.; Lee, S.W.; Song, K.Y. A testing-coverage software reliability model with the uncertainty of operation environments. Int. J. Syst. Sci. Oper. Logist. 2014, 1, 220–227. [Google Scholar] [CrossRef]
- Pham, H. A new software reliability model with Vtub-Shaped fault detection rate and the uncertainty of operating environments. Optimization 2014, 63, 1481–1490. [Google Scholar] [CrossRef]
- Pham, L.; Pham, H. Software reliability models with time-dependent hazard function based on bayesian approach. IEEE Trans. Syst. Man, Cybern.-Part A Syst. Humans 2000, 30, 25–35. [Google Scholar] [CrossRef]
- Kim, Y.S.; Song, K.Y.; Pham, H.; Chang, I.H. A software reliability model with dependent failure and optimal release time. Symmetry 2022, 14, 343. [Google Scholar] [CrossRef]
- Lee, D.H.; Chang, I.H.; Pham, H. Software reliability growth model with dependent failures and uncertain operating environments. Appl. Sci. 2022, 12, 12383. [Google Scholar] [CrossRef]
- Kim, Y.S.; Chang, I.H.; Lee, D.H. Non-parametric software reliability model using deep neural network and NHPP software reliability growth model comparison. J. Korean Data Anal. Soc. 2020, 22, 2371–2382. [Google Scholar] [CrossRef]
- Miyamoto, S.; Tamura, Y.; Yamada, S. Reliability assessment tool based on deep learning and data preprocessing for OSS. Am. J. Oper. Res. 2022, 12, 111–125. [Google Scholar] [CrossRef]
- Wang, J.; Zhang, C. Software reliability prediction using a deep learning model based on the RNN encoder–decoder. Reliab. Eng. Syst. Saf. 2018, 170, 73–82. [Google Scholar] [CrossRef]
- Oveisi, S.; Moeini, A.; Mirzaei, S. LSTM encoder-decoder dropout model in software reliability prediction. Int. J. Reliab. Risk Saf. Theory Appl. 2021, 4, 1–12. [Google Scholar] [CrossRef]
- Raamesh, L.; Jothi, S.; Radhika, S. Enhancing software reliability and fault detection using hybrid brainstorm optimization-based LSTM model. IETE J. Res. 2022, 1–15. [Google Scholar] [CrossRef]
- Karunanithi, N.; Whitley, D.; Malaiya, Y.K. Using neural networks in reliability prediction. IEEE Softw. 1992, 9, 53–59. [Google Scholar] [CrossRef]
- Singh, Y.; Kumar, P. Prediction of software reliability using feed forward neural networks. In Proceedings of the 2010 International Conference on Computational Intelligence and Software Engineering, Wuhan, China, 10–12 December 2010; pp. 1–5. [Google Scholar]
- Graves, A. Generating sequences with recurrent neural networks. arXiv 2013, arXiv:1308.0850. [Google Scholar]
- Bengio, Y.; Simard, P.; Frasconi, P. Learning long-term dependencies with gradient descent is difficult. IEEE Trans. Neural Netw. 1994, 5, 157–166. [Google Scholar] [CrossRef] [PubMed]
- Jozefowicz, R.; Zaremba, W.; Sutskever, I. An empirical exploration of recurrent network architectures In Proceedings of the 32nd International Conference on Machine Learning (ICML-15), Lille, France, 6–11 July 2015.
- Gers, F.A.; Schmidhuber, J.; Cummins, F. Learning to forget: Continual prediction with LSTM. Neural Comput. 2000, 12, 2451–2471. [Google Scholar] [CrossRef]
- Inoue, S.; Yamada, S. Discrete software reliability assessment with discretized NHPP models. Comput. Math. Appl. 2006, 51, 161–170. [Google Scholar] [CrossRef]
- Askari, R.; Sebt, M.V.; Amjadian, A. A multi-product EPQ model for defective production and inspection with single machine, and operational constraints: Stochastic programming approach. Commun. Comput. Infor. Sci. 2021, 1458, 161–193. [Google Scholar]
- Jeske, D.R.; Zhang, X. Some successful approaches to software reliability modeling in industry. J. Syst. Softw. 2005, 74, 85–99. [Google Scholar] [CrossRef]
- Iqbal, J. Software reliability growth models: A comparison of linear and exponential fault content functions for study of imperfect debugging situations. Cogent Eng. 2017, 4, 1286739. [Google Scholar] [CrossRef]
- Pillai, K.; Sukumaran Nair, V.S. A model for software development effort and cost estimation. IEEE Trans. Softw. Eng. 1997, 23, 485–497. [Google Scholar] [CrossRef]
- Souza, R.L.C.; Ghasemi, A.; Saif, A.; Gharaei, A. Robust job-shop scheduling under deterministic and stochastic unavailability constraints due to preventive and corrective maintenance. Comput. Ind. Eng. 2022, 168, 108130. [Google Scholar] [CrossRef]
- Li, Q.; Pham, H. NHPP software reliability model considering the uncertainty of operating environments with imperfect debugging and testing coverage. Appl. Math. Model. 2017, 51, 68–85. [Google Scholar] [CrossRef]
- Pham, H. System Software Reliability; Springer: London, UK, 2006. [Google Scholar]


Disclaimer/Publisher’s Note: The statements, opinions and data contained in all publications are solely those of the individual author(s) and contributor(s) and not of MDPI and/or the editor(s). MDPI and/or the editor(s) disclaim responsibility for any injury to people or property resulting from any ideas, methods, instructions or products referred to in the content. |
© 2023 by the authors. Licensee MDPI, Basel, Switzerland. This article is an open access article distributed under the terms and conditions of the Creative Commons Attribution (CC BY) license (https://creativecommons.org/licenses/by/4.0/).