Article

Increasing the Oxidative Stability of the Wafer Lipid Fraction with Fruit Extract during Storage

by
Liliana Bełkowska
,
Małgorzata Muzolf-Panek
,
Mahbuba Islam
and
Jolanta Tomaszewska-Gras
*
Department of Food Quality and Safety Management, Faculty of Food Science and Nutrition, Poznań University of Life Sciences, Wojska Polskiego 31/33, 60-624 Poznań, Poland
*
Author to whom correspondence should be addressed.
Appl. Sci. 2023, 13(1), 103; https://doi.org/10.3390/app13010103
Submission received: 14 November 2022 / Revised: 19 December 2022 / Accepted: 19 December 2022 / Published: 21 December 2022
(This article belongs to the Special Issue New Insights into Natural Antioxidants in Foods)

Abstract

:

Featured Application

Commercial fruit extract was tested in terms of preventing the oxidation of lipids in wafers stored during 13 months. It was proved that fruit extract effectively enhanced the oxidative stability of lipid fraction of wafers up until the 10th month of storage. The results obtained are of particular interest to consumers and producers, as both production and storage took place in real-life conditions. Moreover, for the first time, the effect of commercially available extract of natural origin on the oxidative stability of wafers was tested. The extract is of repeatable quality, which is very important for the producer and at the same time it meets consumers’ demands for “clean label”.

Abstract

Confectionary products are increasingly popular among consumers. However, since they usually have a long shelf life (about 12 months), their oxidative stability during long-term storage becomes a significant issue. Thus, the aim of this study was to investigate the effect of addition of commercially available fruit extract on the oxidative stability of lipid fraction, extracted from wafers sheets stored 13 months at 18 °C. For this purpose, the oxidation induction times (OIT) were determined by using isothermal differential scanning calorimetry (DSC). Conjugated diene content (CD) and 2,2-diphenyl-1-pikrylhydrazyl (DPPH) antioxidant activity were also monitored. All results obtained showed that the fruit extract addition slowed down effectively the peroxidation process of lipid fraction of wafer sheets. The rate of OIT and CD changes during the first six months of storage were about two times lower for the sample with the extract (LWE) than for the control (LWS). The DPPH antioxidant activity of LWE was higher than for the LWS sample until the 8th month of storage. It was stated that fruit extract effectively enhanced the oxidative stability of lipid fraction of wafers up until the 10th month of storage. After this period, CD values increased significantly for LWS and LWE samples, while at the same time there were no significant differences in OIT and DPPH values between both samples (p > 0.05).

1. Introduction

Wafers are becoming more and more popular among consumers. The wafer and biscuits market was worth $85 billion at the end of 2019 and was predicted to continue to grow strongly [1]. These forecasts proved to be accurate, since according to data from the Nielsen database, in 2020 and 2021 there was an increase in the market, both in terms of value and quantity. Wafers are stable confectionery products that are sold in many forms and shapes: separately (wafers, ice cream wafers, wafer tubes, etc.) or as part of popular products filled, layered with cream or covered with chocolate. Another reason for their popularity is the convenience of buying in bulk. The shelf life of wafers is long and ranges from 3 months for wafer sheets to even 12 months for wafers products. Unfortunately, the wafers as very thin products (up to a few mm) are exposed to unfavorable conditions during production [2], i.e., to high temperature during baking (150–170 °C), lasting 2–4 min, during which the entire surface of wafer is in contact with the baking plates. The main component, which is very prone to undesirable changes is fat. Daglioglu et al. [3] drew attention to the fact that the highest amount of fat in selected bakery products they tested was in wafers and they mentioned that the good quality of used fat and conditions of storage finished product are really important. The conditions of the baking process (temperature, time) as well as the conditions of storage (temperature, humidity, time) are factors lowering quality of wafers in terms of oxidative stability and sensory characteristics resulting in the development of rancidity [4]. Particularly prone to oxidation are oils with a high content of unsaturated fatty acids, especially when subjected to high temperature treatment. During the oxidation process, which is a free radical chain reaction, new compounds are formed, which are detrimental to health (peroxides, hydroperoxides). Reactive radicals initiate further reactions leading to the formation of secondary oxidation products such as ketones, aldehydes, alcohols and esters [3,5,6].
A significant increase in the stability of fat can be reached by adding synthetic antioxidants, e.g., butylated hydroxyanisole (BHA) and butylated hydroxytoluene (BHT), however they are not well perceived by consumers. They can also have a negative effect on health [7]. Growing interest in the ecological trend is currently observed, which means that consumers pay attention to the origin, source and the method of obtaining ingredients. Therefore, fruit extracts are an alternative to the aforementioned synthetic antioxidants. Thanks to natural compounds with antioxidant potential, i.e., phenolic acids, polyphenols such as flavonoids, it is possible to increase the oxidative stability of products containing fats and oils. Antioxidant activity in different confectionery products was tested by using parts of plants, e.g., leaves, seeds or by using extracts. Gramza-Michałowska et al. [8] reported that ground green and yellow tea leaves added to cookies significantly slowed down the oxidative changes during storage. In turn, Mildner-Szkudlarz et al. [9] proved the protective properties of green tea extract against the oxidation of fats in biscuits. Extracts obtained from various spices and herbs have also been reported to be effective antioxidants [10,11,12,13,14]. Reddy at al. [11] confirmed that the addition of extracts from amla (Emblica officinalis), drumstick leaves (Moringa oleifera) and raisins (Vitis vinifera) improved the antioxidative effect on biscuits compared with the BHA effect. Misan et al. [12] confirmed the antioxidant potential of extracts obtained from mint, parsley, caraway, buckthorn and their mixture named “Vitalplant” and that these substances can delay the lipid oxidation process. Gbenga-Fabusiwa [13] showed the positive effect of ginger on the oxidative stability of biscuits with pigeon pea–wheat composite flour blends. However, in addition to being a source of phenolic compounds, ginger has a very characteristic taste since it was also used as a flavoring agent. Vanilla extract also has similar properties—it both increases the stability of lipids and brings specific flavor, which was described by Anuradha et al. [14].
Similarly, fruit extract is a very good ingredient in confectionery products because of their desirable taste and the abundance of compounds with antioxidant activity. The antioxidant effect of various fruit extracts, ground fruit peels or pomace has been previously shown by others [15,16,17,18]. However, only Bialek et al. [16] investigated the oxidative stability of lipid fraction extracted from cookies in contrast to the research of others [15,17,18], where the aqueous or ethanolic extracts obtained from the confectionery products were studied. Moreover, as it was shown by Bialek et al. [16] the protective effect of fruit extract was highly dose-dependent. At high doses (0.025% and 0.1%) of chokeberry extract, the lipid oxidation was even more pronounced than in the control sample. The protective effect of fruit extracts was ascribed to high phenolic content (e.g., polyphenols including anthocyanin content) [15,16,17]. Ismail et al. [17] showed the positive effect of pomegranate peel extract and pomegranate peel bagasse on the oxidative stability of cookies. They also emphasized the importance of peel, the by-products of processing industry.
Despite the many studies on the antioxidant effects of various plant extracts, there are no studies based on standardized and commercially available fruit extracts that would be tested on final products and could be used in the production of various confectionery products such as wafers. Therefore, the aim of this study was to investigate the effect of adding commercial fruit extract Flavomix AX 200 on the oxidative stability of the lipid fraction extracted from wafer sheets, stored during 13 months at 18 °C. The novelty of this work is that the commercially available extract of natural origin was tested for the first time in the real production and storage conditions.

2. Materials and Methods

2.1. Chemicals

The chemical 1,1-diphenyl-2-picrylhydrazyl (DPPH) and Trolox were supplied from Sigma-Aldrich (Steinheim, Germany). Isooctane, n-hexane and ethyl acetate were obtained from POCh (Gliwice, Poland).

2.2. Preparation of Wafers

The material for this study consisted of two kinds of wafers, namely standard wafers (LWS) and wafers with added fruit extract (LWE). Both samples (LWS, LWE) were prepared according to the same recipe, while the fruit extract (Flavomix AX 200, Polypan Group, Moschato, Greece) was added to the LWE sample in an amount of 0.13% (w/w). Since the recipe and production technology is a secret of the Polypan Group company, the producer declare only that it is extract from citrus fruits. The wafers batter consisted of the following ingredients: water, wheat flour, salt, potato starch, sunflower lecithin and high oleic rapeseed oil (HORO). All ingredients were obtained from the Polish market. HORO content in wafer sheets was 2.2% w/w. Wafer sheets were obtained by baking in a wafer oven at a temperature of 170 °C ± 1 °C and for 2.5 min. Immediately after baking and cooling, the wafer sheets were wrapped in polypropylene foil and stored at 18 °C ± 2 °C for 13 months. All samples were stored in boxes in a dark place. The temperature in the storage room was 18 ± 2 °C, and relative humidity in the range 60–65%.

2.3. Fruit Extract Analysis

The antioxidant activity by the DPPH method [19] and total phenolic content (TPC) by Folin—Ciocalteu’s method [20] and total flavonoid content (TFC) by aluminum chloride meyjod [21] were examined in the fruit extract. Briefley, 0.1 mM DPPH in methanol was mixed with extract samples (0–10%) in ratio of 100:1 (v/v), respectively. After 30 min of incubation in dark at ambient temperature the absorbance readings were taken at 515 nm against methanol. Results were expressed as µmol Trolox equivalent (TE) per ml of fruit extract. TPC was measured as followed, 20 µL of fruit extract sample (2% in distilled water) was mixed with the 100 µL Folin-ciocalteu’s reagent. After 3 min of incubation, 300 µL sodium carbonate (20%) was added and the sample was filled up to 2 mL with distilled water. The mixture was incubated in dark for 2 h. The absorbance was read at 765 nm and the results were expressed as mg gallic acid equivalent (GAE) per ml of fruit extract. TFC was measured at 410 nm. Fruit extract sample (2%) was mixed with aluminum chloride (2% in methanol) at 1:10 ratio and after 15 min of incubation at dark the absorbance was read against methanol. Results were expressed as mg quercetin equivalent (QE) per ml of fruit extract.

2.4. Extraction of Lipid Fraction

The fraction of lipids was extracted from wafers by n-hexane. Initially, the wafer sheets were weighed (approximately 150 g) into a beaker of 1 L volume and crushed with a mortar. N-hexane was then added in an amount of approximately 300 g, i.e., in ratio of 1:2 (w/w). The sample was homogenized (Zauberstab 2011-8, Unold AG Hockenheim, Stwizerland), then heated to 30 °C and stirred continuously on stirrer (FC6S, Velp Scientifica Srl, Usmate Velate, Italy) at 112× g for 60 min. After this time, the sample was centrifuged (MPW Med. Instruments, Warsaw, Poland) for 15 min at 2382× g. The centrifuged supernatant was filtered (filtrate MN 640 W, Macherey-Negel, Dueren, Germany) and then n-hexane was evaporated by a rotary vacuum evaporator (The Rotavapor® R-300, BÜCHI Labortechnik AG, Flawil, Switzerland) under the following conditions: pressure 264 mbar, 30 rpm, bath temperature 50 °C, time 30 min. The fat obtained was poured into a test tube and residual n-hexane was removed by aerating with nitrogen (1 h). Lipid samples were closed and kept under nitrogen until analysis.

2.5. DSC Oxidative Stability Test

Oxidation induction time (OIT) was determined by the differential scanning calorimetry (DSC) following the ISO 11357-6 (ISO, 2018) [22]. Samples of lipid fraction were analyzed in a DSC 7 Perkin Elmer along with an Intracooler II, operated with Pyris software 10.1. The instrument was calibrated using indium (m.p. 156.6 °C, ΔHf = 28.45 J/g) and n-dodecane (m.p. −9.65 °C, ΔHf = 216.73 J/g), 99.99% pure nitrogen was used as the purge gas. Oil samples of approximately 6–7 mg were weighed into 50 µL open aluminum pans (Perkin Elmer, No. 02190041) and placed in the equipment’s sample chamber. The reference was the same open and empty aluminum pan. Isothermal protocol was followed to determine the oxidative stability characteristics of the oils at a constant temperature of 100 and 120 °C with an oxygen flow of 20 mL/min (purity 99.995%). Based on the oxidation curves obtained, parameters denoted as oxidation induction time (OIT) were determined after curve normalization as the intersection of the extrapolated baseline and the tangent line to the descending exotherm. Oils samples were analyzed in two replications for all DSC measurements.

2.6. DPPH Antioxidant Activity Determination in Lipid Fraction

The antioxidant activity of the samples was measured using a DPPH (2,2-diphenyl-1-pikrylhydrazyl) reagent [23,24]. Briefly, 0.04 mM DPPH in ethyl acetate was mixed with a one-hundred-times diluted sample (fat dissolved in ethyl acetate). After 1 h of incubation in the dark at ambient temperature, spectrophotometric measurements were performed on the Cary 1E spectrophotometer (Varian, Belrose, Australia) at a wavelength of 515 nm using ethyl acetate as a blank sample. The results were expressed in µmol TE (Trolox equivalent) per 100 g of fat. All samples were measured in triplicate.

2.7. Diene Content Determination (CDs)

The diene concentration was measured spectrophotometrically using the Ti1a-64 method (AOCS, 2003) [25] Fat (20 mg) was dissolved in isooctane (20 mL) and the absorbance of the sample was read at a wavelength of 233 nm against blank (pure isooctane). If the value of absorbance was above 1, the sample has been diluted accordingly to obtain absorbance reading in the range of 0.2–1.0 (because the lowest error of absorbance readings are in this range). CD was calculated according to Equation (1):
C D = 0.84 × a b × c K 0  
where a is the absorbance, b is the cuvette length (1 cm), c is the sample concentration in isooctane (g/L), and K0 represents the absorptivity by acid or ester groups (0.07 for esters, 0.03 for acids).

2.8. Statistical Analysis

All statistical tests were performed using Statistica 13.3 software (StatSoft, Tulsa, OK, USA). The level of significance was set at 5%. ANOVA with repeated measures was applied to estimate the effect of the variables (time and sample) on the parameters. The homogenous groups were shown using HSD Tukey’s test. The Pearson’s r coefficient for the linear correlation between parameters was calculated. To detect some pattern in the dataset general cluster analysis (CA) was applied (with Ward’s method as the agglomeration rule and Euclidean distance as a metric). Before calculation, the data was standardized. Regression analysis (linear or segmented regression) was performed to show the rate of parameter changes in time. For the segmented regression, the breakpoint was set at the 6th month. The determination coefficients for the regression were calculated (R2). All tests were performed in triplicate.

3. Results

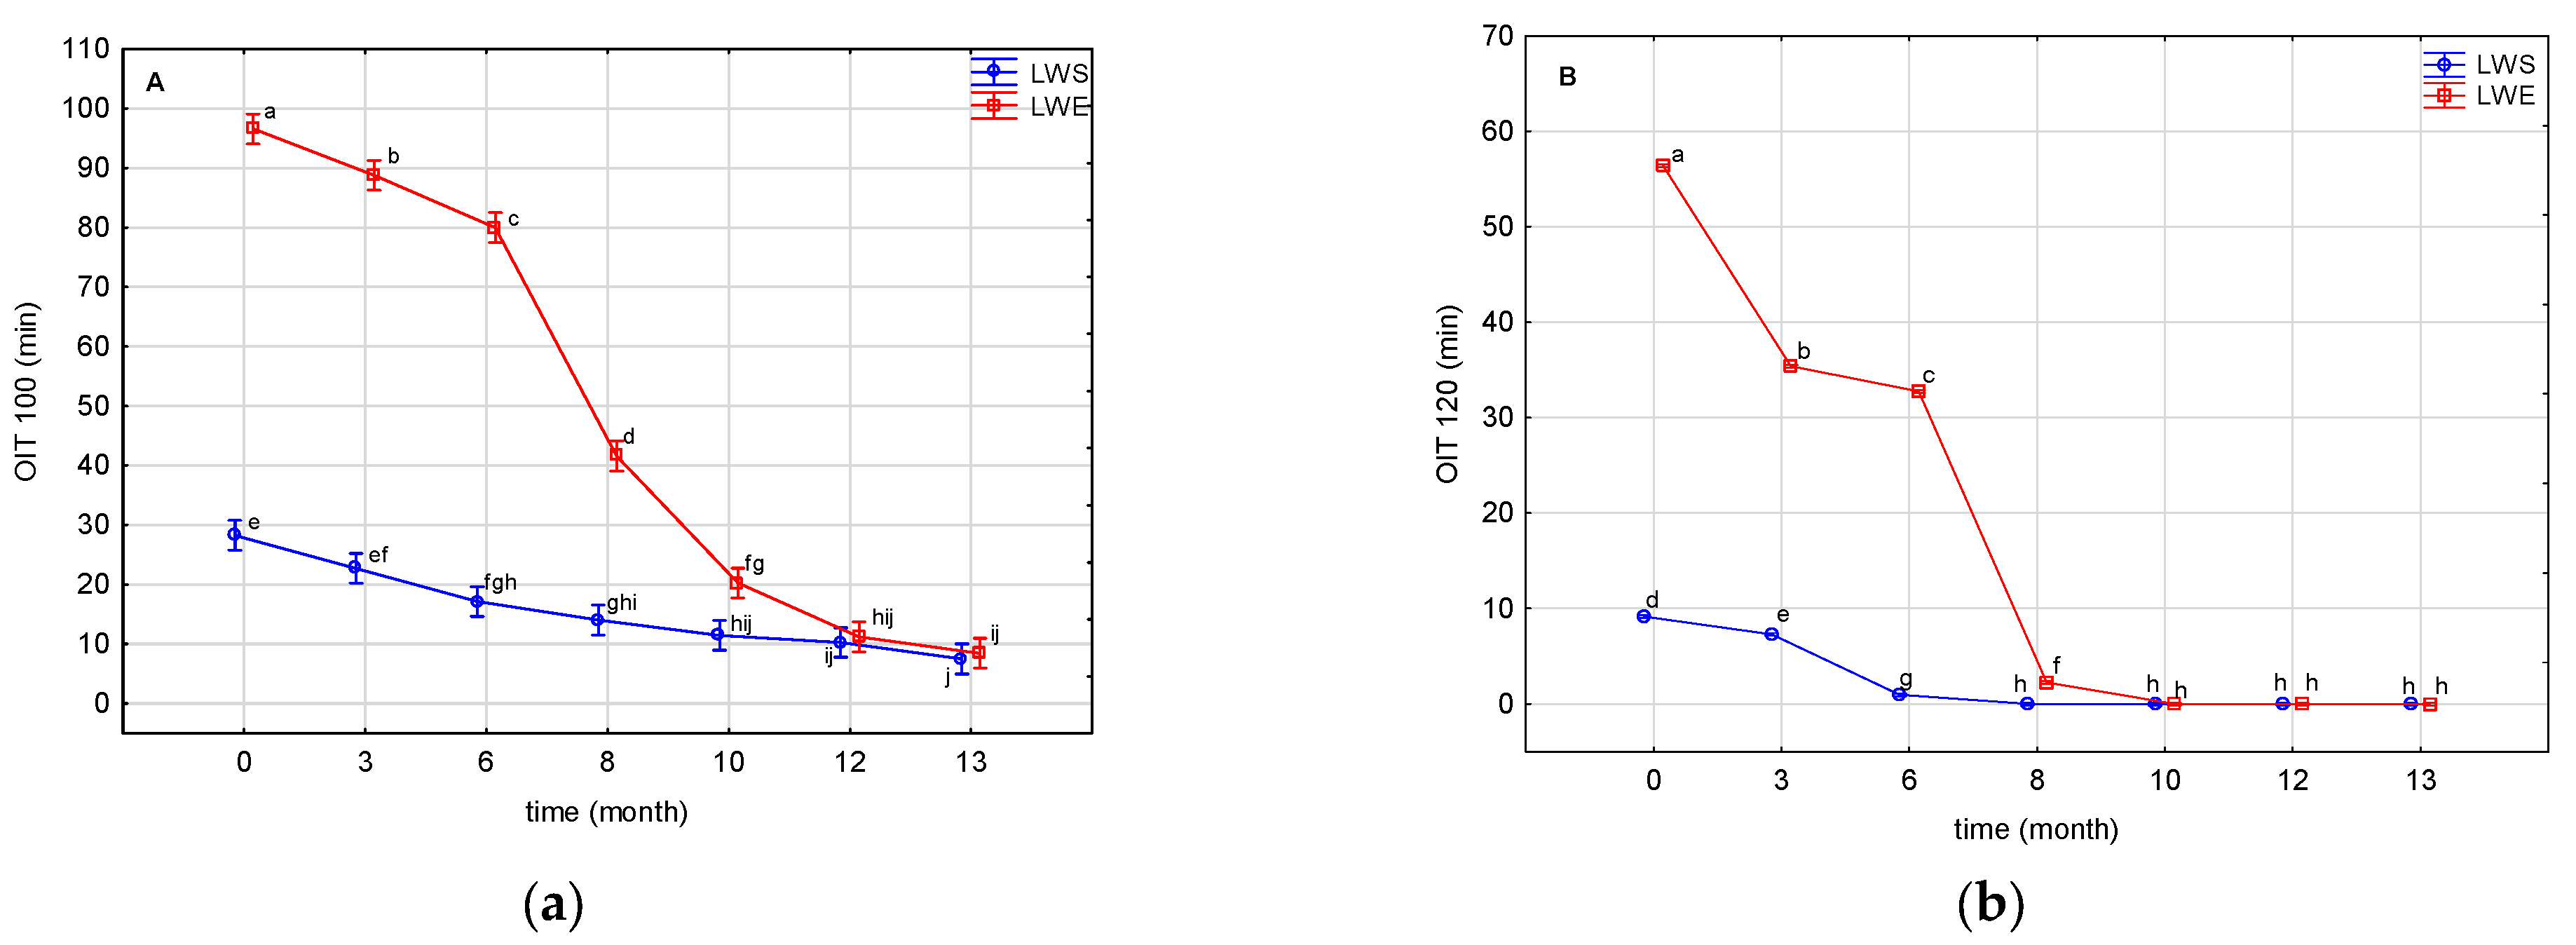
3.1. DSC Isothermal Oxidative Stability Test of Lipids Extracted from Wafers

Thermo-oxidative stability of lipids extracted from two types of wafers, namely standard wafers (LWS) and wafers with extract (LWE), was measured by means of the DSC technique using the isothermal mode. Oxidation induction time, measured isothermally at 100 °C (OIT100) and 120 °C (OIT120), expresses the starting point of the oxidation process, calculated from the oxidation curves as the intersection of the baseline with the tangent to the descending curve. Figure 1 shows the isothermal oxidation curves of the samples (LWS, LWE) measured at a temperature of 120 °C at the beginning of storage (0 month). Oxidation of lipids manifested during DSC analysis as a sharp exothermic descending curve. The decline of the curve is caused by the initiation of the oxidation process due to heat evolving during the reaction [26,27]. As can be seen in Figure 1, differences are visible between the DSC oxidation curve for the control sample (LWS) and the sample with extract (LWE). In the case of the LWE sample, the oxidation induction time is much longer (shifted to higher values) compared to the sample LWS, which indicates effective protection of the fruit extract against oxidation of the lipid fraction during thermal treatment. Figure 2 shows the results of OIT100 (a) and OIT120 (b), determined from the curves obtained during the whole storage period of 13 months. It can be seen that the higher the oxidation temperature, the faster the oxidation occurred. At the beginning of the storage period (0 month) the OIT values for the LWS sample were 28.3 min at 100 °C and 9.2 min at 120 °C, whereas for LWE they were 96.6 min (OIT100) and 56.4 min (OIT120). As a reference, the HORO oil as a raw material used for the production of wafers was also investigated and oxidation curve was presented in the supplementary material (Figure S1). The analysis was carried out in isothermal conditions at 120 °C. It can be seen that the fresh HORO oil was characterized by high thermal stability expressed by OIT120 value at 50.1 min (Figure S1), which was lower than for LWE sample (56.4 min).
In the case of both measurements (OIT100, OIT120), higher values of the OIT index were stated for sample LWE from the “0” time of storage until the 10th month for OIT 100 (Figure 2a) and until the 8th month for OIT120 (Figure 2b). ANOVA analysis revealed the significant effects of the time of storage and addition of the extract on the OIT values (p ≤ 0.05). OIT values decreased during storage, which indicates that the oxidation process was progressing over time. However, the addition of the fruit extract increased the oxidative stability of the lipids in the wafers. The OIT100 decreased from 96.6 min (0 month) through 20.27 min (10th month) to 8.5 min (13th month) for LWE, while for the LWS samples it changed from 28.3 min (0 month) through 11.5 min (10th month) to 7.5 min (13th month). A similar tendency was observed at 120 °C, as the OIT120 values of LWE were higher than the OIT values of LWS, but statistically significant differences between samples were observed during 8 months of storage (Figure 2b).
The OIT120 decreased from 56.4 min (0 month) through 2.3 min (8th month) to 0 min (13th month) for LWE and from 9.2 min (0 month) to 0 min (after the 8th month of storage) for LWS samples. It can be stated from Figure 2a,b that the fruit extract effectively enhanced the oxidative stability during 10 months of storage, and after this time there was no significant difference in the OIT values between the LWS and LWE samples (p > 0.05). Kozłowska et al. [5] and Żbikowska et al. [28] applied also the DSC technique to monitor the oxidative stability of cookies with green tea extracts. However it was not analyzed in isothermal mode but in the non-isothermal one with different heating rates, which means that the results were expressed as onset temperature, indicating the beginning of lipid oxidation. Thus, the higher the onset temperature, the more stable the sample was. As shown by Kozłowska et al. [5], the onset temperature decreased with storage time, but the decrease was lower in the samples with green tea extracts when compared to the control at the same heating rate. After 14 days of accelerated storage at 63 °C, the onset temperature of fat extracted from cookies with green tea extract (1%) was 168.8 °C, compared to 135.2 °C for the control sample. Kozłowska et al. [29] reported that adding thyme or rosemary extracts increased the oxidative stability of cookies during the 21 days of storage. The effect of the addition of green tea, blackcurrant seeds or nettle extract to oat flake cookies on the DSC thermo-oxidative stability was also tested [28]. It was found that the stability of samples tested after baking and containing the plant extracts was significantly improved in comparison with the sample without plant material. The highest tON values were observed for the samples containing 1% of green tea extract.

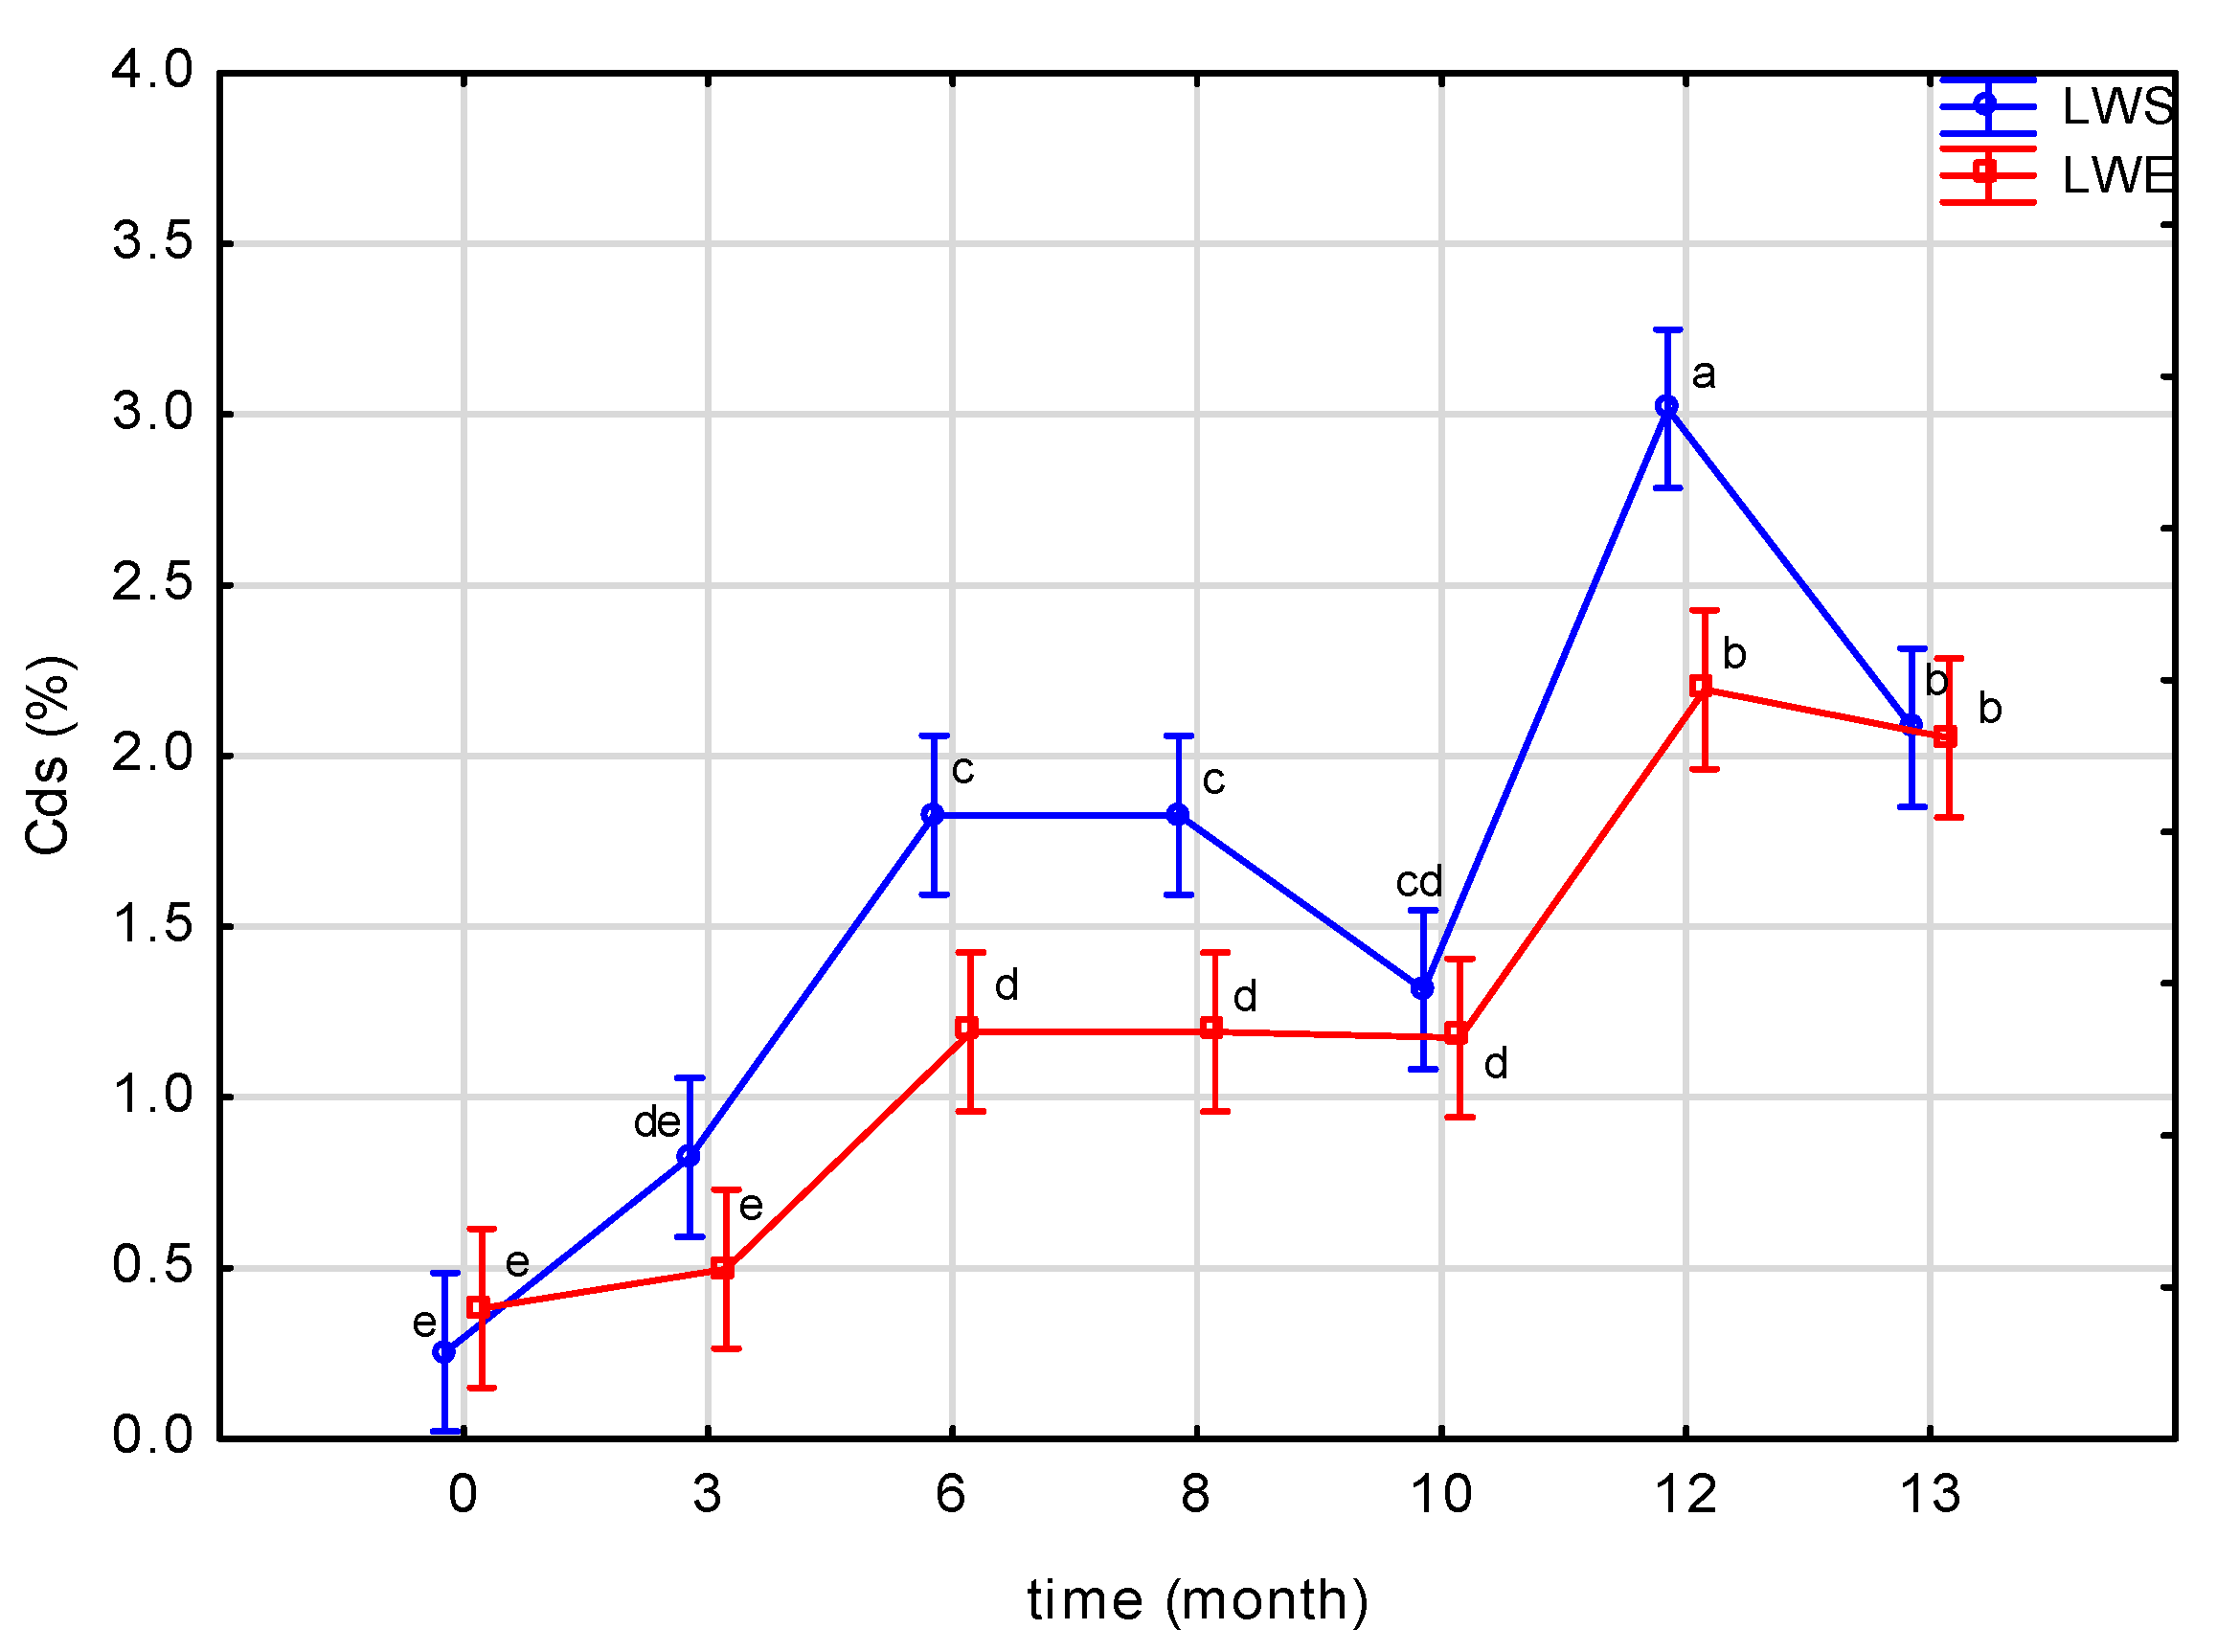
3.2. Conjugated Diene Content and DPPH Antioxidant Activity of Lipids Extracted from Wafers
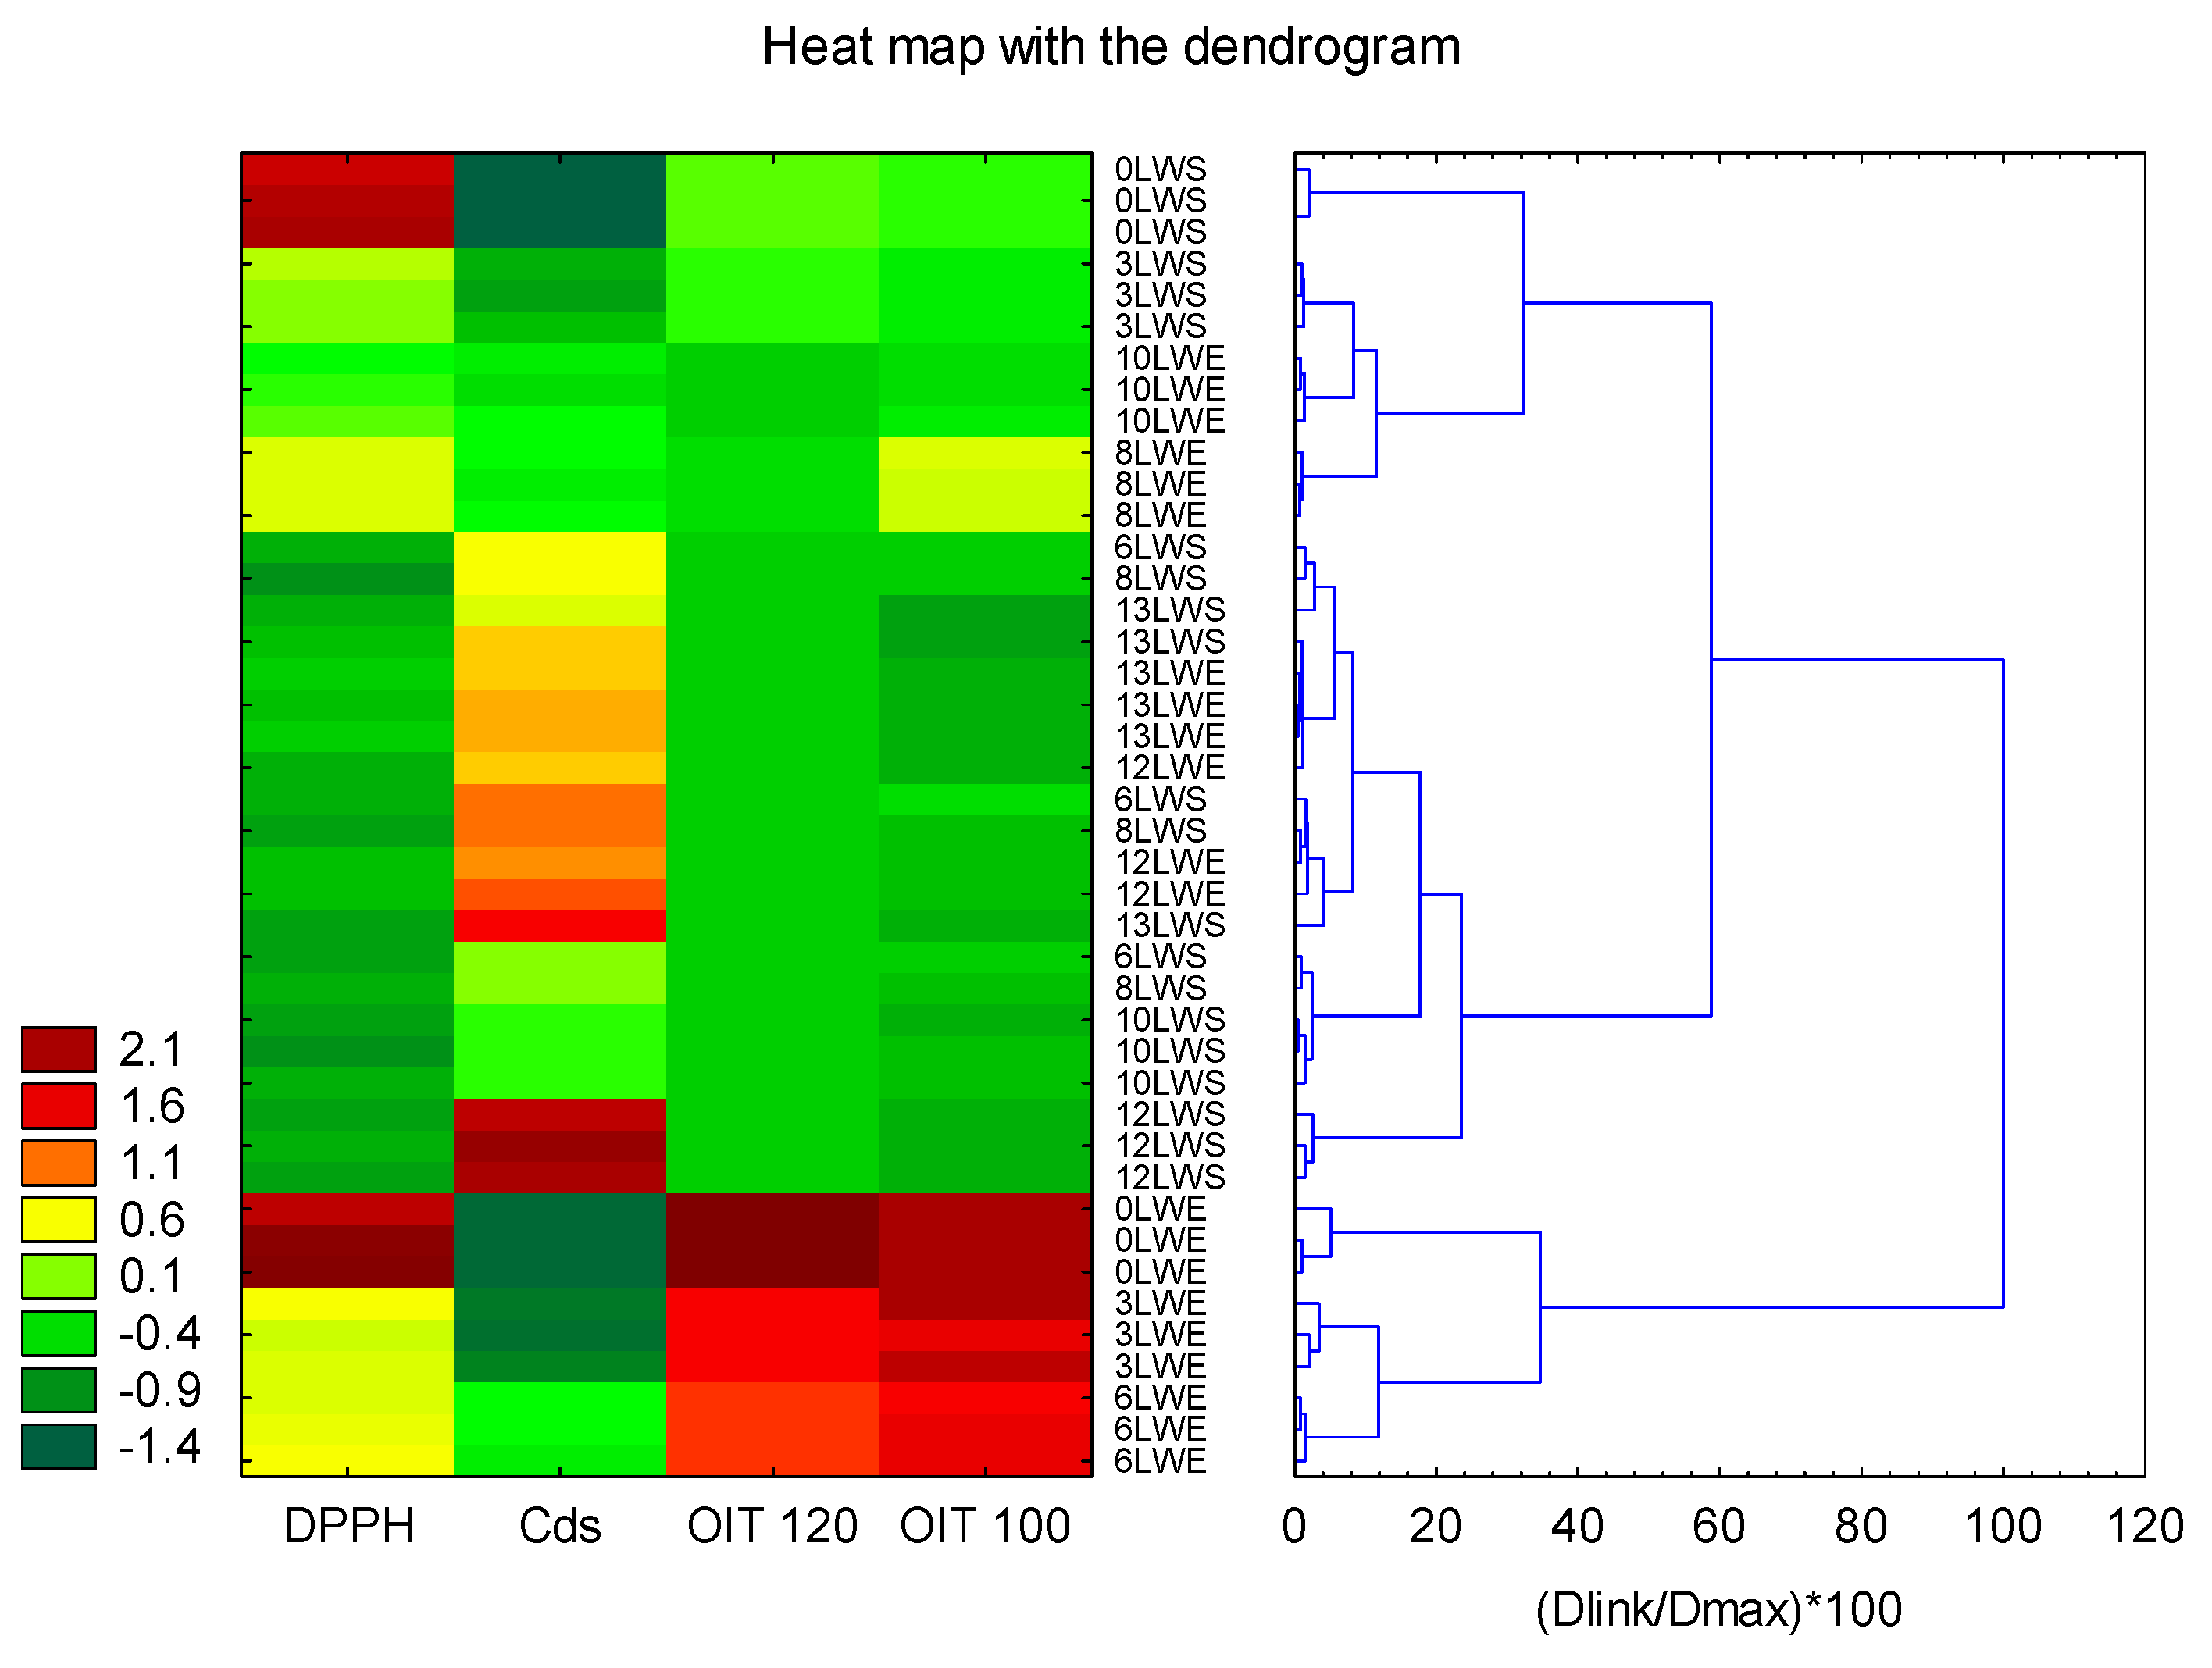
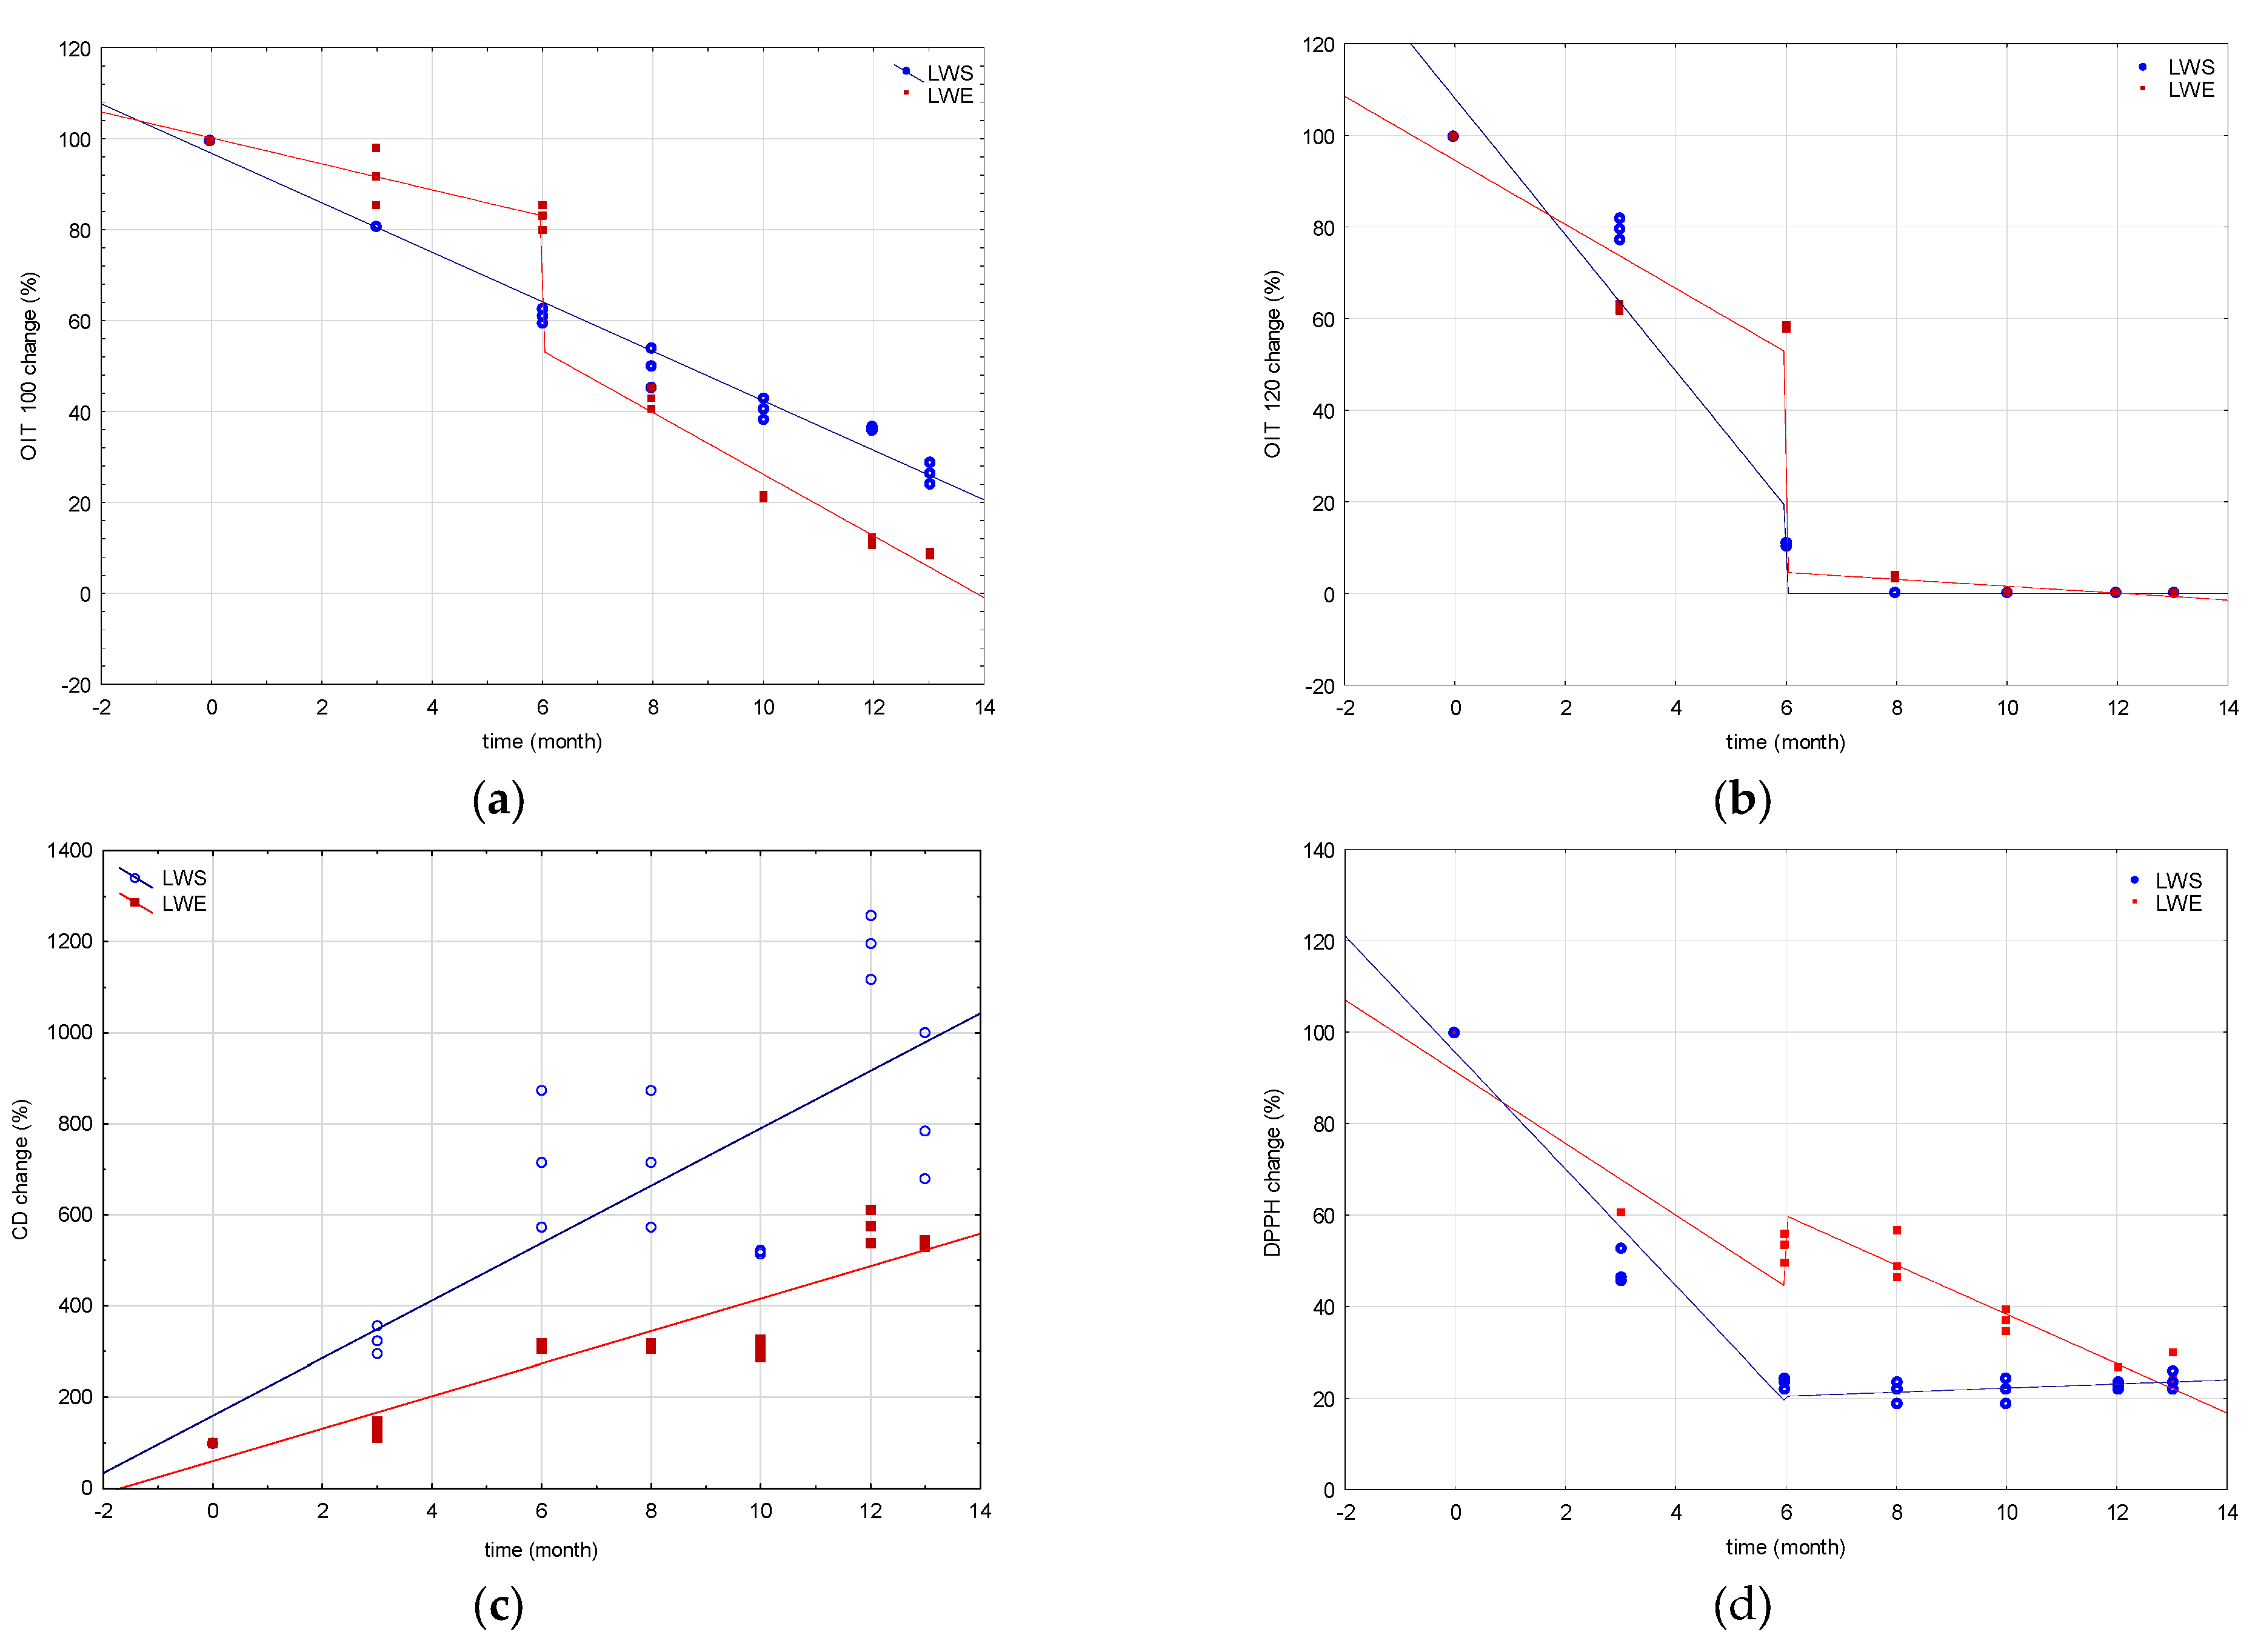
Lipid peroxidation is a very complex process leading to the formation of a wide variety of products. At the beginning of the process, hydroperoxides are formed from the polyunsaturated fatty acids. This process is accompanied by the rearrangement of double bonds in order to stabilize the radical state resulting in the formation of conjugated structures [6,30]. Therefore, dienes are also the primary lipid oxidation products and the content of these is a good indicator of progress in the oxidation process. The increase in conjugated compounds is proportional to the formation of hydroperoxides [31]. Figure 3 shows the results of determining conjugated dienes (CD) in samples (LWS, LWE) during 13 months of storage. Differences between the LWS and LWE samples in terms of CD concentration are clearly visible, as the concentration of CD was always higher in the LWS sample than the LWE up until the 12th month of storage, which indicates the protective effect of adding the extract.
The content of dienes increased from 0.25% to 2.08% for the LWS samples and from 0.38% to 2.05% for the LWE during the whole storage period. There were no significant differences (p > 0.05) between the LWS and LWE samples at the beginning of storage (0 month) and at the end of storage (13th month). At the beginning of the oxidation process, i.e., in the initiation stage, a lag phase is normally observed. During that period, accumulation of lipid oxidation products is slow. This is mainly due to the slow formation of free radicals prior to hydroperoxides accumulation and that the free radicals preferentially oxidize the antioxidants present in products, which protects lipids at the earliest stages of oxidation [31]. Thus, on the 0 month of storage the CD concentration is similar in LWS and LWE samples. When the oxidation process has proceeded the content of conjugated structure increases in the sample without antioxidant treatment (LWS) in comparison to sample with antioxidant (LWE). Starting from the 3rd month of storage, LWS showed 1.5-times higher CDs (0.82%) than LWE samples (0.49%) A similar trend between both samples was observed until the 12th month. However, similarly to the peroxide value measurement, CD content is only effective at the beginning of the oxidation process. At low oxidation stages hydroperoxides undergo low decomposition but at the end of the process other products of lipid oxidation were formed thus the level of CD decreased [31]. Thus, on the 13 moth of storage the level of CD decreased in both samples (LWE and LWS) and no significant differences are observed.
Summing up, it can be stated that the most pronounced changes of CD content took place during first six months of storage. The CD content doubled in the control wafers between 0 and 3rd month and between 3rd and 6th month of storage. The trend was similar to results noted by Daglioglu et al. [3] where the oxidation of lipid fraction of wafers expressed as peroxide value doubled during the first three months of storage from 1.2 to 2.5 meq O2/kg [3]. The dienes and trienes content in stored cookies was also investigated by Żbikowska et al. [28]. They stated very small changes in fat extracted from stored cookies containing green tea extract, for which the lowest content of both dienes and trienes was detected after 3 months; 2.35 and 0.37, respectively.
However, the question may arise as to whether the extract added to the LWE sample protects the lipids against formation of conjugated dienes. Therefore, the antioxidant activity of both samples (LWS, LWE) was also compared by using the DPPH radical scavenging method. In Figure 4, the results of the DPPH assay are presented.
Significant effects of storage time and extract addition on the DPPH values were observed. The antioxidant activity of both samples (LWS, LWE) decreased with the wafers’ storage time, although the decrease was more pronounced in the LWS samples than in the LWE. The addition of the fruit extract improved the stability of the lipid fraction in the LWE sample because of the active antioxidant compounds contained in the extract. According to the information from producer of the extract, it is composed of maltodextrin and citrus fruit extract. In this study, TPC and TFC of the fruit extract was also tested. TPC equals to 8.84 ± 0.42 mg GAE/mL, whereas TFC is 0.823 ± 0.038 mg QE/mL. High content of phenolic compounds resulted in high antioxidant activity of the fruit extract measured by the DPPH radical scavenging assay which is 13.68 ± 0.18 µmol TE/mL.
Analyzing the changes of the DPPH value during storage of wafers, at the beginning the antioxidant activity of LWE was 97.4 µmol TE/100 g whereas for LWS it was 87.7 µmol TE/100 g. Then a significant decrease in DPPH values was observed, and in the 3rd month, the DPPH values were comparable, i.e., 48.7 and 42.4 µmol TE/100 g for the LWE and LWS samples, respectively. After the 3rd month, the DPPH values of the LWS samples decreased, reaching a value of 20.6 in the 6th month and then the antioxidant activity was at a constant level until the end of storage. In turn, for the LWE sample, the addition of extract increased the antioxidant activity in comparison to LWS sample, and after the 3rd month of storage the DPPH values were stable until the 8th month (48.7–51. 3 µmol TE/100 g). After the 8th month, the antioxidant activity of LWE decreased with time, reaching a DPPH value of 22.7 µmol TE/100 g in the 12th month of storage, which was not significantly different from the LWS sample at the same storage period (p > 0.05) Similarly, after 13 months of storage differences between DPPH value for LWS and LWE were not significant.
Bhat et al. [10] showed that the DPPH radical scavenging activity of cookies with the addition of saffron extracts decreased during storage. This decrease was lower when comparing to control. Moreover, during the first three month of storage not significant changes were observed in DPPH values for saffron-treated cookies. That indicated the protective effect of saffron was the most pronounced during the first 3 months. In our study the decrease of DPPH values of the sample with fruit extract was the highest at the beginning of storage (0–3 months) and after that time the values stabilized until the 8th month. All herb extracts, investigated by Misan et al. [12], also showed significant differences in their ability to reduce the initial concentration of DPPH, which was expressed as the IC50 value, defined as the mass concentration of an antioxidant extract that was required to quench 50% of the initial DPPH under the given experimental conditions. Szymanowska et al. [15] also investigated the effect of raspberry pomace addition to wafers on the DPPH antioxidant activity. They stated that the ability of the ethanol extracts to neutralize the DPPH radical increased with the increasing concentration of freeze-dried raspberry pomace. Szymanowska et al. [27] reported that the DPPH radical scavenging activity of the ethanolic extracts of wafers with the raspberry extract was up to 10 times higher than the control sample and varied in the broad range from 61.89 µmol/100 g d.w. to 157.44 µmol/100 g d.w. They suggested that it was the effect of higher total phenolic compound content (TPC), which was from 183.68 to 75.99 mg/100 g d.w., than in control sample (80.62 mg/100 g d.w.). Ismail et al. [13] found that supplementation of cookies with 1.0% pomegranate peel extract increased DPPH value from 22.14 to 64.83 mmol/100 g. The studies on the effect of various content of orange peel in biscuits on the effective concentration (EC50) (the concentration at which sample is effective to exhibit 50% of antioxidants in the reaction) was tested by [18]. Determination of EC50 value of DPPH free radical scavenging ability revealed that the sample with the highest substitution (20%) of orange peel had the lowest EC50 while the control sample had the highest EC50 as the lowest EC50 value indicates the highest antioxidants properties.
In order to find a relationship between the parameters measured, a correlation analysis was conducted. Table 1 shows the correlation coefficients between all the parameters tested, and as can be seen, all correlation coefficients were statistically significant, since all the p values calculated for the correlations were below 0.05.
A Pearson’s coefficient equal to −0.60 was obtained for the correlation between OIT120 and CDs and −0.64 for the correlation between OIT100 and CDs. A negative correlation indicated that the higher the content of conjugated dienes, the lower the OIT100 and OIT120 values and the lower the oxidative stability of the lipid fraction extracted from the wafers. Correlation analysis between the antioxidant activity (DPPH) and OIT parameters revealed that for the DSC parameters measured (OIT100 and OIT120), high positive correlation coefficients were obtained (0.70 and 0.73, respectively), which means the greater the antioxidant activity, the higher the OIT parameters and the higher the lipids oxidative stability.

4. Discussion

The decrease in the OIT index (OIT100, OIT120) and DPPH value, as well as the increase in the CD concentration in samples LWS and LWE, is proof that the oxidation of lipids has occurred while the wafers were being stored. However, in the case of the LWE samples, the process was slowed down by the fruit extract addition.
To gain more insight into the data obtained, the cluster analysis (CA) and regression analysis were performed. The CA was applied to group samples as the unsupervised pattern recognition technique of multivariate analysis on the basis of similarities in clusters. The Ward method and Euclidean distance between centroids were applied. All data was standardized before analysis. The CA dendrogram enabled three distinct clusters at the Distance of Dlink/Dmax = 58% to be determined (Figure 5). Additionally, a heat map was obtained to show the levels of all parameters in the samples (Figure 5).
The first cluster includes the LWE samples stored during the first 6 months: 0LWE, 3LWE, 6LWE (0, 3, 6 months of storage, respectively). Those samples showed the highest OIT and DPPH values and the lowest CD concentration (based on the heat map). The second cluster includes LWS samples stored during the first 3 months (0LWS, 3LWS) and LWE samples after 8 months (8LWE) and 10 months (10LWE) of storage. All other samples were stacked in the third cluster and were characterized by low OIT and DPPH values and high CDs content (as seen from the heat map).
Regression analysis was also applied to show the rate of changes of the parameters measured, as shown in Figure 6a–d.
When showing the data as %, it enables comparison of the results between various parameters. For the OIT (OIT100 and OIT120) and DPPH values, segmented regression (piecewise regression) was applied. The breakpoint was set at 6 months. The regression coefficients are shown in Table 2.
As can be seen from the figures (Figure 6a–d) and Table 2, the rate of changes is significantly higher in standard (LWS) samples than samples treated with extract (LWE) during the first 6 months of storage for the OIT (Figure 6a,b) and DPPH (Figure 6d) parameters or during the whole storage period for CD parameter (Figure 6c). Predicting changes in OIT after the first month of storage based on the equations in Table 2, it can be noticed the OIT100 value of LWS sample will decrease by 5.44% and OIT120 by 14.86%, whereas for LWE this decrease will be only by 2.86% (OIT100) and 6.99% (OIT120). At the same time, the CDs will increase two times faster in the LWS sample than the LWE. Moreover, the antioxidant activity changes in the sample with the extract will decrease by 7.85% during one month when compared to the standard sample (LWS) with a decrease of 11.32%. This indicates that the addition of fruit extracts to wafers increased the oxidative stability of the product. The protective effect of the extract is the most evident during the first six months of storage.
Many researchers reported the positive effect of a wide spectrum of plants and their extracts added to the confectionary products including fruit extracts on the oxidative stability of fats [15,16,17,18]. Obafaye and Omoba [18] tested the addition of orange peel flour to cookies and confirmed the increase in their antioxidant properties. A similar observation was performed by Ismail et al. [17], after the addition of pomegranate extract to cookies. Szymanowska et al. [15] revealed that the ethanol extract from the wafers with the highest addition of the raspberry extract scavenged the DPPH radical almost ten times more effectively than the control extract. However, all those authors did not investigate the antioxidant activity of the lipid fraction of the confectionary product, which is how it was performed in presented study.
The decrease in the oxidative stability of confectionary products with time [3,10,16] and the protective effect of plant extracts on the lipid fraction has been previously described by other researchers [5,29,32]. However, there are no studies on the oxidative stability of wafers treated with commercially available natural extracts. In the food industry, only ingredients of a repeatable quality could be used to ensure food safety to consumers. Since this extract is of natural origin it can be easily accepted by the consumers and their demands for a “clean label” can be met. Moreover, in contrast to the previous studies carried out at the laboratory scale, in the presented study, wafers were produced in the factory (macro-scale production), which makes these results more valuable for consumers and also producers since they suit to the real production and storage conditions. The oxidation process of confectionary products is of special interest, since the products are treated with high temperature, often contain a high fat content and their storage time is relatively long (12 months for wafers). As it was indicated by Daglioglu et al. [3] the oxidative stability of the wafers decreased during the 12-month storage period and the oxidation process was the most pronounced during the first 3 months. Others [16] showed that the highest peroxide values of cookies with chokeberry extract were obtained after 9 weeks of storage and thereafter decreased. Moreover, there was no protective effect when comparing the treated-samples (with 0.025% and 0.1% of the extract) to control. Similar observations were made in the presented study, that the tested fruit extract was not able to protect lipids for the entire storage period, i.e., 13 months. However, the period of antioxidant activity of extract was relatively long compared to previous studies, i.e., 10 months.

5. Conclusions

The aim of the study was to investigate the effect of adding fruit extract on the oxidative stability of wafers stored for 13 months. For both samples (LWS, LWE), the OIT values and the antioxidant activity decreased, whereas the diene concentration increased with time, indicating the progress of the oxidation process during the storage of wafers. However, the oxidative changes were delayed in the sample with fruit extracts (LWE), proving its antioxidant activity. The protective effect of the extract was most effective during the first six months of storage, since the oxidative changes were two times lower in sample with extract than in control. However, it was not possible to maintain the antioxidative protection of lipids in wafers until the end of storage (13 months), since after 10 months all parameters did not differ significantly for both samples (p > 0.05). All in all, in the presented study it was proved at the production scale that the commercial extract can be used for the production of confectionery products, since it was characterized by high stability and effectiveness in delaying oxidation processes during 10 months of storage. The advantage of this extract is that it meets the EU regulations for the use in food and complies with customers’ “clean label” demands, which makes the product more valuable on the market. However some limitations of its use should be highlighted here, such as the risk of its opposite action, which means that it may exhibit prooxidant activity, when added in too high a quantity. Therefore, optimization tests are necessary to adjust the optimal concentration of the extract in the product. Another limitation of the use of the extract is the change in the color of the product, especially when larger amounts of extract are added.

Supplementary Materials

The following supporting information can be downloaded at: https://www.mdpi.com/article/10.3390/app13010103/s1, Figure S1: Differential scanning calorimetry (DSC) oxidation induction time (OIT) curve measured for fresh HORO sample at 120 °C temperature.

Author Contributions

Conceptualization, L.B., M.M.-P. and J.T.-G.; methodology, L.B., M.M.-P. and J.T.-G.; formal analysis, L.B., M.M.-P., M.I. and J.T.-G.; investigation, L.B., M.M.-P., M.I. and J.T.-G.; resources, L.B. and J.T.-G.; data curation, L.B., M.M.-P. and J.T.-G.; writing—original draft preparation, L.B., M.M.-P. and J.T.-G.; writing—review and editing, M.M.-P. and J.T.-G.; visualization, L.B., M.M.-P. and J.T.-G.; supervision, M.M.-P. and J.T.-G.; project administration, J.T.-G.; funding acquisition, L.B. and J.T.-G. All authors have read and agreed to the published version of the manuscript.

Funding

This research was funded by Ministry of Education and Science, grant number DWD/3/35/2019.

Institutional Review Board Statement

Not applicable.

Informed Consent Statement

Not applicable.

Data Availability Statement

Not applicable.

Conflicts of Interest

The authors declare no conflict of interest.

References

  1. World Wafer Market. Available online: https://magazinebbm.com/blog/world-wafer-market-1626 (accessed on 2 September 2022).
  2. Verma, A. Process Engineering Analysis of Confectionery Wafer Manufacture; School of Chemical Engineering and Analytical Science: Manchester, UK, 2019. [Google Scholar]
  3. Daglioglu, O.; Tasan, M.; Gecgel, U.; Daglioglu, F. Changes in oxidative stability of selected bakery products during shelf life. Food Sci. Technol. Res. 2004, 10, 464–468. [Google Scholar] [CrossRef] [Green Version]
  4. Maire, M.; Rega, B.; Cuvelier, M.E.; Soto, P.; Giampaoli, P. Lipid oxidation in baked products: Impact of formula and process on the generation of volatile compounds. Food Chem. 2013, 141, 3510–3518. [Google Scholar] [CrossRef]
  5. Kozłowska, M.; Żbikowska, A.; Szpicer, A.; Półtorak, A. Oxidative stability of lipid fractions of sponge-fat cakes after green tea extracts application. J. Food Sci. Technol. 2019, 56, 2628–2638. [Google Scholar] [CrossRef] [PubMed] [Green Version]
  6. Xia, W.; Budge, S.M. Techniques for the Analysis of Minor Lipid Oxidation Products Derived from Triacylglycerols: Epoxides, Alcohols, and Ketones. Compr. Rev. Food Sci. Food Saf. 2017, 16, 735–758. [Google Scholar] [CrossRef] [PubMed] [Green Version]
  7. Barlow, S.M. Toxicological Aspects of Antioxidants Used as Food Additives. In Food Antioxidants; Springer: Dordrecht, The Netherlands, 1990; pp. 253–307. [Google Scholar]
  8. Gramza-Michałowska, A.; Kobus-Cisowska, J.; Kmiecik, D.; Korczak, J.; Helak, B.; Dziedzic, K.; Górecka, D. Antioxidative potential, nutritional value and sensory profiles of confectionery fortified with green and yellow tea leaves (Camellia sinensis). Food Chem. 2016, 211, 448–454. [Google Scholar] [CrossRef]
  9. Mildner-Szkudlarz, S.; Zawirska-Wojtasiak, R.; Obuchowski, W.; Gośliński, M. Evaluation of antioxidant activity of green tea extract and its effect on the biscuits lipid fraction oxidative stability. J. Food Sci. 2009, 74, S362–S370. [Google Scholar] [CrossRef]
  10. Bhat, N.A.; Hamdani, A.M.; Masoodi, F.A. Development of functional cookies using saffron extract. J. Food Sci. Technol. 2018, 55, 4918–4927. [Google Scholar] [CrossRef]
  11. Reddy, V.; Urooj, A.; Kumar, A. Evaluation of antioxidant activity of some plant extracts and their application in biscuits. Food Chem. 2005, 90, 317–321. [Google Scholar] [CrossRef] [Green Version]
  12. Mišan, A.; Mimica-Dukić, N.; Sakač, M.; Mandić, A.; Sedej, I.; Šimurina, O.; Tumbas, V. Antioxidant Activity of Medicinal Plant Extracts in Cookies. J. Food Sci. 2011, 76, C1239–C1244. [Google Scholar] [CrossRef]
  13. Gbenga-Fabusiwa, F.J.; Oladele, E.P.; Oboh, G.; Adefegha, S.A.; Oshodi, A.A. Polyphenol contents and antioxidants activities of biscuits produced from ginger-enriched pigeon pea–wheat composite flour blends. J. Food Biochem. 2018, 42, e12526. [Google Scholar] [CrossRef]
  14. Anuradha, K.; Naidu, M.M.; Manohar, R.S.; Indiramma, A.R. Effect of vanilla extract on radical scavenging activity in biscuits. Flavour Fragr. J. 2010, 25, 488–492. [Google Scholar] [CrossRef]
  15. Szymanowska, U.; Karaś, M.; Bochnak-Niedźwiecka, J. Antioxidant and anti-inflammatory potential and consumer acceptance of wafers enriched with Freeze-Dried Raspberry Pomace. Appl. Sci. 2021, 11, 6807. [Google Scholar] [CrossRef]
  16. Bialek, M.; Rutkowska, J.; Bialek, A.; Adamska, A. Oxidative Stability of Lipid Fraction of Cookies Enriched with Chokeberry Polyphenols Extract. Pol. J. Food Nutr. Sci. 2016, 66, 77–84. [Google Scholar] [CrossRef] [Green Version]
  17. Ismail, T.; Akhtar, S.; Riaz, M.; Hameed, A.; Afzal, K.; Sheikh, A.S. Oxidative and Microbial Stability of Pomegranate Peel Extracts and Bagasse Supplemented Cookies. J. Food Qual. 2016, 39, 658–668. [Google Scholar] [CrossRef]
  18. Obafaye, R.O.; Omoba, O.S. Orange peel flour: A potential source of antioxidant and dietary fiber in pearl-millet biscuit. J. Food Biochem. 2018, 42, e12523. [Google Scholar] [CrossRef]
  19. Sánchez-Moreno, C.; Larrauri, J.A.; Saura-calixto, F. A procedure to measure the antiradical efficienc y of polyphenols. J. Sci. Food Agric. 1998, 270, 270–276. [Google Scholar] [CrossRef]
  20. Singleton, V.L.; Rossi, J.A. Colorimetry of Total Phenolics with Phosphomolybdic-Phosphotungstic Acid Reagents. Am. J. Enol. Vitic. 1965, 16, 144–158. [Google Scholar]
  21. Meda, A.; Lamien, C.E.; Romito, M.; Millogo, J.; Nacoulma, O.G. Determination of the total phenolic, flavonoid and proline contents in Burkina Fasan honey, as well as their radical scavenging activity. Food Chem. 2005, 91, 571–577. [Google Scholar] [CrossRef]
  22. ISO 11357-6; Plastics—Differential Scanning Calorimetry (DSC). European Committee for Standardization: Geneva, Switzerland, 2018.
  23. Espin, J.C.; Soler-Rivas, C.; Wichers, H.J. Characterization of the total free radical scavenger capacity of vegetable oils and oil fractions using 2,2-diphenyl-1-picrylhydrazyl radical Characterization of the Total Free Radical Scavenger Capacity of 2,2-Diphenyl-1-picrylhydrazyl Radical. J. Agric. Food Chem. 2000, 48, 648–656. [Google Scholar] [CrossRef]
  24. Tuberoso, C.I.G.; Kowalczyk, A.; Sarritzu, E.; Cabras, P. Determination of antioxidant compounds and antioxidant activity in commercial oilseeds for food use. Food Chem. 2007, 103, 1494–1501. [Google Scholar] [CrossRef]
  25. AOCS Spectrophotometric Determination of Conjugated Dienoic Acid. In Official Methods and Recommended Practices of the American Oil Chemists’; AOCS Press: Champaign, IL, USA, 2003; pp. 1–2.
  26. Tomaszewska-Gras, J.; Islam, M.; Grzeca, L.; Kaczmarek, A.; Fornal, E. Comprehensive Thermal Characteristics of Different Cultivars of flaxseed oil (Linum usittatissimum L.). Molecules 2021, 26, 1958. [Google Scholar] [CrossRef]
  27. Islam, M.; Muzolf-Panek, M.; Fornal, E.; Tomaszewska-Gras, J. DSC isothermal and non-isothermal assessment of thermo-oxidative stability of different cultivars of Camelina sativa L. seed oils. J. Therm. Anal. Calorim. 2022, 147, 10013–10026. [Google Scholar] [CrossRef]
  28. Zbikowska, A.; Kozlowska, M.; Poltorak, A.; Kowalska, M.; Rutkowska, J.; Zbikowska, A. Effect of addition of plant extracts on the durability and sensory properties of oat flake cookies. J. Therm. Anal. Calorim. 2018, 134, 1101–1111. [Google Scholar] [CrossRef] [Green Version]
  29. Kozłowska, M.; Żbikowska, A.; Gruczyńska, E.; Żontała, K.; Półtorak, A. Effects of spice extracts on lipid fraction oxidative stability of cookies investigated by DSC. J. Therm. Anal. Calorim. 2014, 118, 1697–1705. [Google Scholar] [CrossRef]
  30. Barriuso, B.; Astiasarán, I.; Ansorena, D. A review of analytical methods measuring lipid oxidation status in foods: A challenging task. Eur. Food Res. Technol. 2013, 236, 1–15. [Google Scholar] [CrossRef]
  31. Domínguez, R.; Pateiro, M.; Gagaoua, M.; Barba, F.J.; Zhang, W.; Lorenzo, J.M. A comprehensive review on lipid oxidation in meat and meat products. Antioxidants 2019, 8, 429. [Google Scholar] [CrossRef] [Green Version]
  32. Żbikowska, A.; Kowalska, M.; Rutkowska, J.; Kozłowska, M.; Onacik-Gür, S. Impact of green tea extract addition on oxidative changes in the lipid fraction of pastry products. Acta Sci. Pol. Technol. Aliment. 2017, 16, 25–35. [Google Scholar] [CrossRef] [PubMed]
Figure 1. Differential scanning calorimetry (DSC) oxidation induction time (OIT) curves measured for fresh LWS and LWE samples at 120 °C temperature.
Applsci 13 00103 g001
Figure 2. DSC OIT results for lipids extracted from the standard wafers (LWS) and wafers with extract (LWE) during 13 months of storage. (a) DSC OIT index measured at 100 °C (b) DSC OIT index measured at 120 °C. Vertical bars indicate 0.95 confidence intervals, the same letters indicate lack of significant differences between data (α = 0.05).
Applsci 13 00103 g002
Figure 3. Conjugated diene concentration (CD) of standard wafers (LWS) and wafers with extract (LWE) during 13 months of storage. Vertical bars indicate 0.95 confidence intervals, the same letters indicate a lack of significant differences between data (α = 0.05).
Applsci 13 00103 g003
Figure 4. The antioxidant activity of the samples: standard wafers (LWS) and wafers with extract (LWE), measured as DPPH radical scavenging during 13 months of storage. Vertical bars indicate 0.95 confidence intervals, and the same letters indicate a lack of significant differences between data (α = 0.05).
Applsci 13 00103 g004
Figure 5. Heat map with the dendrogram of LWS (standard wafers) and LWE (wafers with fruit extract) samples classified using cluster analysis of similarities. Note: DPPH—antioxidant activity; CD—diene concentration; OIT—oxidation induction time 100 °C or 120 °C. Data was standardized.
Applsci 13 00103 g005
Figure 6. Changes (in %) of (a) DSC OIT index measured at 100 °C, (b) DSC OIT index measured at 120 °C, (c) diene concentration (CD) and (d) the antioxidant activity (DPPH) in time.
Applsci 13 00103 g006
Table 1. Pearson’s r coefficients calculated for the correlation between the antioxidant activity (DPPH), diene concentration (CDs) and oxidation induction time (OIT) of the wafer samples.
ParameterDPPHCDsOIT120OIT100
DPPH1−0.78 *0.73 *0.70 *
CDs 1−0.60 *−0.64 *
OIT 120 10.95 *
OIT 100 1
* Significant correlations at α = 0.05.
Table 2. Regression coefficients (β) calculated for changes of the parameters (OIT100, OIT120, CD and DPPH) in time.
ParameterLWSLWE
βR2βR2
OIT 100−5.44 (≤13)0.98−2.86 (≤6)
−6.78 (>6)
0.98
0.96
OIT 120−14.86 (≤6)
0 * (>6)
0.91
1
−6.99 (≤6)
−0.75 * (>6)
0.85
1
CDs63.03 (≤13)0.6735.57 (≤13)0.87
DPPH−11.32 (≤6)
−5.37 (>6)
0.96
0.85
−7.85 (≤6)
2.02 * (>6)
0.68
0.98
* Non-significant coefficient at α = 0.05.
Disclaimer/Publisher’s Note: The statements, opinions and data contained in all publications are solely those of the individual author(s) and contributor(s) and not of MDPI and/or the editor(s). MDPI and/or the editor(s) disclaim responsibility for any injury to people or property resulting from any ideas, methods, instructions or products referred to in the content.

