Abstract
As a typical pollutant, methylene blue poses a serious threat to the environment and human health. Oily sludge pyrolysis residue loaded with metal oxides could be used to prepare composite materials, which is not only an effective way to treat oily sludge, but also a possible method to treat methylene blue pollutants. In this paper, composite materials (AC-CuO, AC-ZnO, and AC-TiO2) were prepared by oily sludge pyrolysis residue-loaded CuO, ZnO, and TiO2 directly, and characterized by XRD, SEM, EDS, BET, FT-IR, and XPS, and it was shown that the metal oxides were successfully supported on the pyrolysis residue. Then, the composite materials were applied to the removal of methylene blue solution. The removal effect of composite materials on methylene blue with respect to the impregnation time, impregnation ratio and dosage, and the contact time and number of regenerations were investigated, and the removal parameters were optimized by response surface methodology. The removal process for methylene blue was described by applying Lagergren, McKay, Langmuir isotherm, Freundlish isotherm and intraparticle diffusion models. According to the response surface methodology and the main factors affecting the removal effect of methylene blue, the results indicate that the removal effect of 5 mg/L methylene blue could reach 95.28%, 94.95%, and 96.96%, respectively, and the corresponding removal capacities were 4.76, 4.75, and 4.85 mg/g. In addition, kinetic studies showed that the removal process of methylene blue was mainly constituted by chemical adsorption. The intraparticle diffusion showed that the removal of methylene blue may be controlled by both liquid film diffusion and intraparticle diffusion. The isotherms showed that the adsorption sites of composites for methylene blue were uniformly distributed and had the same affinity. Furthermore, regeneration experiments showed that the composite materials were stable and had relatively reusability.
1. Introduction
Oily sludge is mainly composed of minerals, mineral oil, microorganisms, and water. According to surveys, the amount of newly generated oily sludge in oilfields in China is about 3.0 × 10⁷ t per year [1], and with the deepening of the oil development process and the continuous progress of the mining process, the output of oily sludge is also increasing. Oily sludge has been listed as hazardous waste and can pose great threats to human health and the environment, and its treatment and reuse have been continuing for years worldwide [2,3,4]. If oily sludge is directly landfilled or stacked, not only is the surrounding environment polluted, but oil resources are also seriously wasted.
Nowadays, oily sludge treatment has become an urgent issue in China. After years of extensive research, both domestic and foreign scientific communities have formed a variety of treatment technologies, such as extraction treatment, conditioning treatment, solidification treatment, biological treatment, high-temperature pyrolysis treatment, and the incineration of oily sludge. Among them, the pyrolysis of oily sludge has the advantages of thorough treatment, a good volume reduction effect, a high resource recovery rate, a flexible recovery method, and the ability to solidify heavy metals in oily sludge [5]. Therefore, pyrolysis treatment is currently the sludge treatment technology with the greatest application prospects and development space [6,7,8]. However, previous research on pyrolysis treatment technology for oily sludge was mainly focused on the pyrolysis process and the yield, as well as the property analysis and utilization of the pyrolysis oil gas. Research on pyrolysis residue is less common, even though pyrolysis residue contains incompletely recovered oil resources and residual heavy metal elements, etc.; thus, improper handling will cause secondary pollution. Therefore, the treatment and reuse of pyrolysis residues has become a bottleneck restricting the development of pyrolysis technology. Pyrolysis residue, mainly composed of ash and carbon, is the solid residue left in the reactor after the oily sludge is pyrolyzed. The mass fraction of carbon can reach 35–50%, which has good separation and recycling values [9]. Due to the abundant carbon elements in the pyrolysis residues, carbon nanotubes may even be formed during high-temperature pyrolysis [10]. However, the adsorption effect of pyrolysis residue itself is small compared with that of other adsorption materials. Therefore, pyrolysis residues can be loaded with metal oxides to obtain composites with high specific surface area and abundant pores [11,12].
In addition, a large amount of printing and dyeing wastewater is produced in China. According to statistics, the amount of discharged textile dye wastewater in China exceeds 2 × 10⁹ t per year, accounting for approximately 11% of the national wastewater discharge, which has become a major threat to environmental security [13,14]. Methylene blue is widely used in fabric dyeing as a cationic dye [15]. Because methylene blue has the characteristics of large output, strong toxicity, and high biological carcinogenicity [16,17], it has caused great harm to ecological safety and human health [18,19].
In recent years, many researchers have prepared adsorbents to remove methylene blue by loading metal oxides. For example, Zhang et al. [20] found that biochar/iron oxide composites can be successfully produced by green synthesis for the removal of methylene blue. Zhai et al. [21] used ZnO, MgO, and TiO2 particles as additives to load into the pores of biochar used to prepare BC-T and BC-TMZ; the results show that the prepared BC-T and BC-TMZ exhibit high removal capability of methylene blue (MB). Wang et al. [22] found that the preparation of spherical montmorillonite loaded with silver nanoparticles to remove methylene blue pollutants can achieve better reusability. These studies show that loading metal oxides can indeed improve the ability of composite materials to remove methylene blue. To the best of our knowledge, there has been no study on the use of oily sludge pyrolysis residues supported by metal oxides to remove methylene blue. Therefore, the use of oily sludge pyrolysis residues loaded with metal oxides to prepare composite materials maybe a feasible waste utilization method to remove methylene blue.
In this study, residue-supported metal oxide composite materials were prepared by the impregnation method, and oily sludge pyrolysis residue was used as a carrier. With the removal effect of methylene blue as a criterion, the effects of impregnation time, impregnation ratio, the dosage of composite material, contact time, and regeneration performance on the removal of methylene blue were investigated. Then, the loading and removal processes of metal oxides were studied through a series of characterizations and kinetics in order to provide a reference for the usage of oily sludge pyrolysis residues to support metal oxides as adsorbents.
2. Materials and Methods
2.1. Raw Materials and Reagents
The oily sludge used was reduced sludge from the Jingbian Oil Production Plant of Yan’an Oilfield, China. The sludge was a dark-brown viscous solid substance accompanied by a distinct crude oil odor. The oily sludge was first dried (105 ± 2 ℃), then ground and sieved (10 mesh). Sodium hydroxide (NaOH), hydrochloric acid (HCl), sulfuric acid (H2SO4), and methylene blue were purchased from Xi’an Chemical Reagent Factory (Xi’an, China). All chemical agents used in this study were of analytical grade and were used without further purification. The distilled water used in the experiments was purchased from Shaanxi Hankang Environmental Protection Technology Company (Xi’an, China).
2.2. Preparation Composite Materials
- (1)
- Preparation of pyrolysis residues
Under N2 atmosphere, the oily sludge was heated to 500 °C at a rate of 10 °C/min in a pyrolysis furnace for 3 h, then cooled to room temperature naturally. The pyrolysis residue was ground into powder, passed through a 100-mesh sieve, dried for 24 h, and stored for further study.
- (2)
- Synthesis of composite materials
The composite materials were synthesized with a facile impregnation method [23]. CuO (0.1, 0.2, 0.3, 0.4, 0.5, 0.6 g), and pyrolysis residue carrier (1.0 g) was added to 50 mL of distilled water. This mixture was stirred for 90 min with a magnetic stirrer at room temperature (25 °C), followed by impregnation for 10–110 min at 70 °C. Then, the mixture was rinsed with deionized water until it became neutral, and the solution was passed through a 0.45 μm water filter membrane with a suction filter device. Eventually, the CuO-composite material was obtained after drying the solid at 150 °C for 24 h in an oven.
The ZnO-composite material and TiO2-composite material were synthesized with a similar method, and ZnO (0.01, 0.03, 0.05, 0.1, 0.3, and 0.5 g) and TiO2 (0.1, 0.2, 0.3, 0.4, 0.5, and 0.6 g) were loaded onto the pyrolysis residue carrier (1.0 g), respectively.
2.3. Batch Experiment
The composite material was added to the methylene blue solution with the dosage of 1 g/L, and the solution was adjusted to pH 7 using 0.1 M HCl and NaOH. Then, the flasks were placed in a thermostatic oscillator set at 160 rpm and 25 ℃ until equilibrium concentration between the adsorbent and solution was attained. Then, the removal effect of methylene blue was studied by sampling the residual methylene blue concentration in the solution using a UV–Vis spectrophotometer (Thermo Fisher UV 2350 spectrophotometer, Xi’an, China) at a maximum wavelength of 665 nm.
With the removal effect of methylene blue as a criterion, a series of batch experiments were carried out to study the effects of impregnation time, impregnation ratio, dosage, contact time, and solution concentration on the removal of methylene blue. Among them, the optimal impregnation time and impregnation ratio were selected, and the materials were named AC-CuO, AC-ZnO, and AC-TiO2, respectively. Then, AC-CuO, AC-ZnO, and AC-TiO2 were used to further study the effect of dosage (0.5–8.5 g/L), contact time (5–180 min), and solution concentration (1.0–9.0 mg/L) on the removal process of methylene blue.
The methylene blue removal amount (Qe) and removal effect (η) of the composite material can be calculated according to Formulas (1) and (2) [24].
where C0 and Ce are the initial and e-time concentrations of methylene blue, mg/L, respectively; V is the solution volume, L; m is the weight of the composite material, g; and η is the adsorption percentage, %.
Unless otherwise specified, other factors were maintained as follows: initial concentration = 5 mg/L, impregnation ratio (AC-CuO) = 0.2:1, impregnation ratio (AC-ZnO) = 0.05:1, impregnation ratio (AC-TiO2) = 0.3:1, impregnation time (AC-CuO) = 70 min, impregnation time (AC-ZnO) = 50 min, impregnation time (AC-TiO2) = 50 min, dosage = 1 g/L, contact time = 60 min, vibration rate = 160 rpm, and temperature = 25 ± 0.5 ℃.
2.4. Optimization of the Removal Parameters
Based on the dosage, contact time, and concentration parameters in the removal process for AC-CuO, AC-ZnO, and AC-TiO2, the Box–Behnken design tool of Design Expert 7.0 software was used to conduct matrix design, and then, the effect of the interaction between various factors on the removal performance of methylene blue was studied. The experimental range and level of independent variables are shown in Table 1. Taking A—dosage (g); B—time (min); and C—concentration (mg/L) as independent variables, the significance analysis results of the response surface regression models of AC-CuO, AC-ZnO, and AC-TiO2 were studied.

Table 1.
The experimental range and level of independent variables.
2.5. Characterization Analysis
The crystal phase structures of AC-CuO, AC-ZnO, and AC-TiO2 were analyzed by using an automatic X-ray diffractometer (LabX/XRD-6000, Shimadzu, Japan). A scanning electron microscope (JSM-6390A, Jeol, Japan) was used to analyze the microscopic morphology and element species of AC-CuO, AC-ZnO, and AC-TiO2. The surface functional groups of AC-CuO, AC-ZnO, and AC-TiO2 were determined by using a Fourier transform infrared spectrometer (Nicolet 5700, Thermo Company). The specific surface area and pore distribution of AC-CuO, AC-ZnO, and AC-TiO2 were characterized by using a BET tester (ASAP-HD88, Mack Instruments, Atlanta, GA, USA), and the data were analyzed by using Origin software.
2.6. Kinetic and Diffusion Models
Intraparticle diffusion models, first-order kinetics (Lagergren equation), and second-order kinetics (McKay equation) were used to study the kinetics of methylene blue removal from composite materials. The nonlinear formulations for these kinetic models are as follows:
Intraparticle diffusion equation:
Lagergren equation:
McKay equation:
where Kd (min−1), K1 (min−1), and K2 (min−1) are the rate constants of the intraparticle diffusion model and Lagergren and McKay models, respectively; b is the boundary layer effect; Qe (mg/g) is the saturated adsorption capacity; and Qt (mg/g) is the adsorption amount at time t.
2.7. Isotherms
The Langmuir and Freundlich equations were used to examine the isothermal removal of methylene blue. The nonlinear formulas of these two equations are as follows:
- Langmuir isotherm
- Freundlish isotherm
2.8. Regeneration Performance
The composite materials recovered after adsorption equilibrium in batch experiments were rinsed with distilled water to remove the residual methylene blue dye solution, and then dried. The dried composite material was placed in a stripping solution contained in a 250 mL Erlenmeyer flask. The solution contained 200 mL distilled water adjusted to pH 7 using 0.1 M HCl and NaOH. The flask was then placed in a thermostatic oscillator with settings as given in Section 2.3 to attain adsorption equilibrium. The composite materials were recovered, dried, and placed in a flask containing 200 mL of 5 mg/L initial solution of methylene blue for the next equilibrium adsorption experiment. This cycle was repeated 4 times. The regeneration performance of carbon materials was evaluated by regeneration efficiency and loss rate [25].
where R is the regeneration efficiency of the carbon material, %; Qt is the adsorption capacity of the composite material after the t-th regeneration, mg/g; and Q0 is the adsorption capacity of the carbon material before regeneration, mg/g.
where L is the regeneration loss rate of the carbon material, %; me is the mass of the carbon material after the e-th regeneration, g; and m0 is the mass of the carbon material before regeneration, g.
3. Results and Discussion
3.1. Influence of Preparation Conditions
During the impregnation process, CuO, ZnO, and TiO2 gradually adsorbed and diffused in the pyrolysis residue, respectively [26]. In order to study the effect of impregnation time on the degree of loading and dispersion of metal oxides on the pyrolysis residue support, the influence of impregnation time and impregnation ratio were investigated.
3.1.1. Impregnation Time
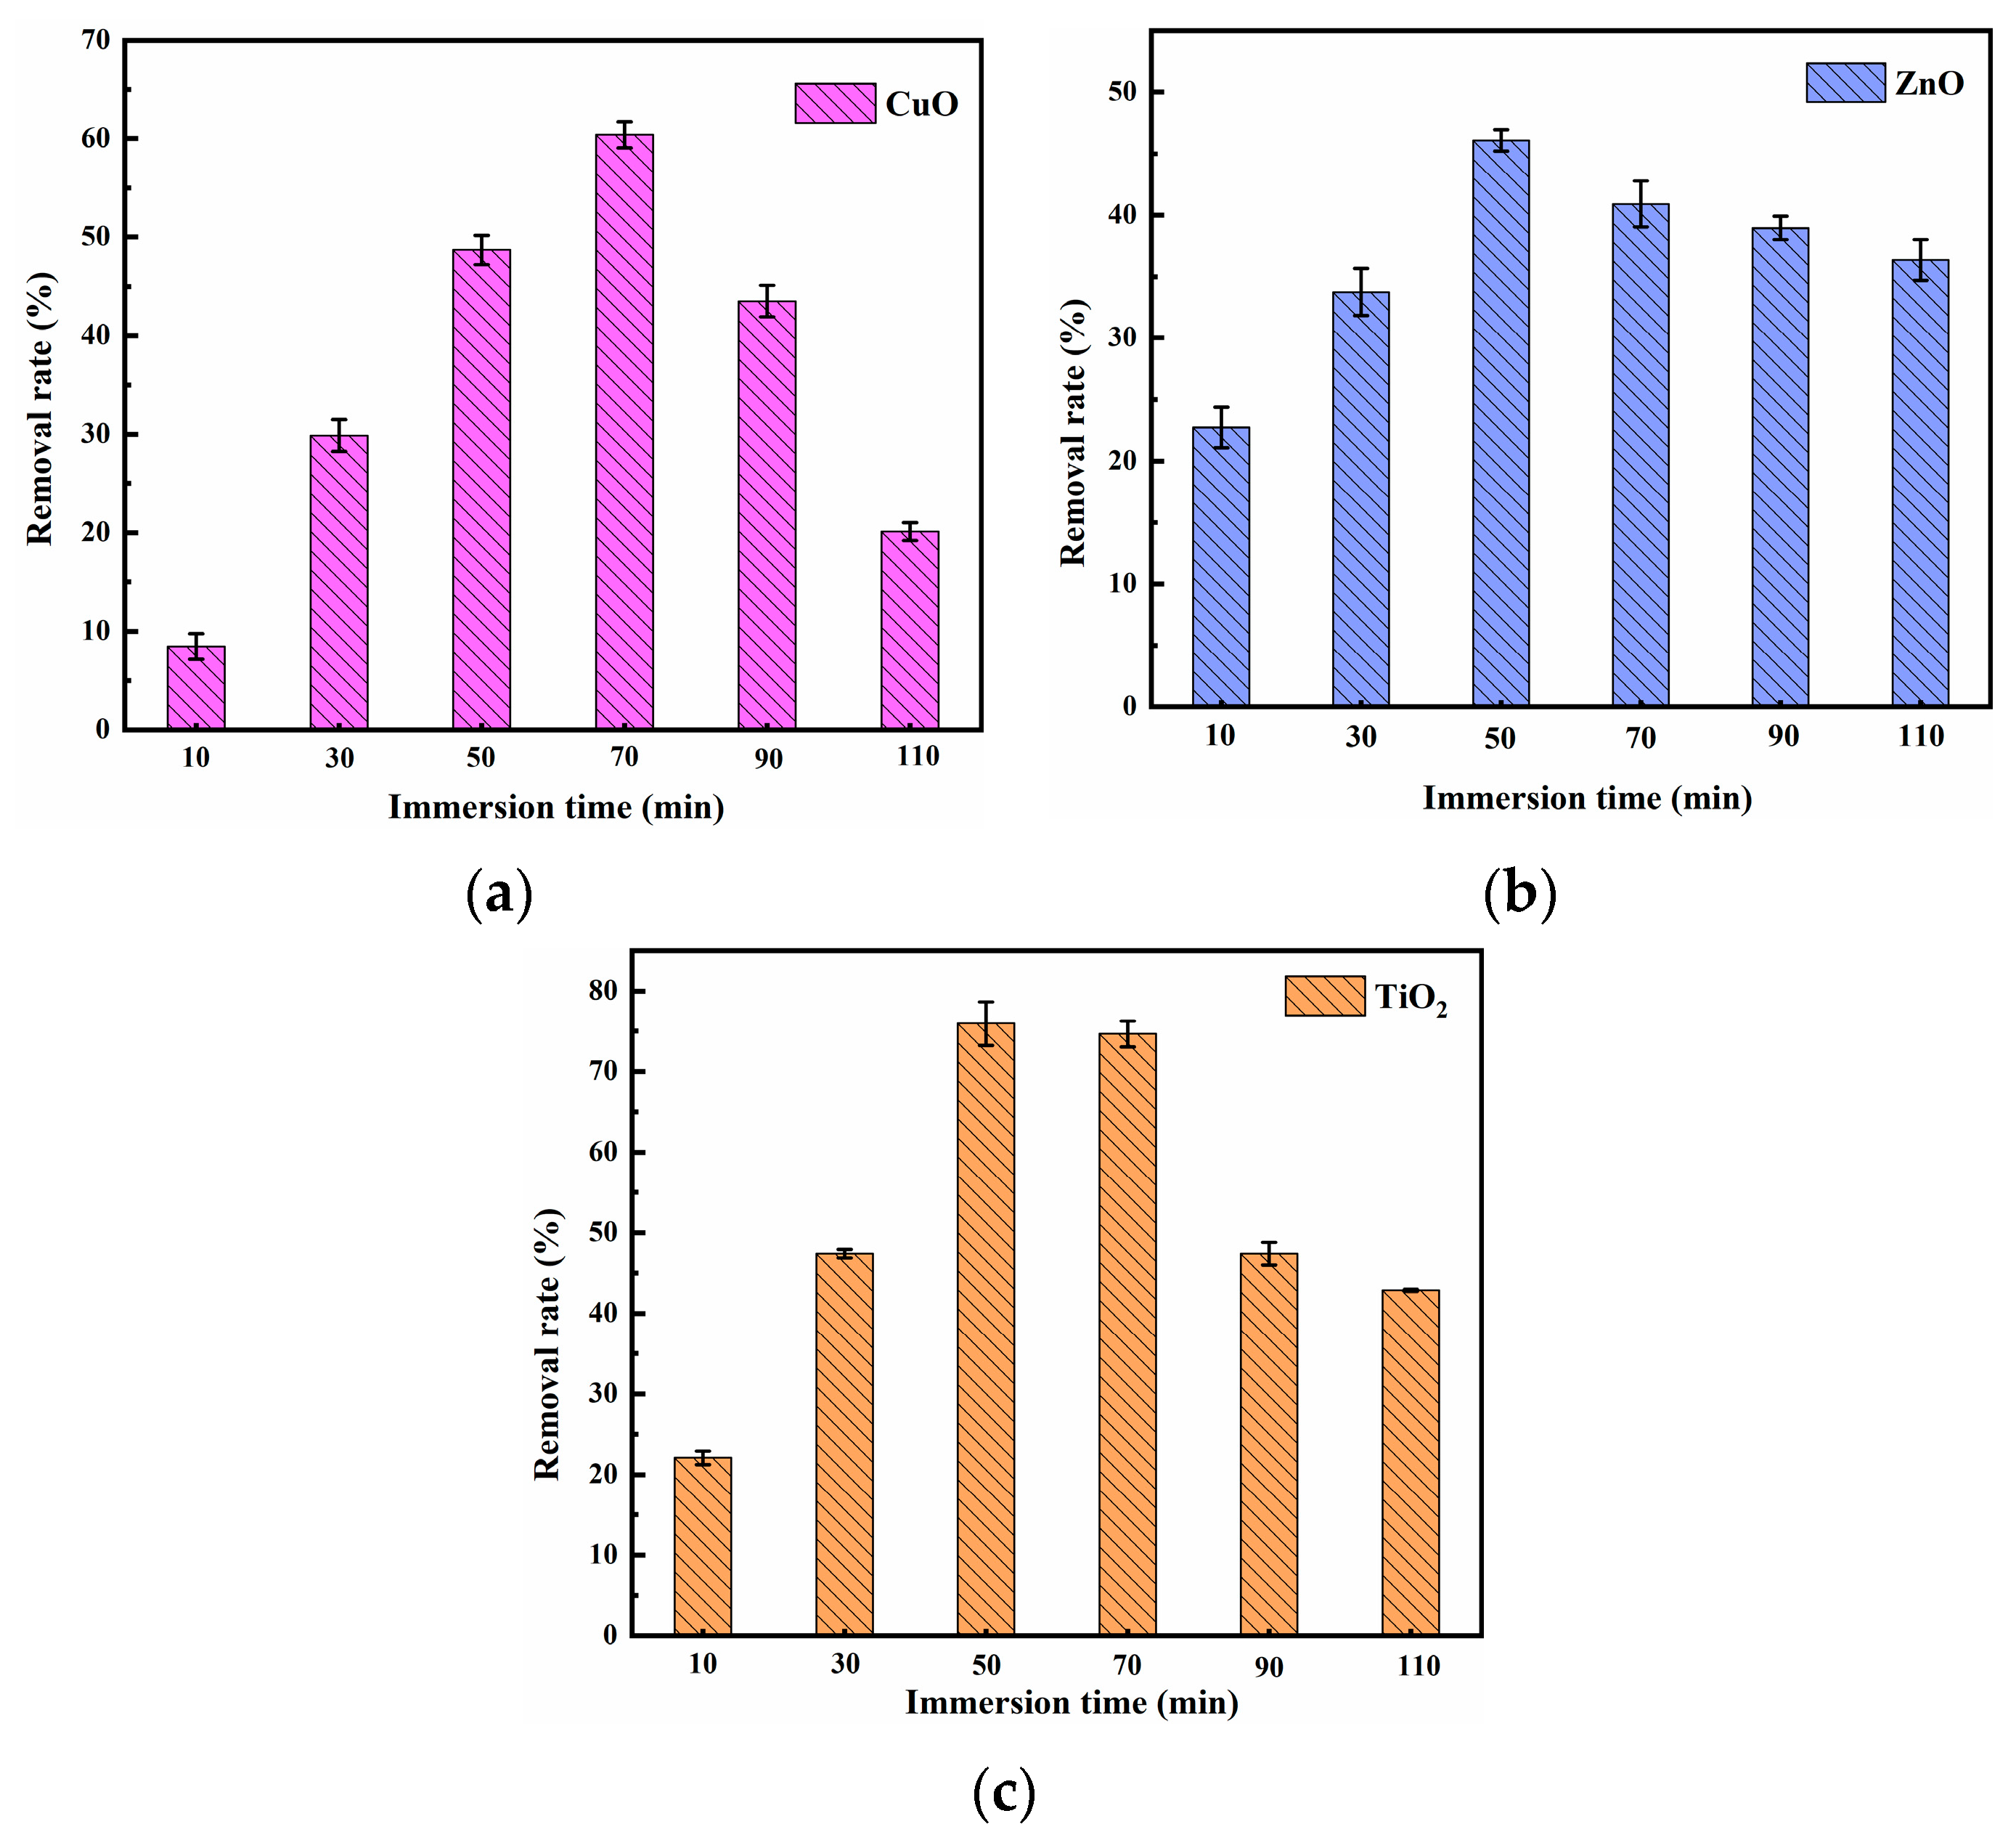
As shown in Figure 1, when the impregnation time of CuO-, ZnO-, and TiO2-supported pyrolysis residue was 70, 50, and 50 min, respectively, the removal effect of methylene blue was at its best.
When impregnation time was short, impregnation of pyrolysis residue was insufficient, and metal oxides were mainly distributed at the pore edges of the pyrolysis residue. After that, with the prolongation of impregnation time, the metal oxide gradually diffused into the pores of the pyrolysis residue carrier, which improved the removal efficiency of methylene blue [27]. However, with further increase in impregnation time, the removal effect of the composite material on methylene blue decreased. This may be due to the fact that a too-long immersion time can lead to the clogging of micropores, which reduces the removal rate of methylene blue [28].
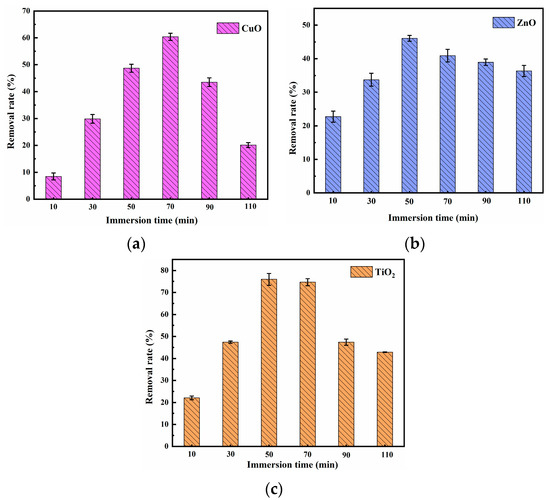
Figure 1.
Effect of (a) CuO; (b) ZnO; (c) TiO2 composite materials’ impregnation time on methylene blue removal (impregnation ratio = 0.1:1, initial methylene blue concentration = 5 mg/L, composite materials dosage = 1 g/L, contact time = 60 min, temperature = 25 ± 0.5 °C, initial pH = 7.00).
Figure 1.
Effect of (a) CuO; (b) ZnO; (c) TiO2 composite materials’ impregnation time on methylene blue removal (impregnation ratio = 0.1:1, initial methylene blue concentration = 5 mg/L, composite materials dosage = 1 g/L, contact time = 60 min, temperature = 25 ± 0.5 °C, initial pH = 7.00).
3.1.2. Impregnation Ratio
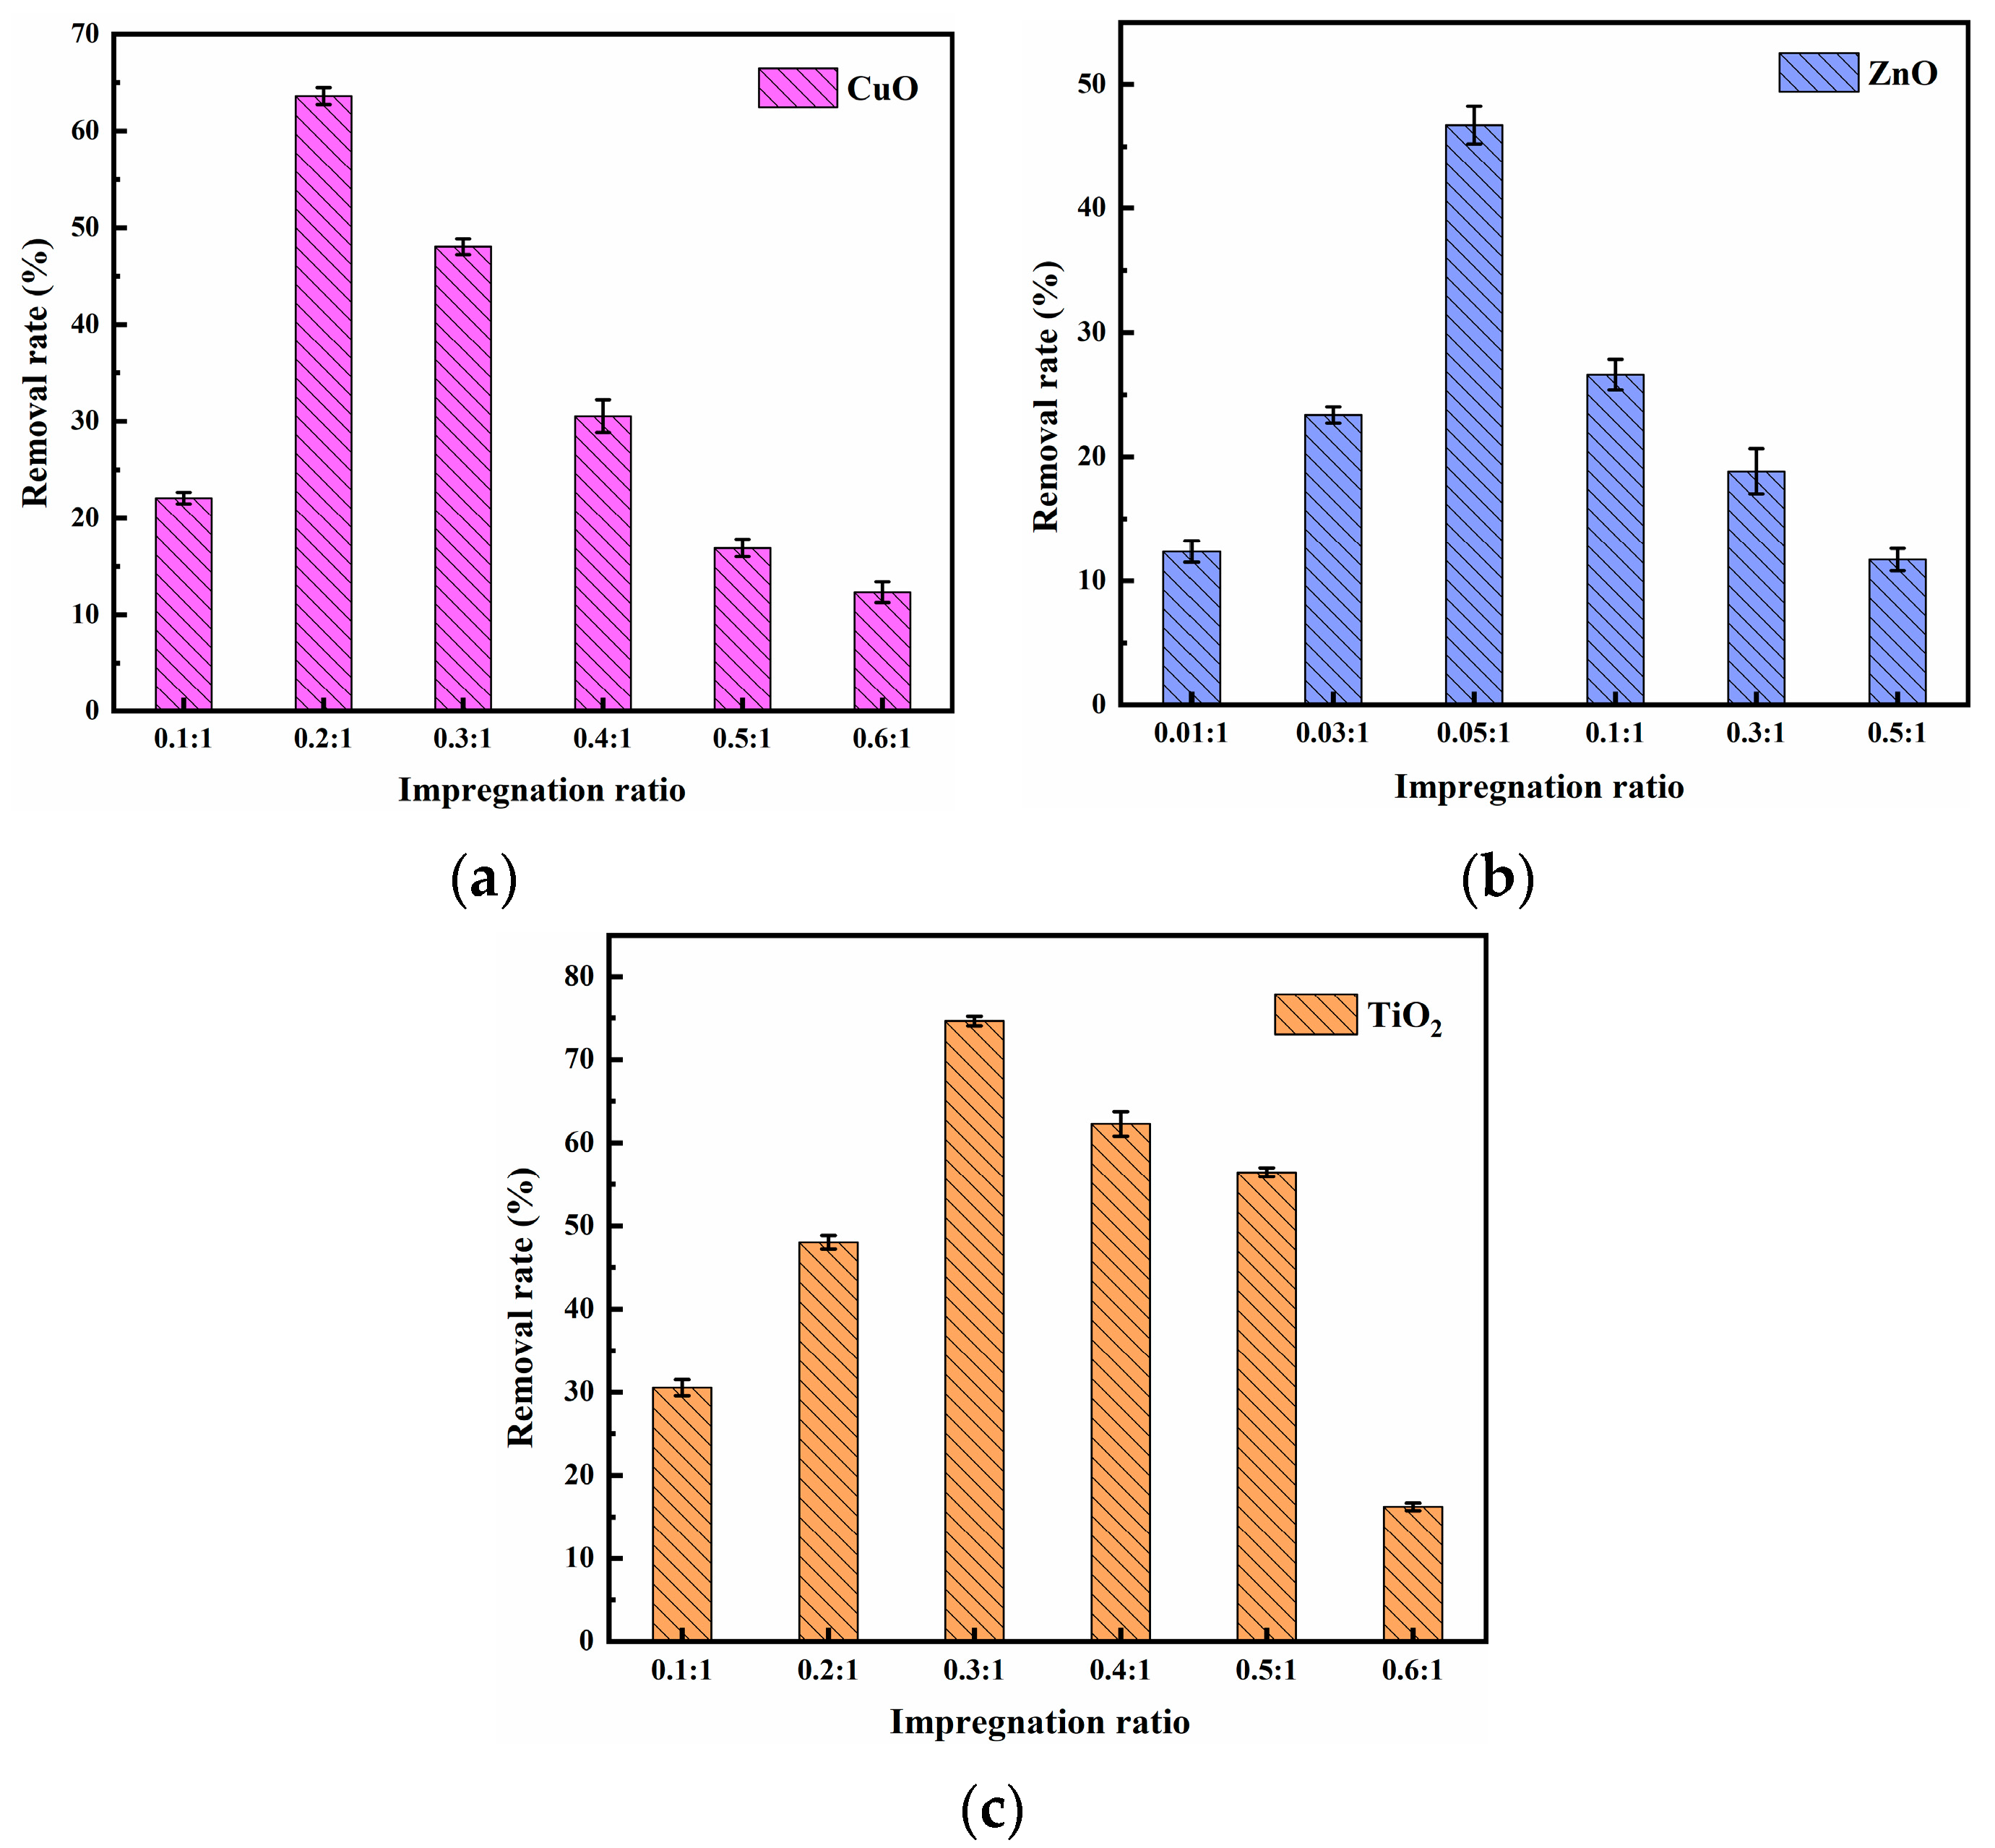
Figure 2 shows the effect of impregnation ratio on methylene blue removal. It can be seen that with the increase in impregnation ratio, the removal of methylene blue by CuO, ZnO, and TiO2 composite materials first increased and then decreased. Additionally, under the impregnation mass ratios of 0.2:1, 0.05:1, and 0.3:1, the removal effect of methylene blue reached 63.61%, 46.74%, and 74.64%, respectively. Then, with the increase of these impregnation ratios, the removal effect of methylene blue decreased. This may be attributed to the further increase in the impregnation ratio. CuO, ZnO, and TiO2 were loaded into the pores of the pyrolysis residue, leading to pore blockage, and then the mass transfer resistance of methylene blue increased [29].
The composite materials prepared under the optimal conditions mentioned above were named AC-CuO, AC-ZnO, and AC-TiO2, and were used to further explore the effect of removal conditions on the removal of methylene blue.

Figure 2.
Effect of (a) CuO; (b) ZnO; (c) TiO2 composite materials’ impregnation ratio on methylene blue removal (impregnation time (CuO) = 70 min, impregnation time (ZnO) = 50 min, impregnation time (TiO2) = 50 min, initial methylene blue concentration = 5 mg/L, composite materials dosage = 1 g/L, contact time = 60 min, temperature = 25 ± 0.5 °C, initial pH = 7.00).
3.2. Characterization of Composite Materials
3.2.1. Morphology Characterization of Composite Materials
SEM
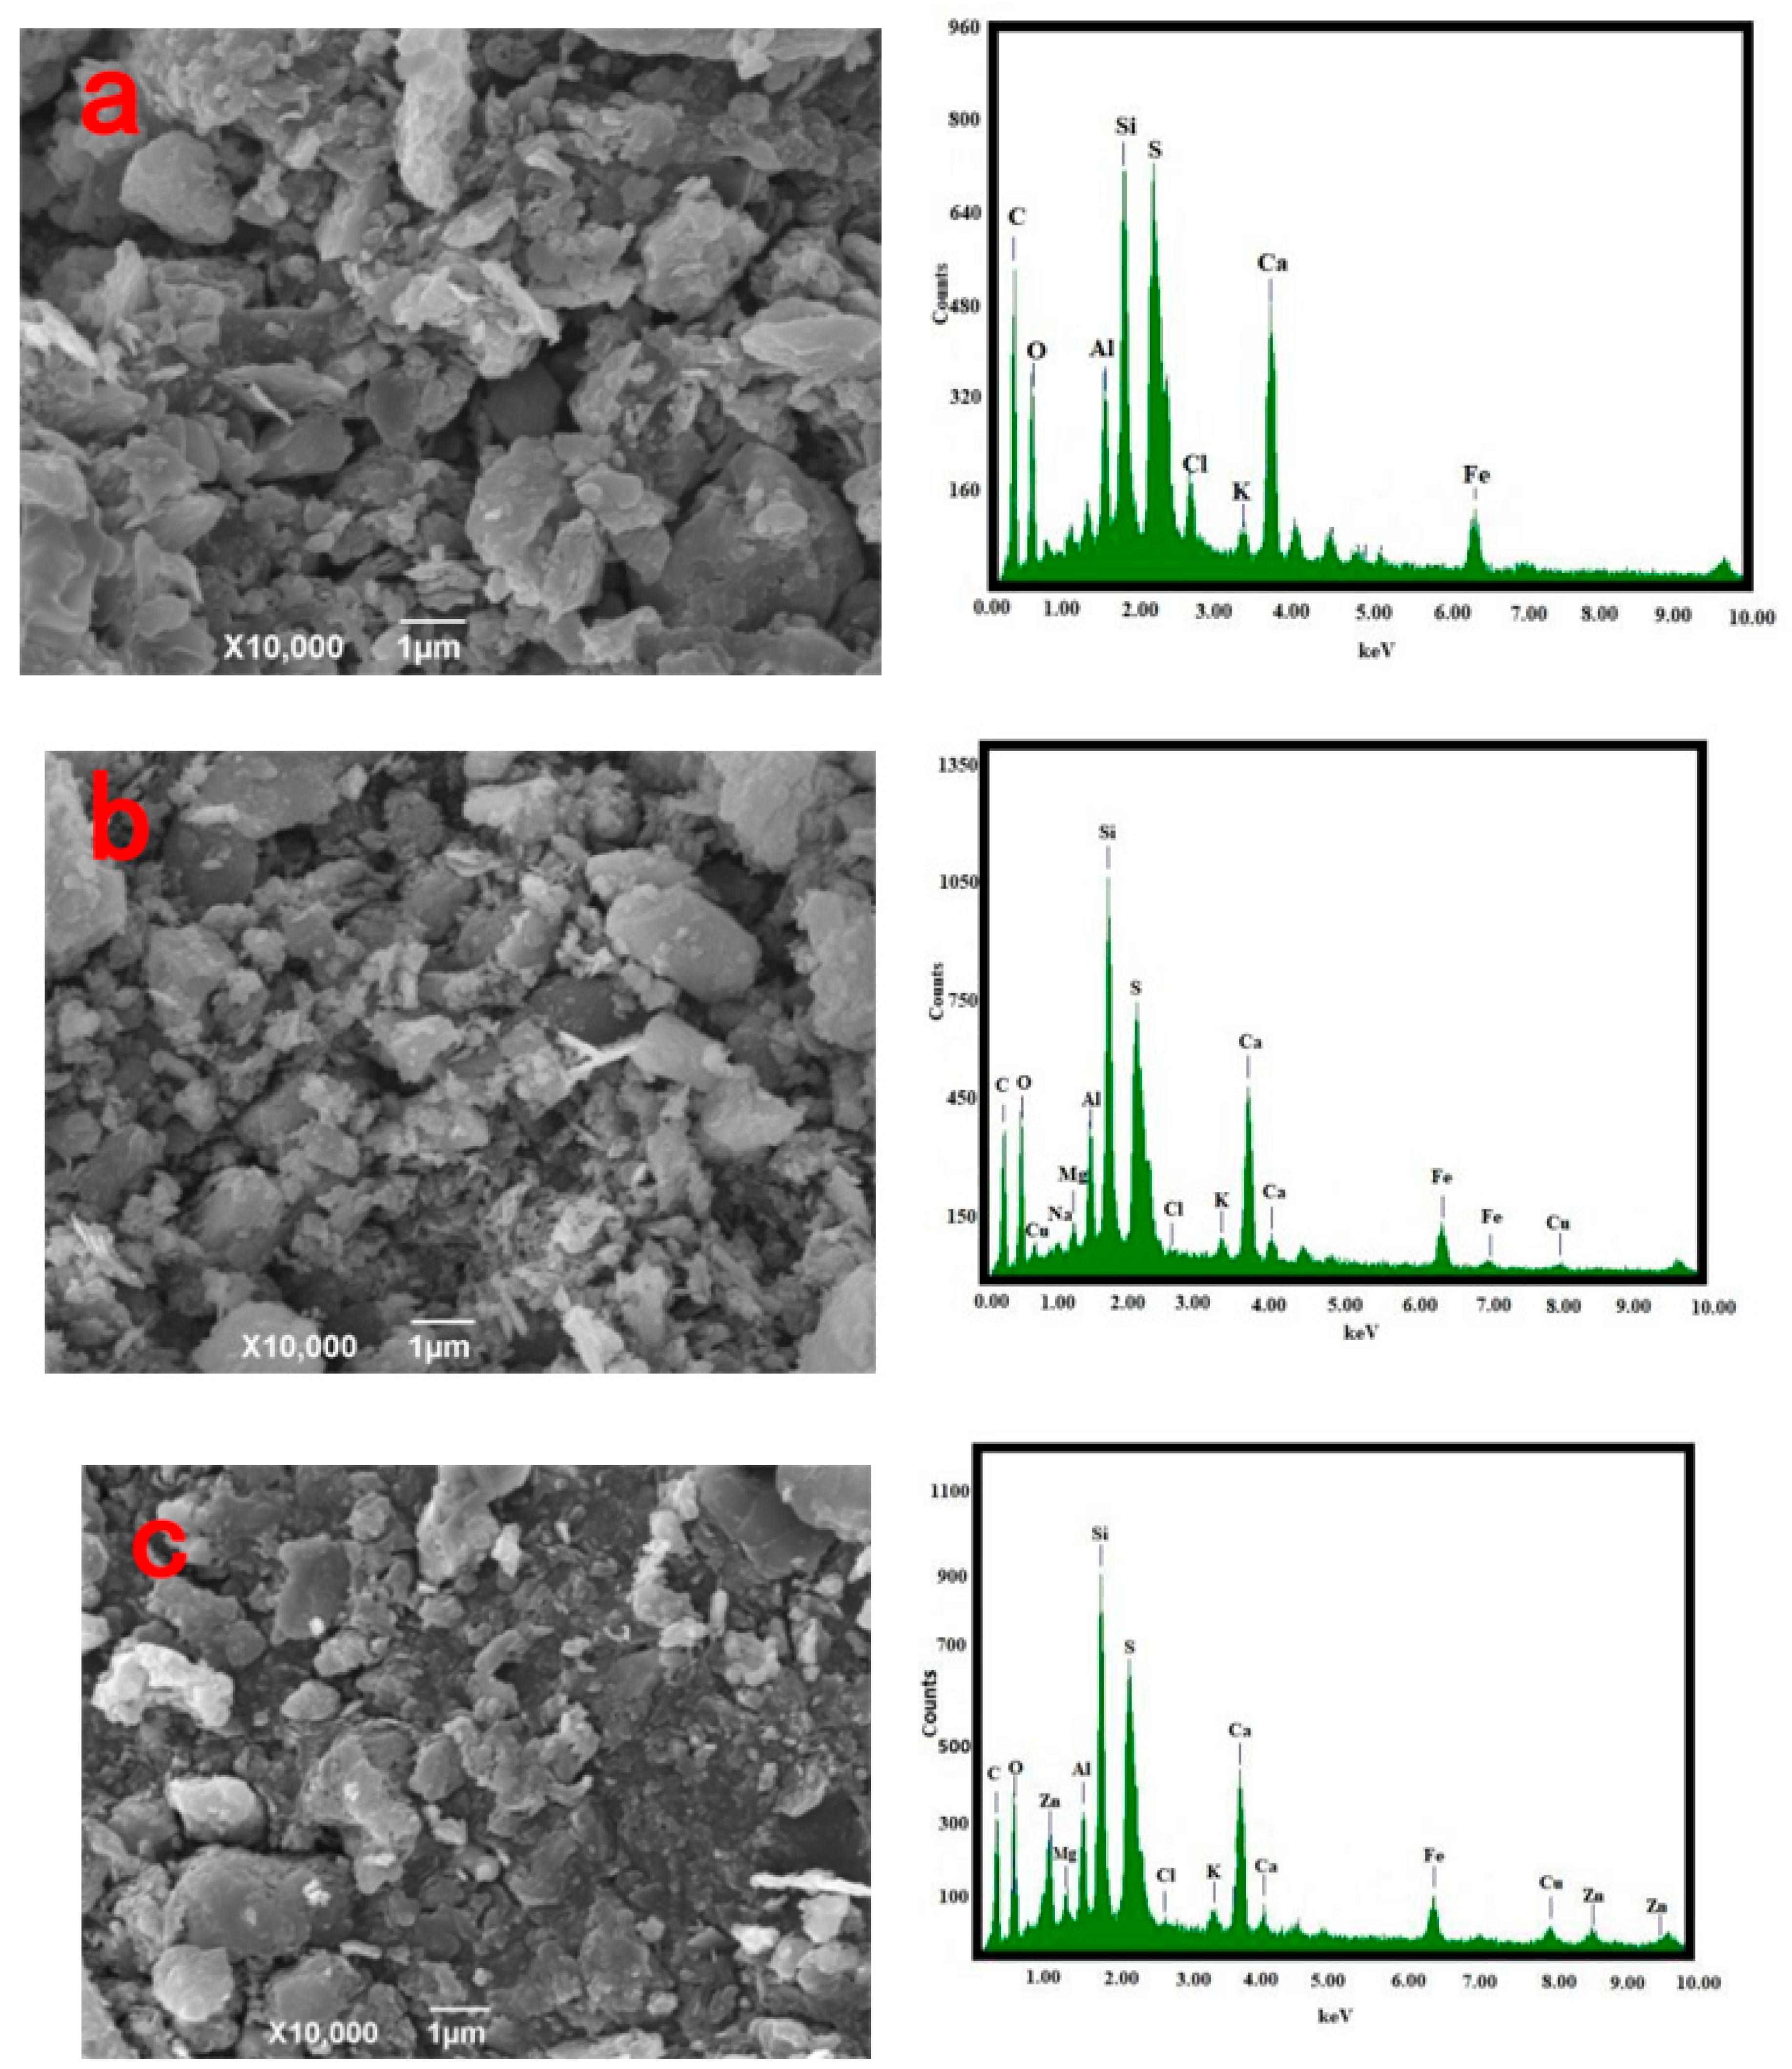
The morphology and composition of the pyrolysis residue, AC-CuO, AC-ZnO, and AC-TiO2 are shown in Figure 3. It can be seen from Figure 3a that the pyrolysis residue had a relatively smooth outer surface and a blocky structure. Compared with Figure 3b–d, it can be seen that the structures of AC-CuO and AC-ZnO were not much different from that of the pyrolysis residues. However, compared with that of the pyrolysis residue, the surface roughness and particle size of AC-TiO2 increased.
From the EDS diagram in Figure 3, it can be seen that there were no energy spectrum peaks of Cu and Zn elements in the pyrolysis residue, but there were energy spectrum peaks of trace Ti elements. However, compared with those of AC-CuO, AC-ZnO, and AC-TiO2, it was found that energy spectrum peaks of Cu, Zn, and Ti appeared on the energy spectrum, respectively [30], indicating that CuO, ZnO, and TiO2 were successfully loaded on the pyrolysis residue.
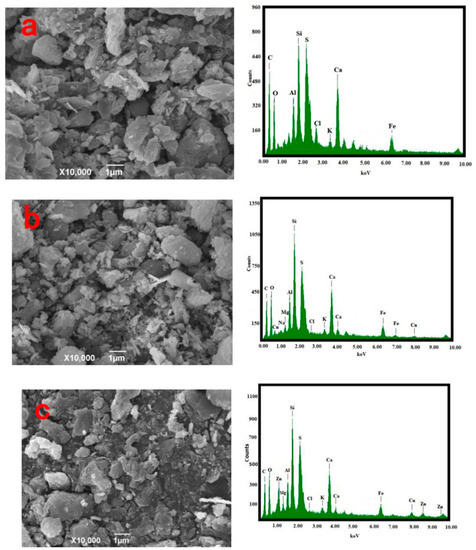

Figure 3.
SEM and EDS images (a) oily sludge residue; (b) AC-CuO; (c) AC-ZnO; (d) AC-TiO2.
Figure 3.
SEM and EDS images (a) oily sludge residue; (b) AC-CuO; (c) AC-ZnO; (d) AC-TiO2.
BET
Table 2 illustrates the specific surface area, pore volume, and pore size of AC-CuO, AC-ZnO, and AC-TiO2. The specific surface areas of AC-CuO, AC-ZnO, and AC-TiO2 were 5.9082, 4.9138, and 7.8951 m2/g, respectively. It can be seen that the specific surface areas of AC-TiO2 > AC-CuO > AC-ZnO were consistent with their respective removal efficiencies of methylene blue, which indicates that the pore structure of the composite material was involved in the removal of methylene blue. This conclusion is consistent with previous research findings [31,32].
In addition, by analyzing the ratio of mesopores to total pores, the mesoporosity of AC-CuO, AC-ZnO, and AC-TiO2 was 93.69%, 94.44%, and 99.64%, respectively, indicating that the pore size distribution of AC-CuO, AC-ZnO, and AC-TiO2 was dominated by the mesopores.
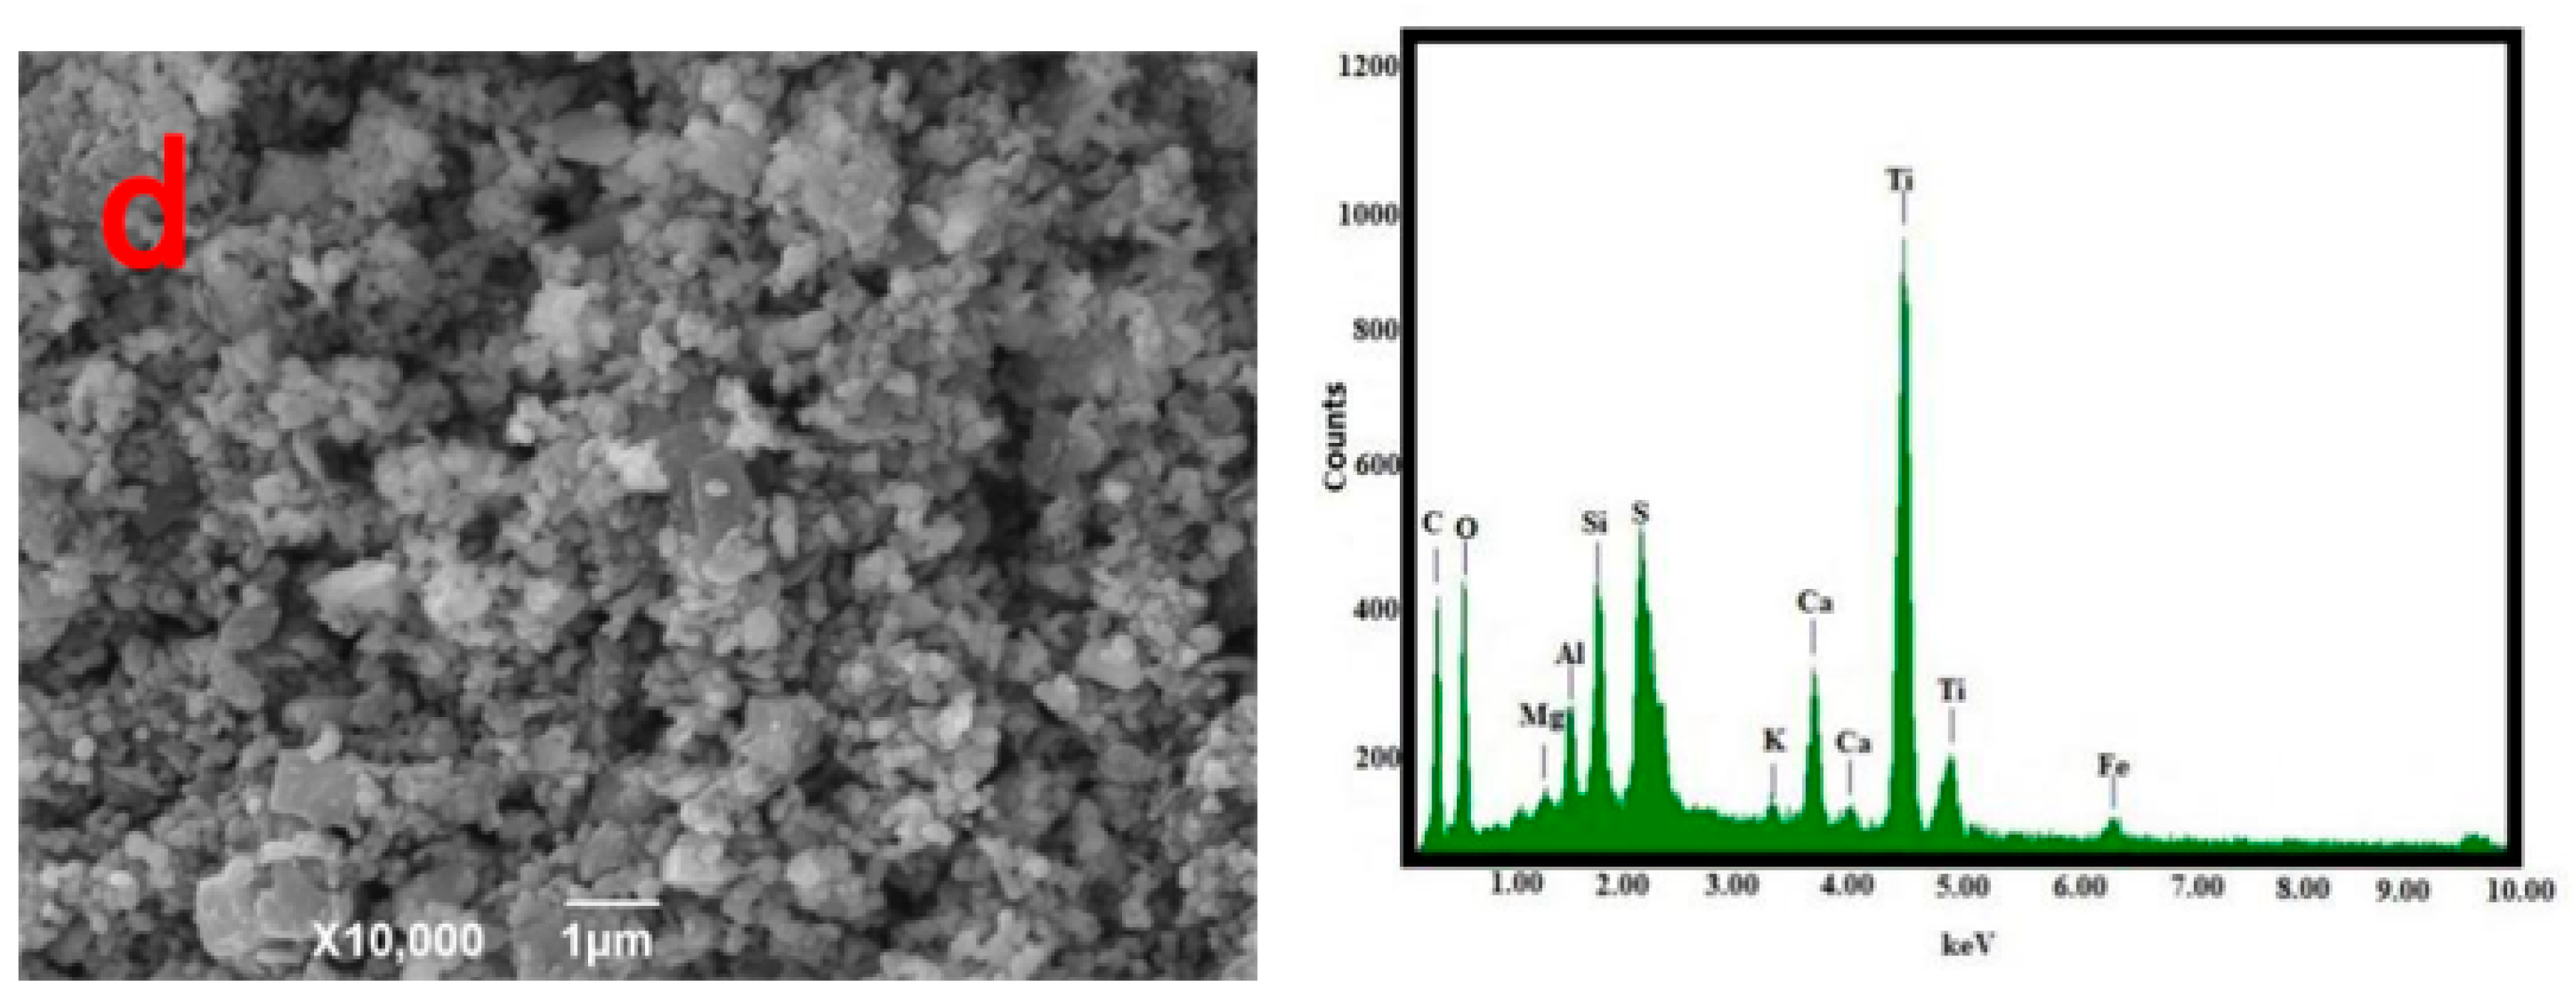
Figure 4 shows the N2 adsorption–desorption curves of AC-CuO, AC-ZnO, and AC-TiO2, respectively. All the curves did not overlap, which may be due to the small specific surface area of them and the underdeveloped pores. In addition, the N2 adsorption–desorption curves were all closed, and the classification of the hysteresis loop belonged to the IV type, indicating AC-CuO, AC-ZnO, and AC-TiO2 were mostly composed of mesopores [33].
Figure 5 shows the pore size distribution curves of AC-CuO, AC-ZnO, and AC-TiO2, respectively. It can be seen that the pore size distributions were relatively concentrated, and the pore structure was dominated by mesopores between 2 and 20 nm, with almost no macropores. This result is consistent with that of N2 adsorption–desorption analysis. The concentrated pore size distribution facilitated the methylene blue removal process [34].
Table 2.
Specific surface area and pore volume of the composite materials.
Table 2.
Specific surface area and pore volume of the composite materials.
| Source | Specific Surface Area (m2/g) SBET | Micropore Volume (cm3/g) Vmic | Mesopore Volume (cm3/g) Vmes | Total Pore Volume (cm3/g) Vtot | Mesopore Average Pore Diameter (nm) | Total Pore Average Pore Diameter (nm) DP |
|---|---|---|---|---|---|---|
| AC-CuO | 5.9082 | 0.0014 | 0.0208 | 0.0222 | 16.6842 | 14.6344 |
| AC-ZnO | 4.9138 | 0.0012 | 0.0204 | 0.0216 | 19.6171 | 17.1305 |
| AC-TiO2 | 7.8951 | 0.0001 | 0.0834 | 0.0837 | 15.8715 | 15.6531 |
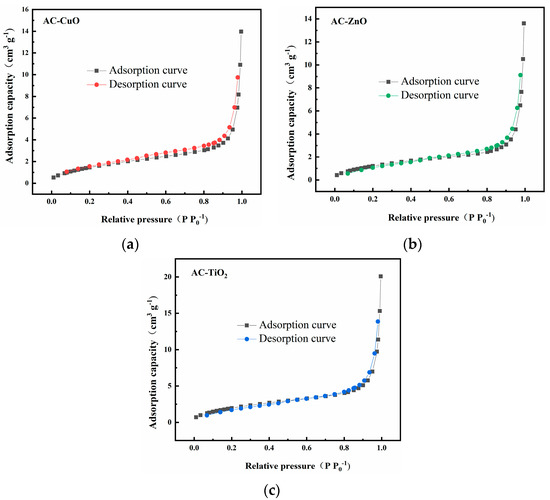
Figure 4.
N2 adsorption-desorption curves of (a) AC-CuO; (b) AC-ZnO; and (c) AC-TiO2.
Figure 4.
N2 adsorption-desorption curves of (a) AC-CuO; (b) AC-ZnO; and (c) AC-TiO2.
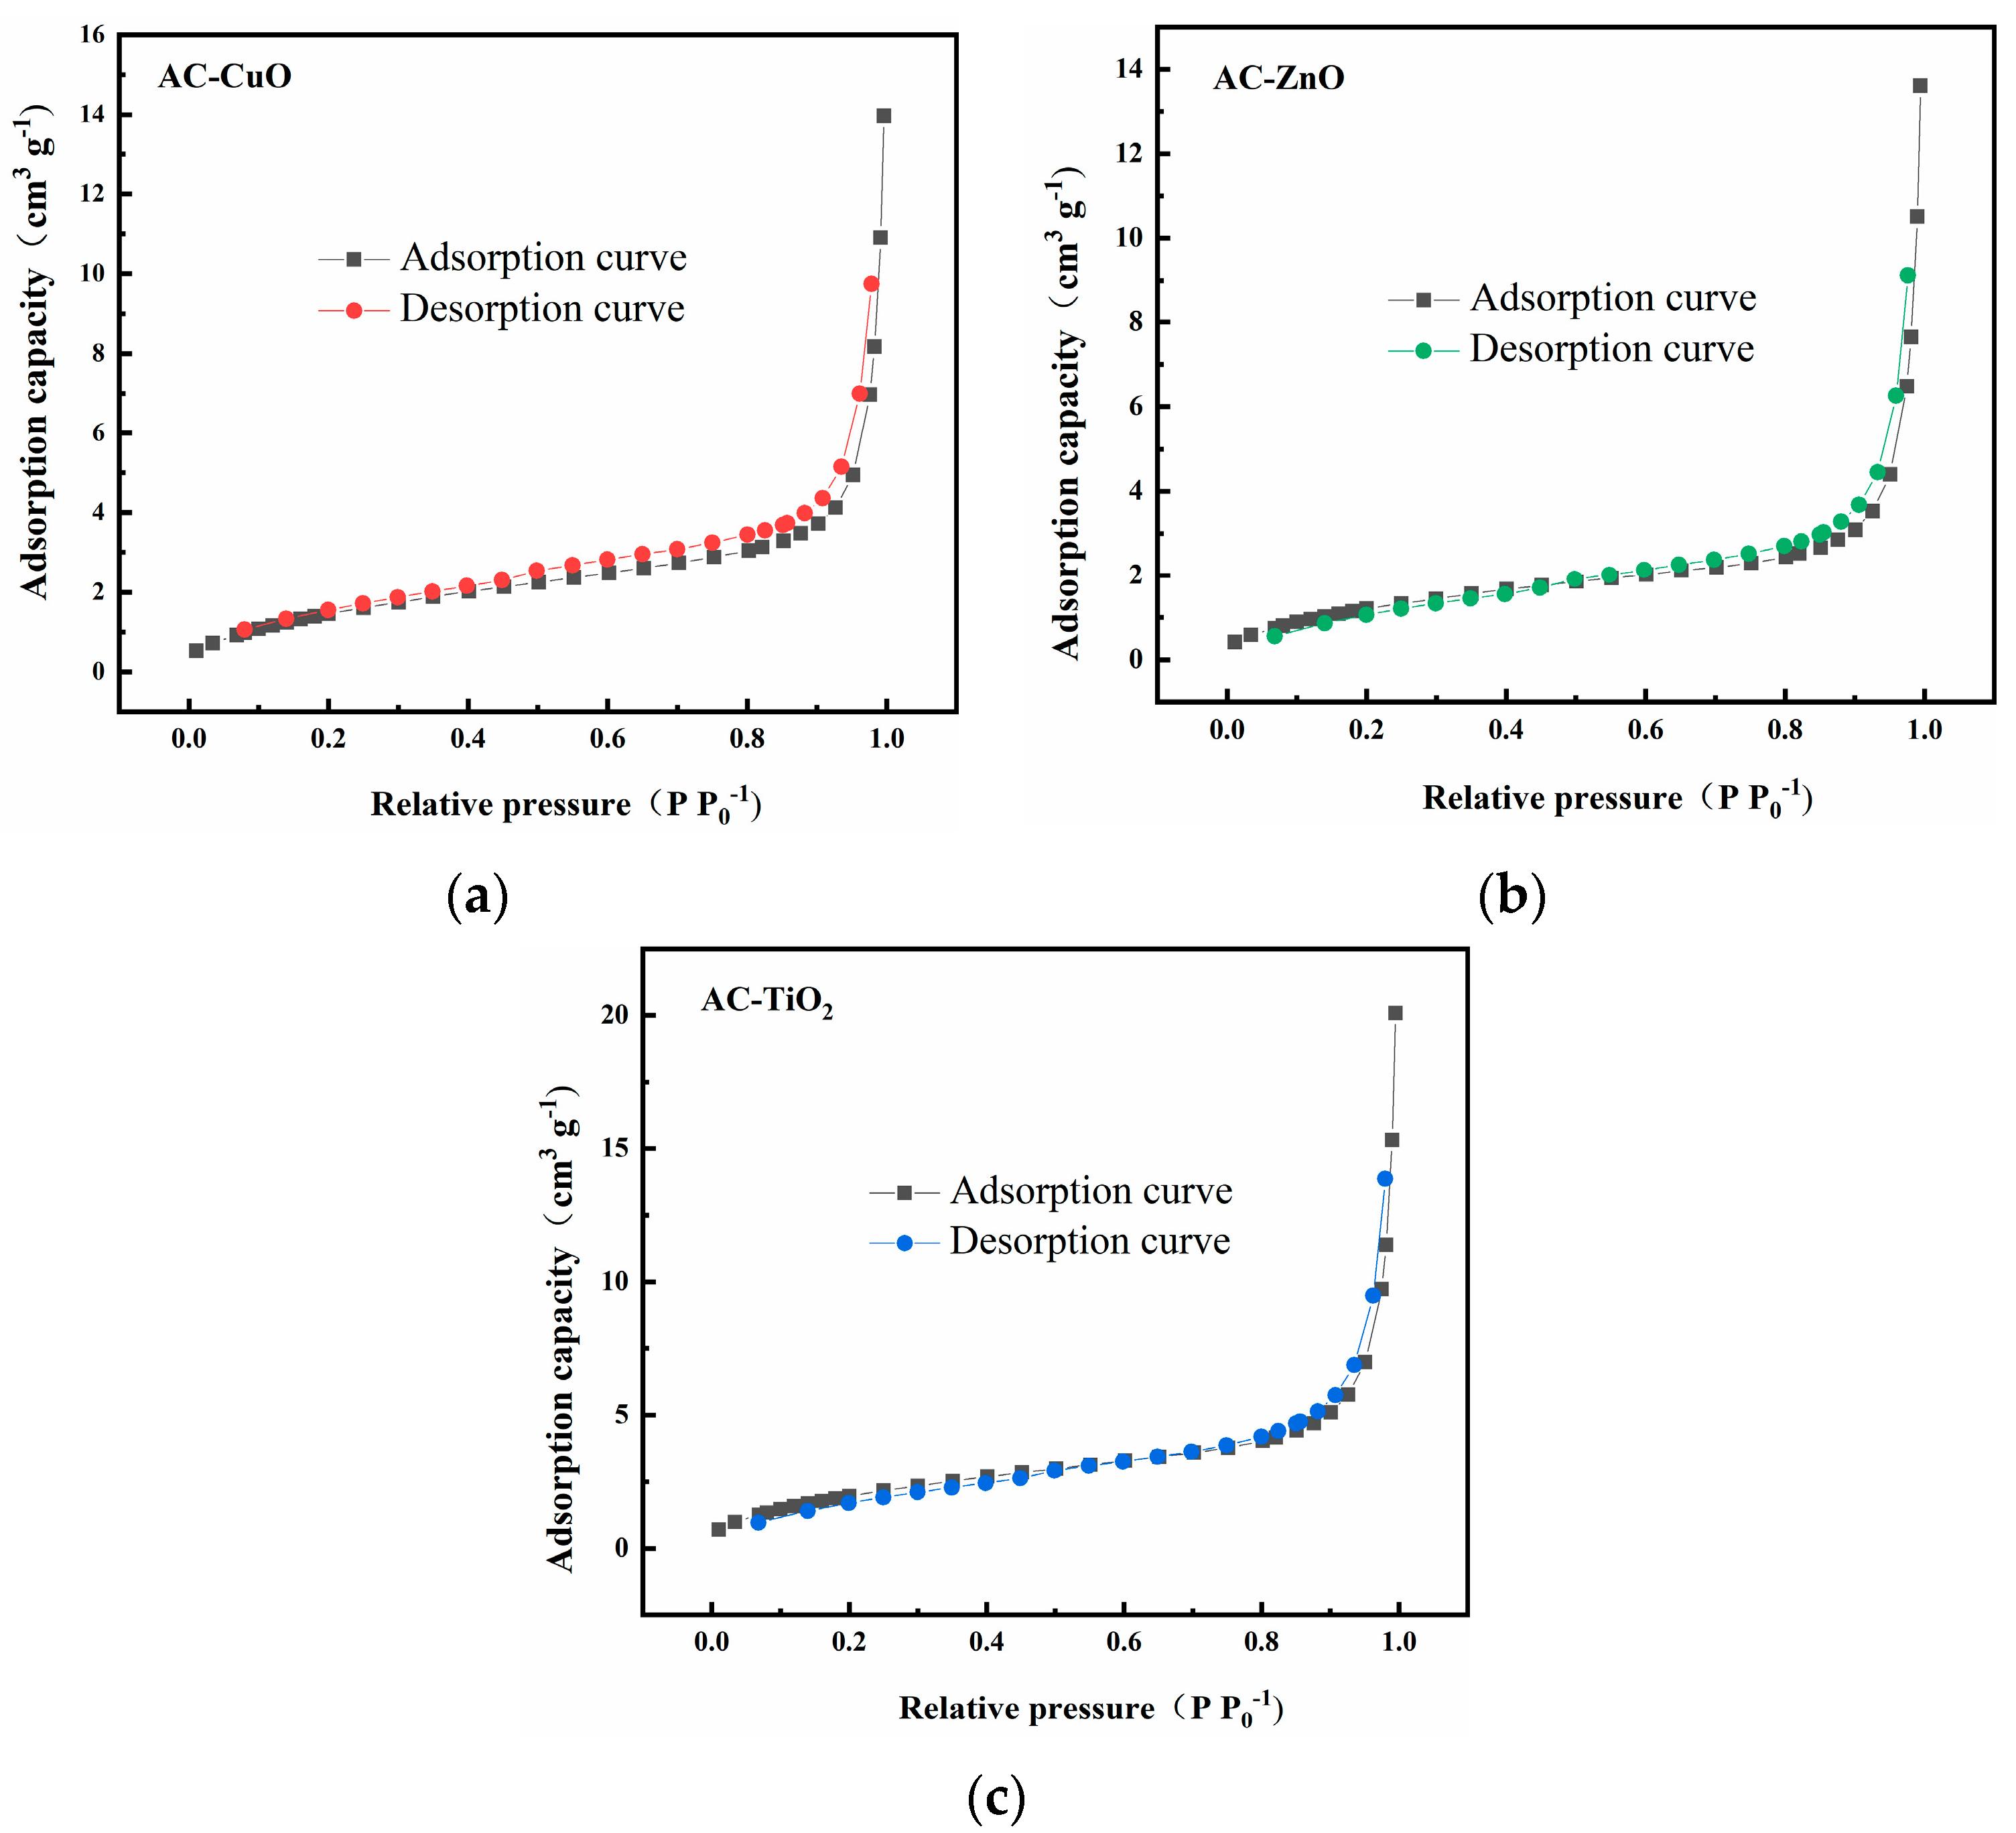
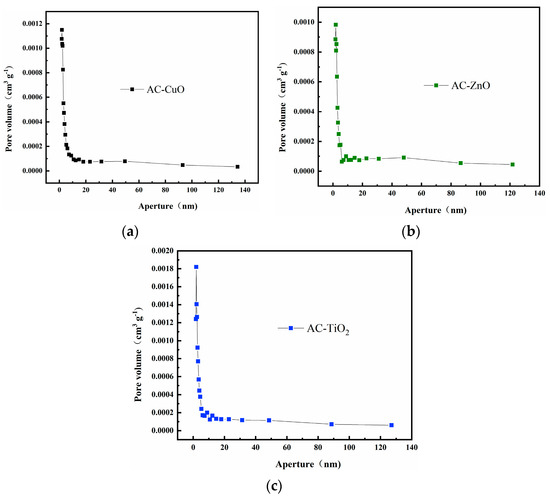
Figure 5.
Pore size distribution curves of (a) AC-CuO; (b) AC-ZnO; and (c) AC-TiO2.
Figure 5.
Pore size distribution curves of (a) AC-CuO; (b) AC-ZnO; and (c) AC-TiO2.

3.2.2. Composition Characterization of Composite Materials
XRD
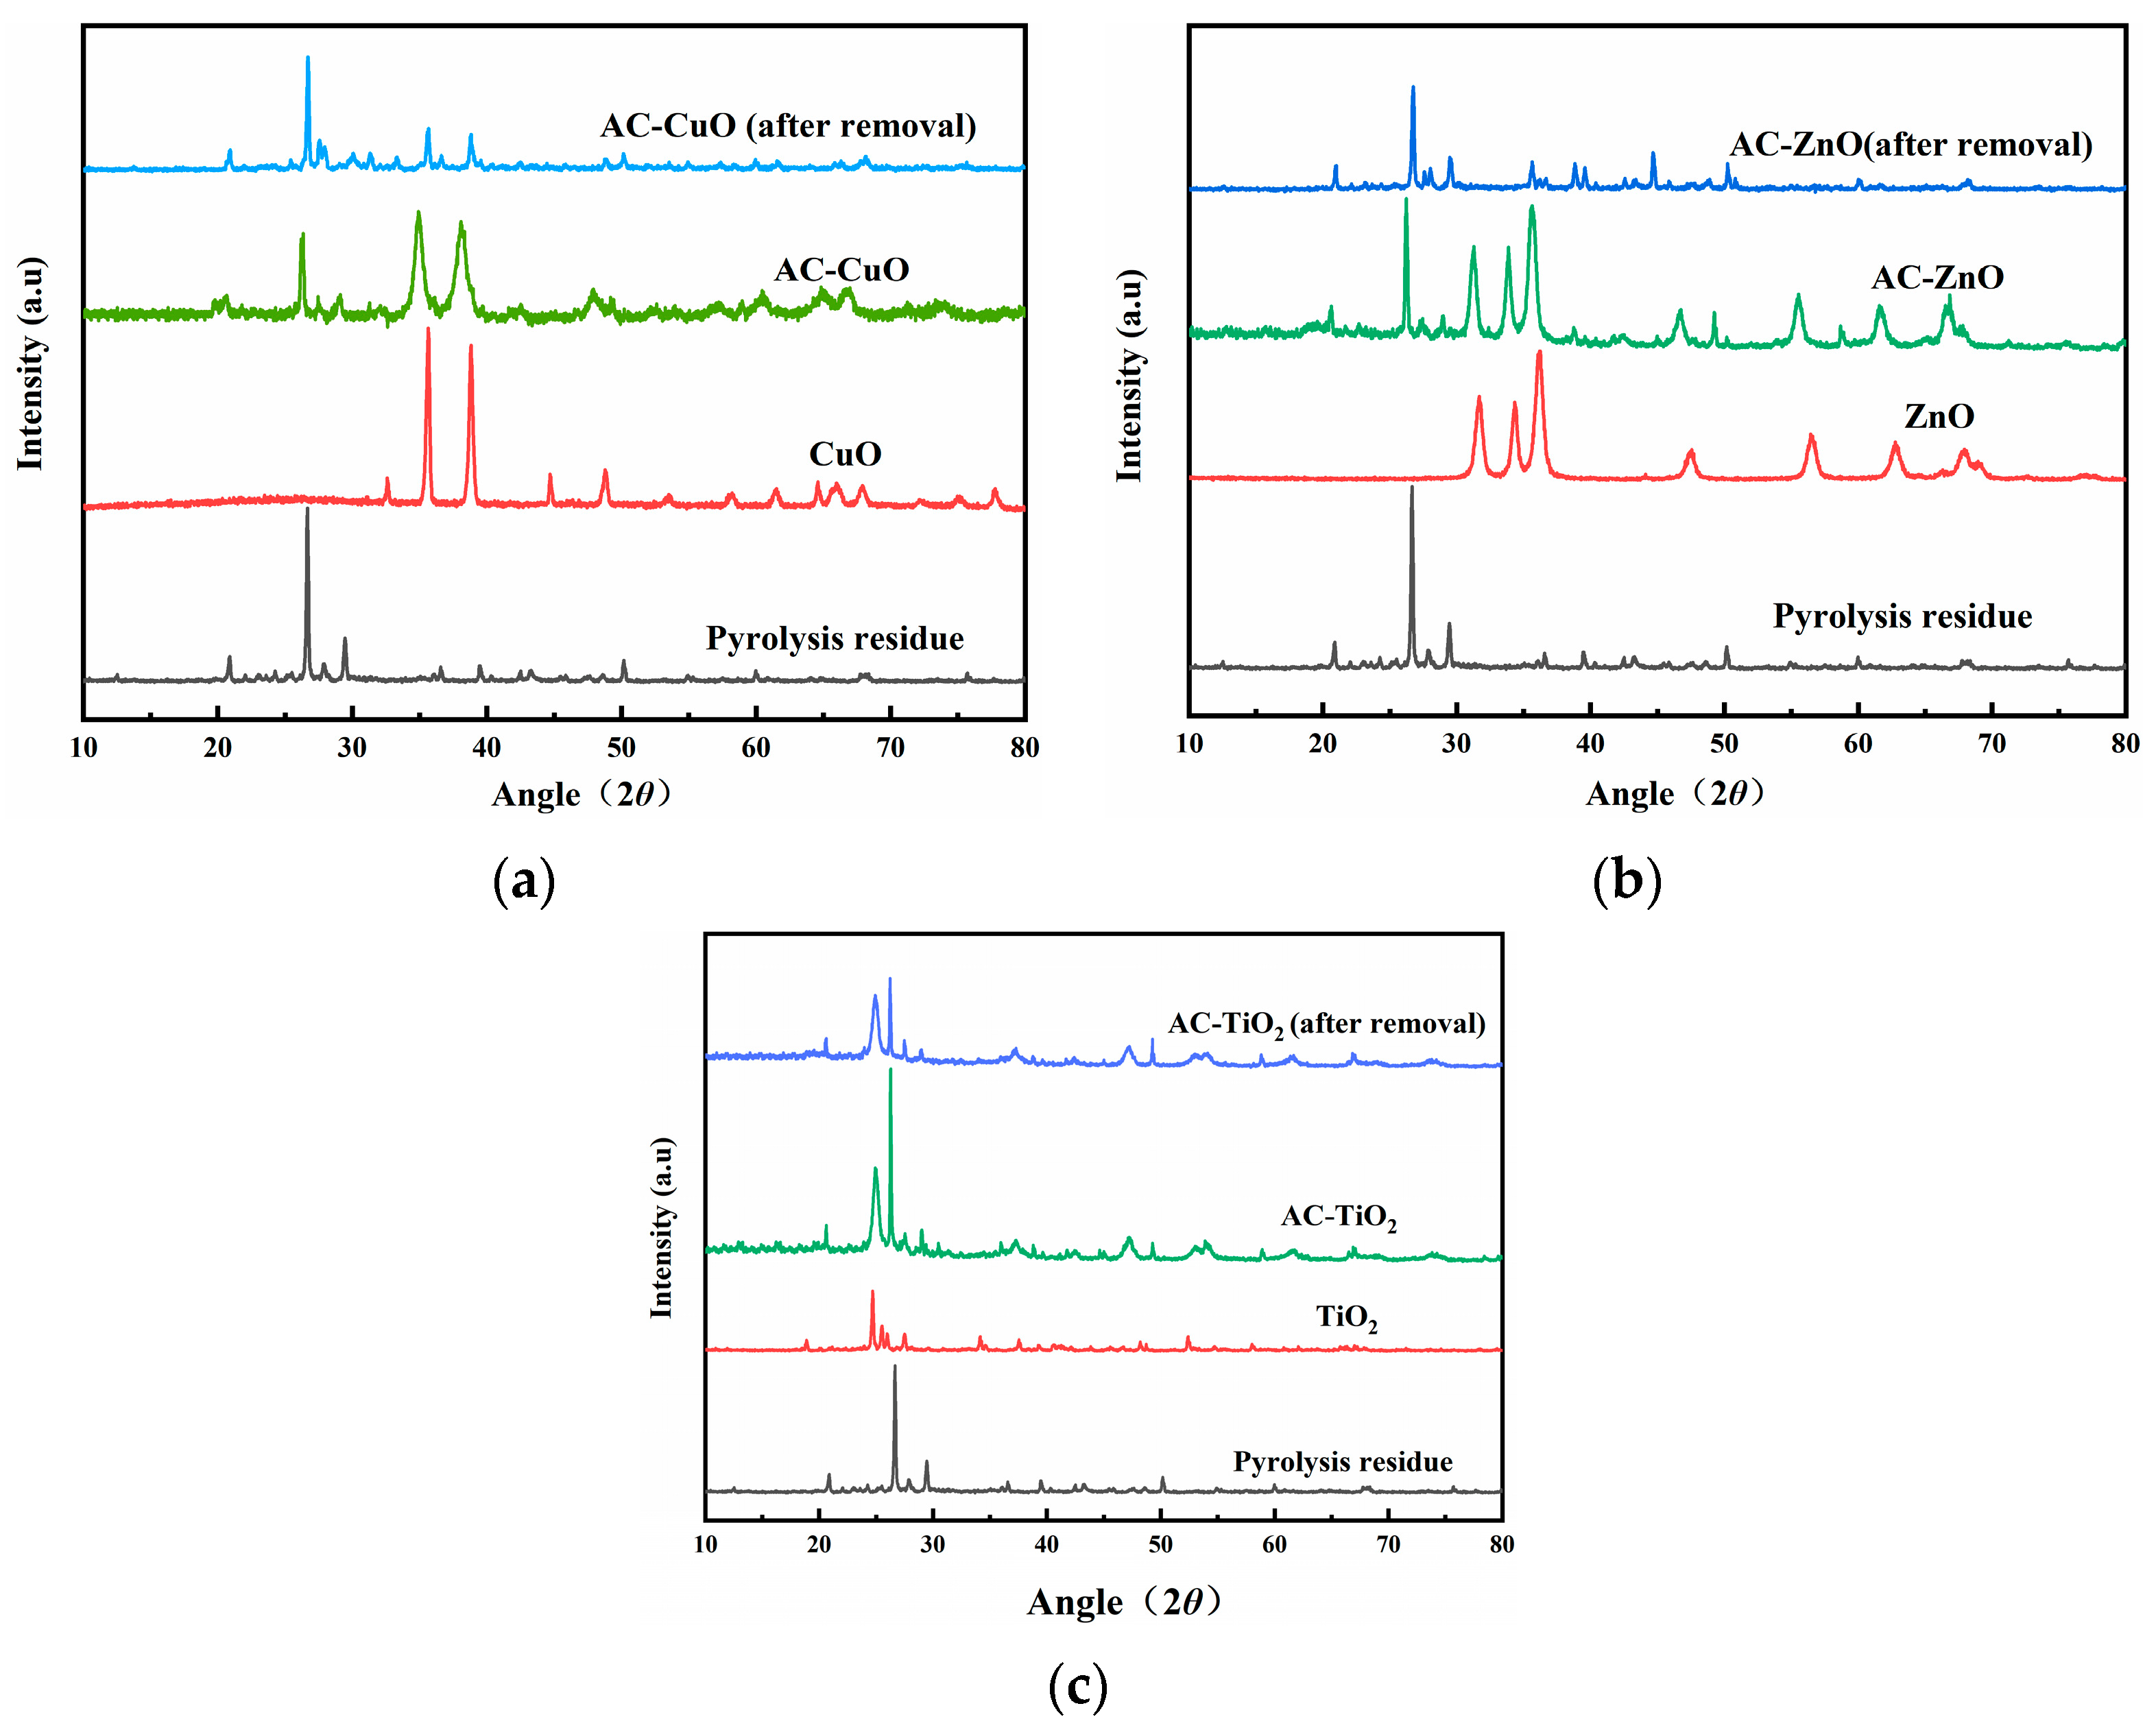
X-ray diffraction of the pyrolysis residue and AC-CuO, AC-ZnO, and AC-TiO2 are shown in Figure 6. It can be seen that the characteristic diffraction peaks of CuO appeared near 35°, 38°, 49°, and 66° in AC-CuO, and the peaks at 61° and 68° were stronger than those of the pyrolysis residue. After removal of methylene blue, the characteristic diffraction peaks remained relatively stable. The characteristic diffraction peaks of ZnO (characteristic diffraction peaks near 32°, 34°, 36°) and TiO2 (characteristic diffraction peaks near 25°, 37°, 48°) appeared on AC-ZnO and AC-TiO2, respectively, indicating that AC-ZnO and AC-TiO2 were successfully prepared.
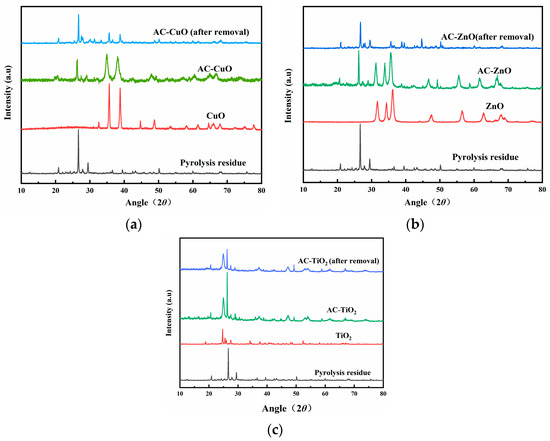
Figure 6.
XRD patterns of pyrolysis residue; (a) AC-CuO; (b) AC-ZnO; and (c) AC-TiO2.
FT-IR
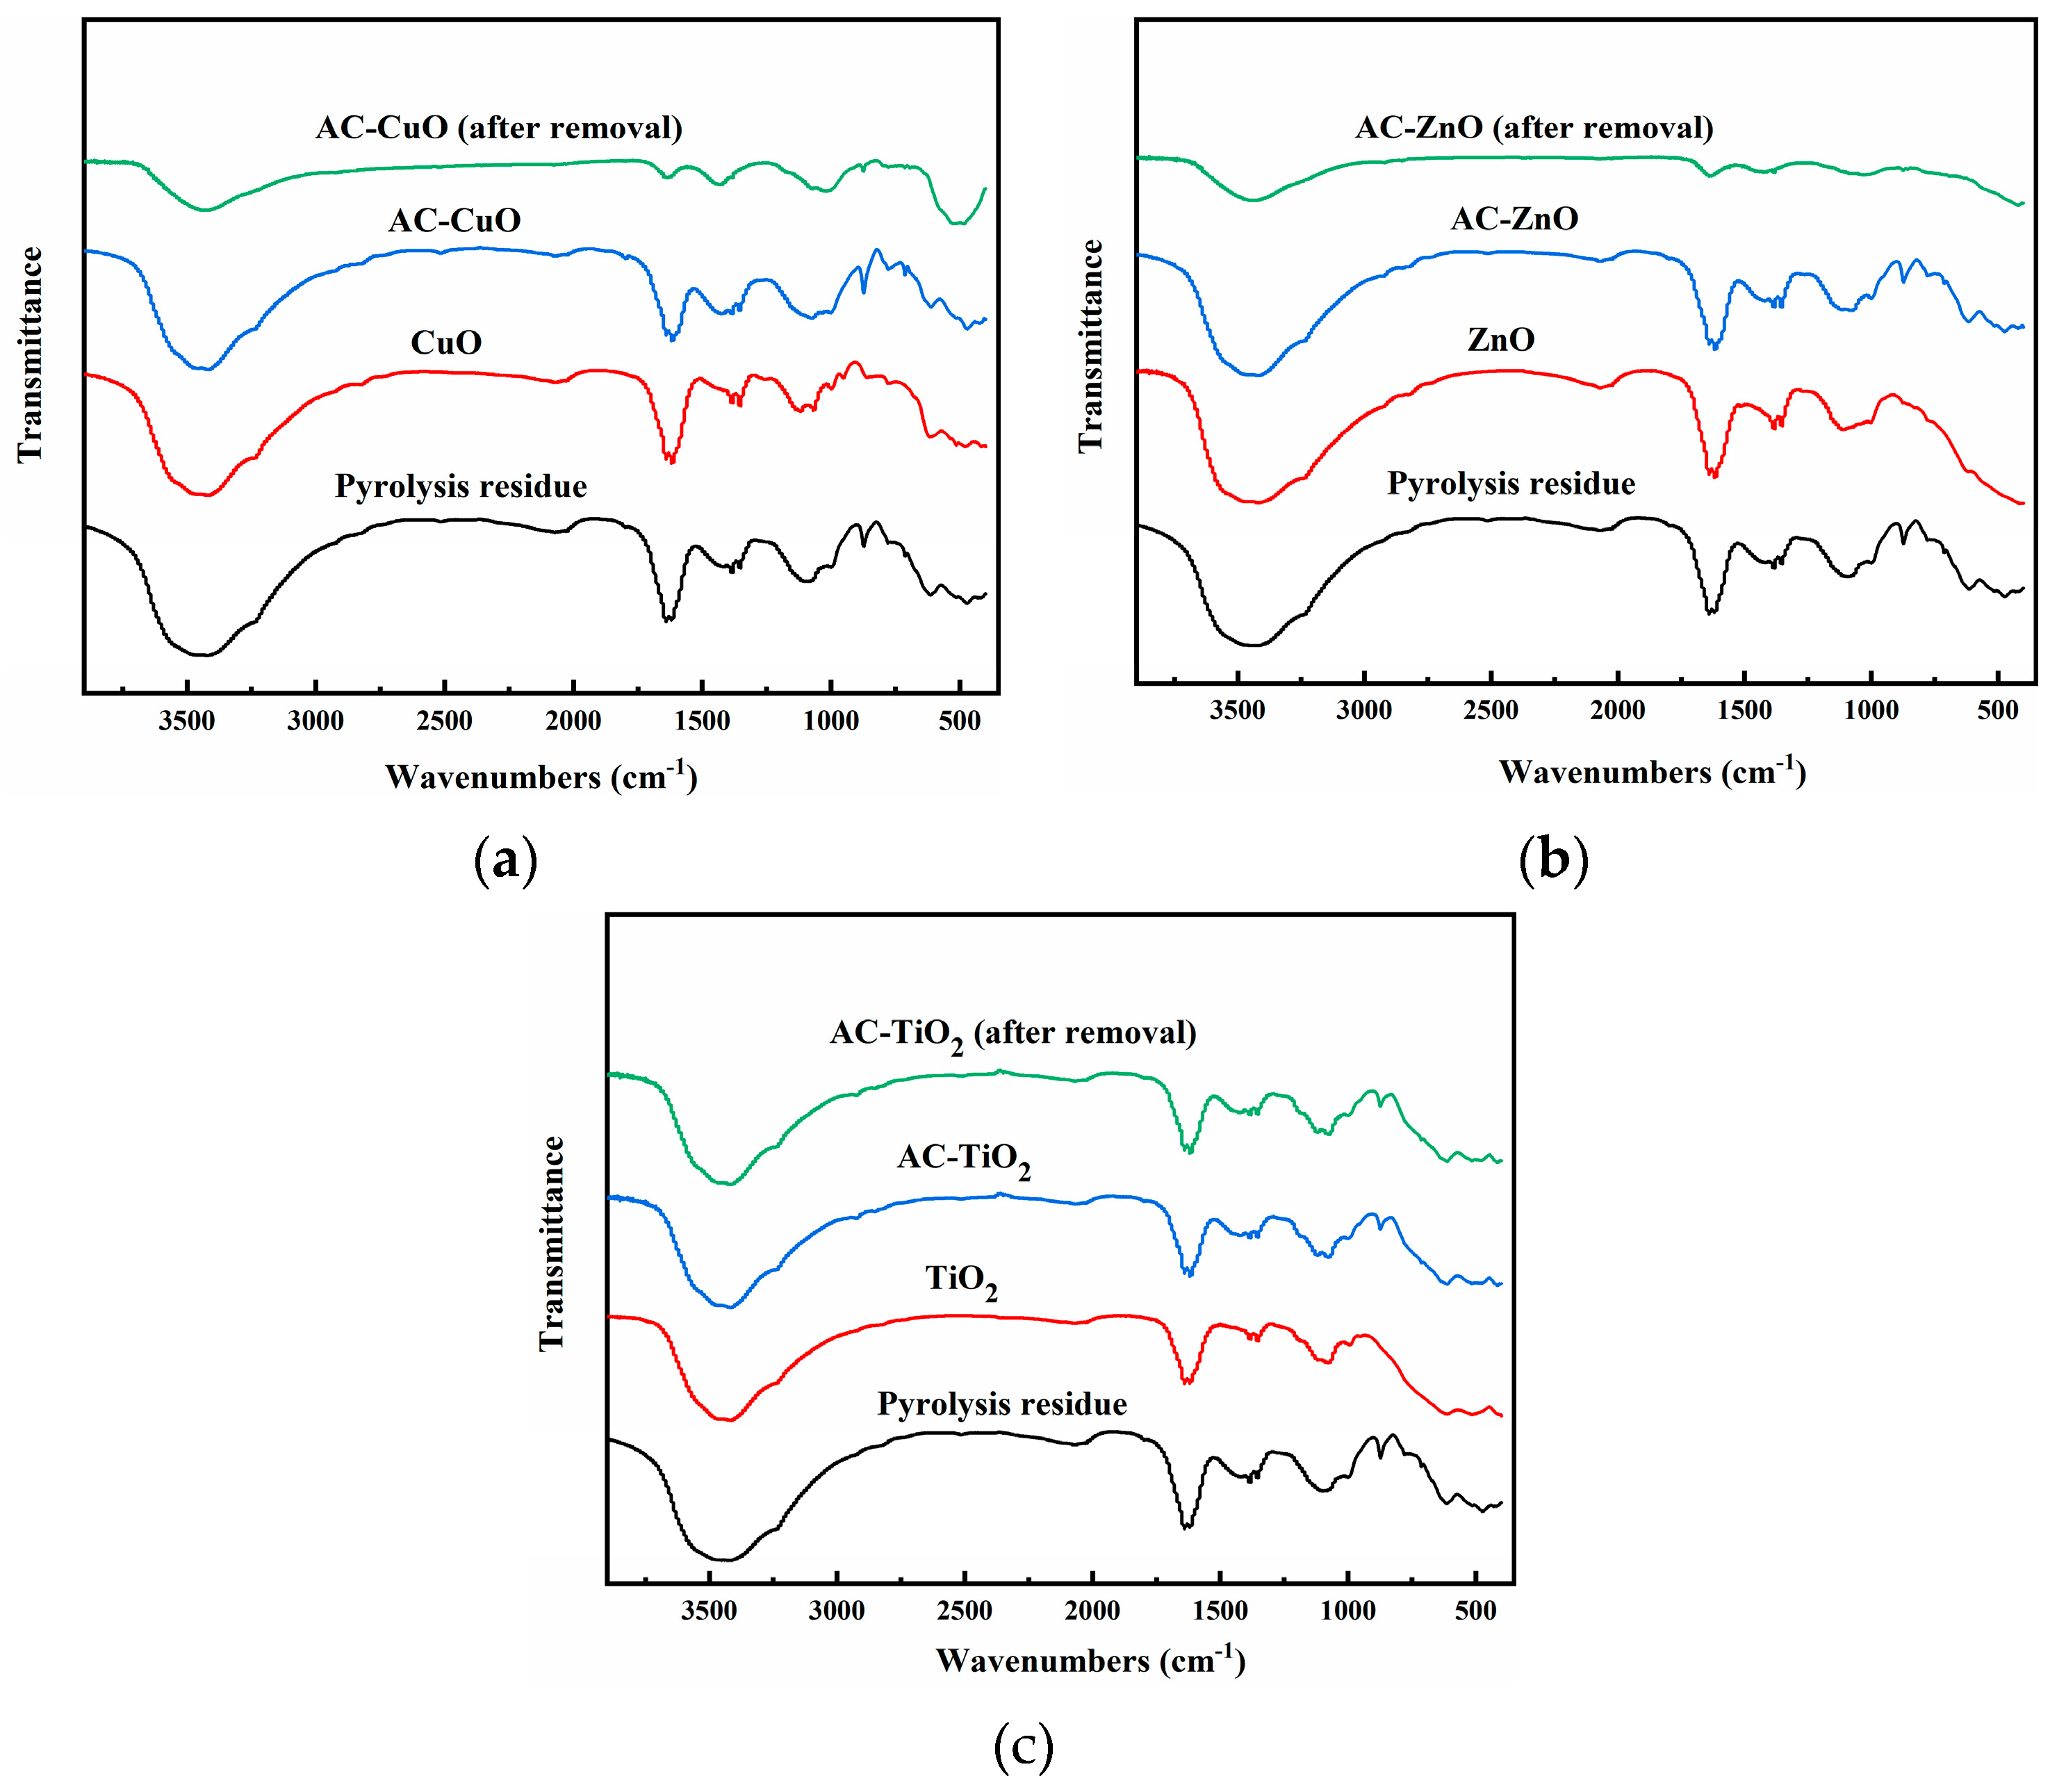
The FT-IR analysis of pyrolysis residue and AC-CuO, AC-ZnO, and AC-TiO2 are shown in Figure 7. It can be seen that the -OH absorption peak and C = C stretching vibration absorption peak of the pyrolysis residue presented at 3421 and 1638 cm−1, respectively, indicating that there were hydroxyl and C = C functional groups on the surface of the residue. There were two absorption peaks at 872 and 613 cm−1, indicating the existence of meta-disubstituted aromatic hydrocarbons on the surface of the pyrolysis residue. The absorption peak near 471 cm−1 may have been caused by the mineral composition in the sludge ash [35]. Compared with that in the pyrolysis residue, the -OH absorption peak of the composite materials weakened due to the supported metal oxide. Among them, the characteristic peaks of CuO, ZnO, and TiO2 presented were between 410 and 610 cm−1 [36], 400 and 600 cm−1 [37], and 400 and 1000 cm−1 [38], respectively, indicating that AC-CuO, AC-ZnO, and AC-TiO2 were successfully prepared.
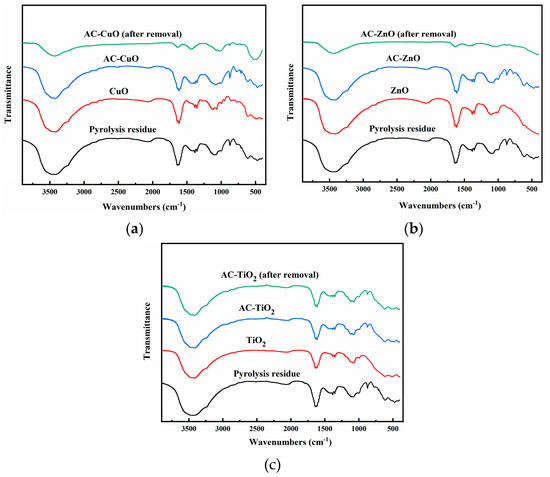
Figure 7.
FT-IR images of residue carrier; (a) AC-CuO; (b) AC-ZnO; and (c) AC-TiO2.
XPS
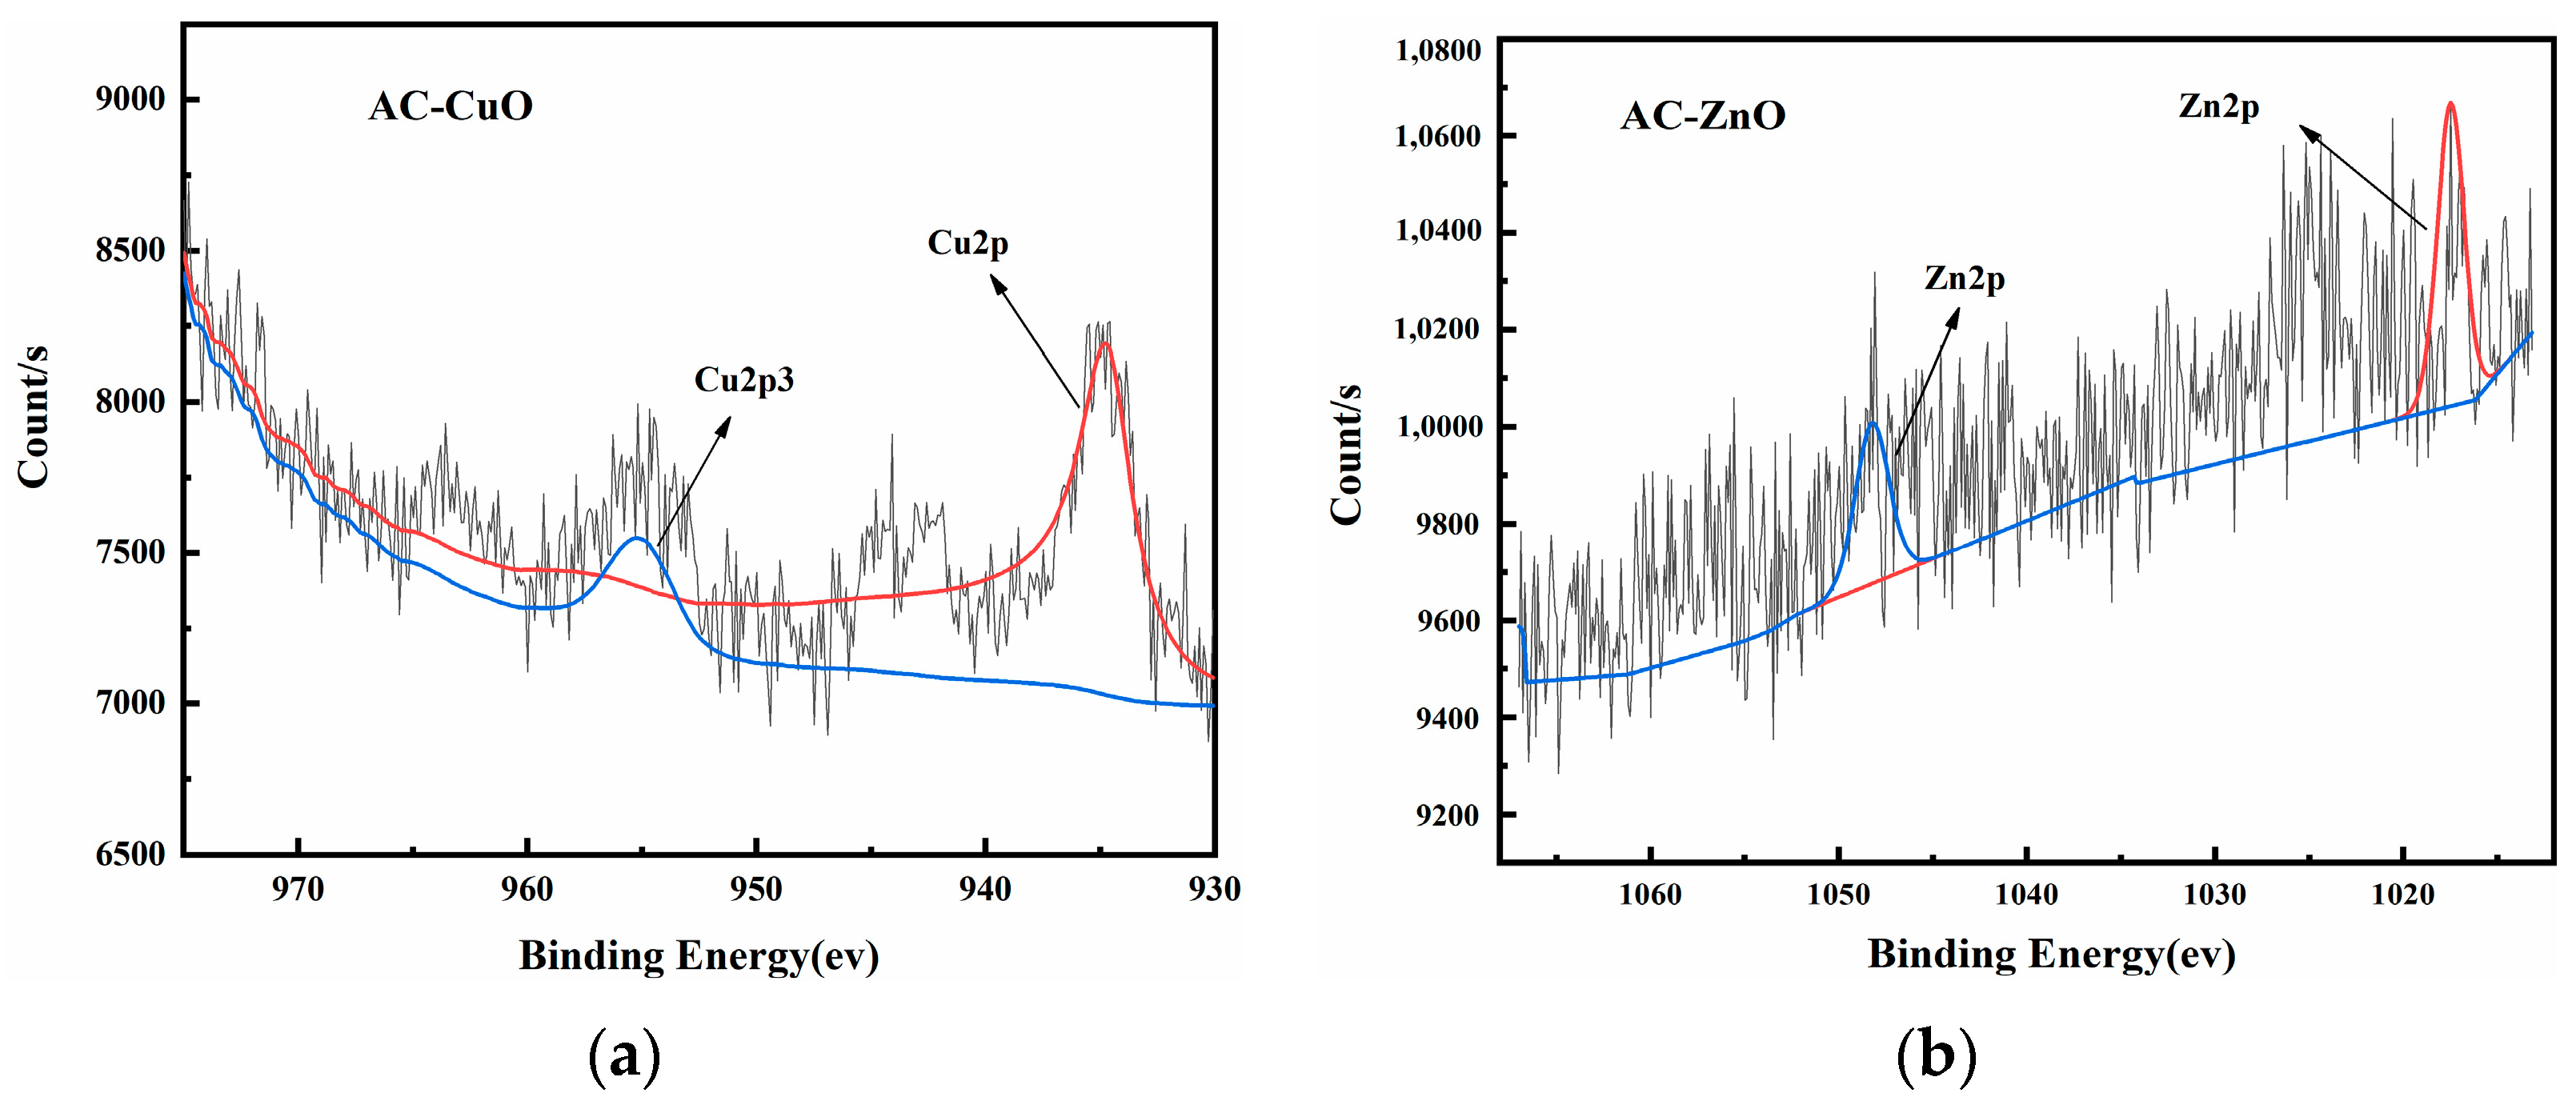
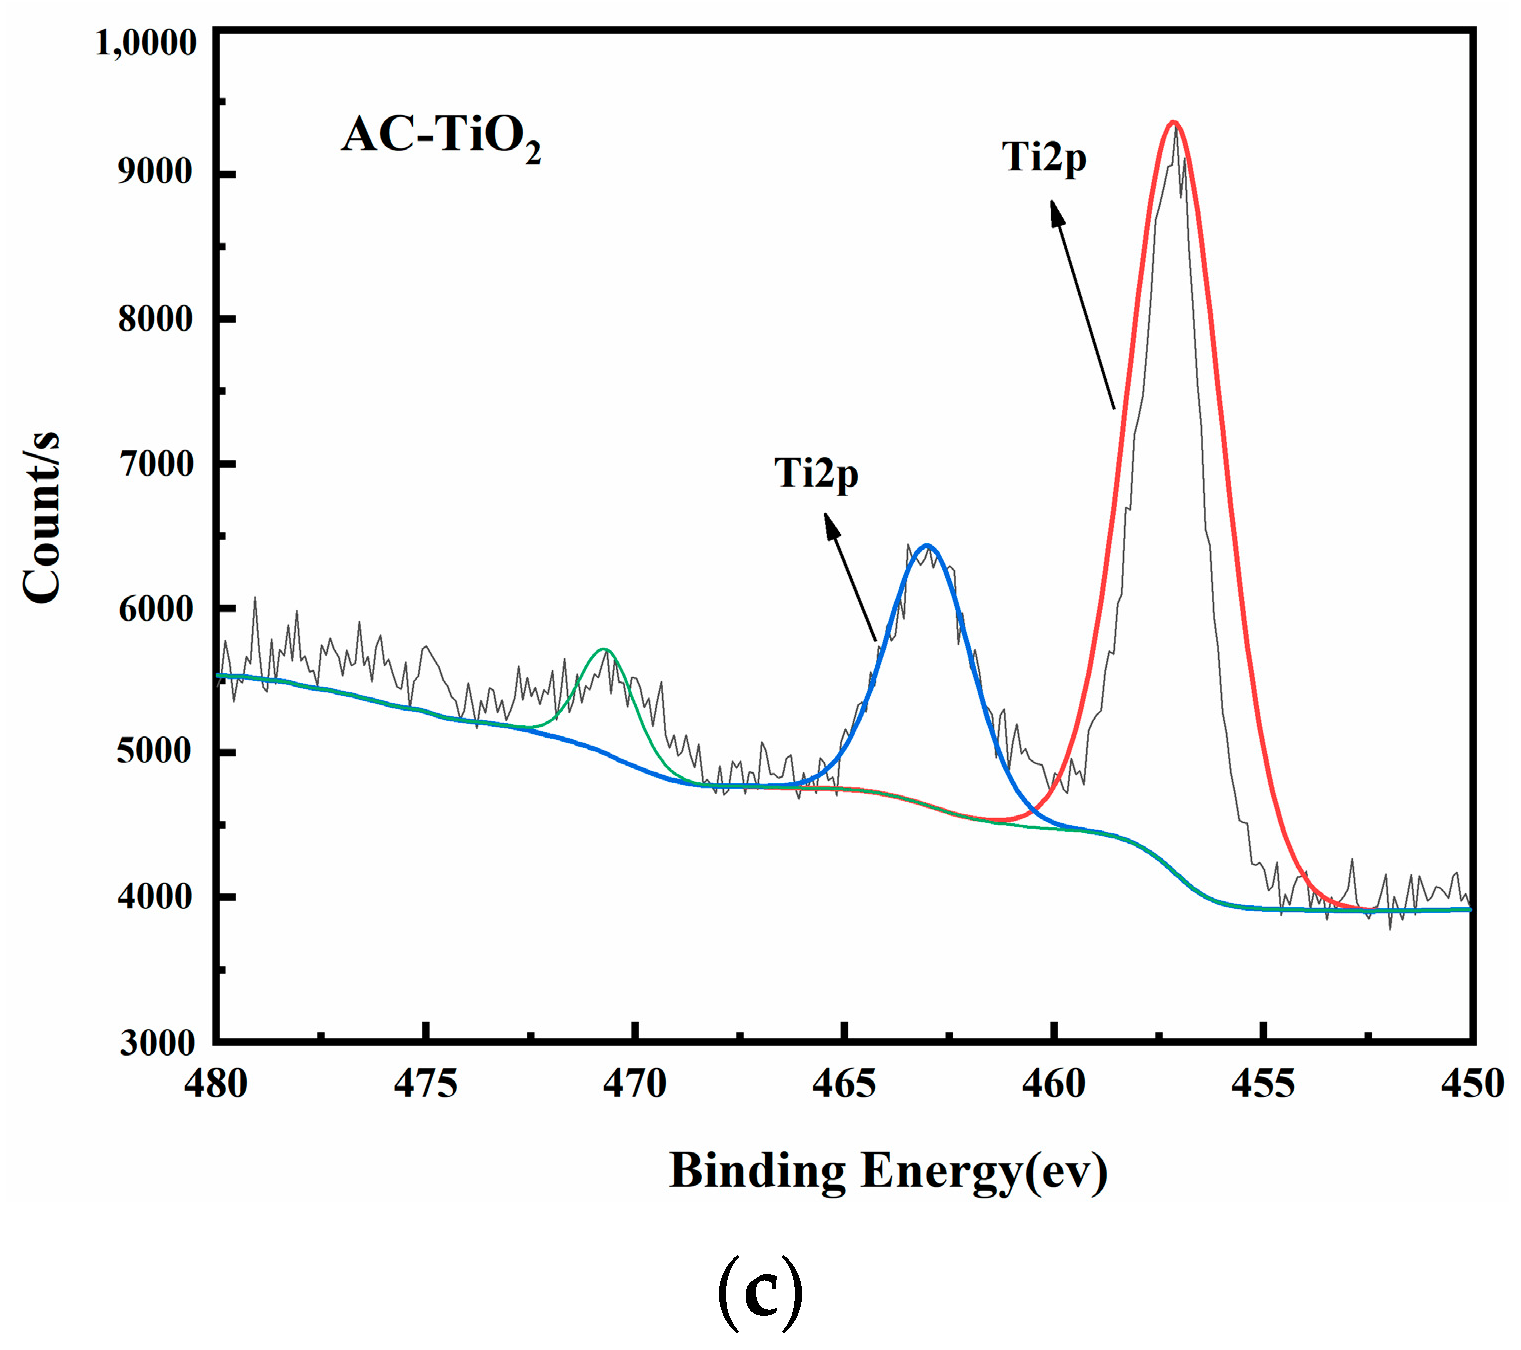
Figure 8 shows the XPS images of AC-CuO, AC-ZnO, and AC-TiO2, respectively. High-resolution XPS spectra of Cu 2p, Zn 2p, and Ti 2p demonstrated the presence of prominent Cu, Zn, and Ti peaks in the composite materials, respectively, indicating that CuO, ZnO, and TiO2 had been attached to the pyrolysis residue.
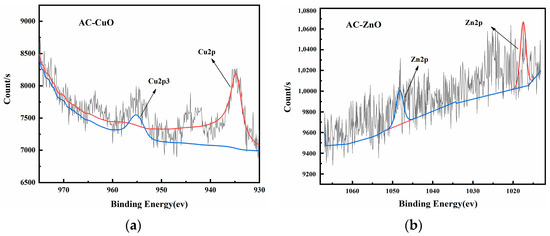

Figure 8.
XPS spectra of (a) AC-CuO; (b) AC-ZnO; and (c) AC-TiO2.
3.3. Influence of Adsorption Conditions
3.3.1. Effect of Composite Material Dosage
Figure 9 shows the effect of different dosages on the removal of methylene blue. It can be seen that the removal effect of methylene blue gradually increased with the increase in the dosage of AC-CuO, AC-ZnO, and AC-TiO2 from 0.5 to 5.5 g/L. This may be due to the fact that more loading provided more surface area and pore structure, thus increasing the available active sites [39].
However, when the dosage of AC-CuO, AC-ZnO, and AC-TiO2 was from 5 to 8.5 g/L, even when the dosage increased, methylene blue removal effect did not change. This can be attributed to the fact that the increase in AC-CuO, AC-ZnO, and AC-TiO2 provided sufficient adsorption sites for the rapid removal of methylene blue solution [40].
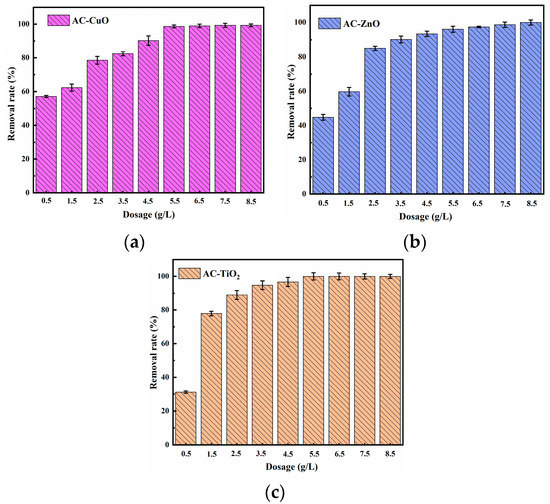
Figure 9.
The effect of (a) AC-CuO; (b) AC-ZnO; (c) AC-TiO2 dosages on the removal of methylene blue (initial concentration = 5 mg/L, contact time = 60 min, temperature = 25 ± 0.5 °C, initial Ph = 7.00).
Figure 9.
The effect of (a) AC-CuO; (b) AC-ZnO; (c) AC-TiO2 dosages on the removal of methylene blue (initial concentration = 5 mg/L, contact time = 60 min, temperature = 25 ± 0.5 °C, initial Ph = 7.00).

3.3.2. Effect of Contact Time
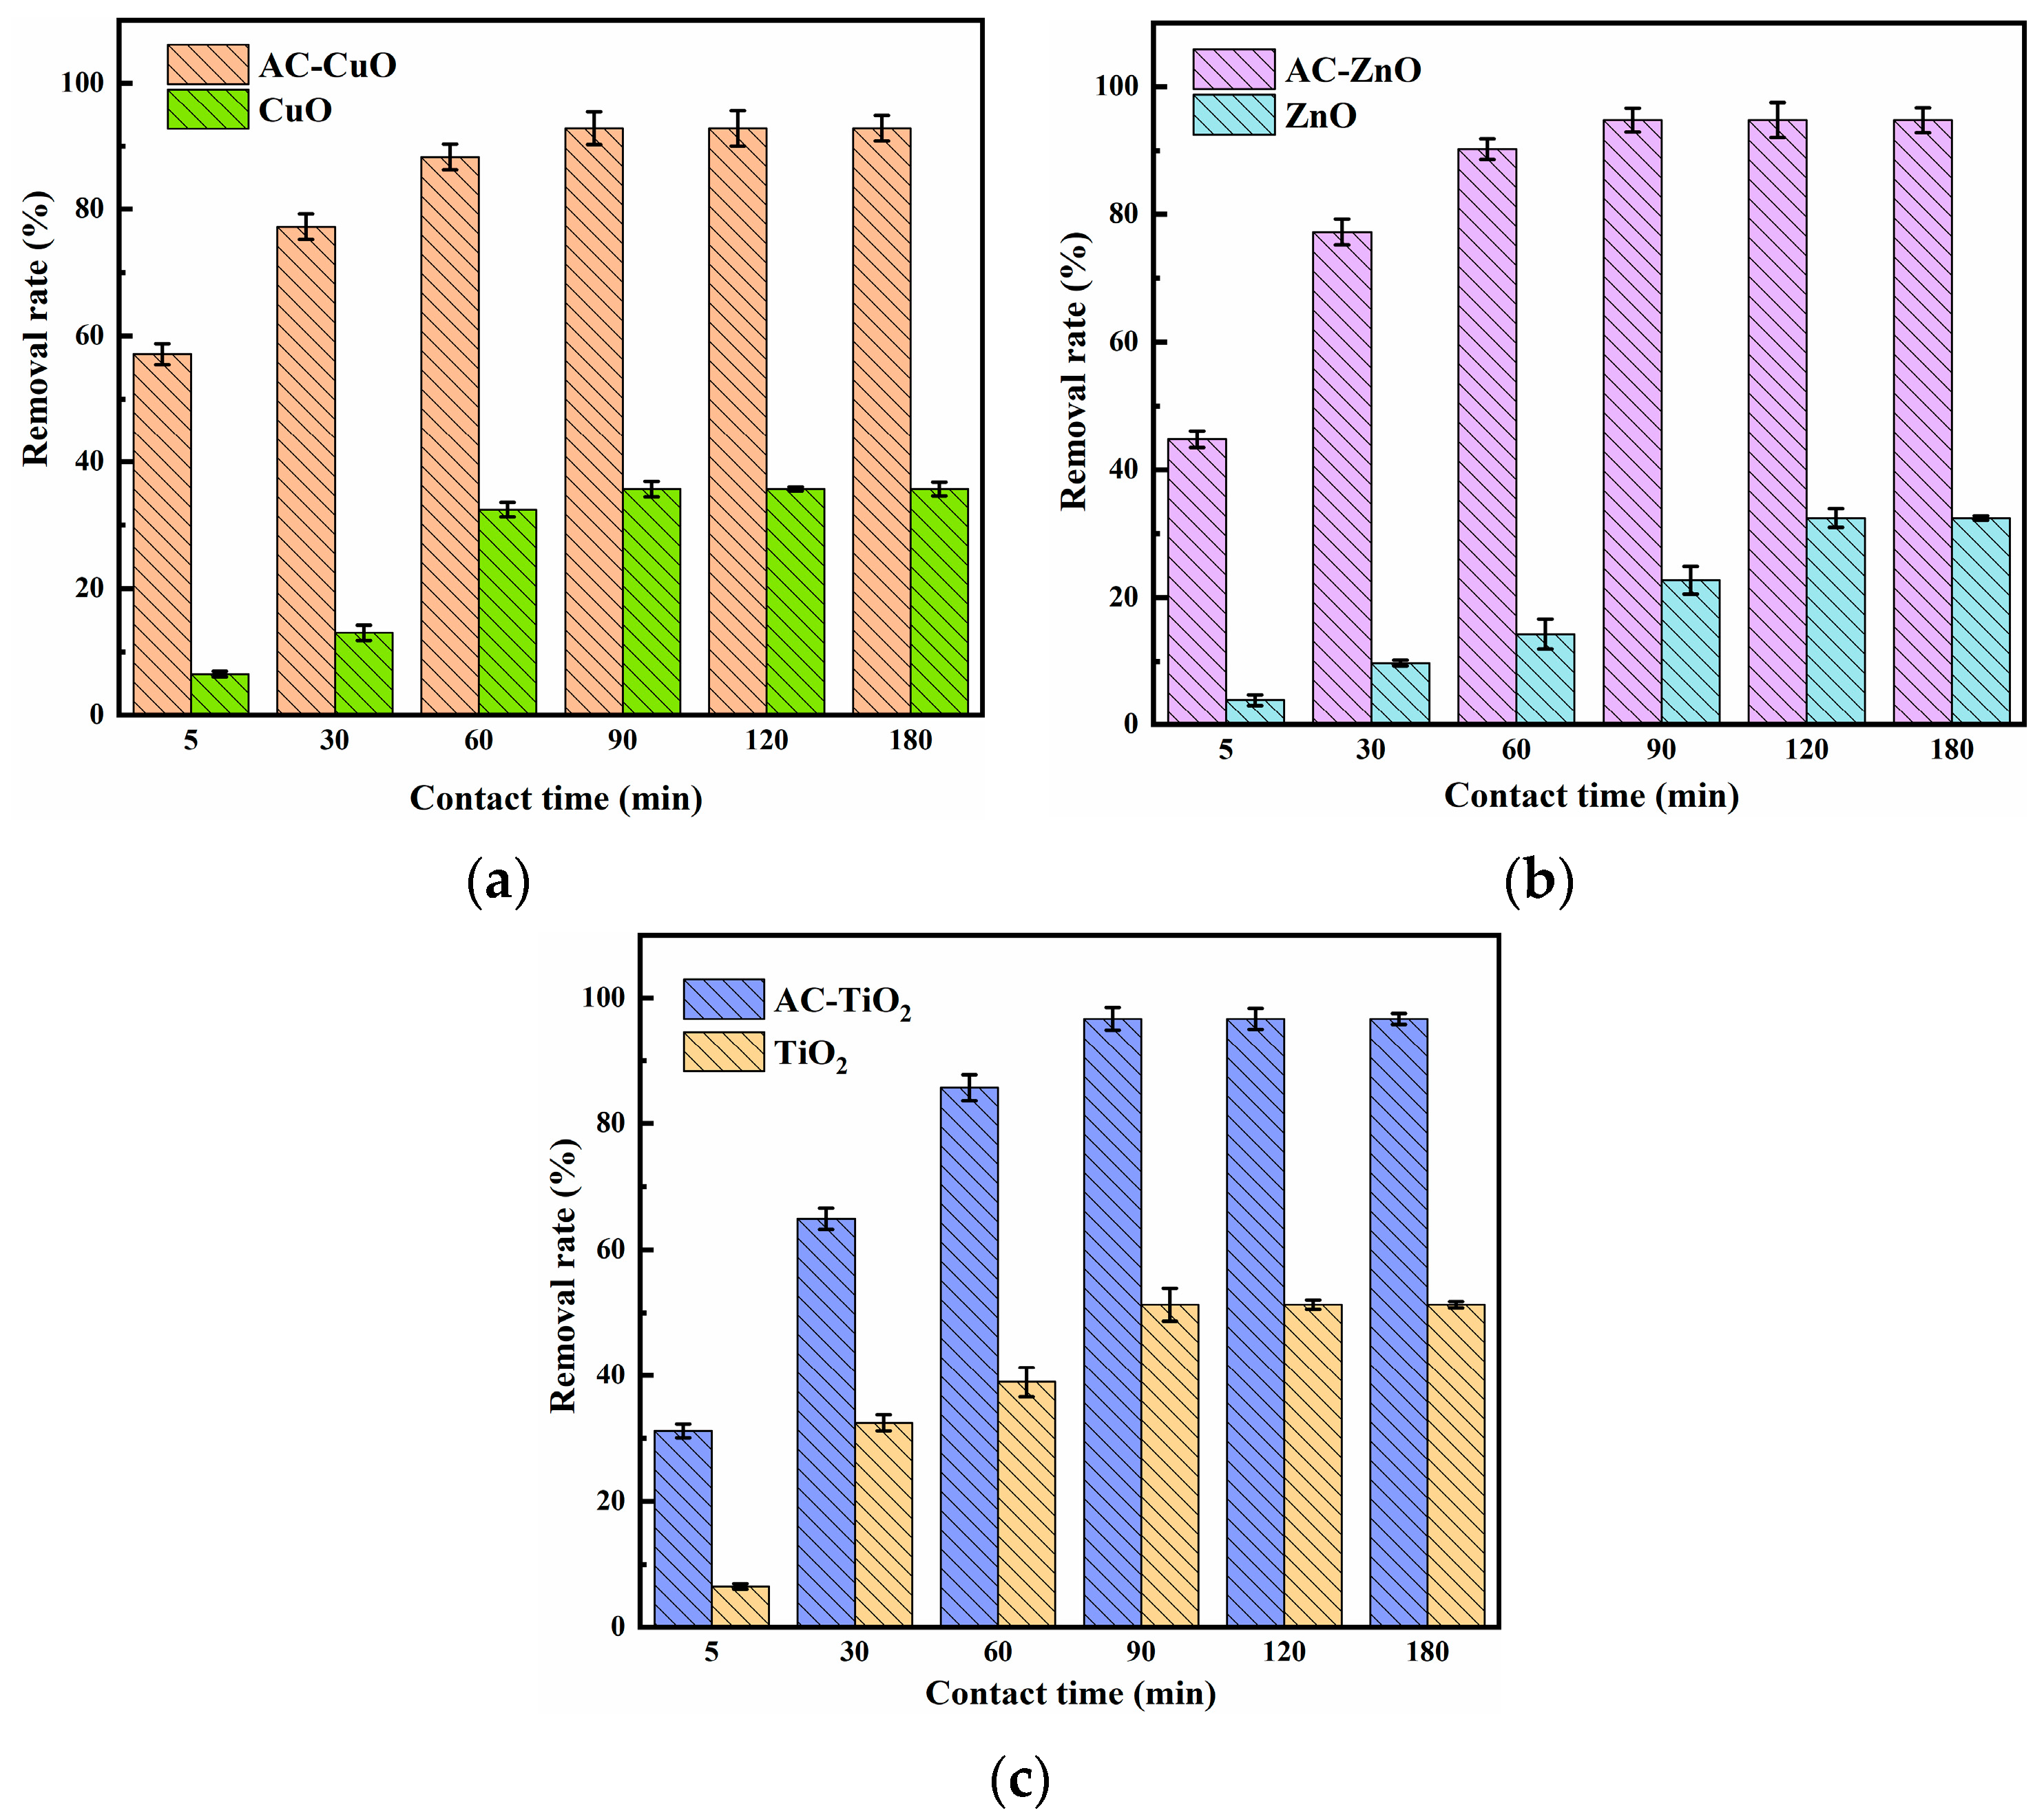
Figure 10 shows the effect of the contact time on the removal of methylene blue. It can be seen that the removal effect of methylene blue by AC-CuO, AC-ZnO, and AC-TiO2 increased rapidly at the initial stage. Additionally, with the prolongation of contact time, the removal effect slowed down and reached equilibrium after 90 min. Furthermore, comparing with CuO, ZnO, and TiO2, AC-CuO, AC-ZnO, and AC-TiO2 were able to improve the removal effect of methylene blue.
At the initial stage of removal, there were many adsorption sites on the surface of AC-CuO, AC-ZnO, and AC-TiO2, and the concentration of the methylene blue was high, the mass transfer driving force was large, and the removal rate was faster [41]. Additionally, with the extension of time, the active sites were gradually occupied by methylene blue, the number of empty active sites decreased, and the adsorption rate was relatively slow [42].
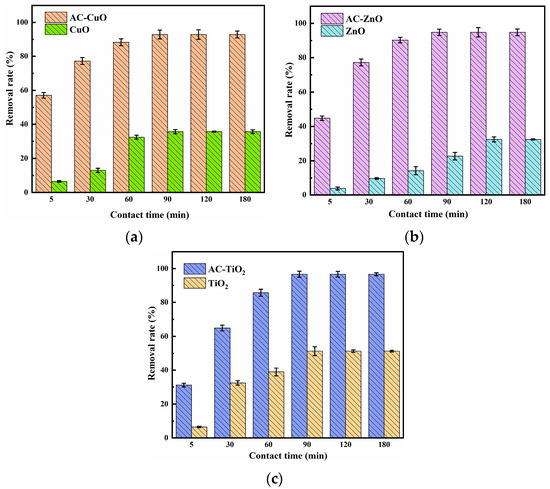
Figure 10.
The effect of (a) AC-CuO; (b) AC-ZnO; (c) AC-TiO2 contact time on the removal of methylene blue (initial concentration = 5 mg/L, dosage = 1 g/L, temperature = 25 ±0.5 °C, initial pH = 7.00).
Figure 10.
The effect of (a) AC-CuO; (b) AC-ZnO; (c) AC-TiO2 contact time on the removal of methylene blue (initial concentration = 5 mg/L, dosage = 1 g/L, temperature = 25 ±0.5 °C, initial pH = 7.00).
3.3.3. Effect of Concentration
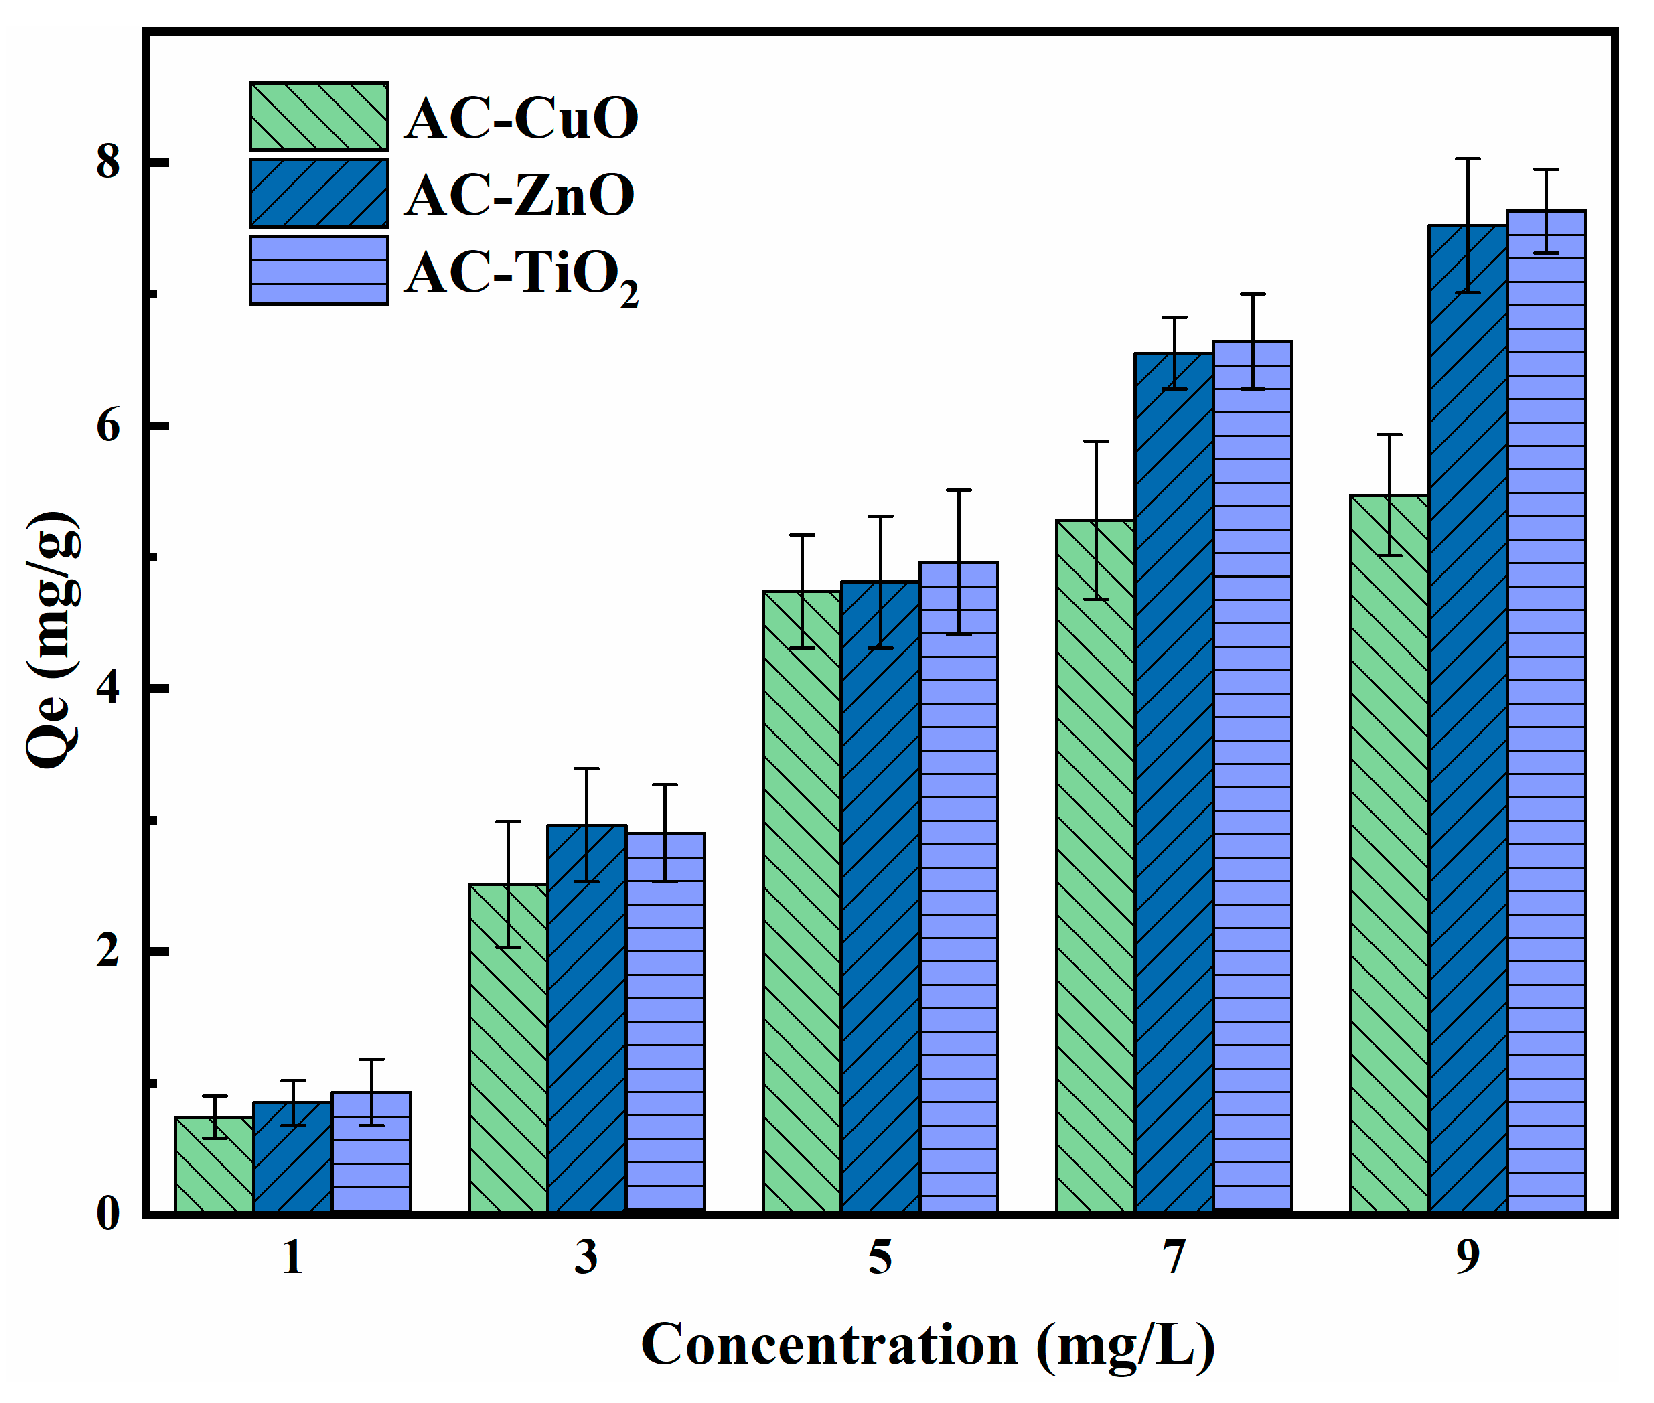
Figure 11 shows the effect of concentration on the removal of methylene blue. The removal capacity of AC-CuO, AC-ZnO, and AC-TiO2 increased with an increase in methylene blue concentration. This can be attributed to the increased effective collisions between the AC-CuO, AC-ZnO, and AC-TiO2 and methylene blue, resulting in higher removal capacity for the methylene blue solution [43].

Figure 11.
The effect of concentration on the removal of methylene blue (contact time = 90 min, dosage = 1 g/L, temperature = 25 ± 0.5 °C, initial pH = 7.00).
3.4. Removal Parameters Optimization
Table 3 shows that the regression model had a good fit and high experimental accuracy. Therefore, the results of the quadratic polynomial regression equation (Equations (10)–(12)) were credible. Based on the optimization results in the equations, it can be inferred that: (1) when the dosage was 4.20 g/L, the contact time was 106.48 min and the concentration was 5 mg/L, the removal effect of AC-CuO on methylene blue was 95.28%, and the corresponding removal capacity was 4.76 mg/g; (2) when the dosage was 4.25 g/L, the contact time was 80.78 min and the concentration was 5 mg/L, the removal effect of AC-ZnO on methylene blue was 94.95%, and the corresponding removal capacity was 4.75 mg/g; and (3) when the dosage was 4.50 g/L, the time was 84.95 min and the concentration was 5 mg/L, the removal effect of AC-TiO2 on methylene blue was 96.96%, and the corresponding removal capacity was 4.85 mg/g.
Table 3.
Significance analysis results of the response surface regression model of the methylene blue removal effect.
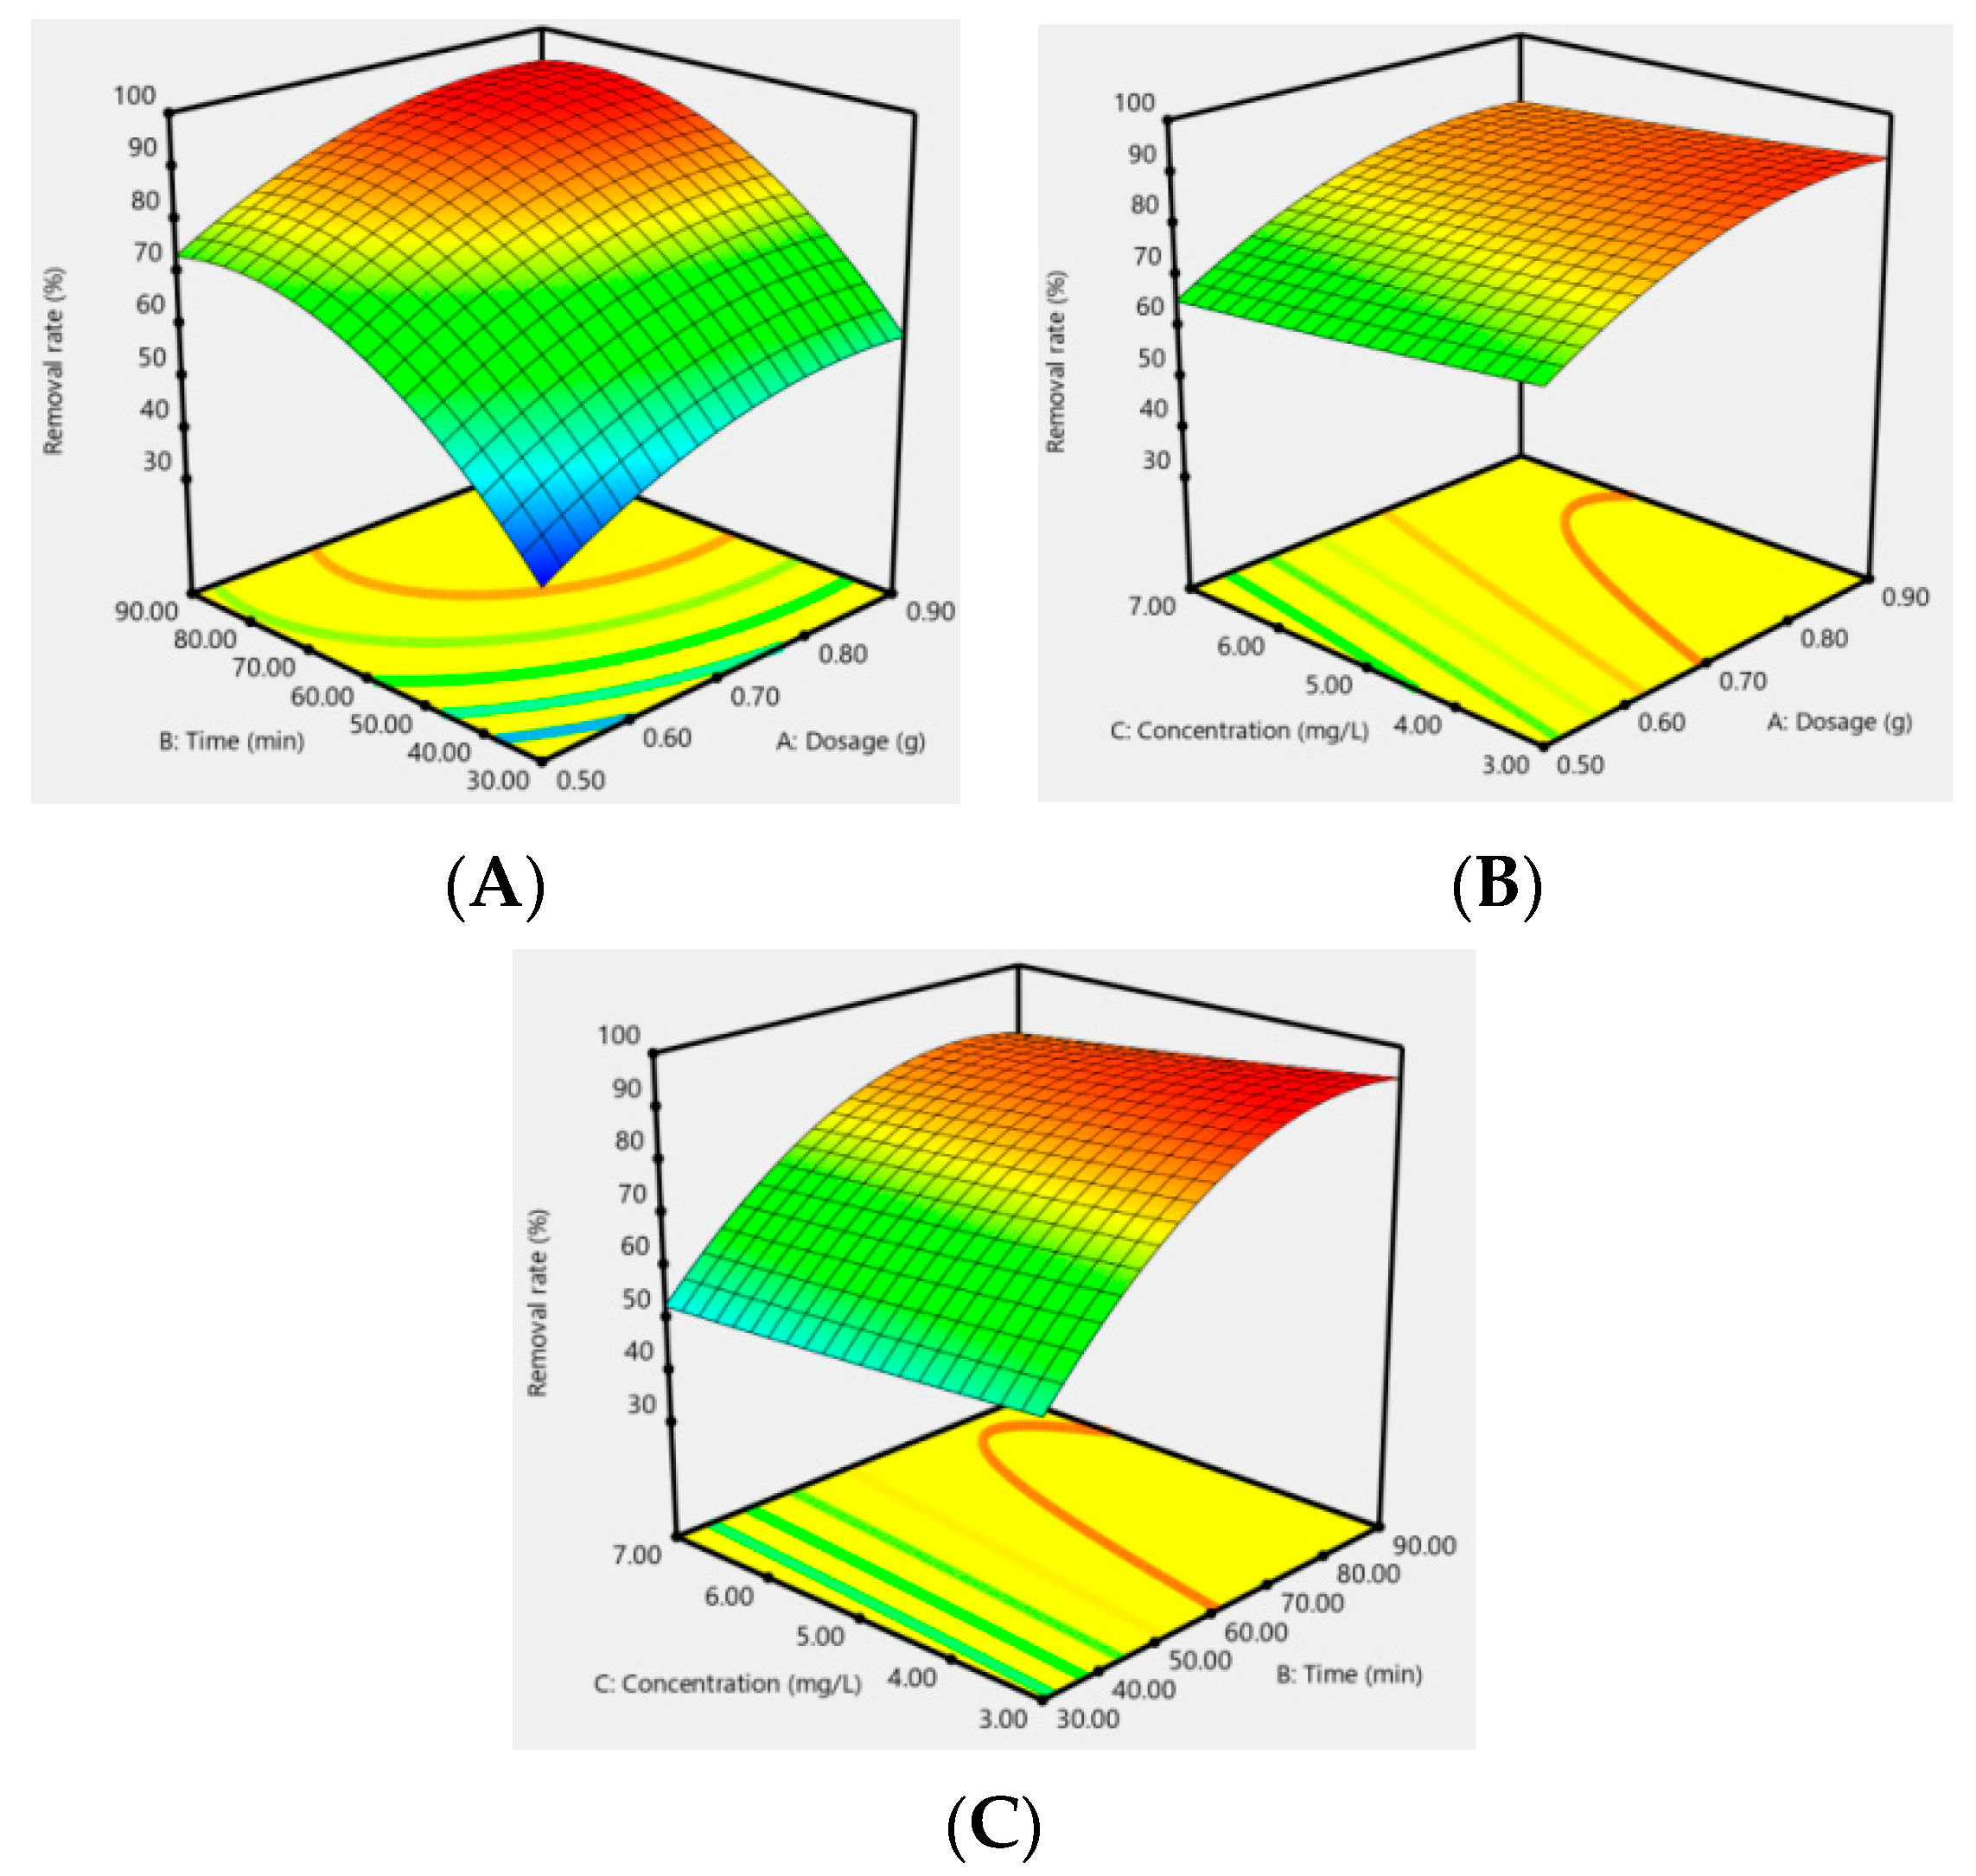
In addition, the effect of the response surfaces of AC-CuO, AC-ZnO, and AC-TiO2 under different conditions on the removal effect of methylene blue are shown in Figure 12, Figure 13 and Figure 14. It can be seen that when the concentration was constant, the contact time had a greater impact on the removal effect of methylene blue than its dosage; when the contact time was constant, the dosage had a greater impact than its concentration; and when the dosage was constant, the contact time had a greater effect than its concentration. As a matter of fact, the factors of AC-CuO, AC-ZnO, and AC-TiO2 exhibited the similar trend of methylene blue removal. Therefore, the strength of the effect of AC-CuO, AC-ZnO, and AC-TiO2 on the removal of methylene blue with different dosage, contact time, and concentration can be given in the order contact time > dosage > concentration.
RAC-CuO = 79.71 + 12.12A + 14.52B−3.69C − 0.56AB + 0.15AC + 0.52BC − 7.92A2 − 4.56B2 + 1.10C2
RAC-ZnO = 85.03 + 9.93A + 17.60B − 3.19C + 0.055AB + 0.33AC − 0.87BC − 6.51A2 − 12.73B2 + 0.31C2
RAC-TiO2 = 83.47 + 4.37A + 25.01B − 3.92C − 0.12AB + 0.055AC + 0.083BC − 1.22A2 − 14.97B2 + 0.22C2
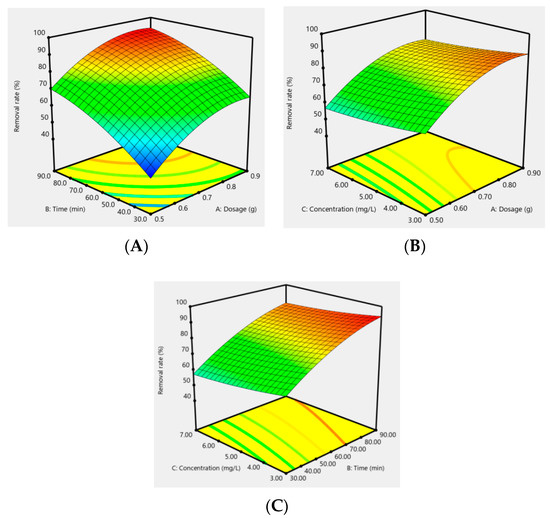
Figure 12.
Response surface of the dosage (A), contact time (B), and concentration (C) of AC-CuO on the removal effect of methylene blue.

Figure 13.
Response surface of the dosage (A), contact time (B), and concentration (C) of AC-ZnO on the removal effect of methylene blue.
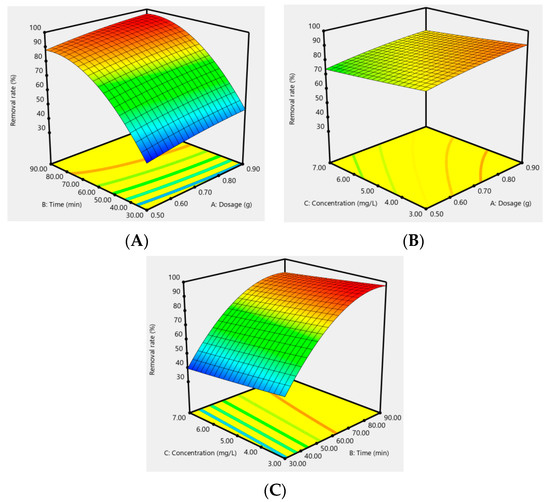
Figure 14.
Response surface of the dosage (A), contact time (B), and concentration (C) of AC-TiO2 on the removal effect of methylene blue.
3.5. Kinetic and Diffusion Studies
Figure 15 is the kinetics model of AC-CuO, AC-ZnO, and AC-TiO2, and the correlation coefficients are shown in Table 4, from which we can see that the McKay kinetic model was a better fit than the Lagergren model. The adsorption process described by the McKay kinetic model was accompanied by the formation of chemical bonds. It can be inferred that the main form of adsorption of methylene blue was chemical adsorption [44].
In addition, in order to understand the rate-limiting step for the removal of methylene blue, a fit to the actual data was performed using an intra-particle diffusion model (Table 5). The correlation coefficients of AC-CuO, AC-ZnO, and AC-TiO2 for the intraparticle diffusion model were 0.83, 0.80, and 0.85, respectively, and the intercepts were b≠0. This indicates that the intraparticle diffusion could not describe the whole process of removing methylene blue, thus, it can be inferred that the removal of methylene blue may be controlled by both liquid film diffusion and intraparticle diffusion [45].
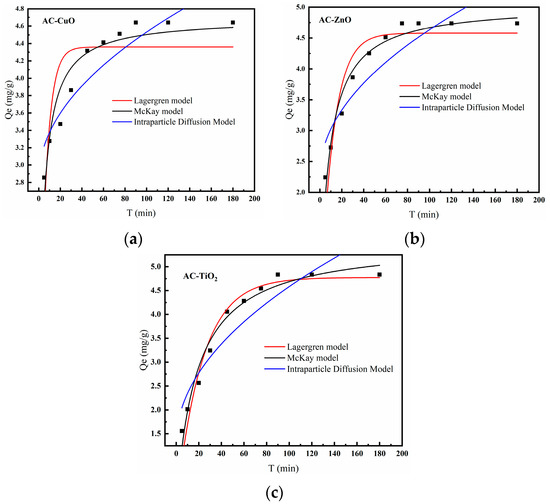
Figure 15.
Kinetics model of (a) AC-CuO, (b) AC-ZnO, and (c) AC-TiO2.
Figure 15.
Kinetics model of (a) AC-CuO, (b) AC-ZnO, and (c) AC-TiO2.
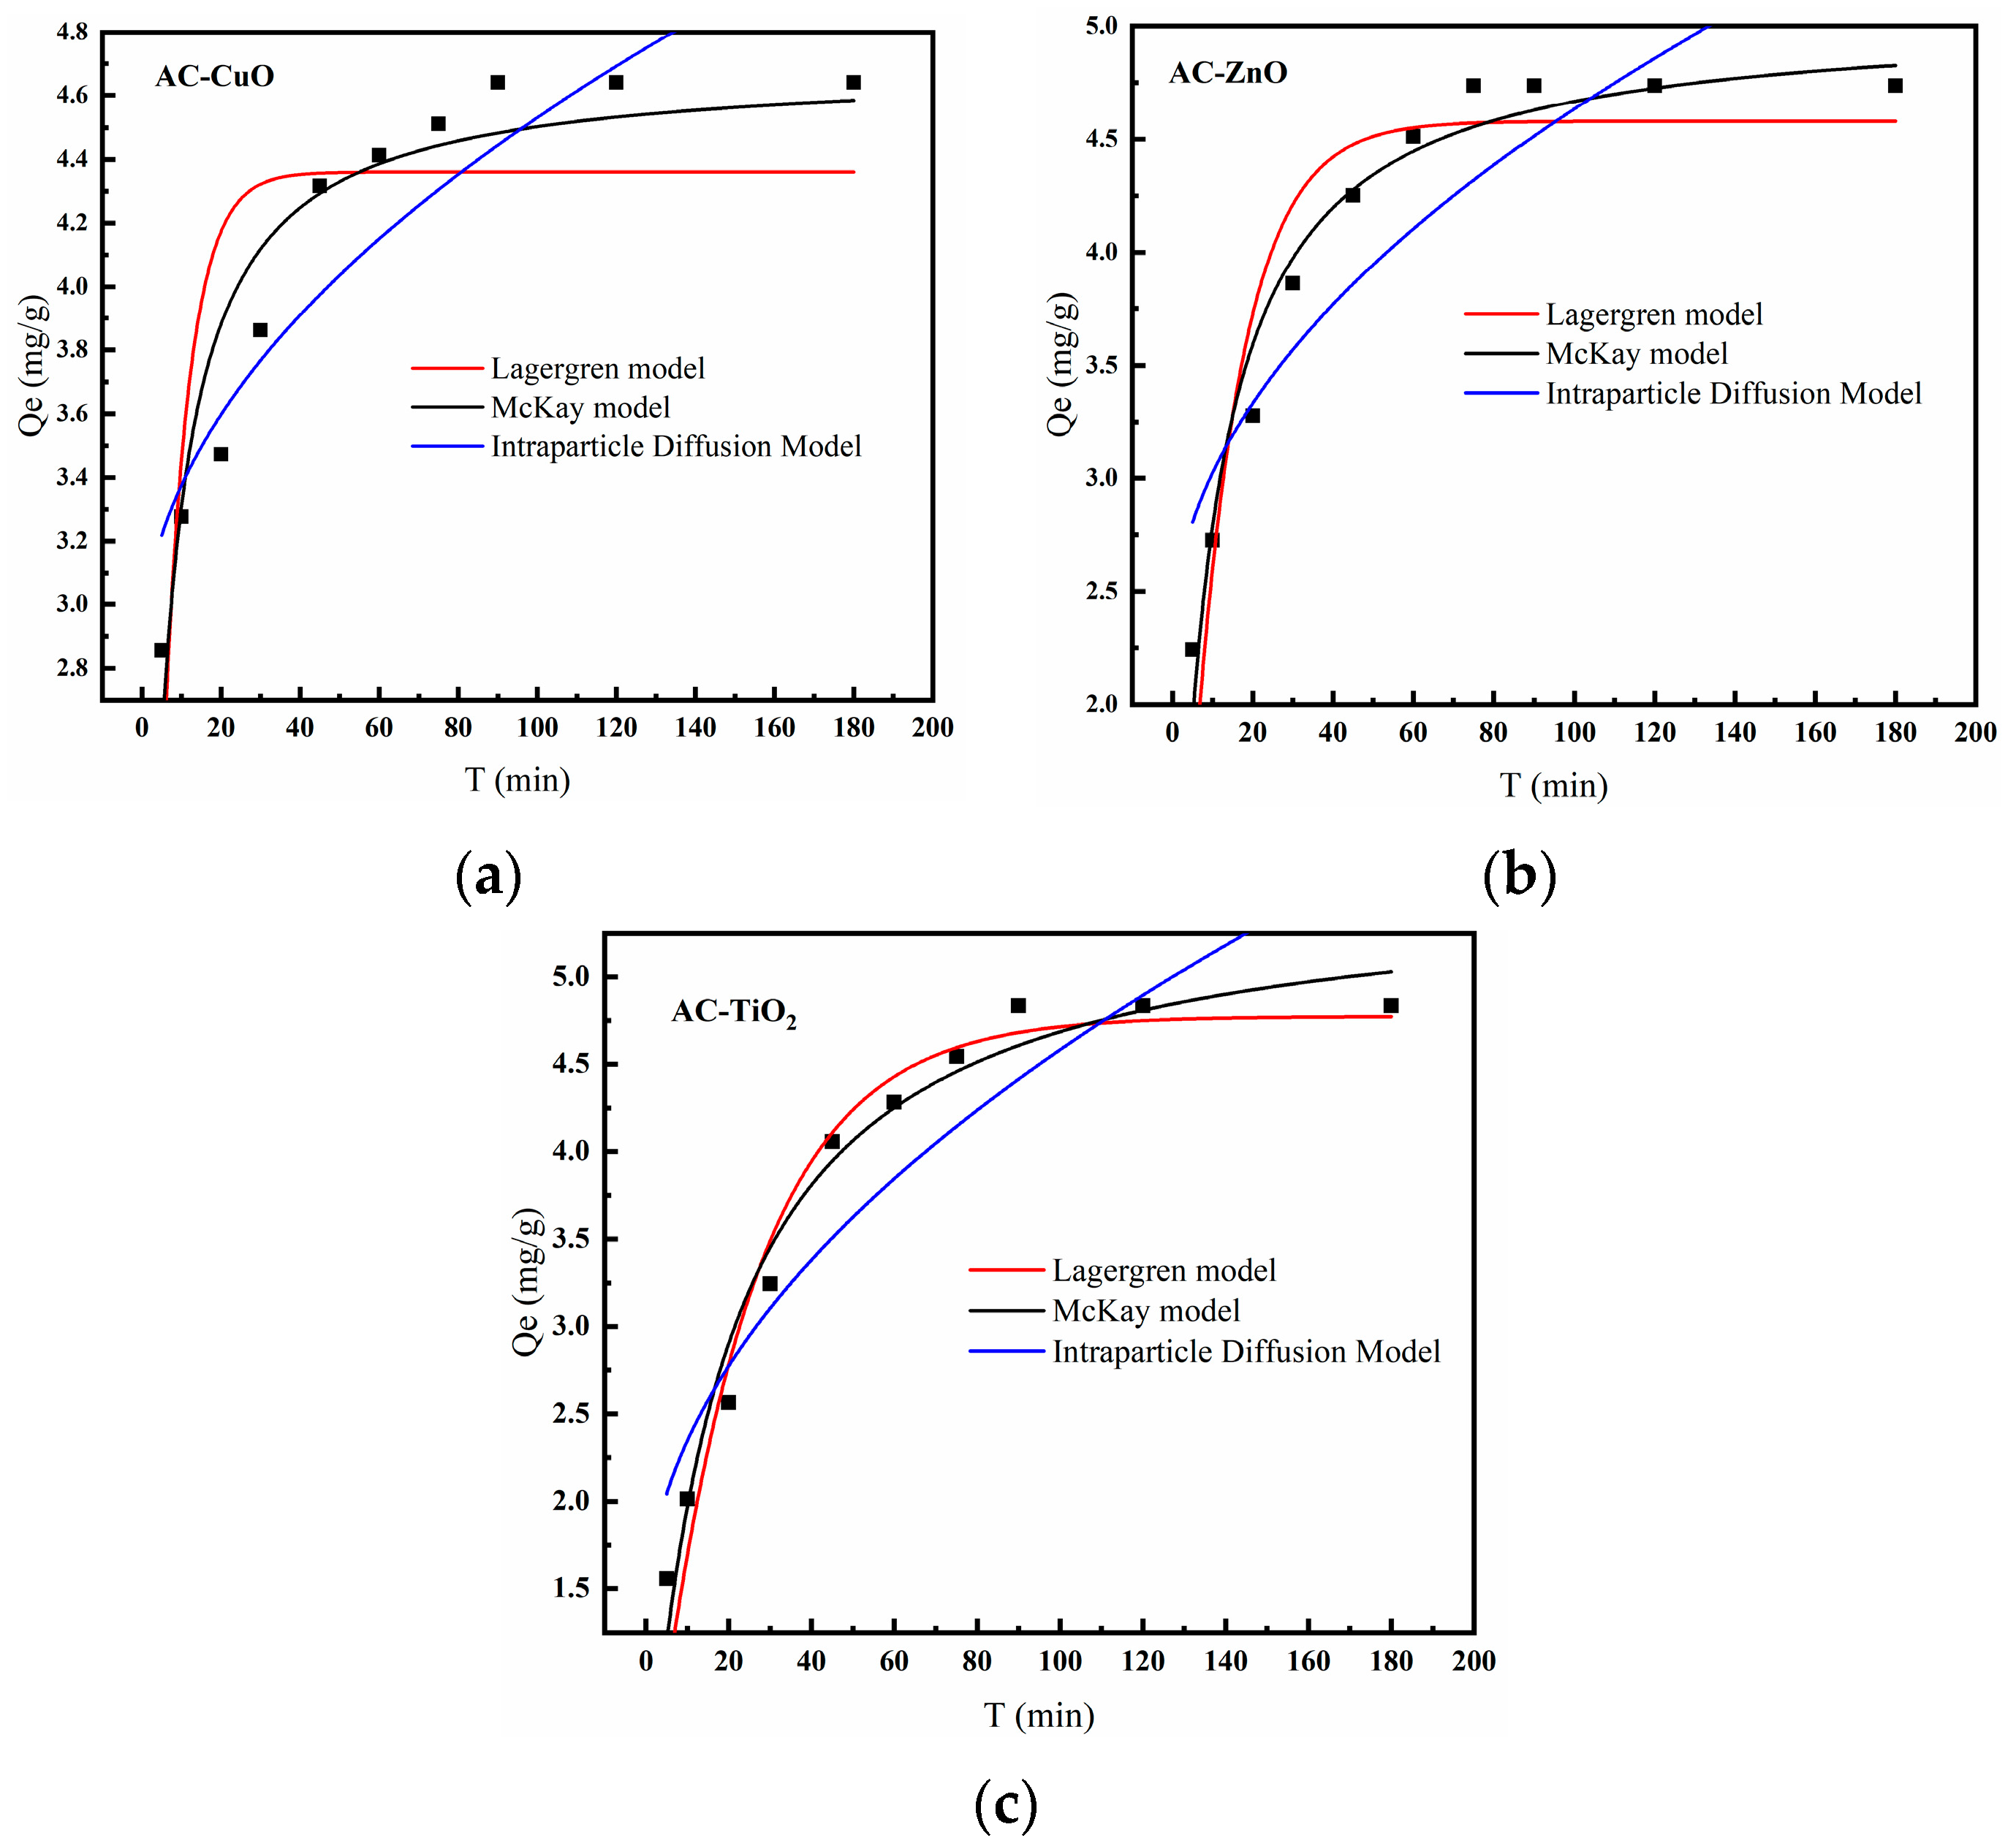
Table 4.
Summary of correlation coefficients for kinetic model fitting.
Table 4.
Summary of correlation coefficients for kinetic model fitting.
| Adsorption Model | Lagergren Model | McKay Model | ||||
|---|---|---|---|---|---|---|
| Composite material | AC-CuO | AC-ZnO | AC-TiO2 | AC-CuO | AC-ZnO | AC-TiO2 |
| Nonlinear expression | ||||||
| Fitting parameters | Qe = 4.3604 K1 = 0.1573 | Qe = 4.5795 K1 = 0.0840 | Qe = 4.7746 K1 = 0.0437 | Qe = 4.6903 K2 = 0.0511 | Qe = 5.0446 K2 = 0.0245 | Qe = 5.5352 K2 = 0.0099 |
| R2 | 0.68 | 0.88 | 0.95 | 0.90 | 0.96 | 0.97 |
Table 5.
Summary of correlation coefficients for intraparticle diffusion model fits.
Table 5.
Summary of correlation coefficients for intraparticle diffusion model fits.
| Adsorption Model | Intra-Particle Diffusion Model | ||
|---|---|---|---|
| Composite material | AC-CuO | AC-ZnO | AC-TiO2 |
| Nonlinear expression | |||
| Fitting parameters | Kd = 0.1689 b = 2.8412 | Kd = 0.2355 b = 2.2788 | Kd = 0.3270 b = 1.3115 |
| R2 | 0.83 | 0.80 | 0.85 |
3.6. Isotherm Studies
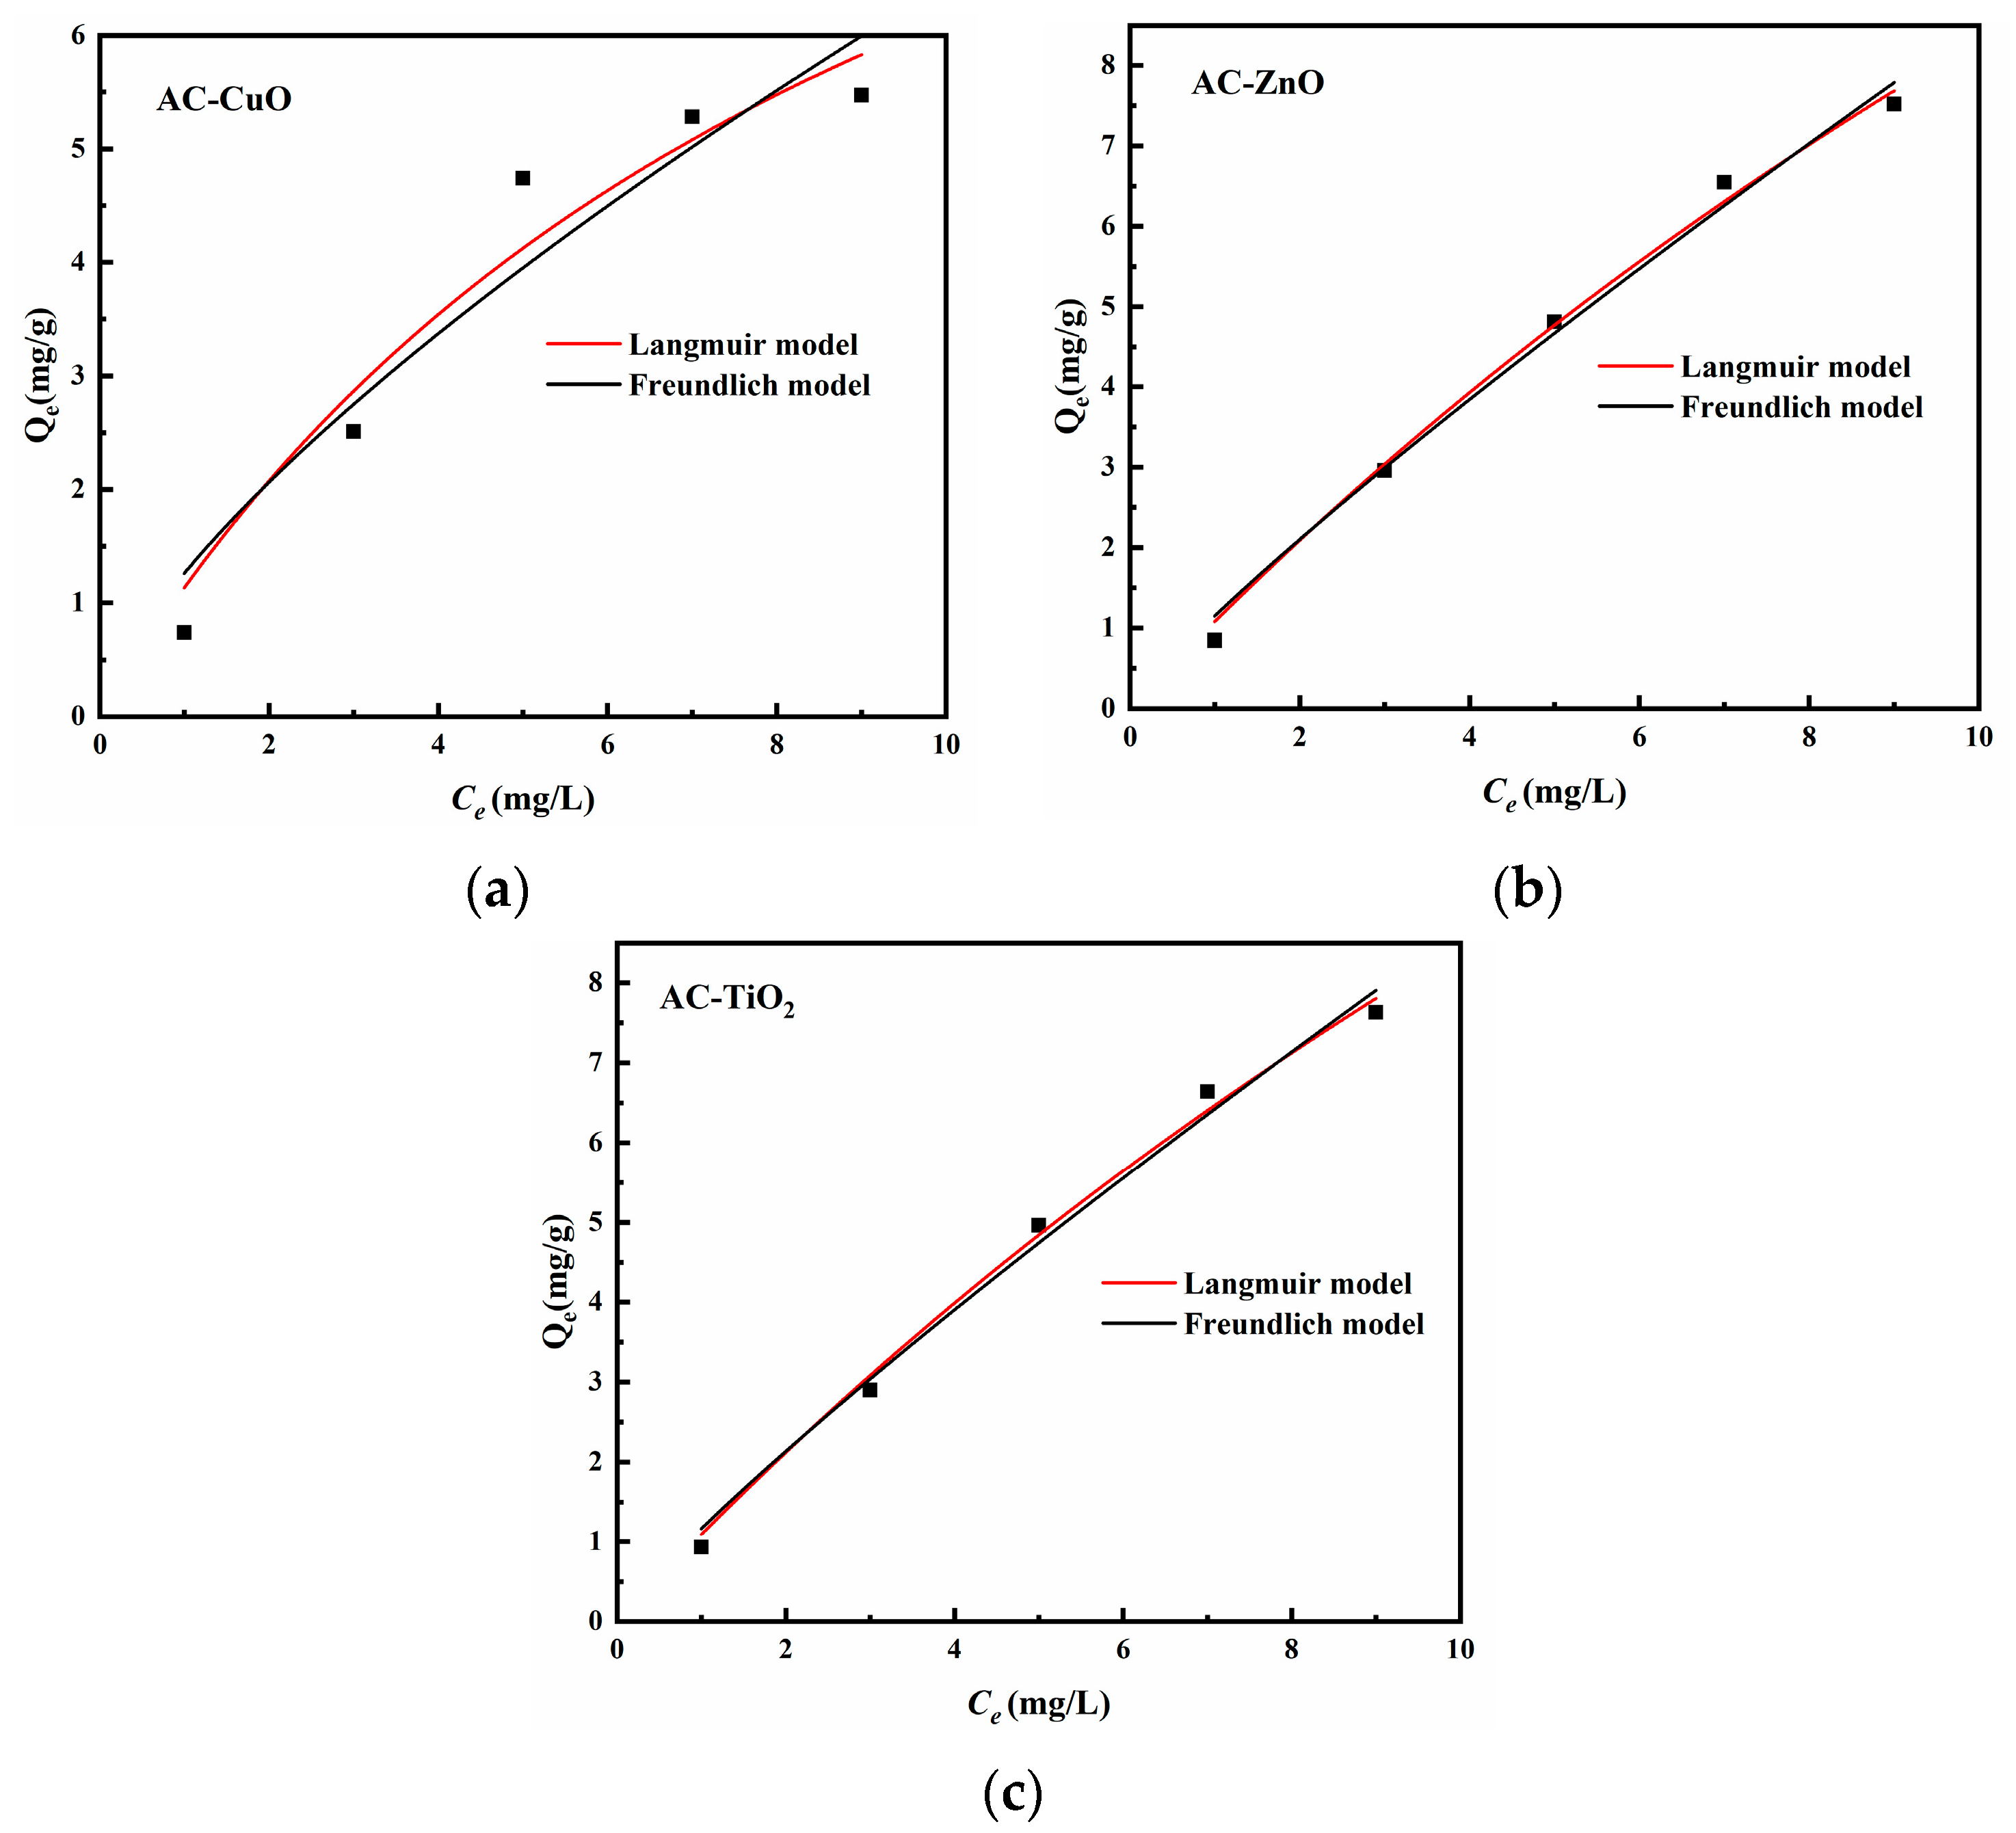
Figure 16 is the isotherm model of AC-CuO, AC-ZnO, and AC-TiO2, and the correlation coefficients are shown in Table 6. We found that both the Langmuir adsorption isotherm model and Freundlich adsorption isotherm could describe the removal process of methylene blue (R2 > 0.9). Therefore, it can be considered that the adsorption sites of AC-CuO, AC-ZnO, and AC-TiO2 for methylene blue were uniformly distributed and had the same affinity, and the adsorption process was mainly represented by chemical adsorption [46].
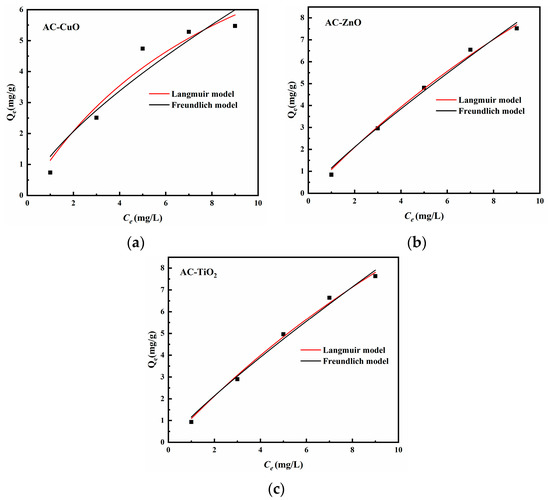
Figure 16.
Isotherm model of (a) AC-CuO, (b) AC-ZnO, and (c) AC-TiO2.
Table 6.
Summary of correlation coefficients for kinetic model fitting.
3.7. Regeneration Studies
Table 7 shows the regeneration numbers on the removal effect of methylene blue. It can be seen that the secondary removal effect was 90 ± 2%. After three regenerations, the removal effects of AC-CuO, AC-ZnO, and AC-TiO2 dropped to 79.50%, 66.60%, and 66.85%, respectively. This may be due to the active sites on the surface being slowly occupied with the repeated use of the composite materials, resulting in the gradual blockage of the pore size, resulting in a continuous decrease in the removal performance.
Table 8 shows the regeneration loss rates for the removal of methylene blue. It can be seen that the regeneration loss rates of AC-CuO, AC-ZnO, and AC-TiO2 increased from 4.24, 6.12, 4.83 to 25.33, 30.17, and 34.24 in four cycles.
Combining the removal effect of methylene blue and the regeneration loss rate of AC-CuO, AC-ZnO, and AC-TiO2, which indicates that AC-CuO, AC-ZnO, and AC-TiO2 had relative stability for methylene blue removal.
Table 7.
Influence of regeneration numbers on the removal effect of methylene blue.
Table 7.
Influence of regeneration numbers on the removal effect of methylene blue.
| Number of Regenerations | Regeneration Efficiency | ||
|---|---|---|---|
| AC-CuO | AC-ZnO | AC-TiO2 | |
| 1 | 100 | 97.97 | 99.30 |
| 2 | 88.78 | 91.91 | 96.70 |
| 3 | 79.50 | 66.60 | 66.85 |
| 4 | 62.27 | 45.73 | 24.03 |
Table 8.
Regeneration loss rate for the removal of methylene blue.
Table 8.
Regeneration loss rate for the removal of methylene blue.
| Number of Regenerations | Loss Rate | ||
|---|---|---|---|
| AC-CuO | AC-ZnO | AC-TiO2 | |
| 1 | 4.24 | 6.12 | 4.83 |
| 2 | 10.82 | 9.49 | 9.03 |
| 3 | 17.74 | 17.83 | 16.89 |
| 4 | 25.33 | 30.17 | 34.24 |
3.8. Mechanism of the Methylene Blue Removal
Based on the structure characterization, the kinetic analysis, the adsorption isotherm studies, and the intraparticle diffusion model studies, a possible mechanism for removing methylene blue is as follows: In a methylene blue solution at pH 7, methylene blue migrates from the aqueous solution to the surface of the composite materials first. Secondly, at the solid–liquid interface, methylene blue bonds with the active sites of composite materials by liquid film diffusion and intraparticle diffusion, then being removed by chemical adsorption, predominantly.
4. Conclusions
With oily sludge pyrolysis residue as a carrier to load CuO, ZnO, and TiO2, composite materials (AC-CuO, AC-ZnO, and AC-TiO2) were obtained, which were then used for the removal of methylene blue solution. Compared with that of CuO, ZnO, and TiO2, AC-CuO, AC-ZnO, and AC-TiO2 had a better methylene blue removal effect. Among them, AC-TiO2 had the best removal effect of 5 mg/L methylene blue, and the removal capacity was 4.85 mg/g. Moreover, the possible removal process of methylene blue by composite materials was mainly chemical adsorption and was also controlled by both liquid film diffusion and intraparticle diffusion. From this study, oily sludge pyrolysis residue was applied to synthesize metal oxides-loaded composite materials and then used to remove methylene blue pollutants, which gave a possible idea to realize synergistic disposal of oily sludge pyrolysis residues and methylene blue pollutants.
Author Contributions
Designing the experiments, L.H. and J.L.; performing the experiments, L.H. and T.Z.; contributing the reagents, materials, and analysis tools, C.Q.; analyzing the data, T.Y. and B.Y.; writing the data, gents, materials, L.H. and T.Z.; writing the data, gents, L.H. All authors have read and agreed to the published version of the manuscript.
Funding
This research was funded by the National Natural Science of China (21808182, 51974245), Key Research and Development Program of Shaanxi Province (2022SF-045, 2022GY-128), Key Laboratory Scientific Research Project of Shaanxi Provincial Department of Education (18JS088), and Science and Technology Plan Project of Xi’an (2020KJRC0097, 2020KJRC0098).
Institutional Review Board Statement
Not applicable.
Informed Consent Statement
Not applicable.
Data Availability Statement
All data were presented in the main manuscript.
Conflicts of Interest
The authors declare no conflict of interests. The funders had no role in the design of the study; in the collection, analyses, or interpretation of data; in the writing of the manuscript, or in the decision to publish the results.
References
- Dal, F.; Zeng, X.; Huang, Q.; Li, J. Quantifying material flow of oily sludge in China and its implications. J. Environ. Manag. 2021, 287, 112115. [Google Scholar]
- Wang, Z.; Gong, Z.; Wang, Z.; Li, X.; Chu, Z. Application and development of pyrolysis technology in petroleum oily sludge treatment. Environ. Eng. Res. 2021, 26, 1–15. [Google Scholar] [CrossRef]
- Hu, G.; Feng, H.; He, P.; Li, J.; Hewage, K.; Sadiq, R. Comparative life-cycle assessment of traditional and emerging oily sludge treatment approaches. J. Clean. Prod. 2020, 251, 119594–119603. [Google Scholar] [CrossRef]
- Teng, Q.; Zhang, D.; Yang, C. A review of the application of different treatment processes for oily sludge. Environ. Sci. Pollut. 2021, 28, 121–132. [Google Scholar] [CrossRef]
- Yaqoob, A.; Parveen, T.; Umar, K.; Mohamad, M.N. Role of nanomaterials in the treatment of wastewater: A review. Water 2020, 12, 495. [Google Scholar] [CrossRef] [Green Version]
- Gao, Y.X.; Ding, R.; Chen, X.; Gong, Z.B.; Zhang, Y.; Yang, M. Ultrasonic washing for oily sludge treatment in pilot scale. Ultrasonics 2018, 90, 1–4. [Google Scholar] [CrossRef]
- Gao, N.; Duan, Y.; Li, Z.; Quan, C.; Yoshikawa, K. Hydrothermal treatment combined with in-situ mechanical compression for floated oily sludge dewatering. J. Hazard. Mater. 2021, 402, 124173–124184. [Google Scholar] [CrossRef]
- Wang, Z.; Gong, Z.; Wang, Z.; Li, X.; Liu, J.; Tang, C.; Chu, Z. Pyrolysis performance and kinetic analysis of oily sludge. J. Therm. Anal. Calorim. 2022, 147, 4621–4633. [Google Scholar] [CrossRef]
- Li, J.; Lin, F.; Li, K.; Zheng, F.; Yan, B.; Che, L.; Yoshikawa, K.A. critical review on energy recovery and non-hazardous disposal of oily sludge from petroleum industry by pyrolysis. J. Hazard. Mater. 2021, 406, 124706–124718. [Google Scholar] [CrossRef]
- Chen, C.; Yan, X.; Xu, Y.Y.; Yoza, B.A.; Wang, X.; Kou, Y.; Li, Q.X. Activated petroleum waste sludge biochar for efficient catalytic ozonation of refinery wastewater. Sci. Total Environ. 2019, 651, 2631–2640. [Google Scholar] [CrossRef]
- Ma, W.; Li, Z.; Yang, H.; Fu, P. Evaluation of pyrolysis residue derived by oily sludge on removing heavy metals from artificial flotation wastewater. S. Afr. J. Chem. Eng. 2020, 34, 82–89. [Google Scholar]
- Lawal, A.A.; Hassan, M.A.; Farid, M.A.; Yasim-Anuar, T.A.T.; Yusoff, M.Z.M.; Zakaria, M.R.; Shirai, Y. Production of biochar from oil palm frond by steam pyrolysis for removal of residual contaminants in palm oil mill effluent final discharge. J. Clean. Prod. 2020, 265, 121643–121649. [Google Scholar] [CrossRef]
- Mia, R.; Selim, M.; Shamim, A.M.; Chowdhury, M.; Sultana, S.; Armin, M.; Naznin, H. Review on various types of pollution problem in textile dyeing & printing industries of Bangladesh and recommandation for mitigation. J. Text. Eng. Fash. Technol. 2019, 5, 220–226. [Google Scholar]
- Yaseen, D.A.; Scholz, M. Textile dye wastewater characteristics and constituents of synthetic effluents: A critical review. Int. J. Environ. Sci. Technol. 2019, 16, 1193–1226. [Google Scholar] [CrossRef] [Green Version]
- Wiehe, A.; O’Brien, J.M.; Senge, M.O. Trends and targets in antiviral phototherapy. Photoch. Photobio. Sci. 2019, 18, 2565–2612. [Google Scholar] [CrossRef]
- Iwuozor, K.O.; Ighalo, J.O.; Ogunfowora, L.A.; Adeniyi, A.G.; Igwegbe, C.A. An empirical literature analysis of adsorbent performance for methylene blue uptake from aqueous media. J. Environ. Chem. Eng. 2021, 9, 105658–105669. [Google Scholar] [CrossRef]
- Zhang, N.; Cheng, N.; Liu, Q. Functionalized biomass carbon-based adsorbent for simultaneous removal of Pb2+ and MB in wastewater. Materials 2021, 14, 3537. [Google Scholar] [CrossRef] [PubMed]
- Li, T.; Chu, C.; Zhang, Y.; Ju, M.; Wang, Y. Contrasting eutrophication risks and countermeasures in different water bodies: Assessments to support targeted watershed management. Int. J. Environ. Res. Public Health 2017, 14, 695. [Google Scholar] [CrossRef] [Green Version]
- Ahmad, A.; Setapar, S.H.; Yaqoob, A.A.; Ibrahim, M.N.M. Synthesis and characterization of GO-Ag nanocomposite for removal of malachite dye from aqueous solution. Mater. Today Proc. 2021, 47, 1359–1365. [Google Scholar] [CrossRef]
- Zhang, P.; O’Connor, D.; Wang, Y.; Jiang, L.; Xia, T.; Wang, L.; Hou, D. A green biochar/iron oxide composite for methylene blue removal. J. Hazard. Mater. 2020, 384, 121286. [Google Scholar] [CrossRef]
- Zhai, S.; Li, M.; Wang, D.; Zhang, L.; Yang, Y.; Fu, S. In situ loading metal oxide particles on bio-chars: Reusable materials for efficient removal of methylene blue from wastewater. J. Clean. Prod. 2019, 220, 460–474. [Google Scholar] [CrossRef]
- Wang, N.; Xiao, F.; Zhang, J.; Zhou, H.; Qin, Y.; Pan, D. Spherical montmorillonite-supported nano-silver as a self-sedimentary catalyst for methylene blue removal. Appl. Clay Sci. 2019, 174, 146–151. [Google Scholar] [CrossRef]
- Wu, J.; Lin, G.; Li, P.; Yin, W.; Wang, X.; Yang, B. Heterogeneous Fenton-like degradation of an azo dye reactive brilliant orange by the combination of activated carbonFeOOH catalyst and H2O2. Water Sci. Technol. 2013, 67, 572–578. [Google Scholar] [CrossRef]
- Oliveira, S.M.; Andrade, H.M.; Soares, L.F.; Azevedo, R.P. Brazil nut shells as a new biosorbent to remove methylene blue and indigo carmine from aqueous solutions. J. Hazard. Mater. 2010, 174, 84–92. [Google Scholar]
- Liu, X.; He, C.; Yu, X.; Bai, Y.; Ye, L.; Wang, B.; Zhang, L. Net-like porous activated carbon materials from shrimp shell by solution-processed carbonization and H3PO4 activation for methylene blue adsorption. Powder Technol. 2018, 326, 181–189. [Google Scholar] [CrossRef]
- Duan, C.; Chen, Z.; Liu, X.; Li, K.; Wang, X.; Jia, W.; Liu, Z. Noble surface molecularly imprinted polymer modified titanium dioxide toward solanesol adsorption selectivity study. J. Mater. Res. 2019, 34, 3271–3287. [Google Scholar] [CrossRef] [Green Version]
- Novais, R.M.; Ascensao, G.; Tobaldi, D.M.; Seabra, M.P.; Labrincha, J.A. Biomass fly ash geopolymer monoliths for effective methylene blue removal from wastewaters. J. Clean. Prod. 2018, 171, 783–794. [Google Scholar] [CrossRef]
- Jeong, J.; Chun, J.; Lim, W.G.; Kim, W.B.; Jo, C.; Lee, J. Mesoporous carbon host material for stable lithium metal anode. Nanoscale 2020, 12, 11818–11824. [Google Scholar] [CrossRef]
- Saepurahman, M.A.; Abdullah, F.K. Preparation and characterization of tungsten-loaded titanium dioxide photocatalyst for enhanced dye degradation. J. Hazard. Mater 2010, 176, 451–458. [Google Scholar] [CrossRef]
- Lee, H.; Kannan, P.; Shoaibi, A.; Srinivasakannan, C. Phenol degradation catalyzed by metal oxide supported porous carbon matrix under UV irradiation. J. Water Process Eng. 2019, 31, 100869–100875. [Google Scholar] [CrossRef]
- Liu, L.; Li, Y.; Fan, S. Preparation of KOH and H3PO4 modified biochar and its application in methylene blue removal from aqueous solution. Processes 2019, 7, 891. [Google Scholar] [CrossRef] [Green Version]
- Santoso, E.; Ediati, R.; Kusumawati, Y.; Bahruji, H.; Sulistiono, D.O.; Prasetyoko, D. Review on recent advances of carbon based adsorbent for methylene blue removal from waste water. Mater. Today Chem. 2020, 16, 100233–100241. [Google Scholar] [CrossRef]
- Zhu, X.; Zhang, R.; Rong, S.; Zhang, L.; Ma, C. A systematic preparation mechanism for directional regulation of pore structure in activated carbon including specific surface area and pore hierarchy. J. Anal. App. Pyroly 2021, 158, 105266–105272. [Google Scholar] [CrossRef]
- Cui, W.; He, J.; Wang, H.; Hu, J.; Liu, L.; Liang, Y. Polyaniline hybridization promotes photo-electro-catalytic removal of organic contaminants over 3D network structure of rGH-PANI/TiO2 hydrogel. Appl. Catal. B-Environ. 2018, 232, 232–245. [Google Scholar] [CrossRef]
- Botsa, S.M.; Basavaiah, K. Removal of Nitrophenols from wastewater by monoclinic CuO/RGO nanocomposite. Nano. Environ. Eng. 2019, 4, 1–7. [Google Scholar] [CrossRef]
- Samanta, P.; Saha, A.; Kamilya, T. Wet chemically synthesized CuO bipods and their optical properties. Recent Pat. Nanotechnol. 2016, 10, 20–25. [Google Scholar] [CrossRef]
- Ramimoghadam, D.; Hussein, M.Z.B.; Taufiq-Yap, Y.H. Synthesis and characterization of ZnO nanostructures using palm olein as biotemplate. Chem. Cent. J. 2013, 7, 1–10. [Google Scholar] [CrossRef] [Green Version]
- Wei, K.; Li, K.; Yan, L. One-step fabrication of g-C3N4 nanosheets/TiO2 hollow microspheres heterojunctions with atomic level hybridization and their application in the multi-component synergistic photocatalytic systems. Appl. Catal. B Environ. 2018, 222, 88–98. [Google Scholar] [CrossRef]
- Wang, N.; Chen, J.; Wang, J.; Feng, J.; Yan, W. Removal of methylene blue by Polyaniline/TiO2 hydrate: Adsorption kinetic, isotherm and mechanism studies. Powder Technol. 2019, 347, 93–102. [Google Scholar] [CrossRef]
- Yang, X.; Yi, H.; Tang, X.; Zhao, S.; Yang, Z.; Ma, Y.; Cui, X. Behaviors and kinetics of toluene adsorption-desorption on activated carbons with varying pore structure. J. Environ. Sci. 2018, 67, 104–114. [Google Scholar] [CrossRef]
- Alver, E.; Metin, A.Ü.; Brouers, F. Methylene blue adsorption on magnetic alginate/rice husk bio-composite. Int. J. Biol. Macro. 2020, 154, 104–113. [Google Scholar] [CrossRef] [PubMed]
- Bayomie, O.S.; Kandeel, H.; Shoeib, T.; Yang, H.; Youssef, N.; El-Sayed, M.M. Novel approach for effective removal of methylene blue dye from water using fava bean peel waste. Sci. Rep.-UK 2020, 10, 1–10. [Google Scholar] [CrossRef] [PubMed]
- Mouni, L.; Belkhiri, L.; Bollinger, J.C.; Bouzaza, A.; Assadi, A.; Tirri, A.; Remini, H. Removal of Methylene Blue from aqueous solutions by adsorption on Kaolin: Kinetic and equilibrium studies. Appl. Clay Sci. 2018, 153, 38–45. [Google Scholar] [CrossRef]
- Sagita, C.P.; Nulandaya, L.; Kurniawan, Y.S. Efficient and low-cost removal of methylene blue using activated natural kaolinite material. J. Mult. App. Nat. Sci. 2021, 1, 1–12. [Google Scholar] [CrossRef]
- Reczek, L.; Michel, M.M.; Trach, Y.; Siwiec, T.; Tytkowska-Owerko, M. The kinetics of manganese sorption on ukrainian tuff and basalt-order and diffusion models analysis. Minerals 2020, 10, 1065. [Google Scholar] [CrossRef]
- Piccin, J.S.; Cadaval, T.; DePinto, L.; Dotto, G.L. Adsorption Isotherms in Liquid Phase: Experimental, Modeling, and Interpretations; Springer: Cham, Switzerland, 2017; Volume 19, pp. 19–27. [Google Scholar]


Publisher’s Note: MDPI stays neutral with regard to jurisdictional claims in published maps and institutional affiliations. |
© 2022 by the authors. Licensee MDPI, Basel, Switzerland. This article is an open access article distributed under the terms and conditions of the Creative Commons Attribution (CC BY) license (https://creativecommons.org/licenses/by/4.0/).