1. Introduction
Three-dimensional (3D) printing technology can process various shapes beyond the limitations of conventional cutting processes; as such, it has been recently extensively investigated. In particular, the development of metal 3D printing technology has resulted in continuous efforts to produce materials more efficiently and to be applicable to mass-produced products [
1].
Among the relevant processes, selective Laser melting (SLM) uses a laser as a heat source to melt and solidify the metal powder. Consequently, rapid temperature differences and complex thermal gradients occur in the powder and products while passing through the adjacent laser path [
2].
In other words, melting and solidification occur instantaneously along the laser path, and residual stress occurs owing to the movement of the metal melting pool and thermal expansion. The residual stress generated causes deformation and cracking in the entire material, and cracks occur owing to the stress and distortion generated by the laser path when printed at a high aspect ratio shape [
3]. Therefore, heat and residual stress changes that occur during metal lamination can be verified in advance, such that the post-treatment process after product production can be reduced significantly or the processing accuracy of the product can be increased.
Various analytical approaches to metal 3D printing have been reported. In the study of Mujian Xia et al., the phenomenon occurring as powder particles melt and solidify was analyzed through flow analysis [
4]. Considering the shape of the powder particles and the buoyancy and convection that occur in the molten state, the actual melting phenomenon and the process in which pores occur were simulated. However, the analysis area is extremely small, thus, it is difficult to apply it to large parts. In the study of Subin Shrestha et al., the phenomena occurring during melting and surface changes were analytically implemented through thermo-fluid analysis [
5]. Ambient air, solids and powder were analyzed based on the density fraction, and the resulting surface curvature and roughness were specifically analyzed. However, due to the characteristics of the analysis method, it was difficult to analyze the stacking process of multiple layers.
Panagiots analyzed the process of forming a thin-walled structure by repeatedly stacking a single laser path through FEM [
6]. Unlike previous studies, thermal and structural analyses were conducted, but heat transfer to the surrounding powder was not considered, and temperature changes due to adjacent paths were not considered.
Takezawa analyzed the residual stress of metal 3D printing materials using the inherent strain method and conducted optimization studies to minimize deformation by applying a porous grid structure [
7]. However, the deformation of the structure by heat was applied only to the initial inherent strain. Since the strain application per layer and heat transfer to adjacent structures are not considered, a detailed analysis is limited.
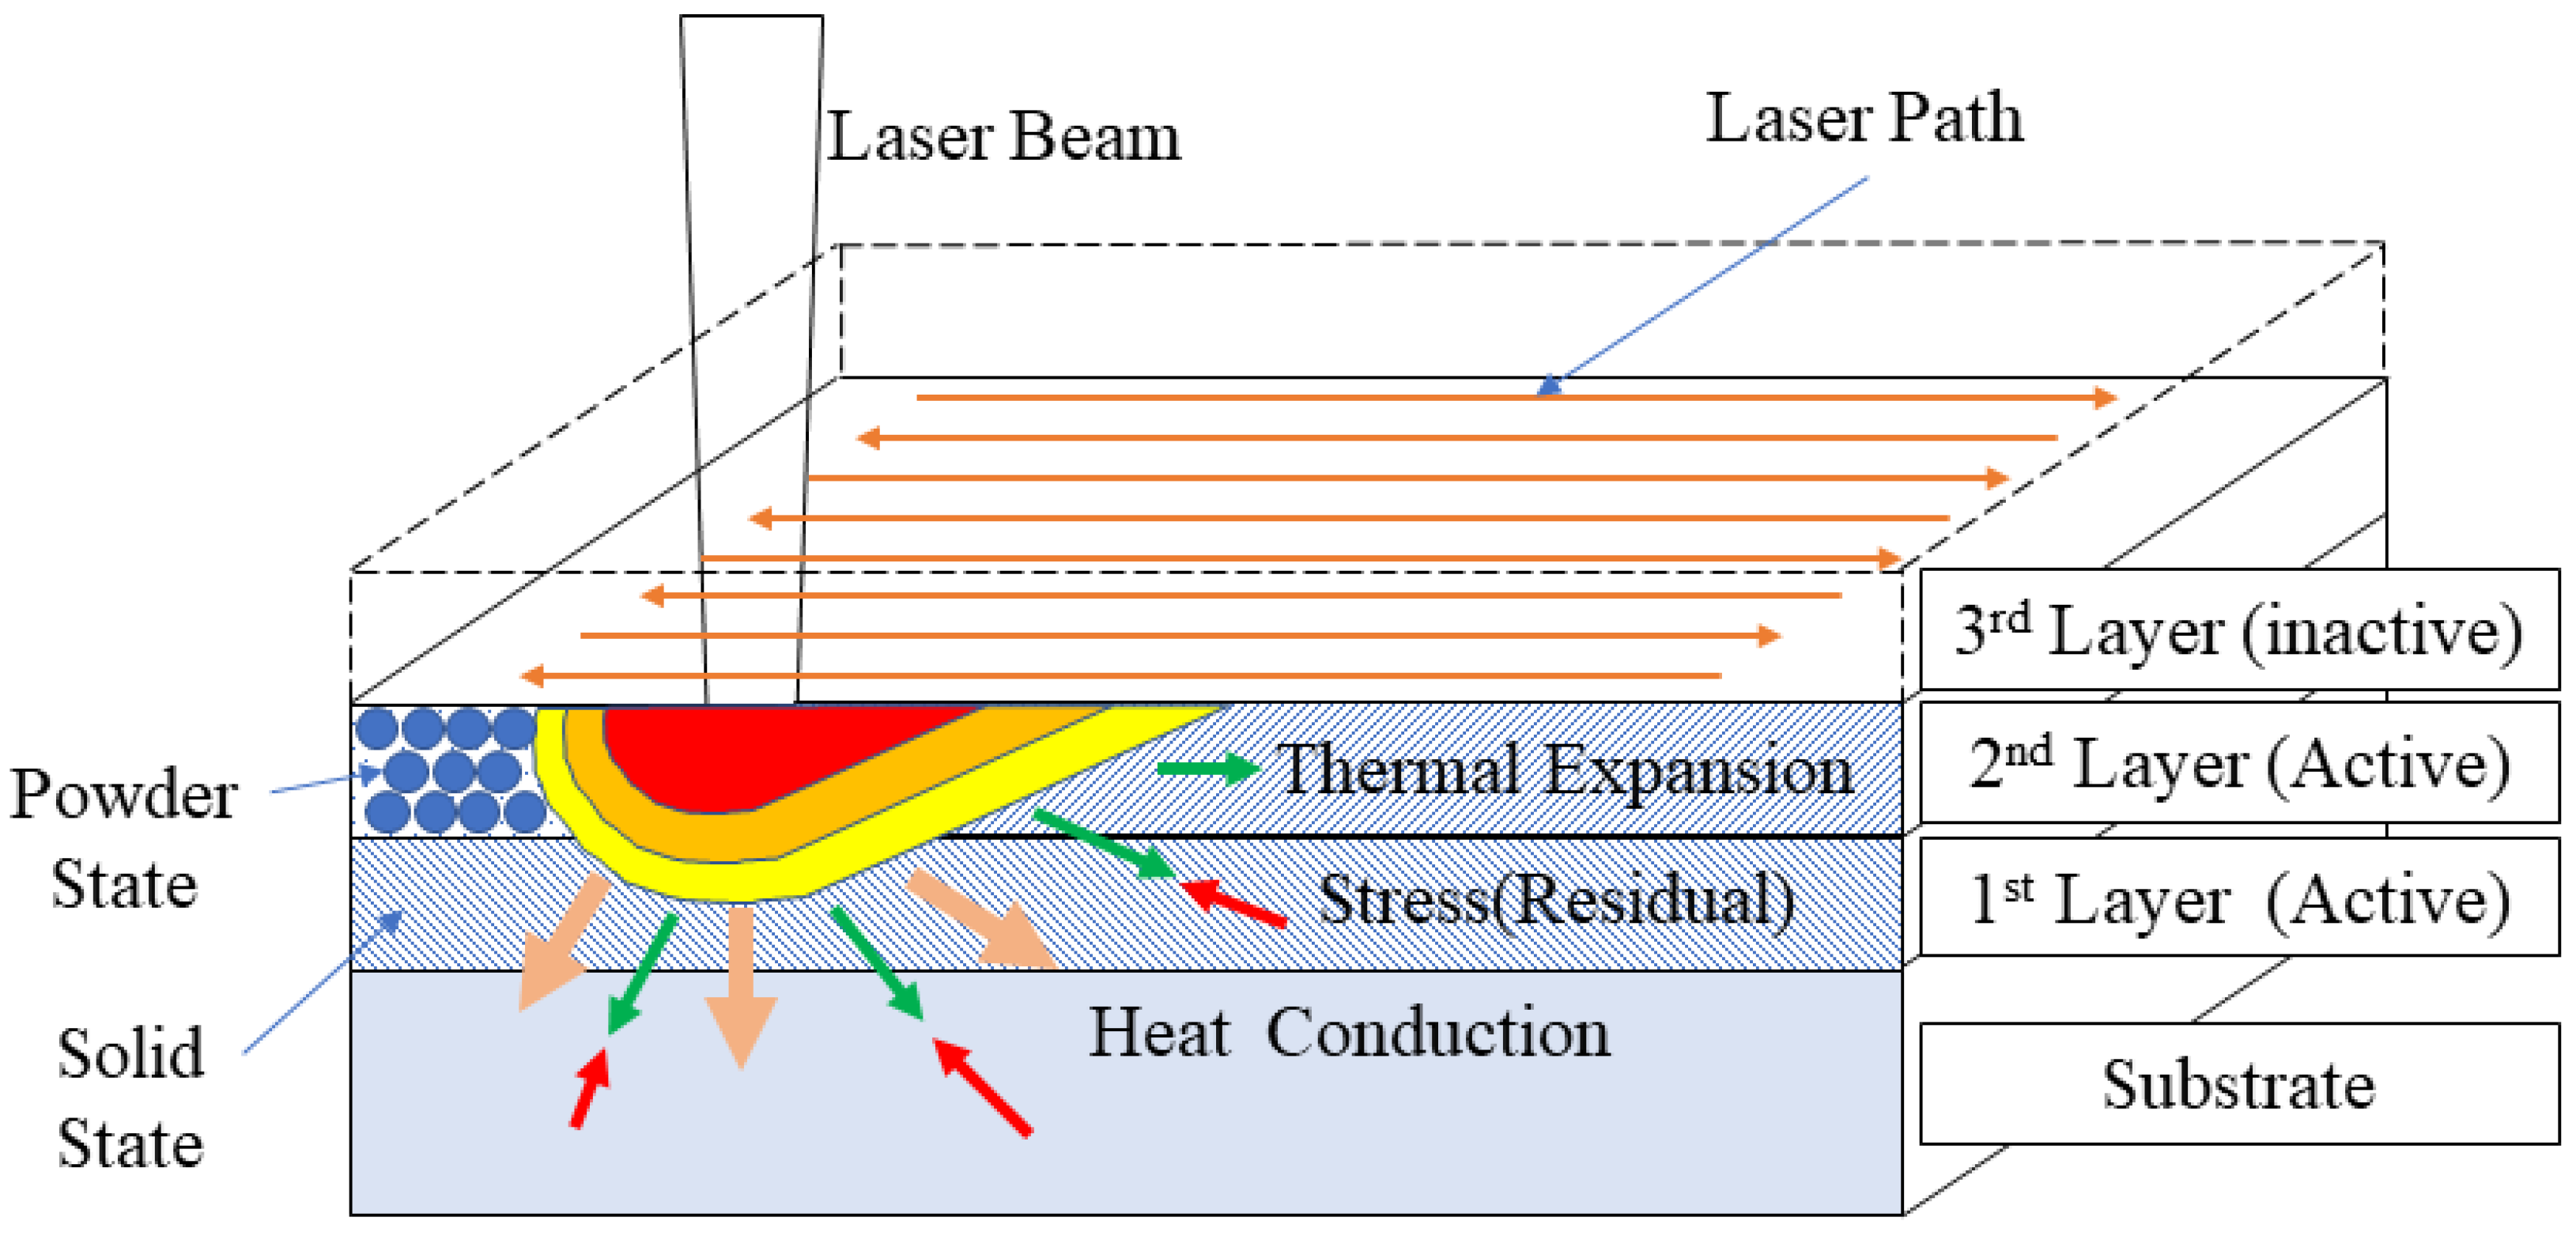
However, studies that verify the heat input process or residual interlayer stress based on the laser path inside one stacked surface are insufficient. Based on previous studies, SLM was simulated via a thermal-structure coupled analysis in this study. As shown in
Figure 1, a thermal-structure coupled analysis module was constructed to analyze the structure of the material properties, laser heat sources, and paths applied to the SLM process numerically [
8]. The 3D printing process was simulated on each layer based on the laser path, and the deformation, temperature change and residual stress occurring in the process were confirmed. Subsequently, the specimen was printed under the same process conditions to compare and verify the analysis results with the residual stress measurements.
2. Composition of FEM Model
2.1. Composition of Thermal-Structure-Linked Numerical Analysis Model
Using the FEM analysis model, the mechanisms that occur during 3D printing were simulated by confirming the changes in thermal expansion and residual stress occurring along the heat input path of the laser. Problems associated with residual stress and the resulting distortion and destruction should be considered for heat input in adjacent areas after melting and solidification. Hence, a tool was configured to confirm the complex heat gradient occurring in the 3D printing process by continuously calculating multiple laser paths and stacked layers. Subsequently, the suitability of the analysis model was verified by comparing it with the actual process of the configured analysis model.
Unlike in previous studies, in this study, heat transfer and deformation between powder and solid were considered, and analysis conditions were designed considering the differences and changes in physical properties due to temperature and phase changes. In this regard, a thermal-structure-coupled FEM model was constructed for the SLM process. Subsequently, an analysis was performed while considering the thermal-structure physical system, and the associated effects were considered when calculating the convergence. The associated coupling equation is shown in Equation (1) [
8].
In this equation, [Kut] is the thermoelastic stiffness matrix of the element, and [Ctu] is the attenuation matrix owing to the thermoelastic effect. [Kt] is a heat conduction matrix and can be calculated by summing the conductivity to material diffusion ([Ktb]) and conduction based on the material convection surface ([Ktc]).
2.2. Subroutine Composition of Laser Path and Layer
As the simulation for the process progressed, the laser center position in each time step was calculated, and the heat input condition was selected. Based on this center point, the amount of heat input applied to each node based on the laser beam type was calculated using the ANSYS MAPDL code. The laser heat source is applied based on Gaussian shape, and the amount of heat input according to each location is calculated according to Equation (2). The calculated time step is very small compared to the moving speed of the heat source, so it is calculated based on the instantaneous heat input shape. The amount of heat applied to the node is added to the amount of heat transferred from the surrounding elements, and the [
Q] of the coupling equation constructed above is calculated for each time step.
The values for the heat input surface and laser path were considered and generated in advance to apply heat by the laser, and the waiting time and powder application time until the next stack were set after the completion of the thermal analysis corresponding to each layer. During this time, concentrated heat diffusion occurred, and then the thermal-structure analysis of the next layer was performed.
2.3. Material Properties for Numerical Analysis
For the thermal and structural analyses, information regarding the physical properties of both physical systems is required. In addition, owing to the characteristics of the process, the temperature deviation was significant, and the phase change was considered. Therefore, the physical property information based on the temperature and phase changes was required. In this study, Ti-6Al-4V material is used, and the physical properties for the temperature range between the room temperature (22 °C) and 2000 °C were applied while considering the powder state before melting, the molten liquid state, and the solid state after solidification. When the preset melting temperature is achieved, a material change code is applied to change the properties from solid properties to liquid properties. For the configuration of the analysis model, the physical property values of Ti–6Al–4V were set based on the results of previous studies [
9]. In particular, the elastic–plastic properties were realized by applying a bilinear isotropic hardening model, and the modulus of elasticity and yield stress were adjusted according to temperature. In the initial powder state and molten state, very weak yield stress was applied so that the behavior of powder and fluid could be expressed.
2.4. Numerical Model
In order to calculate the contents previously configured, a numerical analysis model was constructed by applying it to the Mechanical program from Ansys. To consider the thermal conduction phenomenon, a transient structure-thermal analysis was applied. To verify the analysis result, the processing area was set to 5 mm × 5 mm to facilitate the comparison with a specimen, and an area with a width of approximately 1 mm was set around the laser path to simulate heat transfer into the surrounding powders. The height of one layer was set to 0.1 mm, which is the same as that of the verification specimen. In the previous study, the lamination process of one to ten layers was analyzed, and it was confirmed that the effect of the top layer was transmitted to up to three lower layers. Based on these results, it was inferred that the entire lamination process could be represented by lamination analysis, which sets the three layers to be interpreted consecutively [
10]. The thickness of the base material was set to 1 mm, such that the heat transfer based on the heat input was similar to the actual process.
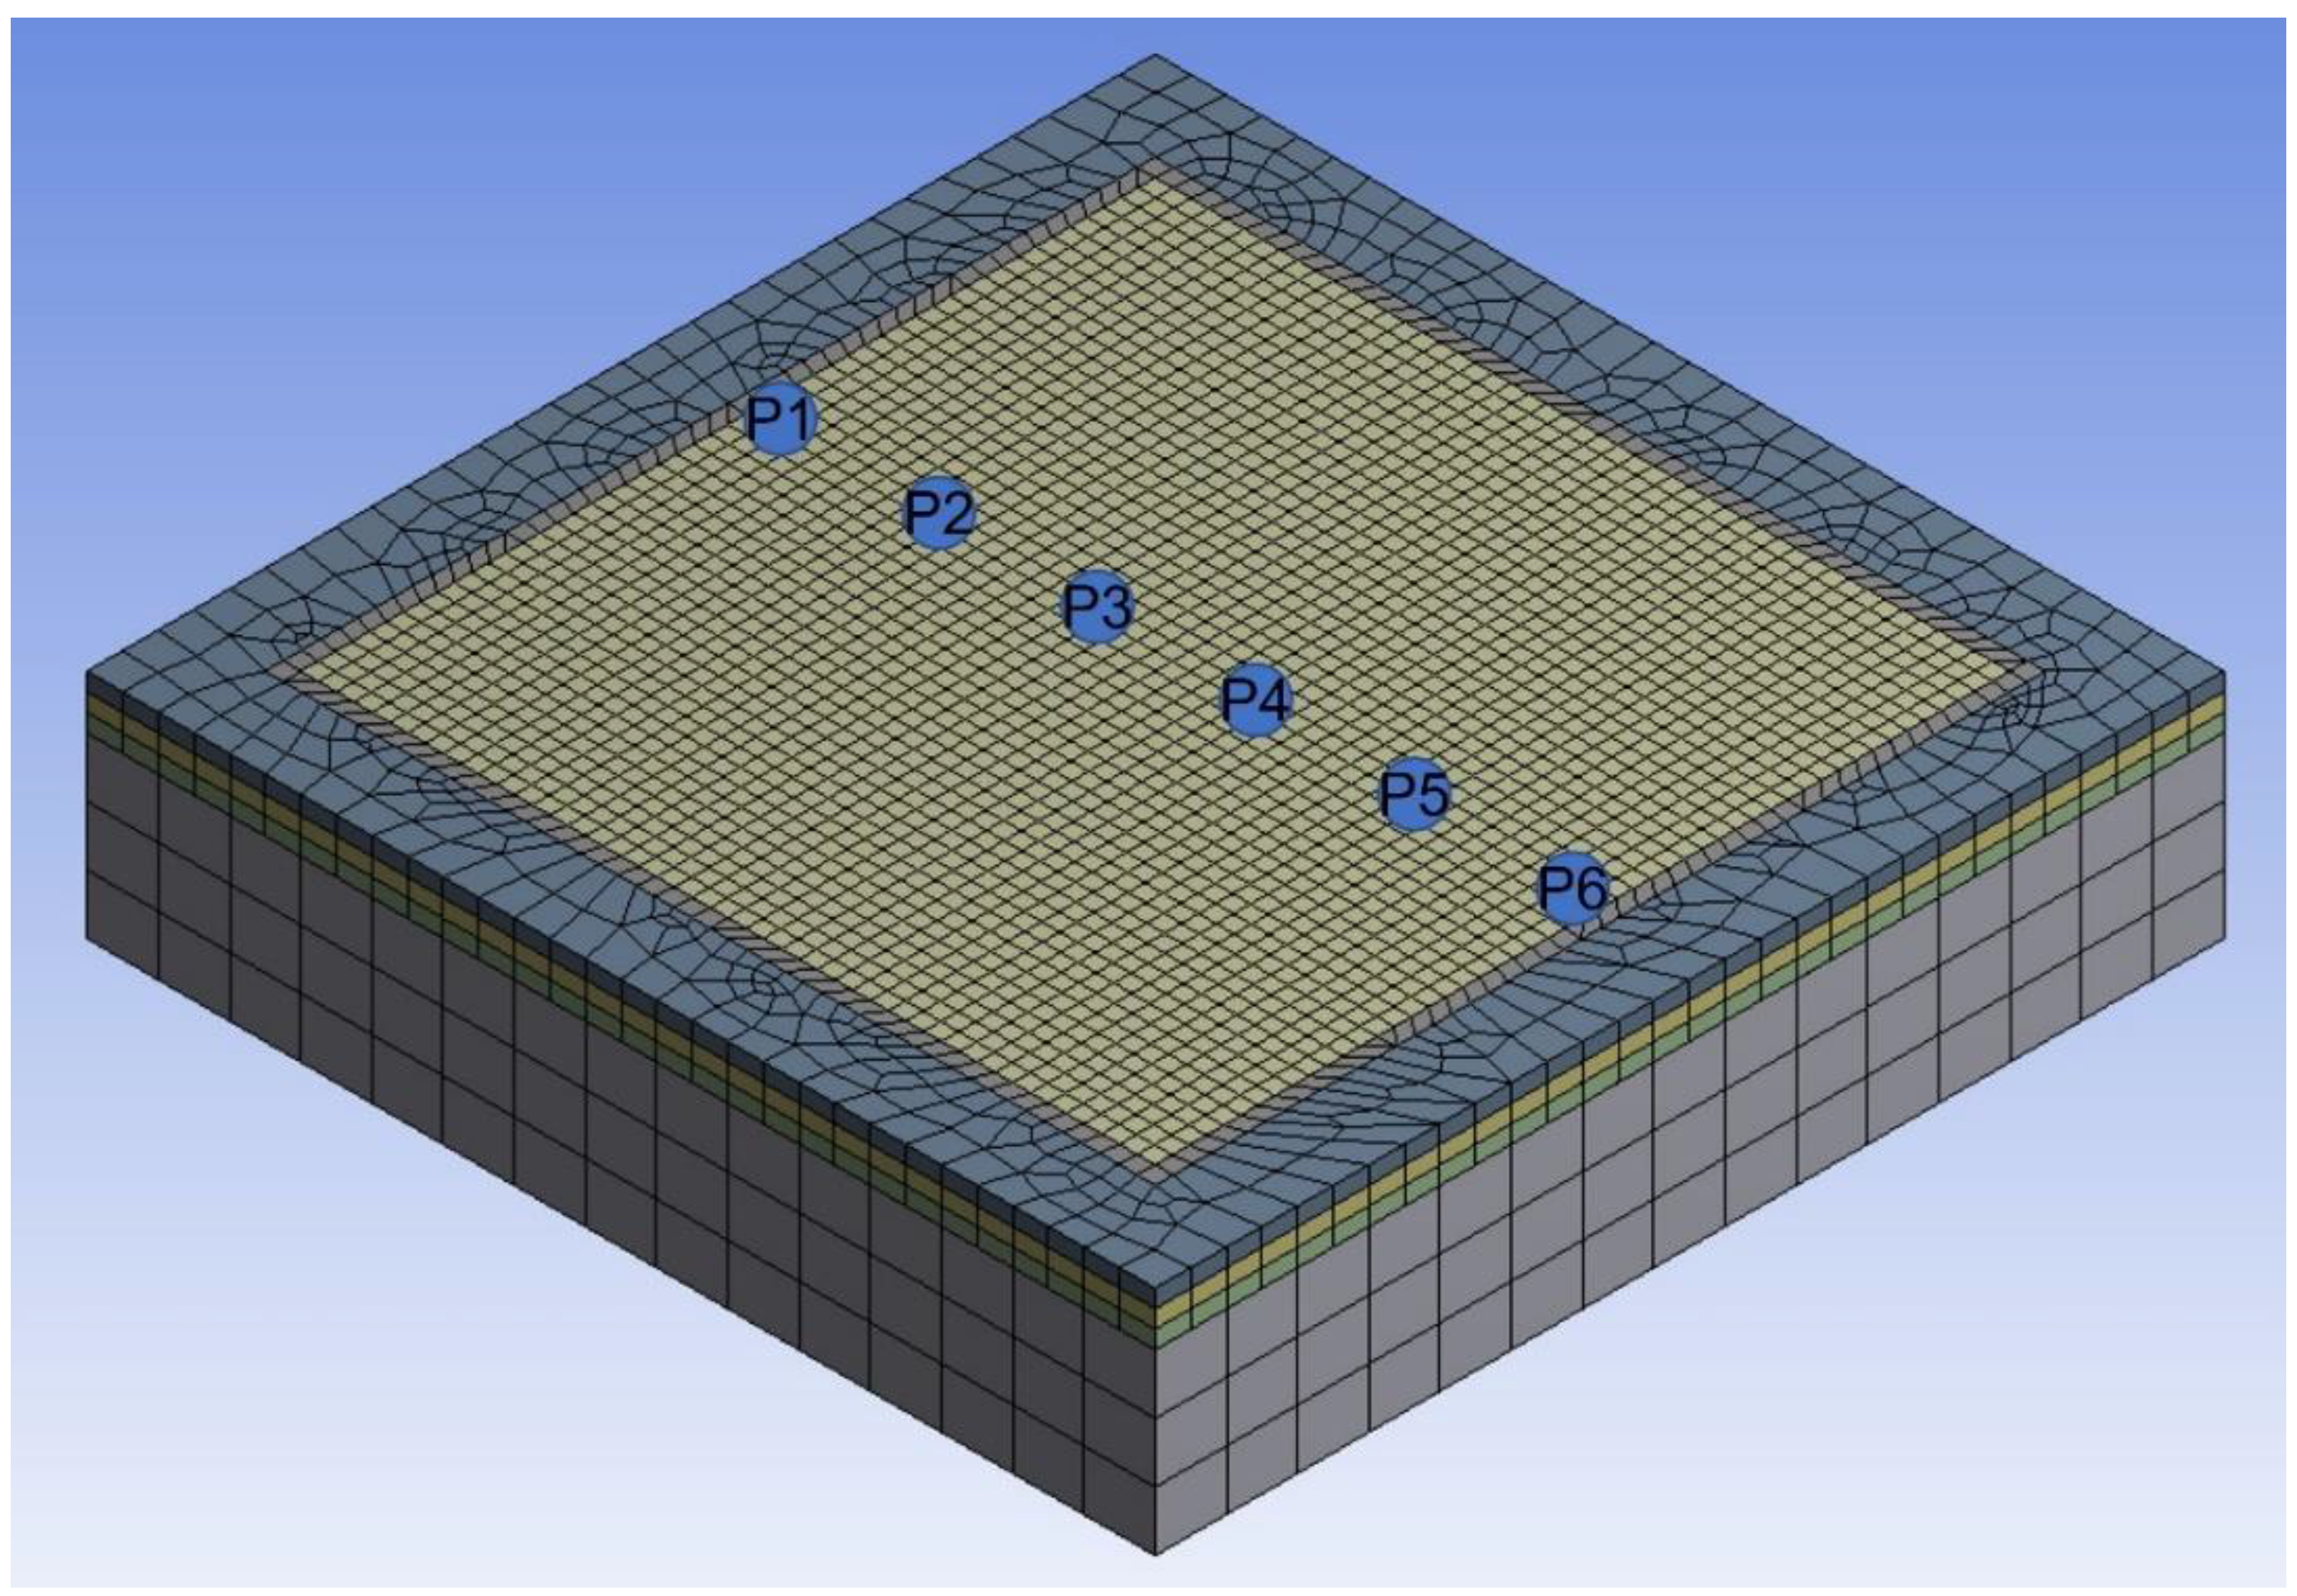
For the thermal-structure coupled analysis, an element supporting the physical properties and coupling operations of each physical system was set. For the element type applied to the analysis, Solid 226 and Solid 227, provided by the software, were applied so that the above-formed expression could be calculated. The number of nodes in the grid used in the analysis was 19,373, and the number of elements was 19,579; the shape is shown in
Figure 2. Boundary conditions were set for the entire analysis model, and the actual process conditions were applied.
Restraining conditions were achieved by attaching the bottom surface to the base material or substrate, and heat transfer conditions were applied to the bottom and side surfaces. Because the thermal conduction coefficients of the metal and the powder differed significantly, the metal powder was set accordingly for each interface with a thermal conduction coefficient of 3.8 W/mm2 °C and 7.63 W/mm2 °C for the metal. On the upper surface, the thermal energy changed because of convection; however, the change was negligible because the temperature of the atmosphere was sufficiently high throughout the preheating process.
2.5. Input for Laser Process Conditions
The process variables required for analysis are associated with the laser heat source and path, and they were set as shown in
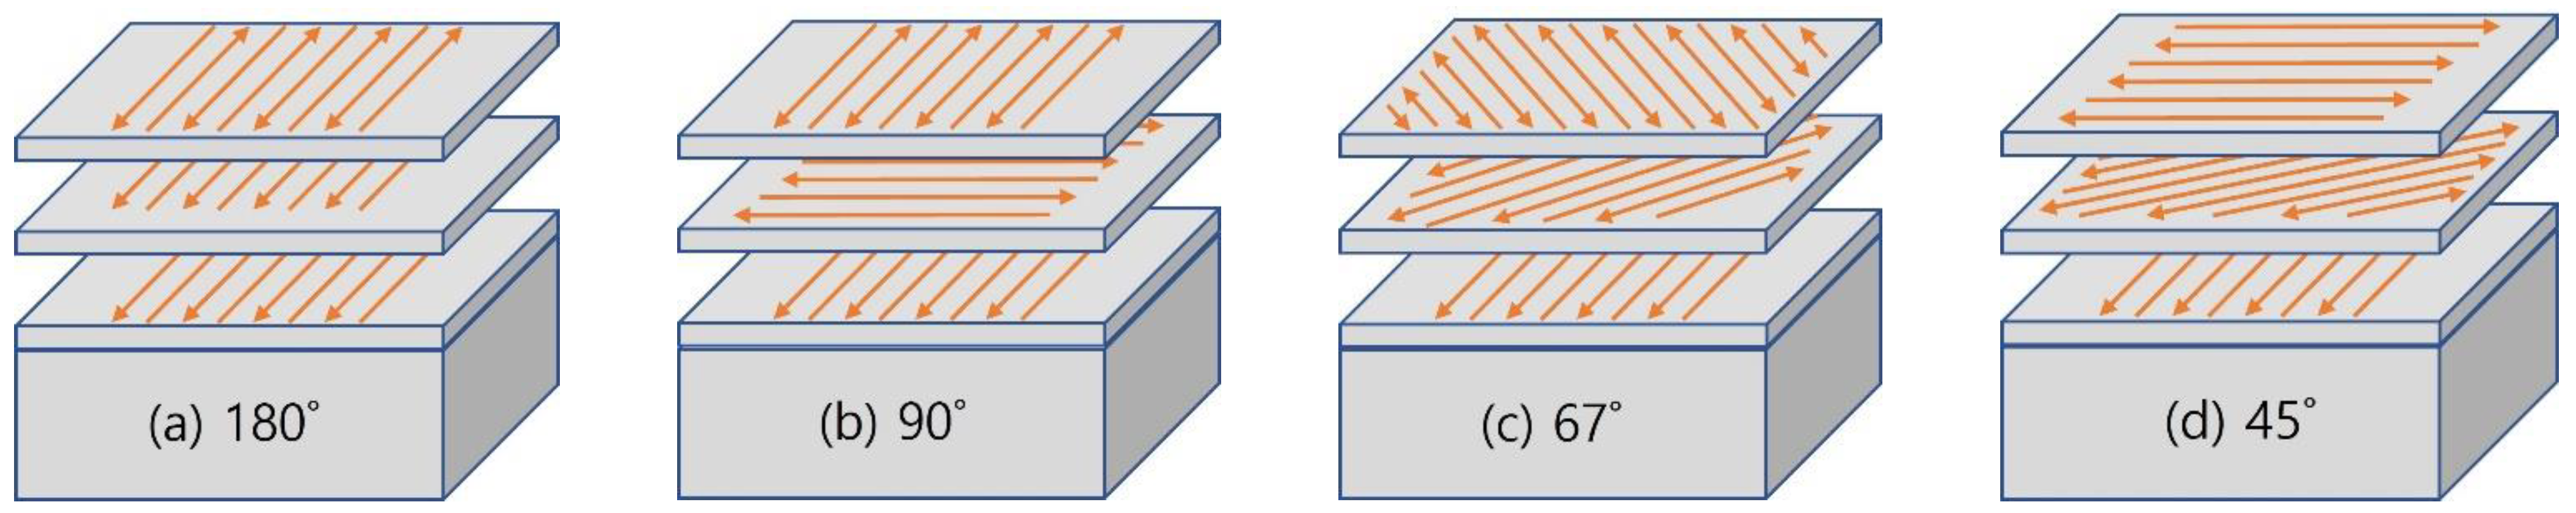
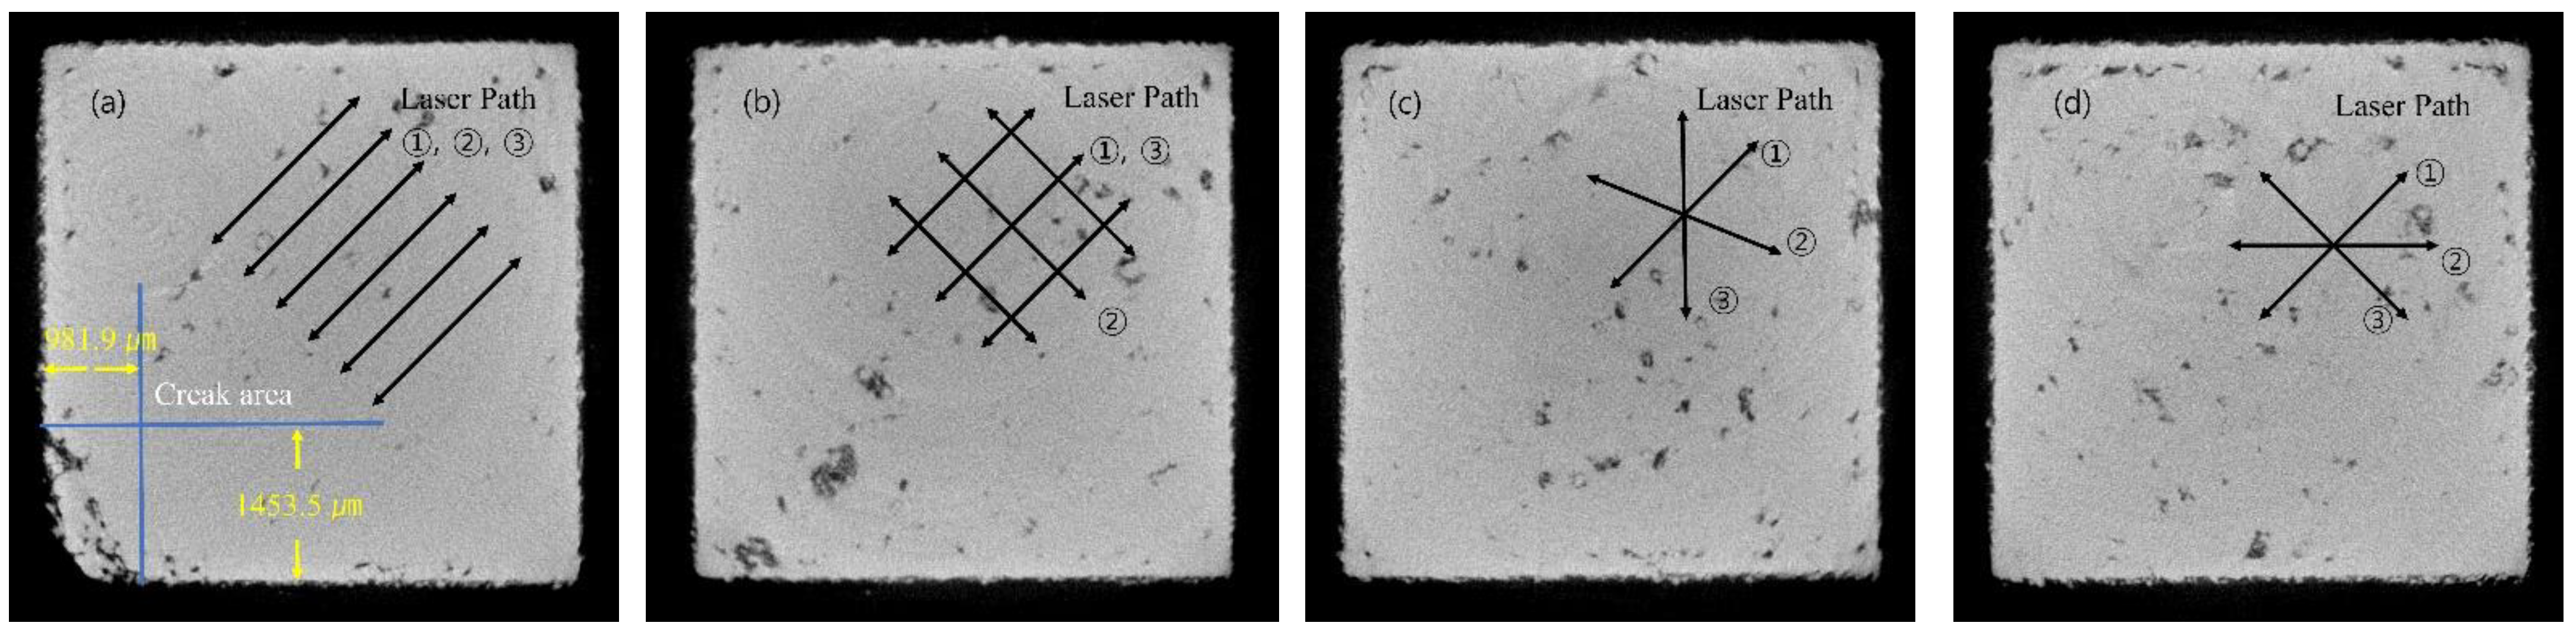
Table 1. The absorption rate of the material for the laser output was set to approximately 10%, based on prior analysis. To melt the inner area, a laser path was set to such that a pattern was reflected inside each layer, and then a heat input was introduced. To emulate the actual process, a laser was irradiated along the border and then set to fill the inner area, such that the laser heat input was performed two to three times sequentially. The inner area filling the area was irradiated along the snake pattern, as shown in
Figure 3a.
In addition, 3D printing simulations were performed for three conditions: 90°, 67°, and 45°, to confirm the difference in simulation results based on the rotation angle of the layer path. Joseph’s research group confirmed the difference in production quality and physical properties based on the pattern angle, and four cases were analyzed by referring to the composition [
11]. Processing was performed based on the pattern generated in each layer rotated by the rotation angle, and it was configured as shown in
Figure 3b–d. All the other values were simulated based on the same value.
3. FEM Analysis Result
The CPU used for the analysis was Intel’s i9 product, and it was performed in an environment equipped with six cores of 3.4 GHz and 64 GB of RAM. The analysis model took an average of 80 h per case.
3.1. Numerical Simulation Results of Additive Process
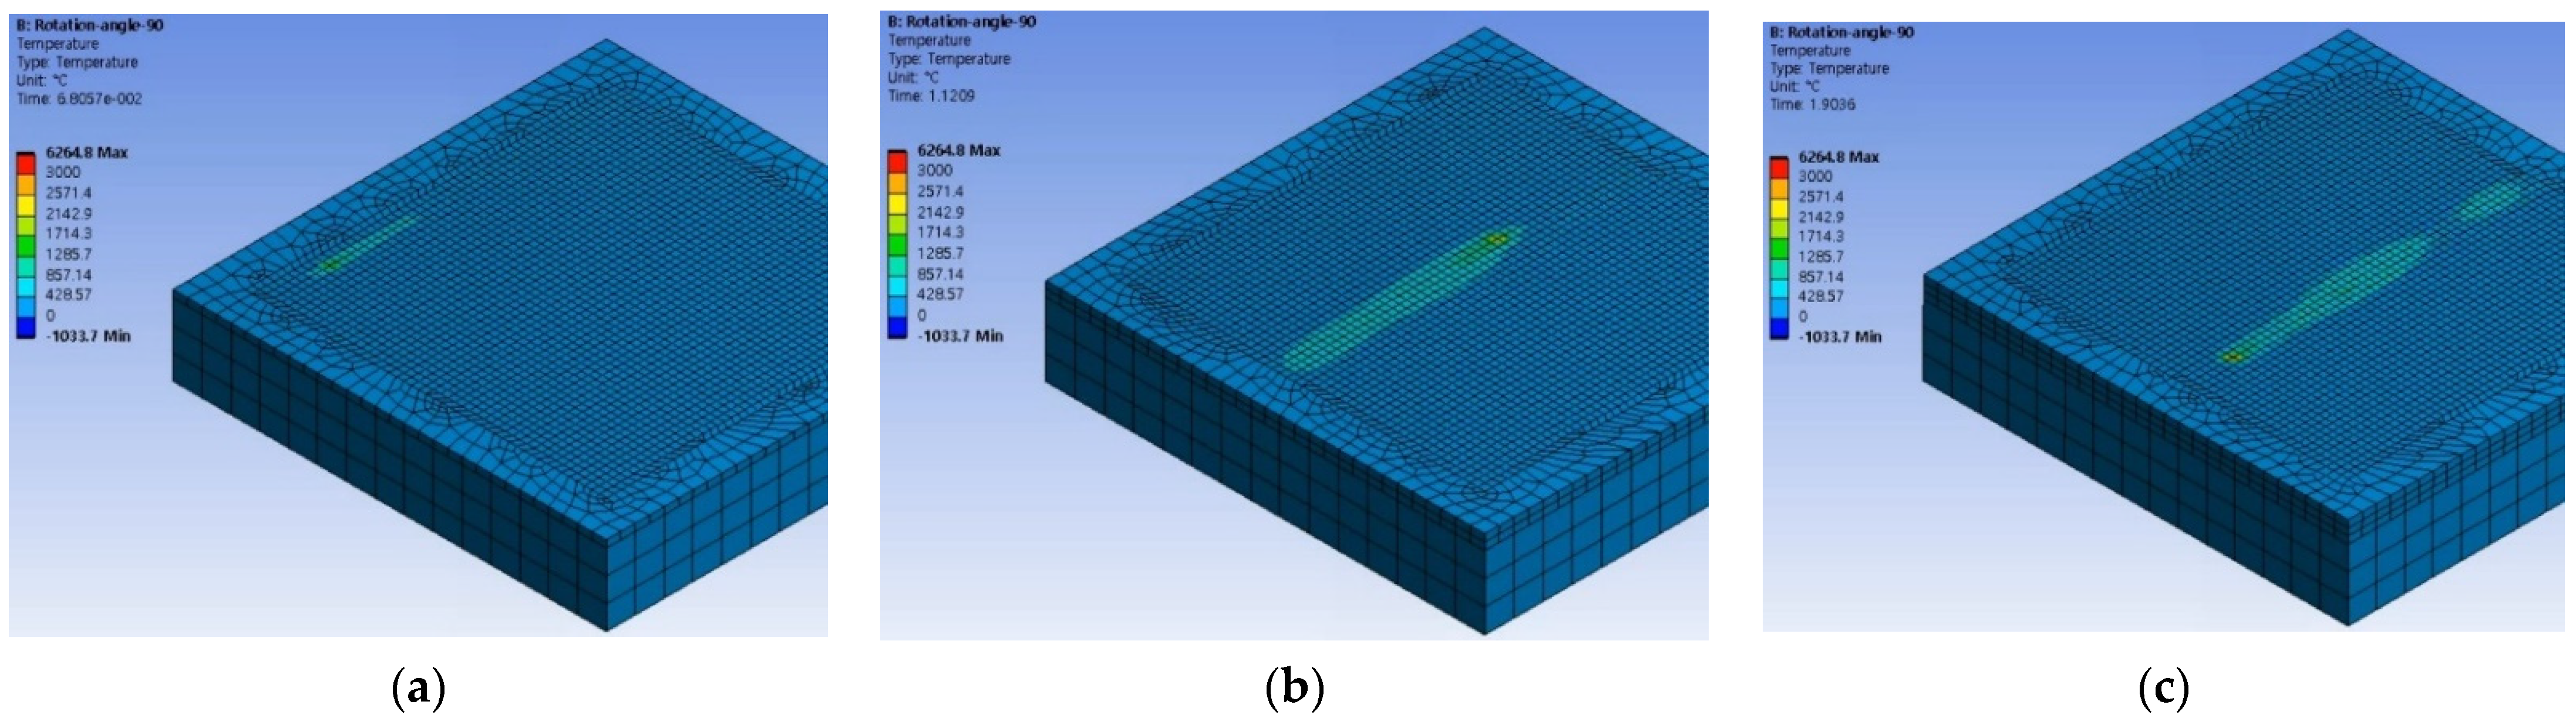
Based on numerical analysis, the heat input process achieved by stacking the pattern and stacking layers sequentially was confirmed. Based on the analysis results shown in
Figure 4, it can be confirmed that the heat source was applied to the powder layer, and the temperature increased depending on the heat input. In addition, it was confirmed that the heat source propagated based on the irradiation position of the laser, and traces remained in the longitudinal direction. Furthermore, two and three layers were stacked, and the heat input process was continued.
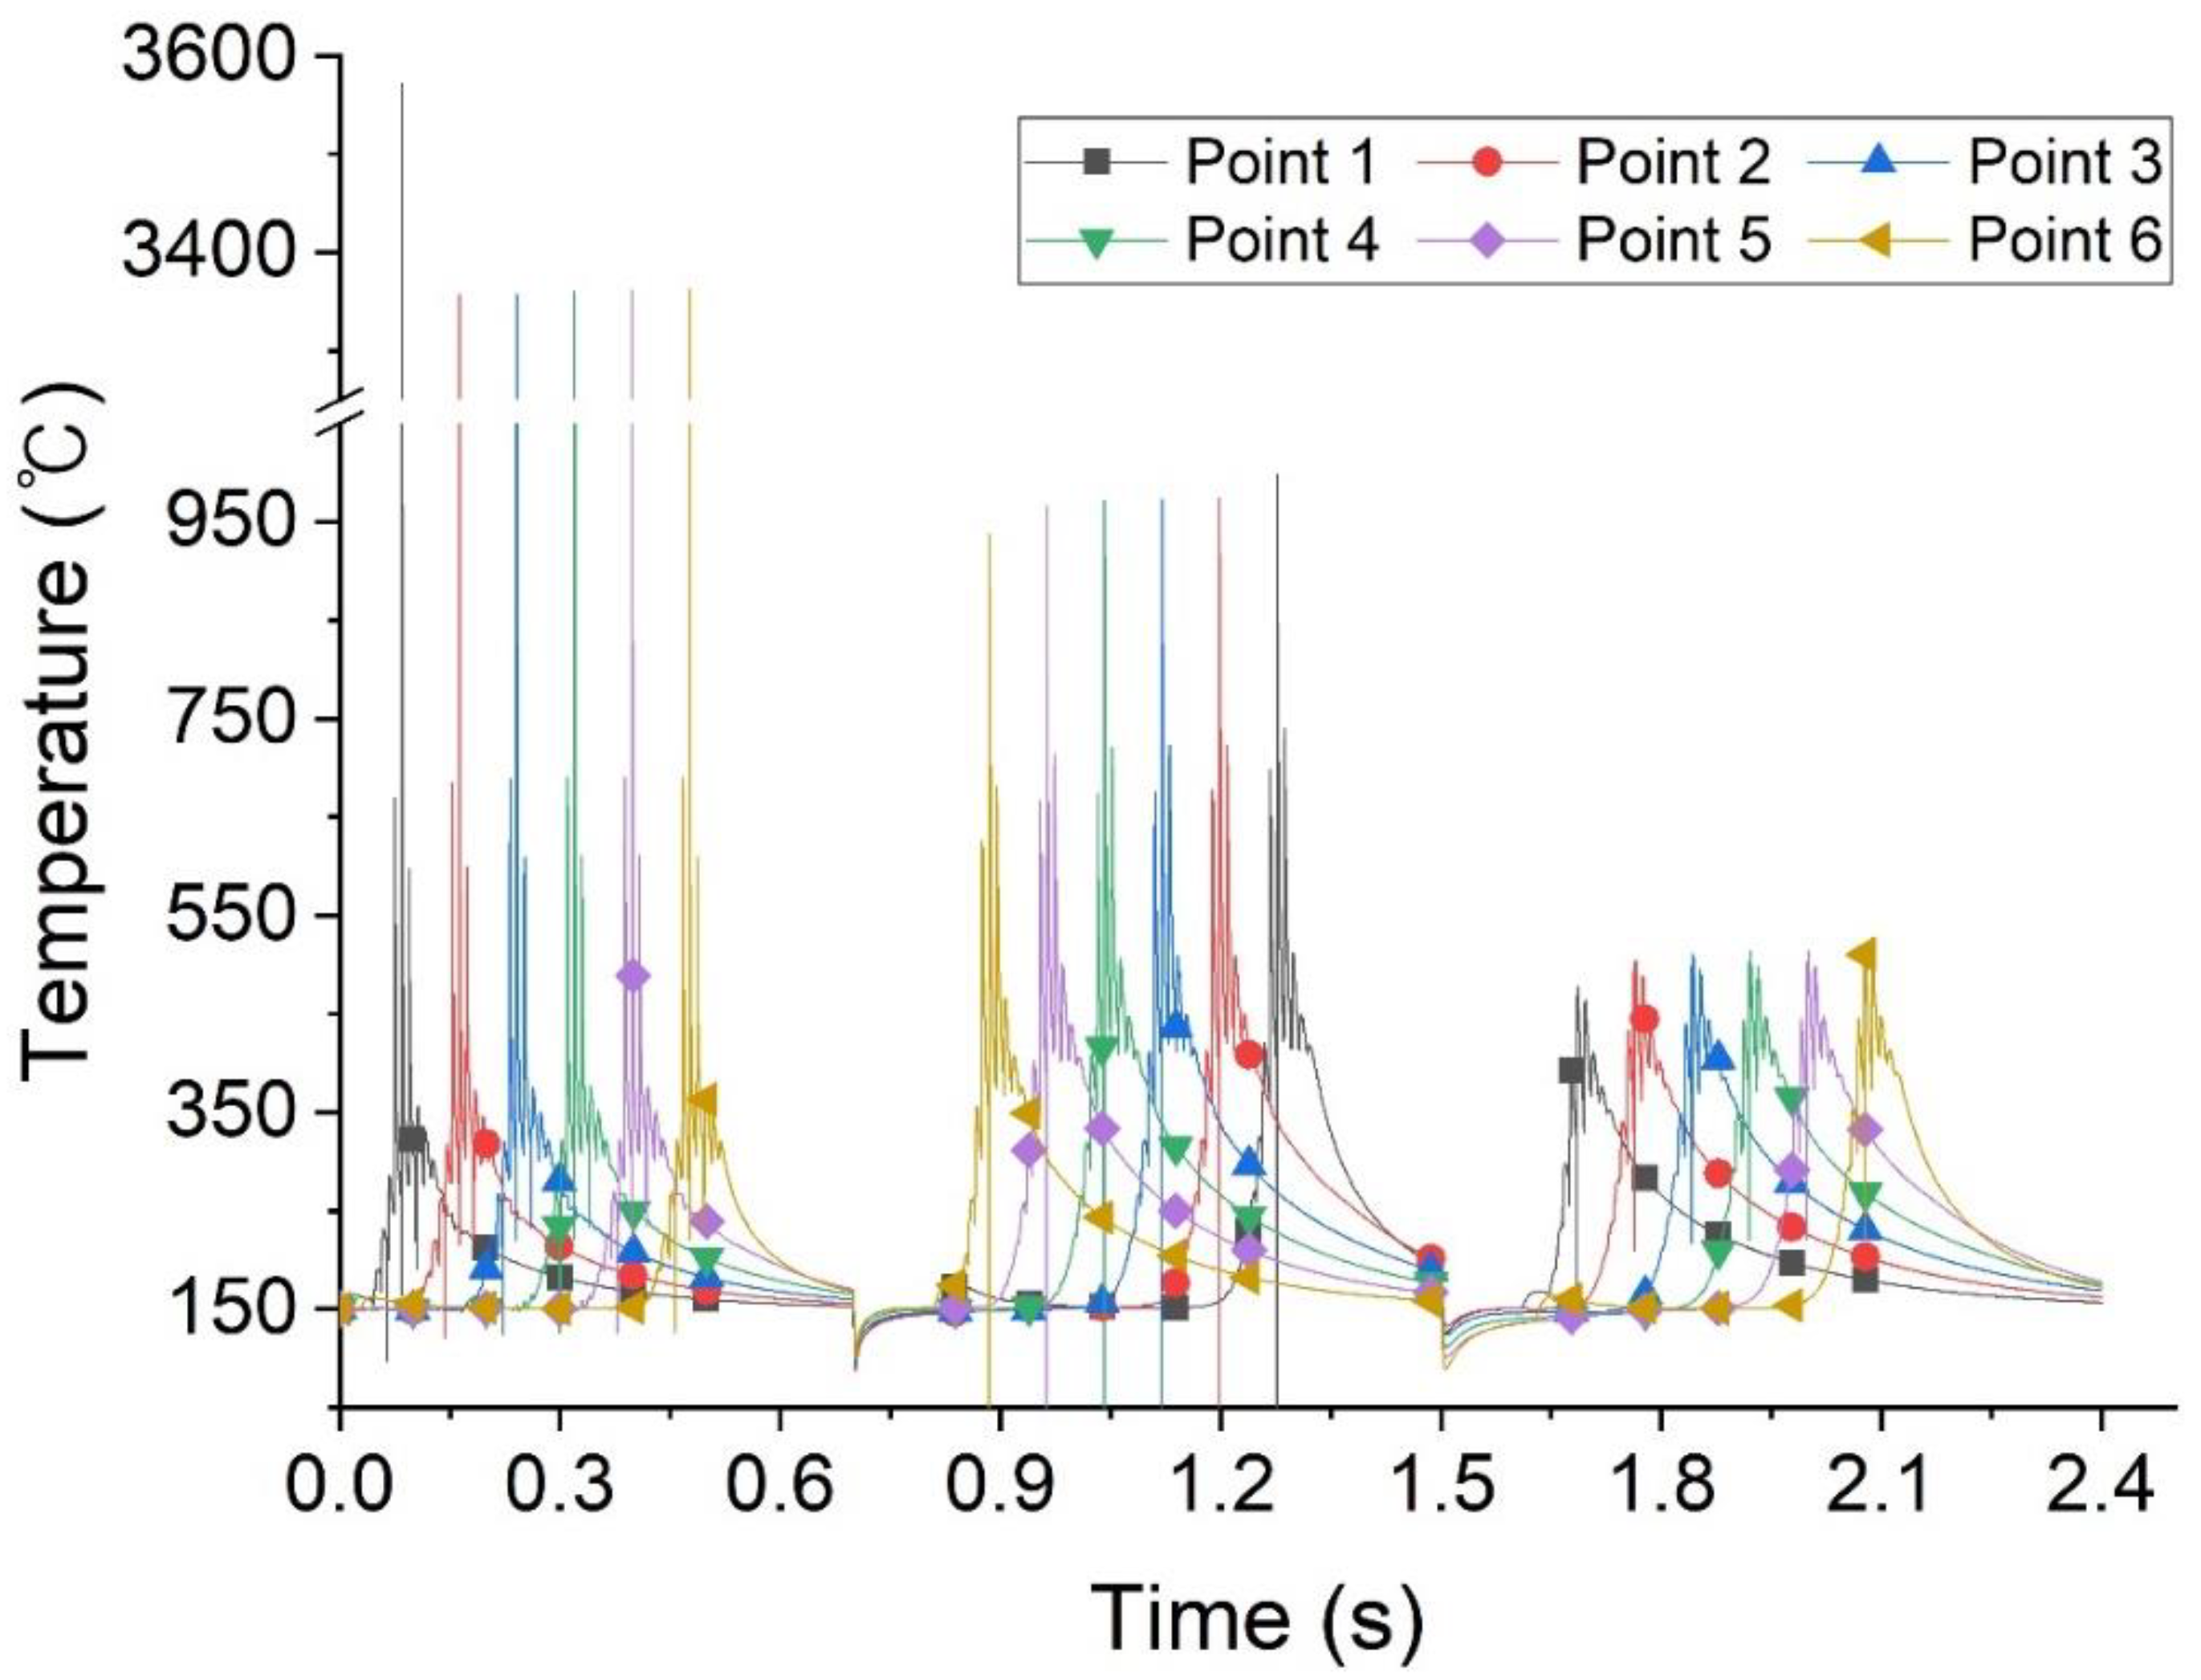
To examine the effect of the lower layer due to the heat input of the upper layer, the temperature and residual stress changes were confirmed. As the heat source propagated, the temperature changed in the six points at the center of the first layer shown in
Figure 2. The results are illustrated in
Figure 5, and the resulting residual stress changes are shown in
Figure 6. The direction of the laser heat source in each layer is in the opposite direction, and accordingly, the order of temperature change and residual stress change at six points is also reversed.
When the laser was irradiated at the first layer and the melting process was simulated, the temperature of the element increased and residual stress formed rapidly; the temperature and residual stress changed owing to the second and third laminations. It was inferred that re-melting can be confirmed based on the temperature change in the first layer, which was affected by the second and third layers, and that fusion between the layers can be performed, as in the actual process. It was confirmed that the residual stress changed, owing to the heat applied to the upper layer. When the laser was irradiated at the second and third layers, residual stress was relaxed by the heat of the upper layer instantaneously and restored to a different value. Based on these results, it was confirmed that the cooling rate was changed depending on the location and the temperature of the element, thereby affecting the residual stress.
As shown in
Figure 7, the final residual stress and temperature distribution above the last layer were simulated. It was confirmed that heat generated by laser irradiation was conducted and dissipated through the base material and powder, whereas residual stress was generated in a specific pattern. This imbalance in the residual stress resulted in distortion and cracking.
In particular, in the case of the 180° pattern, a force was applied to the base material in the same direction as the path, as previously confirmed in the basic analysis, owing to the repetition of the same pattern [
10]. The residual stress in the lower region was amplified based on the laser path, which was confirmed through changes in the residual stress on the lower surface.
3.2. Analysis Results Based on Rotation Angle
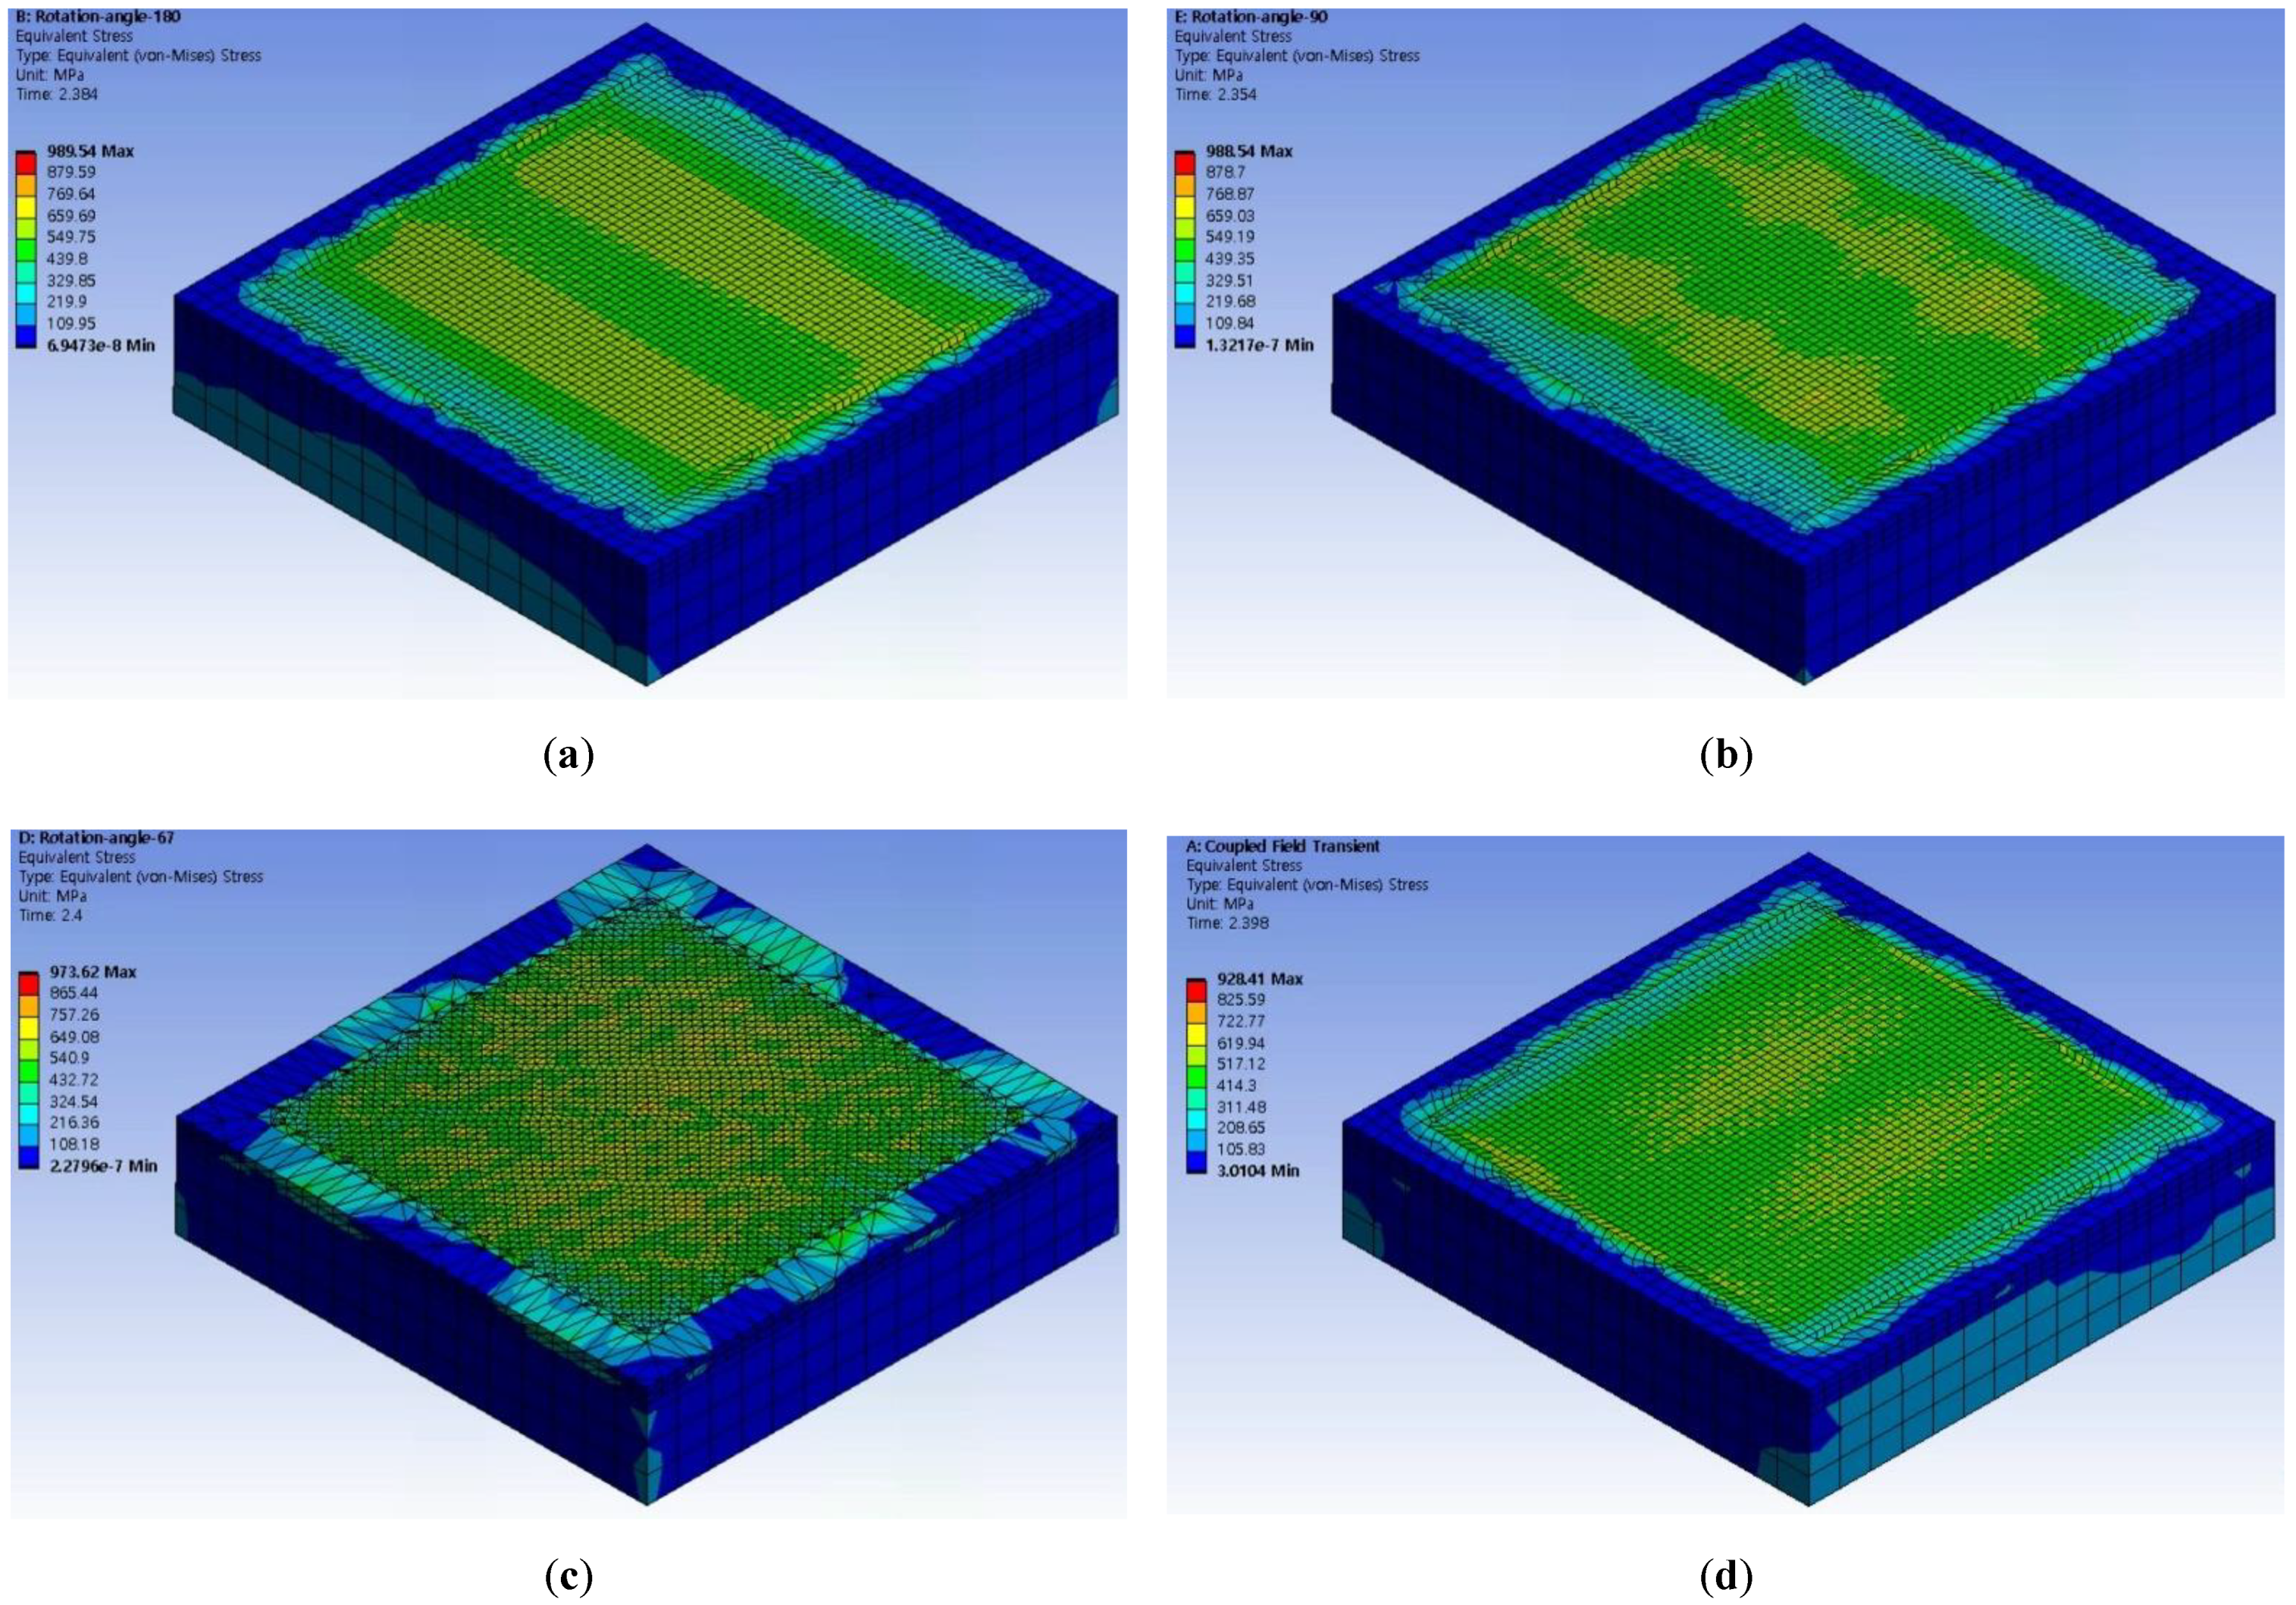
To confirm the effect of the laser path, the analysis results were confirmed for the 45°, 67°, and 90° conditions of the laser pattern. In the analysis, all the setting values, except for the path rotation angle, were set to be the same, and the results were confirmed after stacking three layers.
Figure 8 shows the analysis results for each angle, which are the results associated with the residual stress after the lamination of the three layers.
Based on the analysis results, it was discovered that the pattern of the residual stress changed significantly; in particular, for the 180° specimen, residual stress was formed in the lower solid region in a specific direction as the repeated pattern overlapped. As suggested in previous papers, these results show that twisting occurred in the same direction as the laser direction because of repeated thermal expansion and contraction, which was formed under conditions in which cracks are likely to occur [
12].
When comparing the applied stress to the underlying substrate and the average residual stress, the 90° rotation path results show that the stress concentration is more relaxed than the 180° rotation path condition. Additionally, similar to the results of 45° and 67° rotations, the concentrated residual stress dispersed as the overlap in the angle disappeared. In the 67° condition, the pattern angles of each layer were different and overlapped irregularly. The 45° condition looked like the 90° condition, but based on the maximum stress and average stress, it had a dispersion value similar to 67°. Based on this residual stress distribution, the differences based on the laser path of 3D printing can be identified, and problems that may occur during specimen printing can be verified via the FEM model.
3.3. Experimental Verification
To verify the experimental results, a specimen was printed using a metal 3D printer. The equipment used for printing was the ‘Orlas creator’ equipment of the ‘OR laser’ company. The processing variables were set to be the same as that used in the simulation, and the other values used are summarized in
Table 2 [
13]. Specimen printing was performed such that the same pattern as that in the analysis was applied, and computed tomography scans were performed to verify the shape and printing quality of the specimen. Except for the 180° specimen, some pores appeared inside the specimen; however, they were not sufficiently many to affect the overall quality.
Figure 9 shows the result of photographing at approximately 1 mm high for the specimen. The reason for this, however, is to ignore the cracks that occur when the lower support is separated from the base plate. Unlike other specimens, the 180° specimen observed had cracks that occurred in the corners. The initial laser path angle was set at 45° and was printed by applying the same heat input path to each layer. Consequently, cracks occurred in the corners. Furthermore, as confirmed by numerical analysis, cracks occurred owing to the concentration of deformation stress and thermal deformation at the end of the laser path. Based on the numerical analysis results, it was confirmed that stress was generated in the direction where the specimen was lifted from the corner and that stacking was repeated in the height direction of the specimen, resulting in cracks in the lower region.
3.4. Measurement and Comparison of Residual Stress
To confirm the accuracy of the analysis results, the residual stress was measured using X-ray diffraction (XRD). The Debye ring was measured using XRD to measure the area and accuracy, and the residual stress was calculated by calculating the cos α value [
14,
15]. The device used for the measurement was μ-X360 FULL 2D from Pulstec. The measurement conditions were 30 kV and 1.2 mA. The measurement area was 2 mm in diameter, and the average value of this area was used.
The XRD measurement was performed based on a 2 mm area in the center of the upper surface of the specimen. The residual stress was measured by calculating the Debye ring using an X-ray diffraction value of 557 points at the measurement position. The residual stress was calculated based on the measured Debye ring values and compared for each specimen.
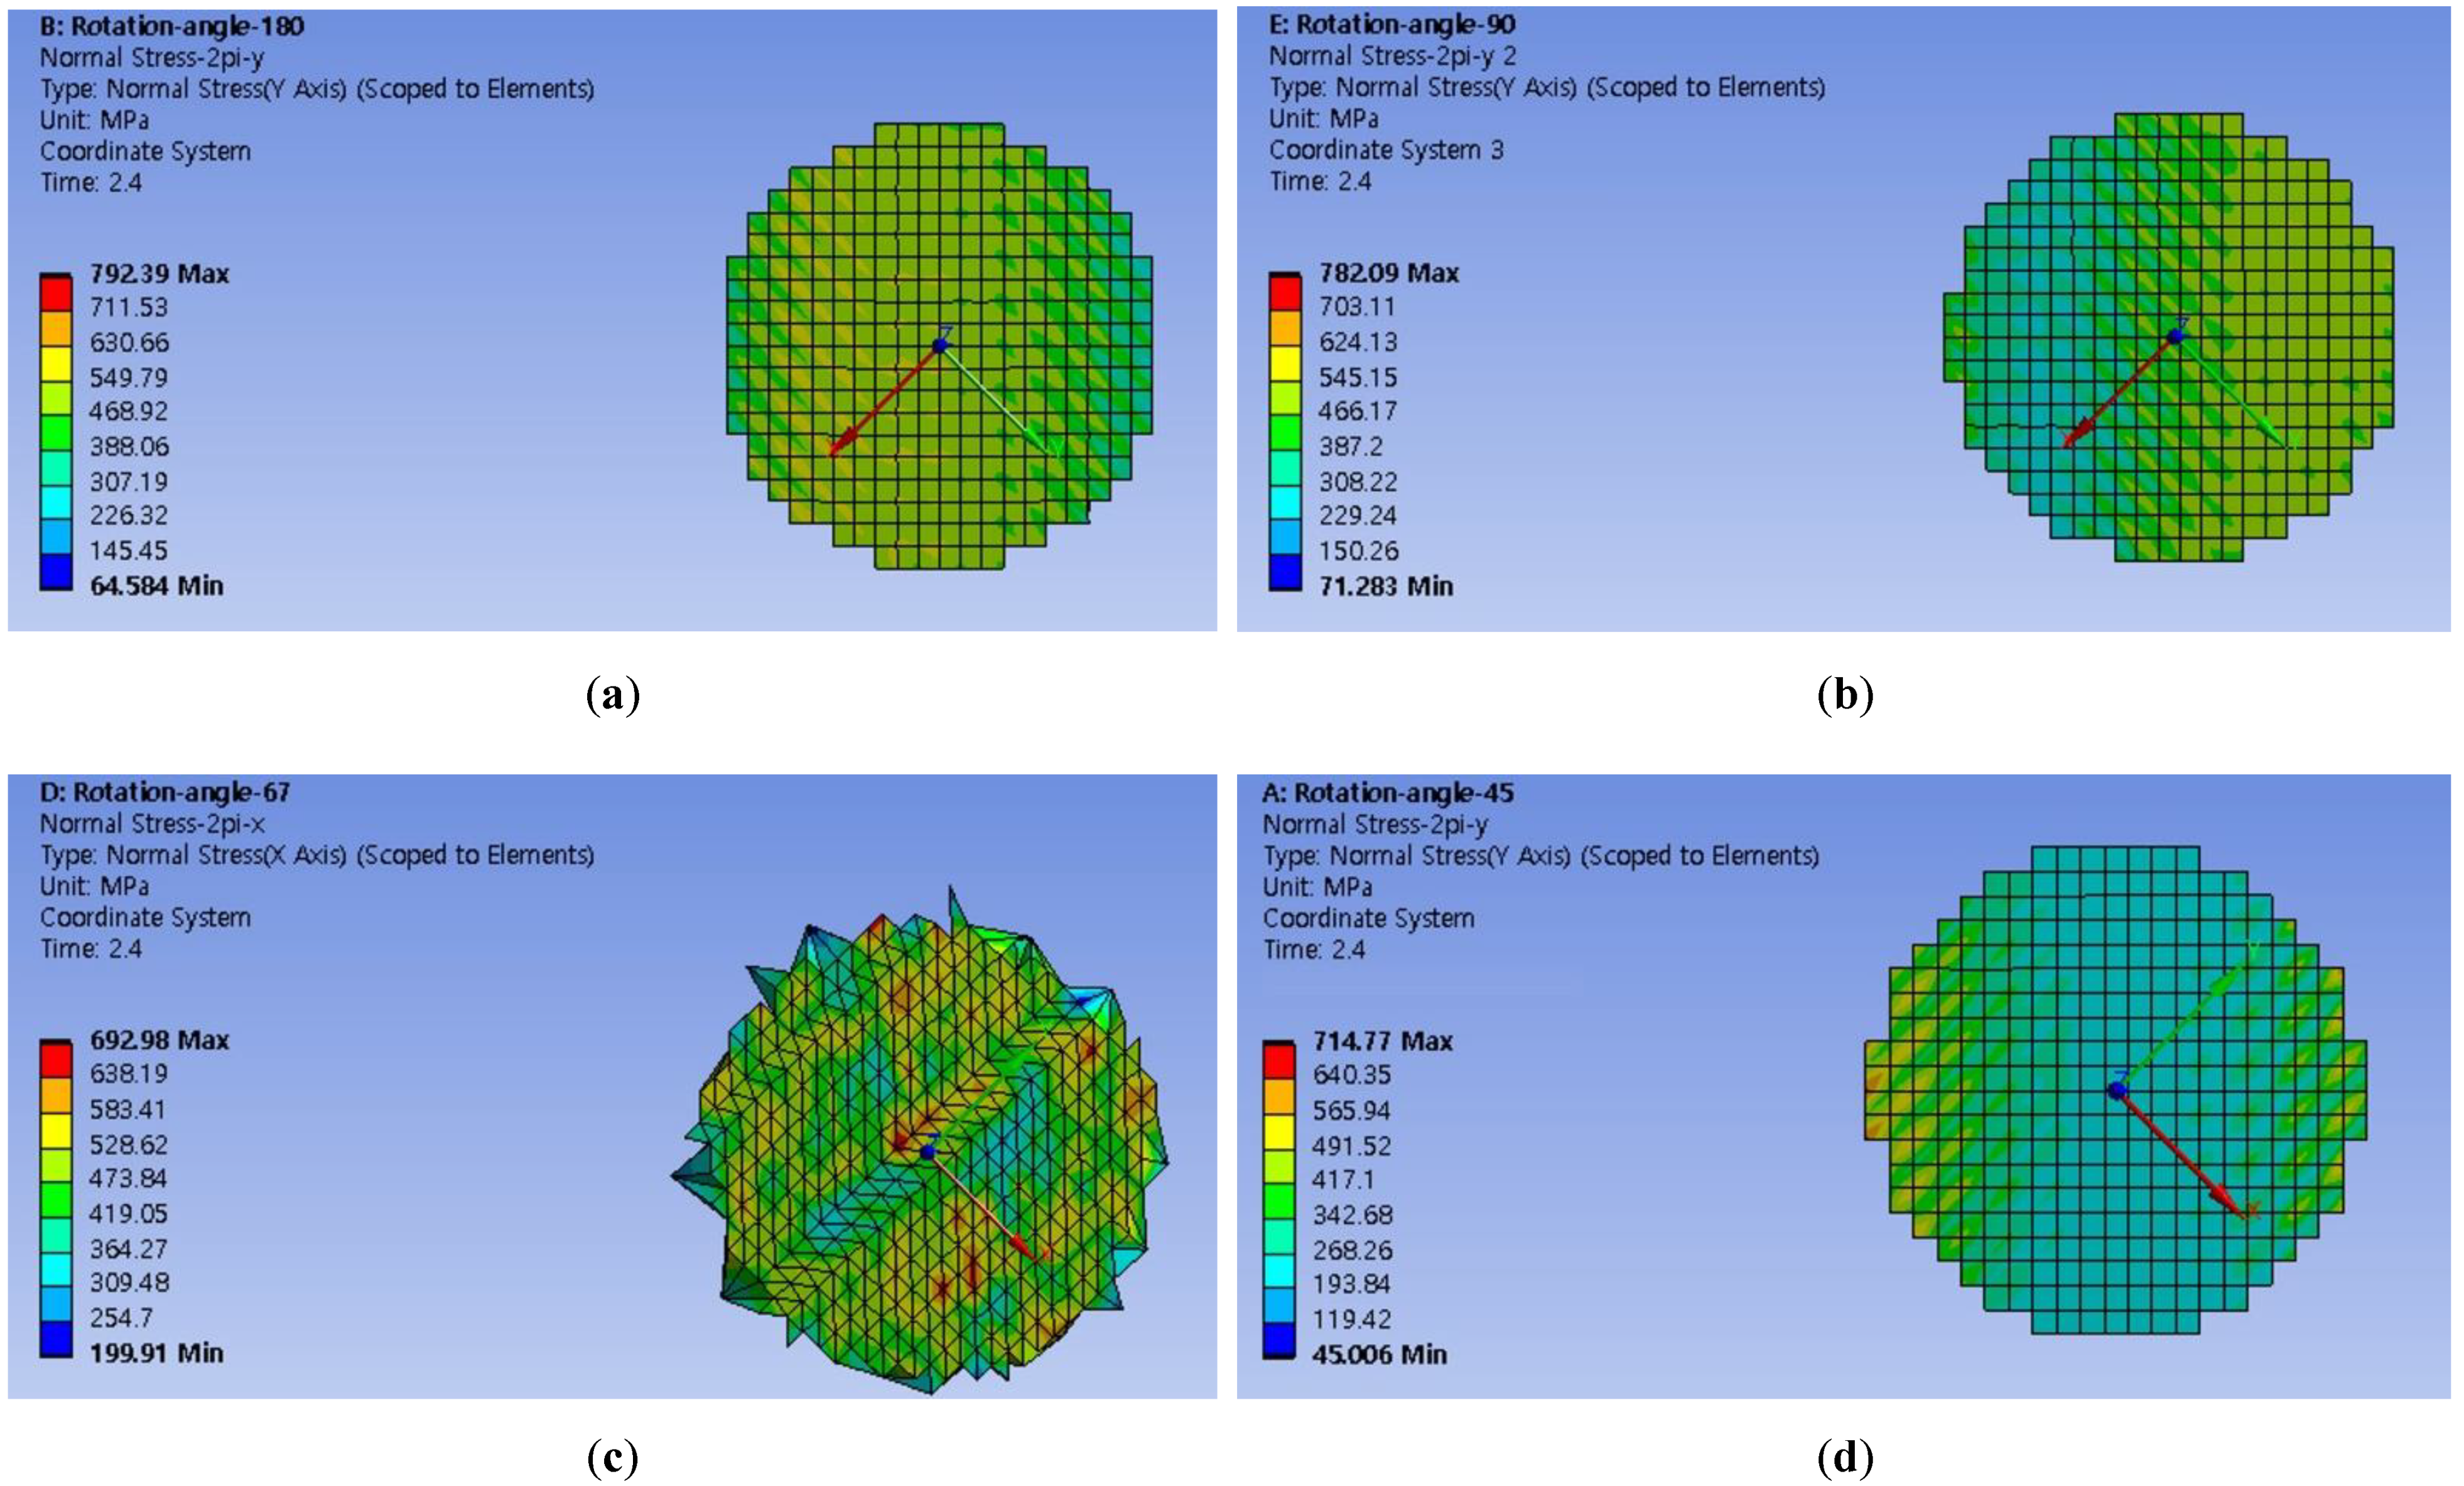
The average value of the 2-mm diameter area was calculated to compare the measured and analyzed values.
Figure 10 shows the element corresponding to the 2-mm region of the specimen surface and its residual stress value.
The residual stress values derived from the analysis are summarized in
Table 3, in addition to the XRD measurement results. It was confirmed that the overall analysis results were consistent, except for the specimen with a 180° rotation angle. For the 180° specimen, based on previous CT scan results, cracks occurred in the lower region and affected the residual stress. As illustrated in
Figure 11, it was confirmed that the remaining three specimens demonstrated relatively accurate results, with an error of approximately 8.86%, except for the 180° specimen, which exhibited a crack. Based on these results, it was concluded that the simulation simulated the actual process accurately.
3.5. Analysis of Causes of Cracks via Comparison of Residual Stress
To analyze the cause of the crack in the lower region of the specimen, the maximum residual stress results were compared based on the elastic–plastic properties applied to the analysis.
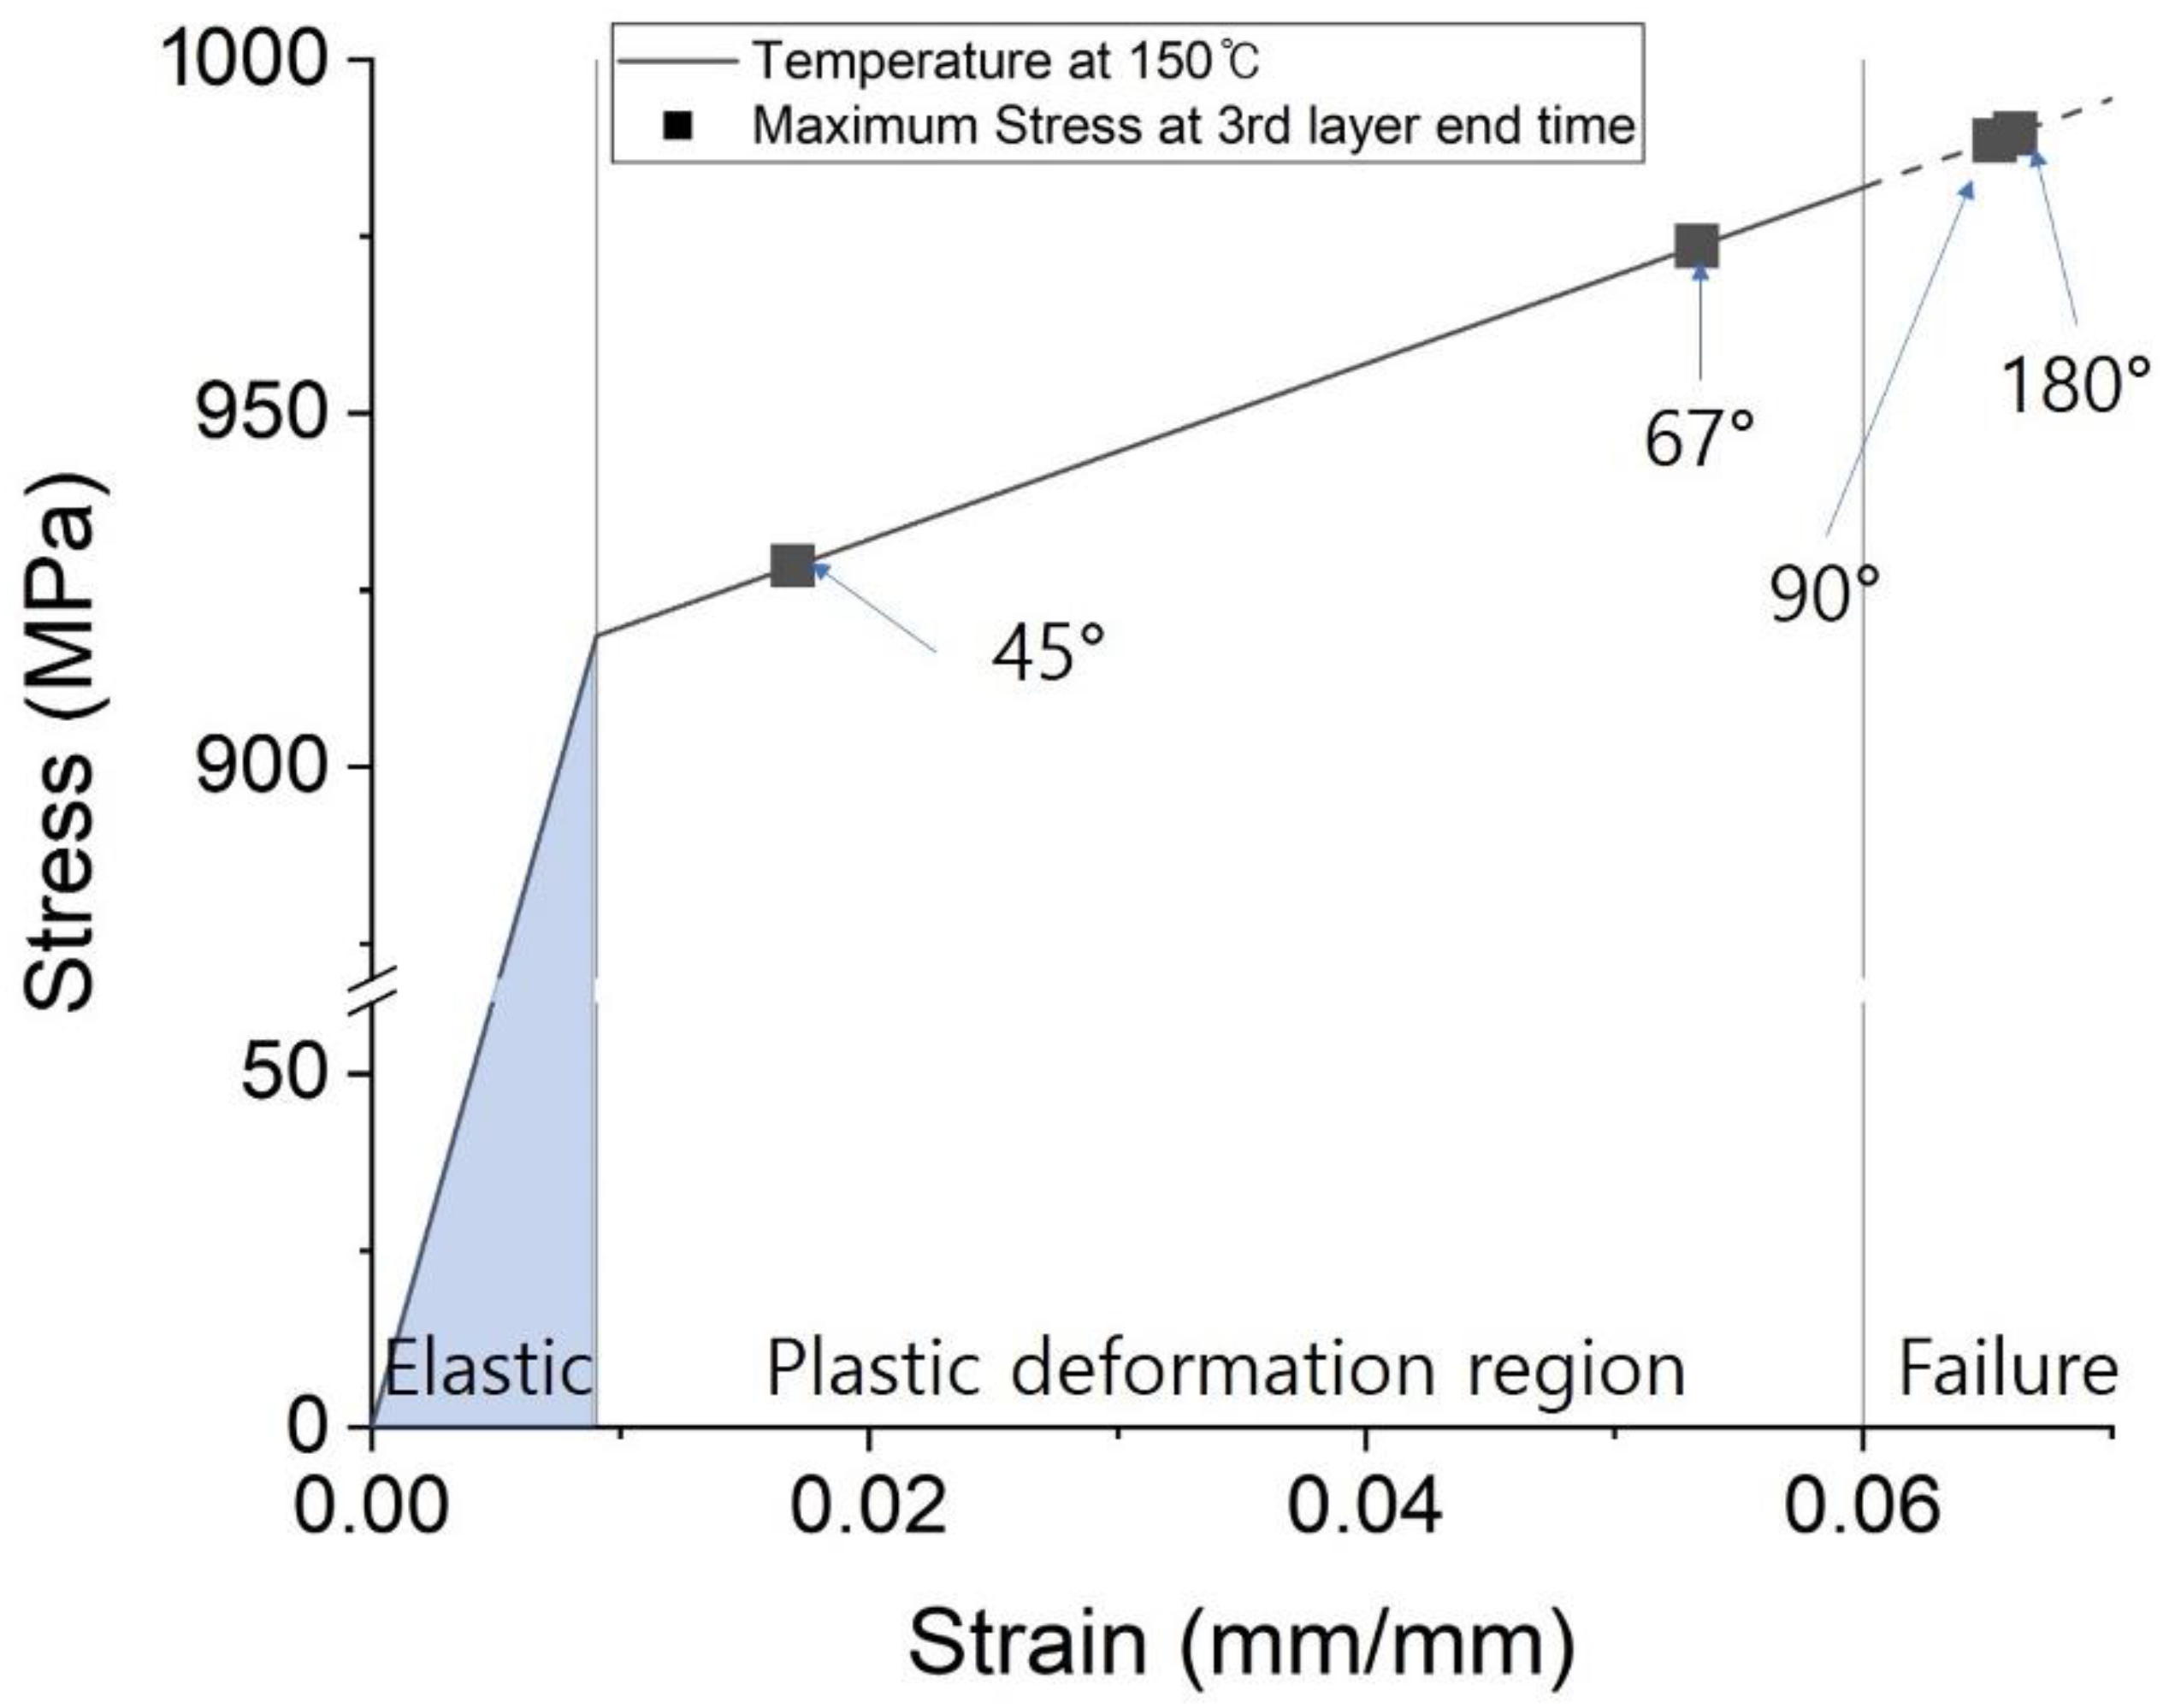
Figure 12 shows the stress–strain curve based on the specimen heated to 150 °C, which was the preheating temperature applied to the analysis. As indicated in the graph, based on references [
16,
17], approximately 0.06 mm/mm was based on the maximum tensile strain. The analysis results for each stacking angle are shown in the graph based on the maximum residual stress value, and it was confirmed that a significant difference occurred at each angle. In the 180° and 90° specimens, maximum residual stress occurred beyond the breaking stress, whereas in the 67° and 45° specimens, maximum residual stress occurred in the plastic deformation region.
In each analysis result, the area where the maximum residual stress occurred was the lower edge region in contact with the base material. Based on the change in residual stress in the analysis, the temperature change caused by the direct heat input of the laser did not reach the fracture stress, as confirmed in a previous study. Additionally, it was calculated that additional residual stress was generated because of the upper lamination, and it exceeded the fracture standard [
10].
Based on the comparison between the measured residual stress and the analysis values shown in
Figure 11, it was discovered that cracks occurred at the bottom of the 180° and 90° specimens in excess of the fracture stress owing to the stacking of the upper layer. Although not confirmed by CT results, it was inferred that local destruction occurred even in the 90° specimen, which resulted in an error between the analysis and measurement.
In the 67° and 45° specimens, the maximum residual stress applied to the specimen did not exceed the fracture stress of the material; hence, it was concluded that the results between the analysis and measurement were accurate. In addition, for the 45° specimen, a relatively low amount of firing occurred, and the residual stress was measured for a low value of residual stress.
4. Conclusions
In this study, a metal 3D printing process was simulated using FEM, and a specimen was printed under the same conditions to validate the analysis results. Owing to the characteristics of the 3D printing process using laser, various thermal and structural phenomena occurred, and they were difficult to observe directly. Therefore, the 3D printing process was analyzed via FEM, which is a numerical analysis technique. In particular, the phenomenon that occurred during lamination was confirmed via a thermal-structure two-way coupled analysis. The elastic behavior due to thermal deformation and thermal expansion was considered, enabling the residual stress to be calculated more realistically. In addition, to simulate the 3D printing process conditions, a subroutine was configured to propagate based on the path and layer in which the heat input position by the laser was set.
Based on previous studies, the lamination process of three layers was simulated for an area measuring 5 mm × 5 mm. Hatching with a snake pattern was simulated on the inner area after border processing to emulate the actual process. Four cases with different rotation angles of the layer pattern were calculated using FEM to confirm the difference based on the pattern. Subsequently, the specimens were printed under the same conditions, and the results obtained were compared with the analysis results. To confirm the printing state of the specimen, CT was performed to examine the pores and cracks in the specimen. Subsequently, the residual stress was measured and compared to verify the analysis results, and consistency between results was confirmed.
In the 180° specimen, a significant error in residual stress was indicated; consequently, residual stress relief occurred owing to cracks in the lower region of the specimen, as confirmed by the CT results. Based on the stacked analysis results, it appeared that internal cracks occurred owing to excessive stress in a specific area. In the specimens with patterns of different angles, the overlap of stress was offset or insufficient stress was applied, resulting in cracks.
These results confirmed that the 3D printing FEM model conducted in this study can be used to analyze residual stress and cracks in materials that were difficult to analyze in previous studies. The model used in this study applies various variables in combination, from the material to the process conditions of the printing equipment, and it can be used to understand the complex phenomenon of the variables as well as verify changes that cannot be easily measured in processes. The FEM model configured in this study is expected to facilitate investigations into the 3D printing process and the design of more efficient methods. In the future, an analysis will be conducted such that the hatch pattern is placed repeatedly in the adjacent area, and the phenomenon that occurs during coarse shape processing will be investigated. For various applications, additional studies regarding the differences in laser pattern and process variables are required, and these studies are expected to advance the FEM model of this study.
Author Contributions
Conceptualization, C.-h.J., M.G.L. and Y.J.; methodology, C.-h.J., M.G.L. and Y.J.; software, C.-h.J.; validation, C.-h.J. and C.N.; investigation, C.-h.J.; writing—original draft preparation, C.-h.J.; writing—review and editing, C.-h.J. and M.G.L.; supervision, Y.J.; funding acquisition, Y.J. All authors have read and agreed to the published version of the manuscript.
Funding
This work was supported by the Korea Institute of Energy Technology Evaluation and Planning (KETEP) and the Ministry of Trade, Industry & Energy (MOTIE) of the Republic of Korea (No. 20206410100080).
Institutional Review Board Statement
Not applicable.
Informed Consent Statement
Not applicable.
Data Availability Statement
Not applicable.
Conflicts of Interest
The authors declare no conflict of interest.
References
- Thomas, D.S.; Gilbert, S.W. Costs and Cost Effectiveness of Additive Manufacturing. NIST Spec. Publ. 2014, 1176, 12. [Google Scholar] [CrossRef]
- Panwisawas, C.; Tang, Y.T.; Reed, R.C. Metal 3D printing as a disruptive technology for superalloys. Nat. Commun. 2020, 11, 2327. [Google Scholar] [CrossRef] [PubMed]
- Cheng, L.; To, A. Part-scale build orientation optimization for minimizing residual stress and support volume for metal additive manufacturing: Theory and experimental validation. Comput. Des. 2019, 113, 1–23. [Google Scholar] [CrossRef]
- Xia, M.; Gu, D.; Yu, G.; Dai, D.; Chen, H.; Shi, Q. Porosity Evolution and its Thermodynamic Mechanism of Randomly Packed Powder-bed during Selective Laser Melting of Inconel 718 Alloy. Int. J. Mach. Tools Manuf. 2017, 116, 96–106. [Google Scholar] [CrossRef]
- Shrestha, S.; Chou, K. A build surface study of Powder-Bed Electron Beam Additive Manufacturing by 3D thermo-fluid simulation and white-light interferometry. Int. J. Mach. Tools Manuf. 2017, 121, 37–49. [Google Scholar] [CrossRef]
- Michaleris, P. Modeling metal deposition in heat transfer analyses of additive manufacturing processes. Finite Elem. Anal. Des. 2014, 86, 51–60. [Google Scholar] [CrossRef]
- Takezawa, A.; To, A.C.; Chen, Q.; Liang, X.; Dugast, F.; Zhang, X.; Kitamura, M. Sensitivity analysis and lattice density optimization for sequential inherent strain method used in additive manufacturing process. Comput. Methods Appl. Mech. Eng. 2020, 370, 113231. [Google Scholar] [CrossRef]
- Jung, C. Thermal-structure Coupled Analysis Modeling and Design of Metal 3D Printing for Residual Stress Analysis. Ph.D. Thesis, Ajou University, Suwon, Korea, August 2021. [Google Scholar]
- Vastola, G.; Zhang, G.; Pei, Q.-X.; Zhang, Y.-W. Controlling of residual stress in additive manufacturing of Ti6Al4V by finite element modeling. Addit. Manuf. 2016, 12, 231–239. [Google Scholar] [CrossRef]
- Jung, C.-H.; Lee, M.G.; Jeon, Y. Metal 3D Printing Simulation through Thermal-structure Coupled Numerical Analysis. J. Korean Soc. Manuf. Technol. Eng. 2021, 30, 389–395. [Google Scholar] [CrossRef]
- Robinson, J.H.; Ashton, I.R.T.; Jones, E.; Fox, P.; Sutcliffe, C. The effect of hatch angle rotation on parts manufactured using selective laser melting. Rapid Prototyp. J. 2019, 25, 289–298. [Google Scholar] [CrossRef]
- Hodge, N.; Ferencz, R.; Vignes, R. Experimental comparison of residual stresses for a thermomechanical model for the simulation of selective laser melting. Addit. Manuf. 2016, 12, 159–168. [Google Scholar] [CrossRef]
- Advanced Powders, Ti-6AI-4V Gr. 23. Available online: https://www.advancedpowders.com/powders/titanium/ti-6al-4v-23 (accessed on 21 June 2021).
- Fitzpatrick, M.E.; Fry, A.T.; Holdway, P.; Kandil, F.A.; Shackleton, J.; Suominen, L. Determination of Residual Stresses by X-ray Diffraction; National Physical Laboratory: London, UK, 2005. [Google Scholar]
- Miyazaki, T.; Maruyama, Y.; Fujimoto, Y.; Sasaki, T. Improvement of X-ray stress measurement from a Debye–Scherrer ring by oscillation of the X-ray incident angle. Powder Diffr. 2015, 30, 250–255. [Google Scholar] [CrossRef]
- Peng, K.; Duan, R.; Liu, Z.; Lv, X.; Li, Q.; Zhao, F.; Wei, B.; Nong, B.; Wei, S. Cracking Behavior of René 104 Nickel-Based Superalloy Prepared by Selective Laser Melting Using Different Scanning Strategies. Materials 2020, 13, 2149. [Google Scholar] [CrossRef] [PubMed]
- Hou, X.; Liu, Z.; Wang, B.; Lv, W.; Liang, X.; Hua, Y. Stress-Strain Curves and Modified Material Constitutive Model for Ti-6Al-4V over the Wide Ranges of Strain Rate and Temperature. Materials 2018, 11, 938. [Google Scholar] [CrossRef] [PubMed] [Green Version]
| Publisher’s Note: MDPI stays neutral with regard to jurisdictional claims in published maps and institutional affiliations. |
© 2022 by the authors. Licensee MDPI, Basel, Switzerland. This article is an open access article distributed under the terms and conditions of the Creative Commons Attribution (CC BY) license (https://creativecommons.org/licenses/by/4.0/).


