Abstract
In order to solve the impact on the accuracy of a life prediction model when the initial crack angle of the curved surface is not 0°, the traditional stress intensity factor model is revised by the non-linear regression analysis method, and an optimized crack growth model is established. This paper takes the surface of the bottle neck of the pressure vessel as the research object, and uses the finite element method to establish a simulation model with an initial crack angle of not 0°. By analyzing the stress intensity factors of different starting angles, the relationship between the correction factor F and the pressure vessel wall thickness h, the radius of curvature R of the joint surface between the bottle neck and the bottle body, the initial crack length L and the initial angle α are calculated. The modified stress intensity factor is used to optimize the crack growth model of the pressure vessel. The experiment proves that the accuracy of the pressure vessel life prediction model is improved.
1. Introduction
With the wide application of pressure vessels in the industry, the life assessment of pressure vessels has become more and more important. When using fracture mechanics or failure assessment diagrams to evaluate the life of pressure vessels, it is necessary to know the stress intensity factor at the crack tip in advance. Hossain Akhi Atika and other scholars [1,2] proposed the use of various aspect ratios (ratio of crack depth to crack length) and relative depth (ratio of crack depth to pipe thickness) to characterize different semi-elliptical defects, and evaluate the SIFs with surface defects. Qing Dong [3] modeled the low-cycle fatigue of crack propagation exploring J-integral. Apu Sarkar [4] modeled and explained the mechanism for the low-cycle fatigue crack propagation of the pressure vessel. Diego F. [5] combined the simulation approach of the initiation–growth–arrest algorithm with XFEM, and proposed a new simulation approach for crack initiation and propagation. Tang Huaizi [6,7] considered the influence of the distribution form on the stress intensity factor, using the power series expansion method and the weight function method, and obtained the applicable range of the formula for calculating the stress intensity factor under uniform and non-uniform distribution pressures. Zhu Yongqiang [8] established a flexural crack model on a wave-shaped interface, and studied the influence of structural parameters on porosity, pore distribution and TC layer thickness, interface roughness, and crack tip on the wave-shaped interface. Scholars, such as Shen Qingqing [9,10], considered the influence of the relative positions of multiple cracks on their stress intensity factors, analyzed the interaction mechanism of multiple cracks, and obtained the strengthened and weakened areas of the stress intensity factor. Wang Xin [11] considered the uneven distribution of stress and calculated the complex stress intensity factor solution to verify the closed form weight function derived from several nonlinear normal and shear stress distributions. Wei Shen [12,13] proposed using the hot-spot stress method to calculate the stress intensity factor of a tubular T-joint, but its limitation is that it does not consider the effect of the crack angle. Jun Ishimoto [14] computed the crack propagation of the pressure vessel using a hybrid of the coupled particle and Eulerian methods. Binbin Zhou [15] investigated the crack propagation for the composite plate.
All the above models assume that the initial crack angle of the curved surface is 0°, equivalent to the normal direction of the curved surface. The influence of the angle α between the initial crack direction and the normal direction is not considered for the crack growth. In fact, the size of the initial crack angle affects the direction of the crack propagation and the stress distribution of the model. Therefore, we take the neck joint surface body of the pressure vessel bottle as the research object, considering the initial crack angle of the curved surface. To perform this, we modify the stress intensity factor formula and then apply the modified formula to optimize the crack propagation model of the pressure vessel.
2. Theoretical Derivation
2.1. Stress Intensity Factor Correction Formula
In the traditional pressure vessel crack growth model, assuming the initial crack angle is 0°, the stress intensity factor K of the crack growth model [16] is:
Breaking the assumption that the initial crack propagation angle is 0°, we assume the stress intensity factor F is affected by the crack initiation angle α, where F is a coefficient variable. Therefore, we can express the crack growth model when the crack initiation angle is α as Formula (2). The modified stress intensity factor K* is:
For the above formulas, is the stress on the inner wall of the cylinder, R is the average radius of the curvature, h is the thickness of the pipe wall, a is the half-crack length, is the Poisson’s ratio, and is the shell parameter. can be calculated directly from the material parameters by Formula (3). is a constant equation, so can be directly calculated by .
2.2. Based on the Revised Crack Growth Formula
For the life prediction of metal materials, the fracture analysis method is mostly used. The fracture analysis method uses the Paris formula to calculate the crack growth rate to obtain the life cycle of the container failure. The traditional Paris formula [17] is presented as Equation (4):
where C and m are the material constants, ∆K is the increment of the stress intensity factor, is the crack growth, is the number of cycles, and is fatigue crack growth rate. In the category of elastic fracture mechanics, the following relationship between the stress intensity factor increment ∆K and the strain energy release rate ∆G is:
where
By combining (2) and (5), the modified can be obtained:
Considering that the stress intensity factor correction factor F is a constant coefficient related to the initial state of the crack, the Formula (7) can be rewritten as:
Based on the low-cycle fatigue crack growth criterion of components under subcritical cyclic loading, the G-form strain energy expression of the Paris formula is presented as Formula (9):
By combining (8) and (9), the modified fatigue crack growth rate is presented as Formula (10):
where and are the material constants. From this, the relationship between the parameters and the modified Paris formula parameters C, m can be calculated as:
3. Simulation of the Stress Intensity Factor Correction Factor
3.1. Model Establishment
In order to obtain the stress intensity factor correction factor F, we take the bottleneck surface of the pressure vessel as the research object and use the ABAQUS simulation software platform to establish the model. The model is an axisymmetric structure with fixed constraints on the bottom, shown in Figure 1, where h is the wall thickness of the cylinder, is the outer diameter of the bottleneck, is the inner diameter of the bottleneck, and R is the radius of curvature of the joint surface between the bottleneck and the bottle body. We use 35CrMo as the material, and its relevant parameters are shown in Table 1.
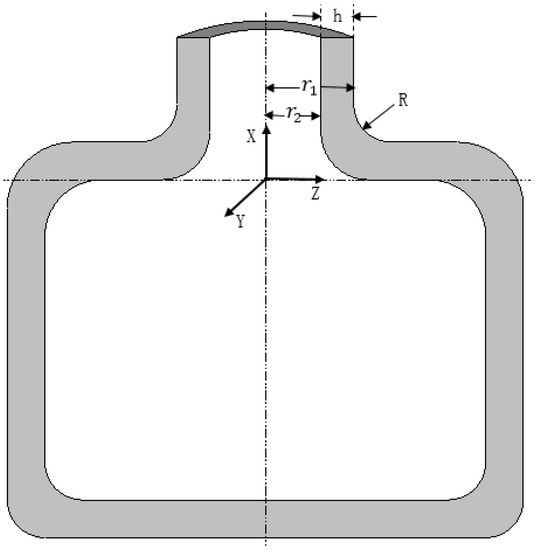
Figure 1.
The geometric model of the surface of the pressure vessel bottleneck.

Table 1.
Pressure vessel material parameters.
The thermal conductivity and constant pressure heat capacity C of 35CrMo are both functions of temperature change, and the satisfied relations are presented as Equations (13) and (14):
The constitutive equation of the 35CrMo is presented as Equation (15):
where . Additionally, the fracture toughness of 35CrMo is presented in Table 2.
Table 2.
The fracture toughness of 35CrMo.
After the setup of the corresponding parameters of 35CrMo, setting the working environment of the pressure vessel at room temperature, ABAQUS adopts the VonMises criterion, and the overall analysis adopts the ABAQUS/standard general static analysis step to carry out the ultimate load analysis of the structure. A uniform pressure load of 2.5 MPa is applied to the inner wall of the pressure vessel, and the moment module is added to the joint surface of the pressure vessel bottleneck and the bottle body to simulate the elastic flexural bearing capacity. In addition, the displacement constraints of and are applied, and an inertial load is applied in the X direction. The analysis process adopts the Newton iteration method for automatic load step loading. The stress load diagram of the pressure vessel is shown in Figure 2a.
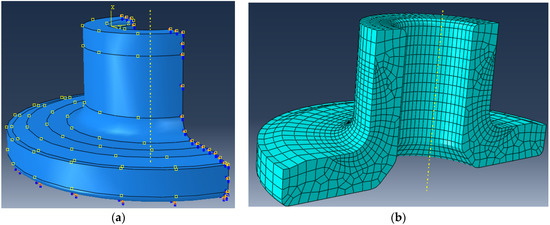
Figure 2.
Pressure vessel simulation structure diagram: (a) stress load diagram and (b) pressure vessel grid simulation model.
The grid density of the curved surface is set to 0.25 mm, and the other parts are set to 5 mm. The mesh model is shown in Figure 2b; the mesh around the surface is denser. As shown in Figure 3, it is the plan view of the normal direction of the crack growth model. The stress intensity distribution is calculated by FEA (finite element analysis). The brighter colors indicate higher stress, and it can be observed that the area of the crack tip has the greatest stress intensity.
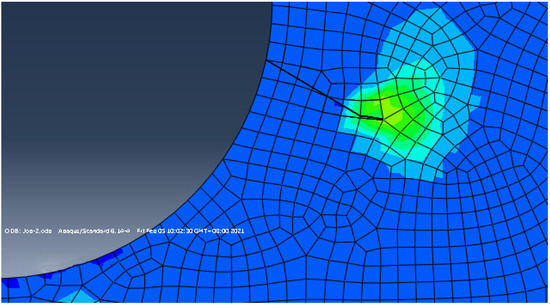
Figure 3.
Crack growth model.
3.2. Two-Point Displacement Extrapolation Method
In this paper, the stress intensity factor was calculated by the two-point displacement extrapolation method. First, obtain the displacement offset of the crack. Then, select the opening displacement of the crack surface; that is, the node displacement V of θ = π to calculate K, which can be calculated by Formula (16) with the corresponding .
where E is the modulus of elasticity, μ is the Poisson’s ratio, , v is the displacement, and r is the radius coordinate of the data point. The formula for calculating the stress intensity factor by the displacement extrapolation method is calculated by the opening displacement of the crack surface. It is an empirical formula. External factors, such as the crack initiation angle, directly affect the opening displacement of the crack surface and thus the stress intensity factor. Therefore, the stress intensity factor correction factor F can be obtained by Formulas (2) and (16).
3.3. Analysis of the Influencing Factors
The factors affecting the stress intensity include the radius of curvature R of the bottleneck joint bottle body, the wall thickness h of the pressure vessel, the length of the crack L, and the crack angle α. In order to express the influence of multiple factors on the stress intensity factor, the relationship between each factor and F is presented in the following figures.
The curvature radius of the bottleneck surface is set to 220 mm, 245 mm, 270 mm, 295 mm, 320 mm, and the wall thickness h and the crack length L are fixed values. Under different initiation angles, F and R are plotted. The law of change is shown in Figure 4a. The nonlinear regression method is used to calculate the fitting expression curve of F and R when the pressure vessel wall thickness h, crack length L, and the angle α between the crack direction and the axial direction are fixed values, as shown in Figure 4b.
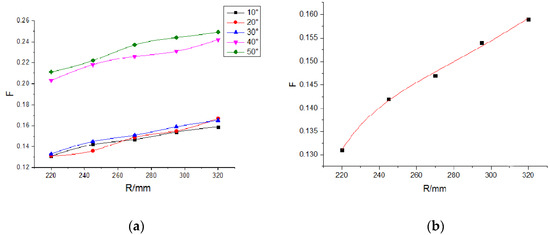
Figure 4.
The relationship curve between F and R (a) under different crack initiation angles, the law of change of F with R, and the (b) fitting curve of F and R when h, L and α are fixed values.
It can be observed from Figure 4a,b that the stress intensity factor correction factor F increases with the increase in the curvature radius R of the joint surface between the bottleneck of the pressure vessel and the bottle body.
The wall thickness of the pressure vessel is set at 4 cm, 6 cm, 8 cm, 10 cm, and 12 cm; the radius of curvature R and the crack length L are fixed values; and the change law of F and h is shown in Figure 5a. Similarly, when the radius of curvature R of the bottleneck of the pressure vessel, the crack length L, and the angle α between the crack direction and the axial direction are fixed values, the fitting relationship between F and h is shown in Figure 5b.
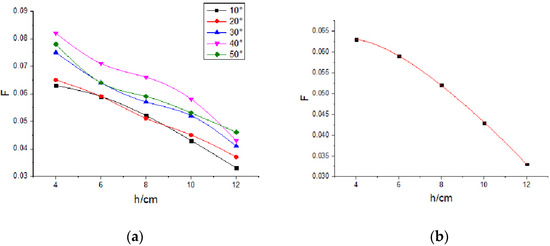
Figure 5.
The relationship curve between F and h (a) under different initiation angles, the law of change of F with h, and the (b) fitting curve of F and h when R, L, and α are fixed values.
It can be observed from Figure 5a,b that the stress intensity factor correction factor F decreases as the wall thickness h increases.
Set the initial state of the crack, take the length of the crack as 6 mm, 8 mm, 10 mm, 12 mm, and 14 mm, the radius of curvature R and the wall thickness have fixed values, and draw the law of change between F and L under different initiation angles, as shown in Figure 6a. Calculated when the pressure vessel bottleneck radius of the curvature R, wall thickness h, and the angle α between the crack direction and the axial direction are fixed values, the fitting relationship between F and L is shown in Figure 6b.
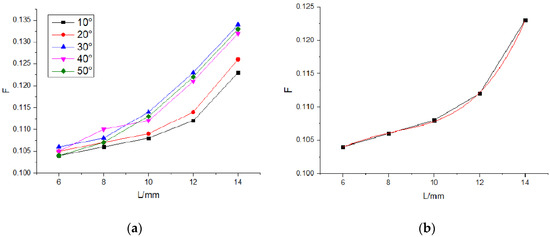
Figure 6.
The relationship curve between F and L: (a) the law of change of F with L under different initiation angles, and the (b) fitting curve of F and L when R, h, and α are fixed values.
It can be observed from Figure 6a,b that the stress intensity factor correction factor F increases as the crack length L increases.
Taking the radian of the angle between the crack direction and the axial direction as the independent variable, calculate the fitting relationship between F and α when the radius of curvature of the bottleneck of the pressure vessel R, the crack length L, and the wall thickness h of the pressure vessel are fixed values.
It can be observed from Figure 7 that the stress intensity factor correction coefficient F rapidly decreases, with the increase in α, and then there is little change in the fluctuation.
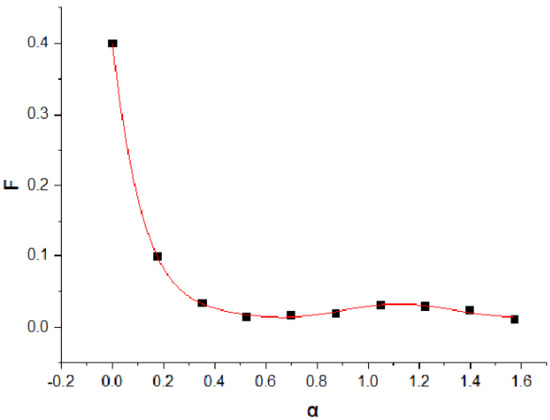
Figure 7.
The fitting curve of F and α when h and R fixed.
4. Establish a Crack Growth Model Based on Correction Factor F
In the present paper, the XFEM (extended finite element method) theory was used to establish a modified crack growth model. The initial crack was set to 2 mm and the initial angle was set to 30°. When calculating the crack propagation path, first discretize the crack propagation path into polyline segments, and then compare the strain energy of the crack tip with the strain energy required by the mesh. If the strain energy of the crack tip is stronger, the crack starts to grow. The direction of the crack propagation is determined by the maximum circumferential stress criterion. Repeatedly calculate the stress intensity factor amplitude of each discrete line segment, the crack propagation angle, and the coordinates of the crack tip position, and then simulate the crack. Each cycle represents 1 s, and the maximum cyclic pressure load is 5 KN; the minimum cyclic pressure load is 0.5 KN. The propagation path of the crack is shown in Figure 8.
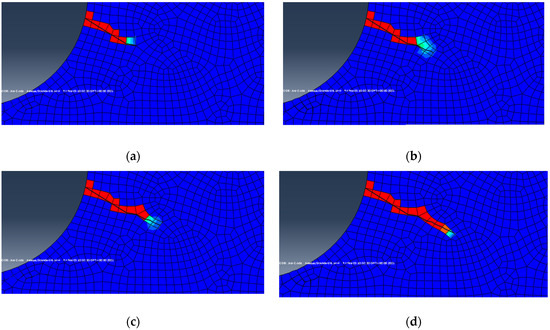
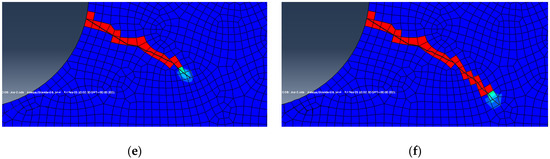
Figure 8.
The crack growth process diagram: (a) 0 cycles; (b) 50 cycles; (c) 100 cycles; (d) 150 cycles; (e) 200 cycles; and (f) 250 cycles.
Figure 8 shows the variation of the crack on the bottleneck surface of the pressure vessel with the cycle. The red cell in the figure indicates that the cell is completely damaged and a crack has formed. The crack expands from left to right, and the failed unit gradually expands to the right. Figure 8a is the crack growth diagram when the initial crack has not expanded. From Figure 8a,b, 50 cycles have passed, and 1 grid unit has been expanded. Additionally, after 50 cycles, Figure 8b,c expanded by 2 grid units, Figure 8c,d expanded by 3 grid units, and Figure 8d,e expanded by 3 grids. The element, from Figure 8e,f, extends 8 grid elements; the conclusion that can be obtained from the figure is that the more crack growth units, the faster the crack growth rate, with the same period increment. At the same time, analyzing the stress change at the crack tip during the propagation process shows that the maximum principal stress at the crack tip shows a trend of slowly increasing first and then rapidly decreasing.
In order to analyze the influence of the initial crack initiation angle α on the crack propagation path, the initial crack length is set to 2 mm. The initiation angles α of 30° and 40° are taken as the simulation examples. Under the same loading conditions, the crack propagation path diagram at the initiation angle of 30 and 40 is shown in Figure 9.
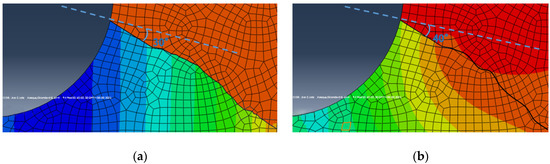
Figure 9.
The crack propagation path under different initiation angles: (a) 30° initiation angle and (b) 40° initiation angle.
The dotted line in Figure 9 represents the initial crack direction of the traditional crack propagation model. It can be observed from Figure 9a,b that, under the same geometric parameters, only the crack initiation angle α is different; the crack propagation path is also different. During the crack propagation process, the crack propagation direction frequently changes, and the crack propagation path presents a wave-shaped extension and expansion, and the crack propagation path at the initiation angle of 40° in Figure 9b is more “fluctuated” than the crack propagation path at the initiation angle of 30° in Figure 9a. This is because, based on the maximum circumferential stress criterion, the crack propagation direction is always along the maximum circumferential stress direction, and the existence of the crack initiation angle causes the dislocation of the crack tip to be blocked, and then multiple stress concentrations occur, and the greater the crack initiation angle, the peak energy release rate of the crack tip is higher, and the driving force for crack growth is greater. The crack tip can release strain energy by changing the direction and reduce the strain concentration. Therefore, the greater the initiation angle, the greater the “undulations” of the crack propagation.
For a quantitative analysis, taking the crack initiation angle of 30° and the crack initiation angle of 40° as examples, the results of the deflection angle of the crack propagation path and the crack propagation amount during the cycle are recorded in Table 3. α is the crack propagation deviation angle, based on the crack propagation path of the previous grid unit; counterclockwise is a positive value, and clockwise rotation is a negative value. For the initial crack, α is the deviation angle set on the basis of the initial crack of the traditional crack propagation model.
Table 3.
The step-by-step loading fatigue expansion experiment.
From Table 3, we can observe the crack growth direction and the amount of crack growth at different cycles. By comparing the crack propagation direction when the crack initiation angle is 30° and 40°, it can be observed that the crack propagation angle corresponding to the crack initiation angle of 30° is greater, and the direction is counterclockwise. The crack initiation angle of 40° corresponds to a smaller crack propagation angle, but the direction is clockwise. Analyzed by the strain energy, the clockwise direction is the direction facing away from the original crack propagation path, so the required strain energy is greater. When the crack initiation angle is 40°, the accumulated strain energy is too high and the crack has to follow the clockwise direction. When the crack initiation angle is 30°, the accumulated strain energy is not enough to support the re-planning of the crack path, and the crack expands in the counterclockwise direction. By comparing the crack growth amount when the crack initiation angle is 30° and 40°, under the same cycle period, the crack growth amount corresponding to the 40° crack initiation angle is generally greater than the crack growth amount corresponding to the 30° crack initiation angle. For the same time period, the higher the strain energy, the greater the crack growth and the faster the crack growth rate. Therefore, the greater the crack initiation angle, the larger the crack growth, the faster the crack growth speed, and the more obvious the crack growth offset.
5. Verification
In Table 4, E is the elastic modulus of the material, μ is the Poisson’s ratio of the material, L is the initial crack length, and D is the wall thickness of the pressure vessel. Table 4 presents the experimental results of the effect of temperature on the crack growth rate. The experimental conclusions are as follows: (1) the crack growth rate increases with the increase in the temperature and, (2) at different temperatures, the fatigue crack growth rate equation is different.
Table 4.
The model calculation example parameters.
In comparison to the traditional stress intensity factor model of the crack growth presented in Table 5, the crack growth rate at room temperature is shown in Figure 10.
Table 5.
The test results of the fatigue crack growth.
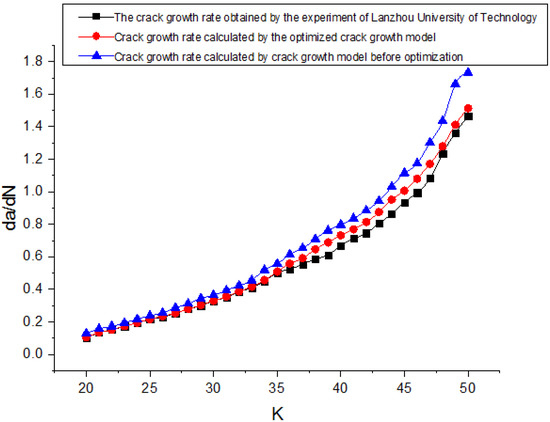
Figure 10.
A comparison of the results of the crack growth rate.
It can be observed from the comparison in Figure 10 that the modified stress intensity factor model has the same growth trend with the traditional stress intensity factor model, and the modified curve is evidently closer to the experimental data. Therefore, the crack growth rate calculated by the optimized crack growth model is more reliable.
6. Conclusions
The present paper modifies the traditional stress intensity factor model and analyzes the relationship between the modified stress intensity factor and the pressure vessel wall thickness h, the curvature radius of the joint surface between the bottleneck and the bottle body R, the initial crack length L, and the crack initiation angle α, and calculates the modified stress intensity factor to optimize the crack. The expansion model presents the following conclusions: (1) the smoother the surface, the faster the crack growth; (2) the longer the initial crack length, the faster the crack growth rate; and (3) the greater the crack initiation angle, the greater the strain energy of the crack tip, the greater the crack propagation undulation, and the faster the crack propagation rate. Secondly, the initial angle influences the crack growth path and crack growth rate by simulation. Finally, in comparison to the traditional stress intensity factor model in terms of the crack growth rate, the modified stress intensity factor can calculate the crack propagation rate more accurately when the initiation angle of the curved surface is not 0°.
Author Contributions
Conceptualization, X.Z., T.Z. and R.H.; methodology, T.Z. and R.H.; software, T.Z.; validation, T.Z. and R.H.; investigation, T.Z.; resources, X.Z. and Z.L.; data curation, T.Z.; writing—original draft preparation, X.Z., R.H. and T.Z.; writing—review and editing, X.Z. and R.H.; supervision, Z.L.; project administration, X.Z. and Z.L.; funding acquisition, Z.L. All authors have read and agreed to the published version of the manuscript.
Funding
This work was supported by the National Natural Science Foundation of China under Grants No. U1830133 (NSFC) and Project of Sichuan Youth Science and Technology Innovation Team, China (Grant No. 2020JDTD0008).
Informed Consent Statement
Not applicable.
Conflicts of Interest
The authors declare no conflict of interest.
References
- Akhi, A.H.; Dhar, A.S. Stress intensity factors for external corrosions and cracking of buried cast iron pipes. Eng. Fract. Mech. 2021, 250, 107778. [Google Scholar] [CrossRef]
- Zvyagin, A.V.; Luzhin, A.A.; Smirnov, N.N.; Shamina, A.A.; Shamin, A.Y. Stress intensity factors for branching cracks in space structures. Acta Astronaut. 2021, 180, 66–72. [Google Scholar] [CrossRef]
- Dong, Q.; Yang, P.; Xu, G.; Deng, J. Mechanisms and modeling of low cycle fatigue crack propagation in a pressure vessel steel Q345. Int. J. Fatigue 2016, 89, 2–10. [Google Scholar] [CrossRef]
- Sarkar, A.; Kumawat, B.K.; Chakravartty, J.K. Low cycle fatigue behavior of a ferritic reactor pressure vessel steel. J. Nucl. Mater. 2015, 462, 273–279. [Google Scholar] [CrossRef]
- Mora, D.F.; Niffenegger, M. A new simulation approach for crack initiation, propagation and arrest in hollow cylinders under thermal shock based on XFEM. Nucl. Eng. Des. 2022, 386, 111582. [Google Scholar] [CrossRef]
- Ayhan, A.O. Stress intensity factor solutions and equations for radial surface cracks contained in rotating hollow disks. Theor. Appl. Fract. Mech. 2021, 112, 102828. [Google Scholar] [CrossRef]
- Tang, H.Z.; Huang, J.Z.; He, J.Y.; Hua, W.; Dong, S.M. Stress intensity factors for a centrally cracked Brazilian disk under non-uniformly distributed pressure. Theor. Appl. Fract. Mech. 2021, 114, 103001. [Google Scholar] [CrossRef]
- Zhu, Y.Q.; Yan, B.; Cai, D.D.; Wu, K.W.; Zhang, X.M. Structural parameter study on stress intensity factors of interfacial crack in thermal barrier coatings. Ceram. Int. 2021, 47, 14354–14365. [Google Scholar] [CrossRef]
- Shen, Q.Q.; Rao, Q.H.; Li, Z.; Yi, W.; Sun, D.L. Interacting mechanism and initiation prediction of multiple cracks. Trans. Nonferrous Met. Soc. China 2021, 31, 779–791. [Google Scholar] [CrossRef]
- Zhang, B.; Xu, W.; Wu, X.R.; Yu, Y.; Dong, D.K. Stress intensity factors and plastic zones of stiffened panels with multiple collinear cracks. Theor. Appl. Fract. Mech. 2020, 110, 102816. [Google Scholar] [CrossRef]
- Wang, X.; Chen, K.Y. Determination of complex stress intensity factors for interface cracks in bi-material specimens subjected to ununiform stresses. Eng. Fract. Mech. 2021, 246, 107619. [Google Scholar] [CrossRef]
- Shen, W.; Choo, Y.S. Stress intensity factor for a tubular T-joint with grouted chord. Eng. Struct. 2012, 35, 37–47. [Google Scholar] [CrossRef]
- Wang, X.; Schiavone, P. A crack on a cycloid rough bimaterial interface. Mech. Mater. 2021, 158, 103842. [Google Scholar] [CrossRef]
- Ishimoto, J.; Sato, T.; Combescure, A. Computational approach for hydrogen leakage with crack propagation of pressure vessel wall using coupled particle and Euler method. Int. J. Hydrogen Energy 2017, 42, 10656–10682. [Google Scholar] [CrossRef]
- Zhou, B.; Zhou, L.; Chang, L.; Zhou, C.; Ye, C.; Zhang, B. Investigation on fatigue crack propagation law of the crack perpendicular to interface for Zr/Ti/steel composite plate. Int. J. Press. Vessel. Pip. 2022, 195, 104594. [Google Scholar] [CrossRef]
- Sih, G.C. Strain-energy-density factor applied to mixed mode crack problems. Int. J. Fract. 1974, 10, 305–321. [Google Scholar] [CrossRef]
- Paris, P.; Erdogan, F. A critical analysis of crack propagation laws. J. Basic Eng. 1963, 85, 528–533. [Google Scholar] [CrossRef]
Publisher’s Note: MDPI stays neutral with regard to jurisdictional claims in published maps and institutional affiliations. |
© 2022 by the authors. Licensee MDPI, Basel, Switzerland. This article is an open access article distributed under the terms and conditions of the Creative Commons Attribution (CC BY) license (https://creativecommons.org/licenses/by/4.0/).