
Crack Propagation on the Surface of the Bottleneck of a Pressure Vessel Considering the Initial Crack Angle


Abstract
:1. Introduction
2. Theoretical Derivation
2.1. Stress Intensity Factor Correction Formula
2.2. Based on the Revised Crack Growth Formula
3. Simulation of the Stress Intensity Factor Correction Factor
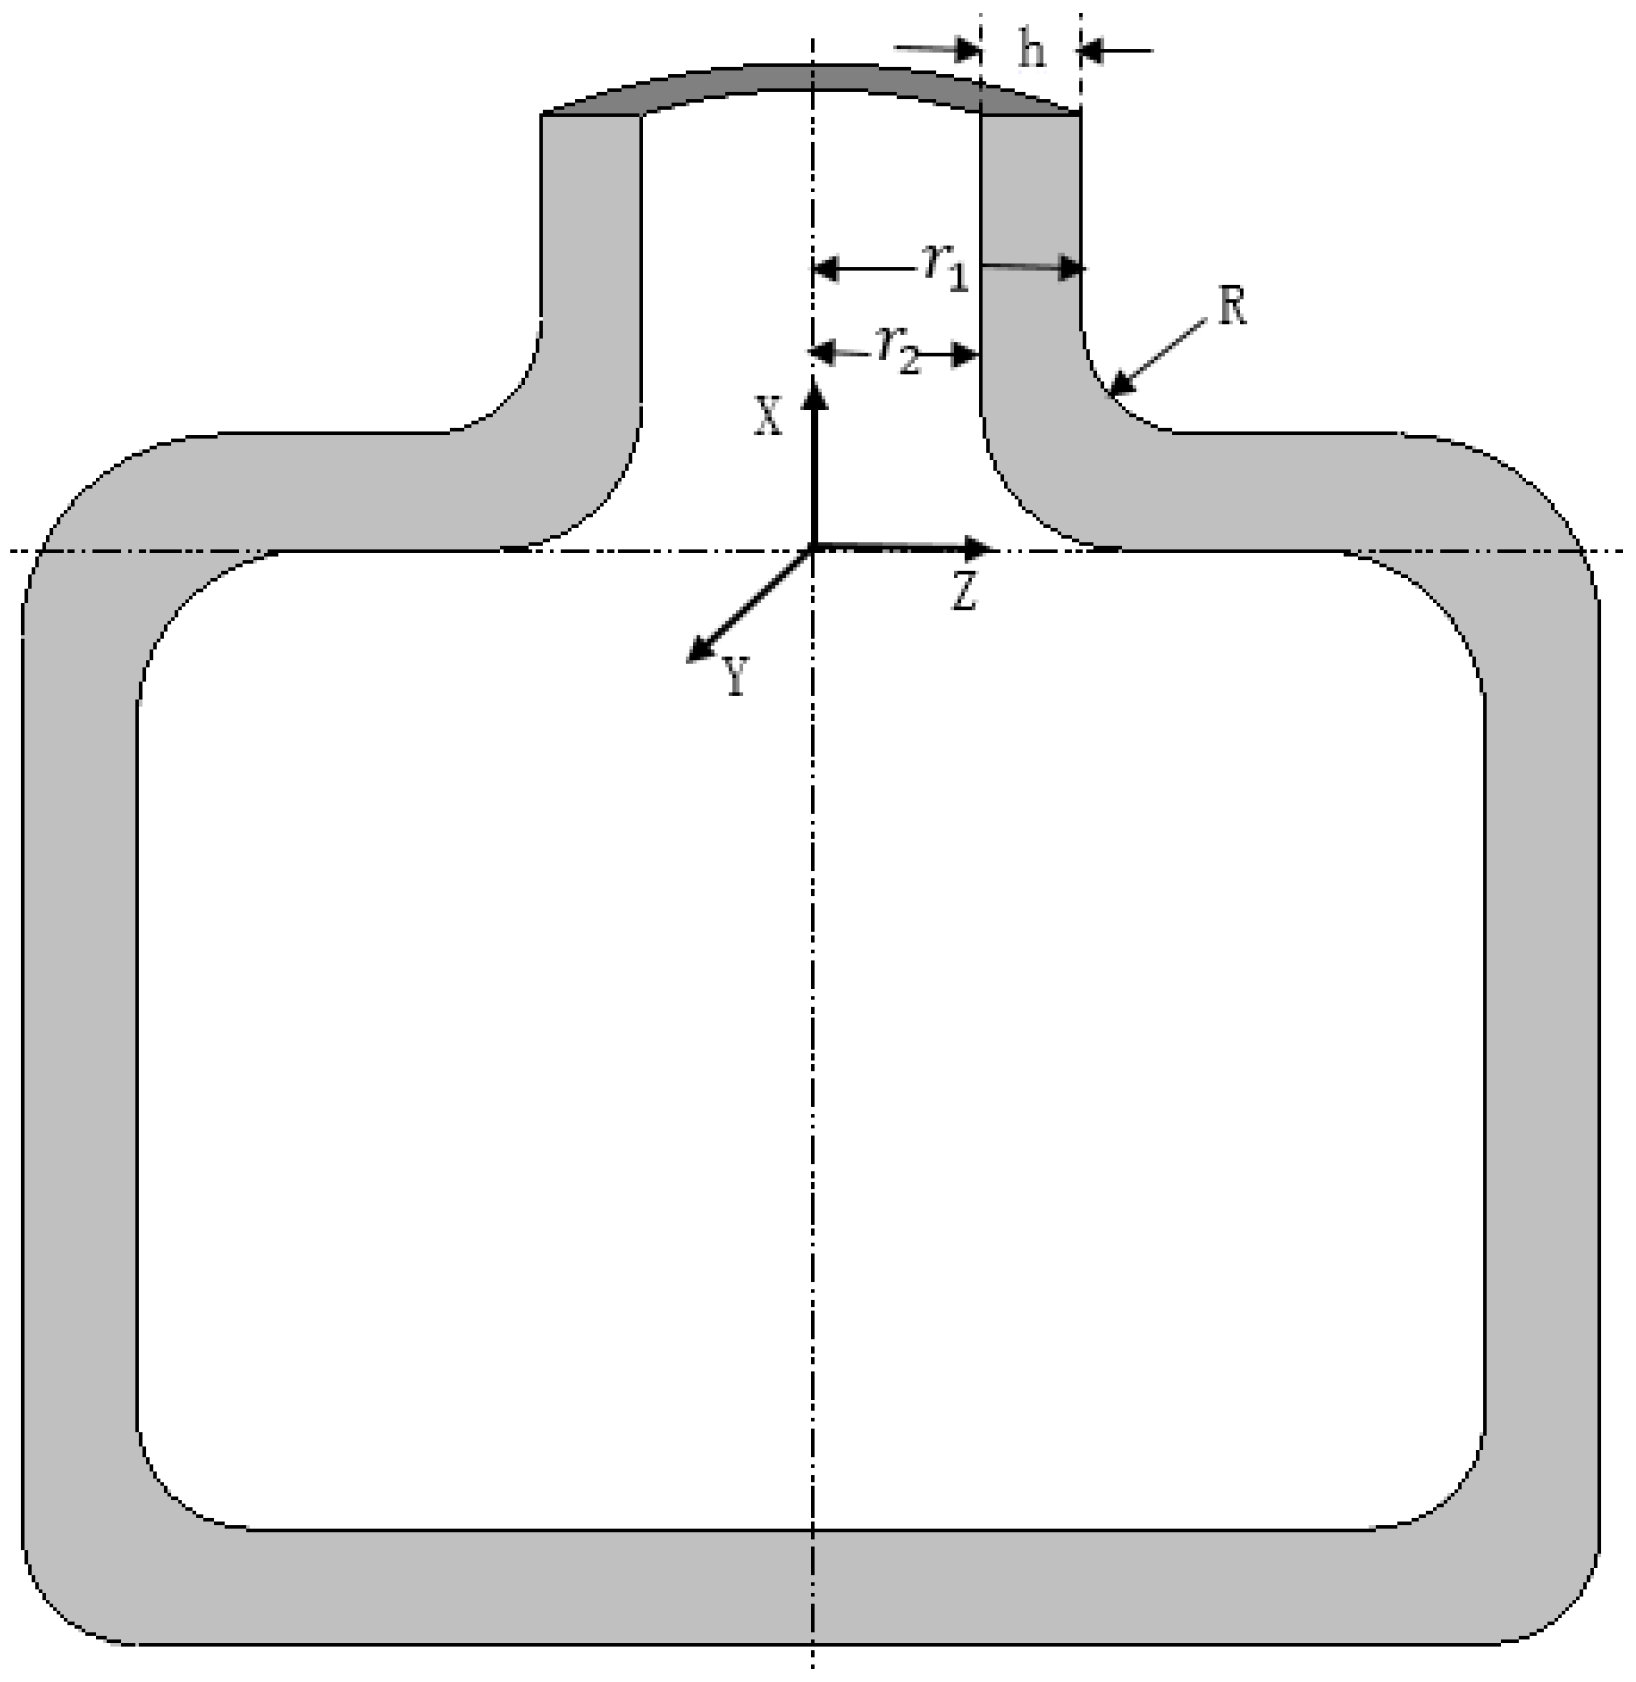
3.1. Model Establishment
3.2. Two-Point Displacement Extrapolation Method
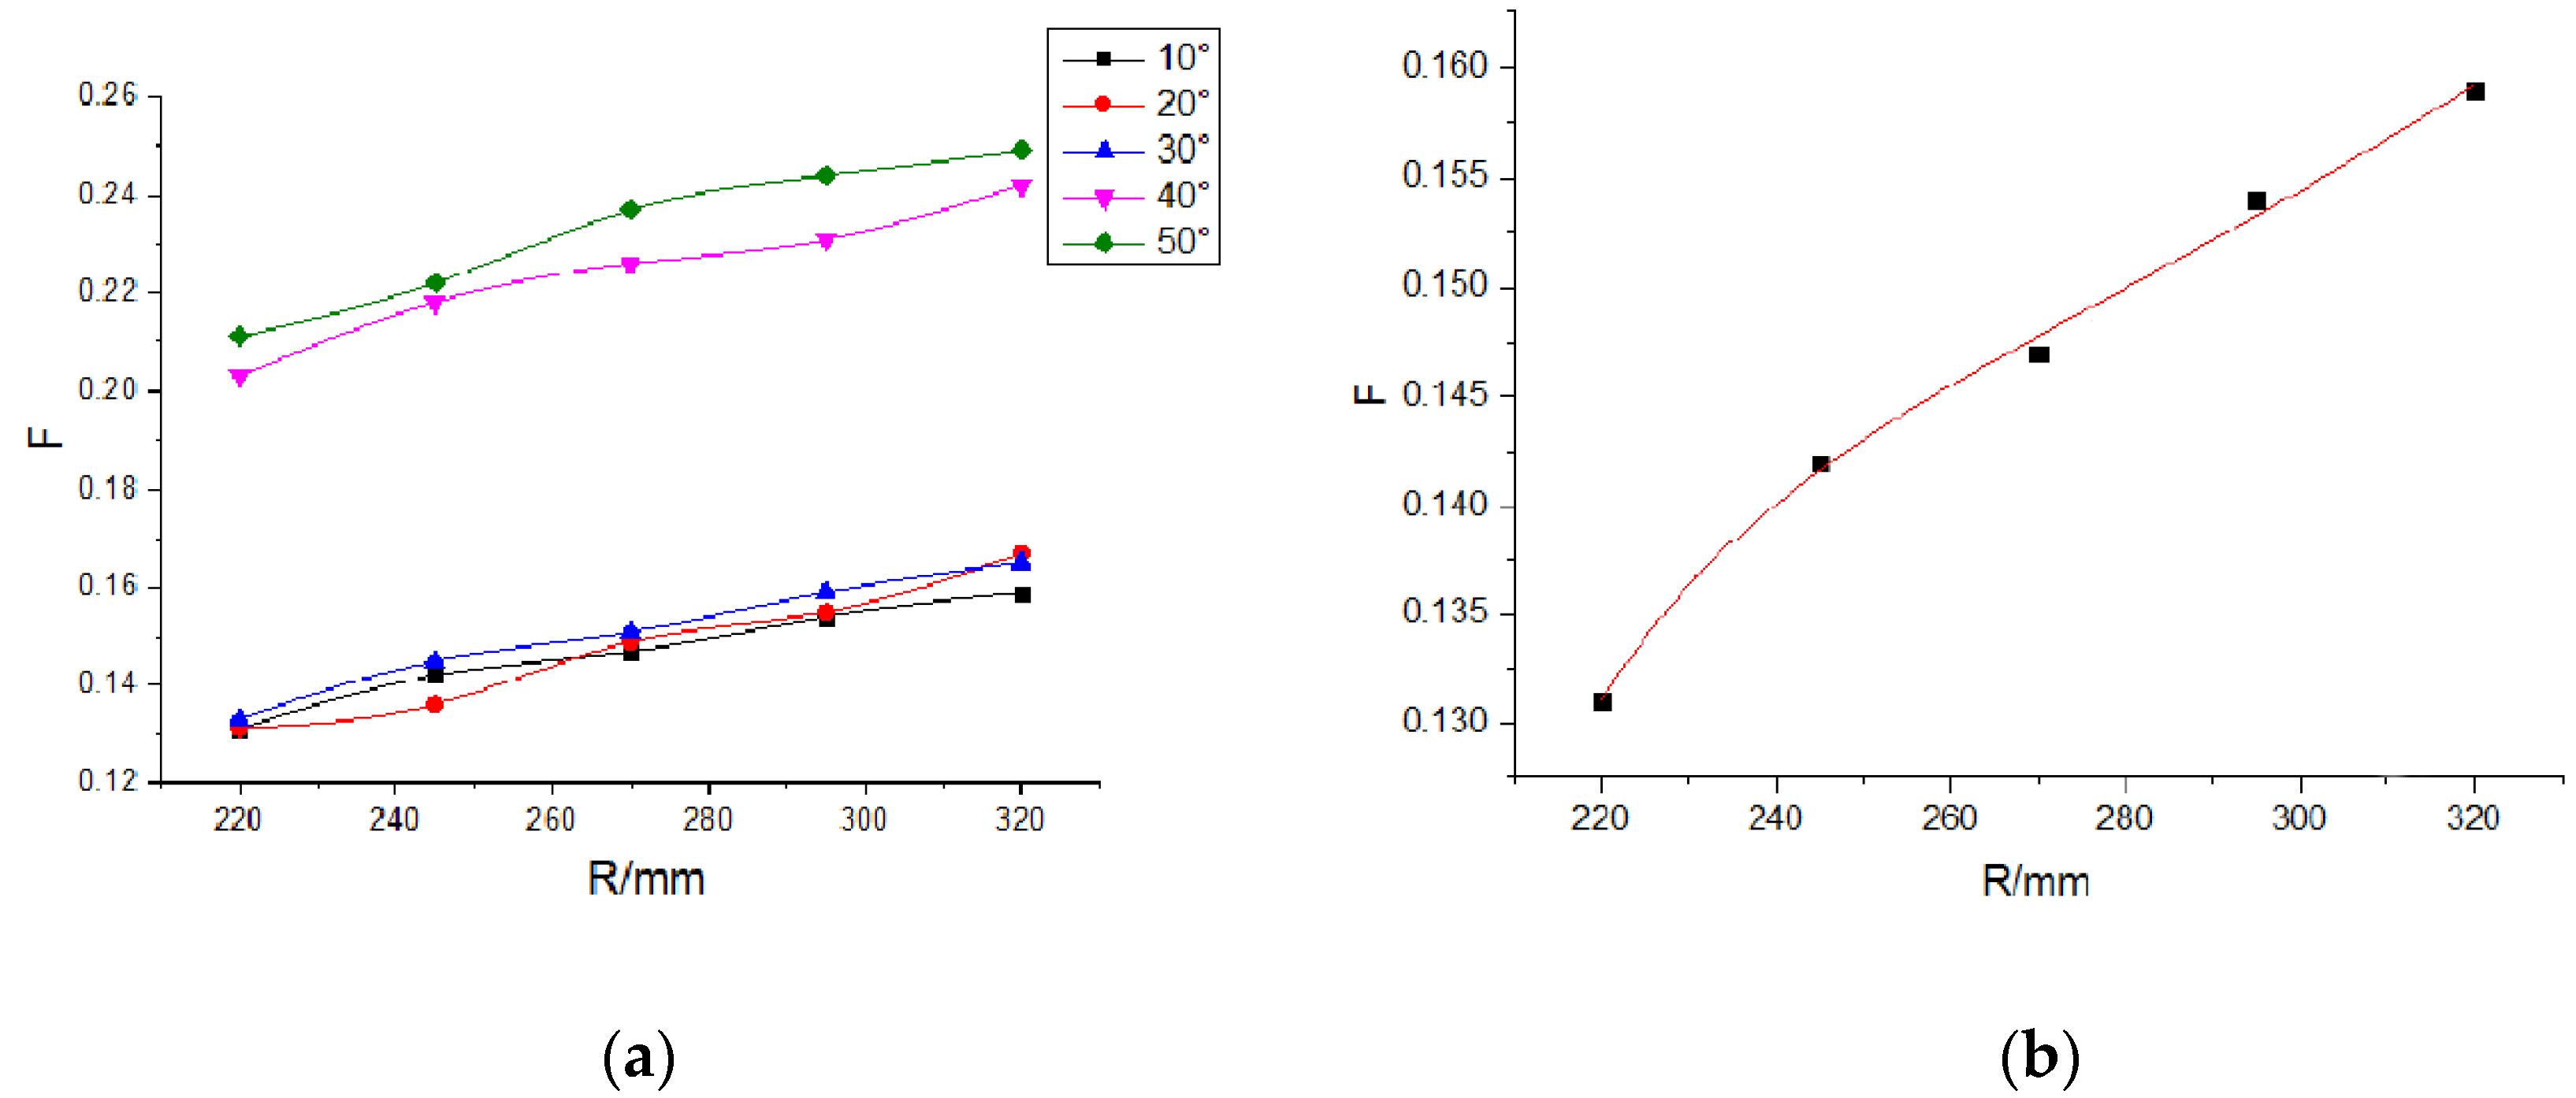
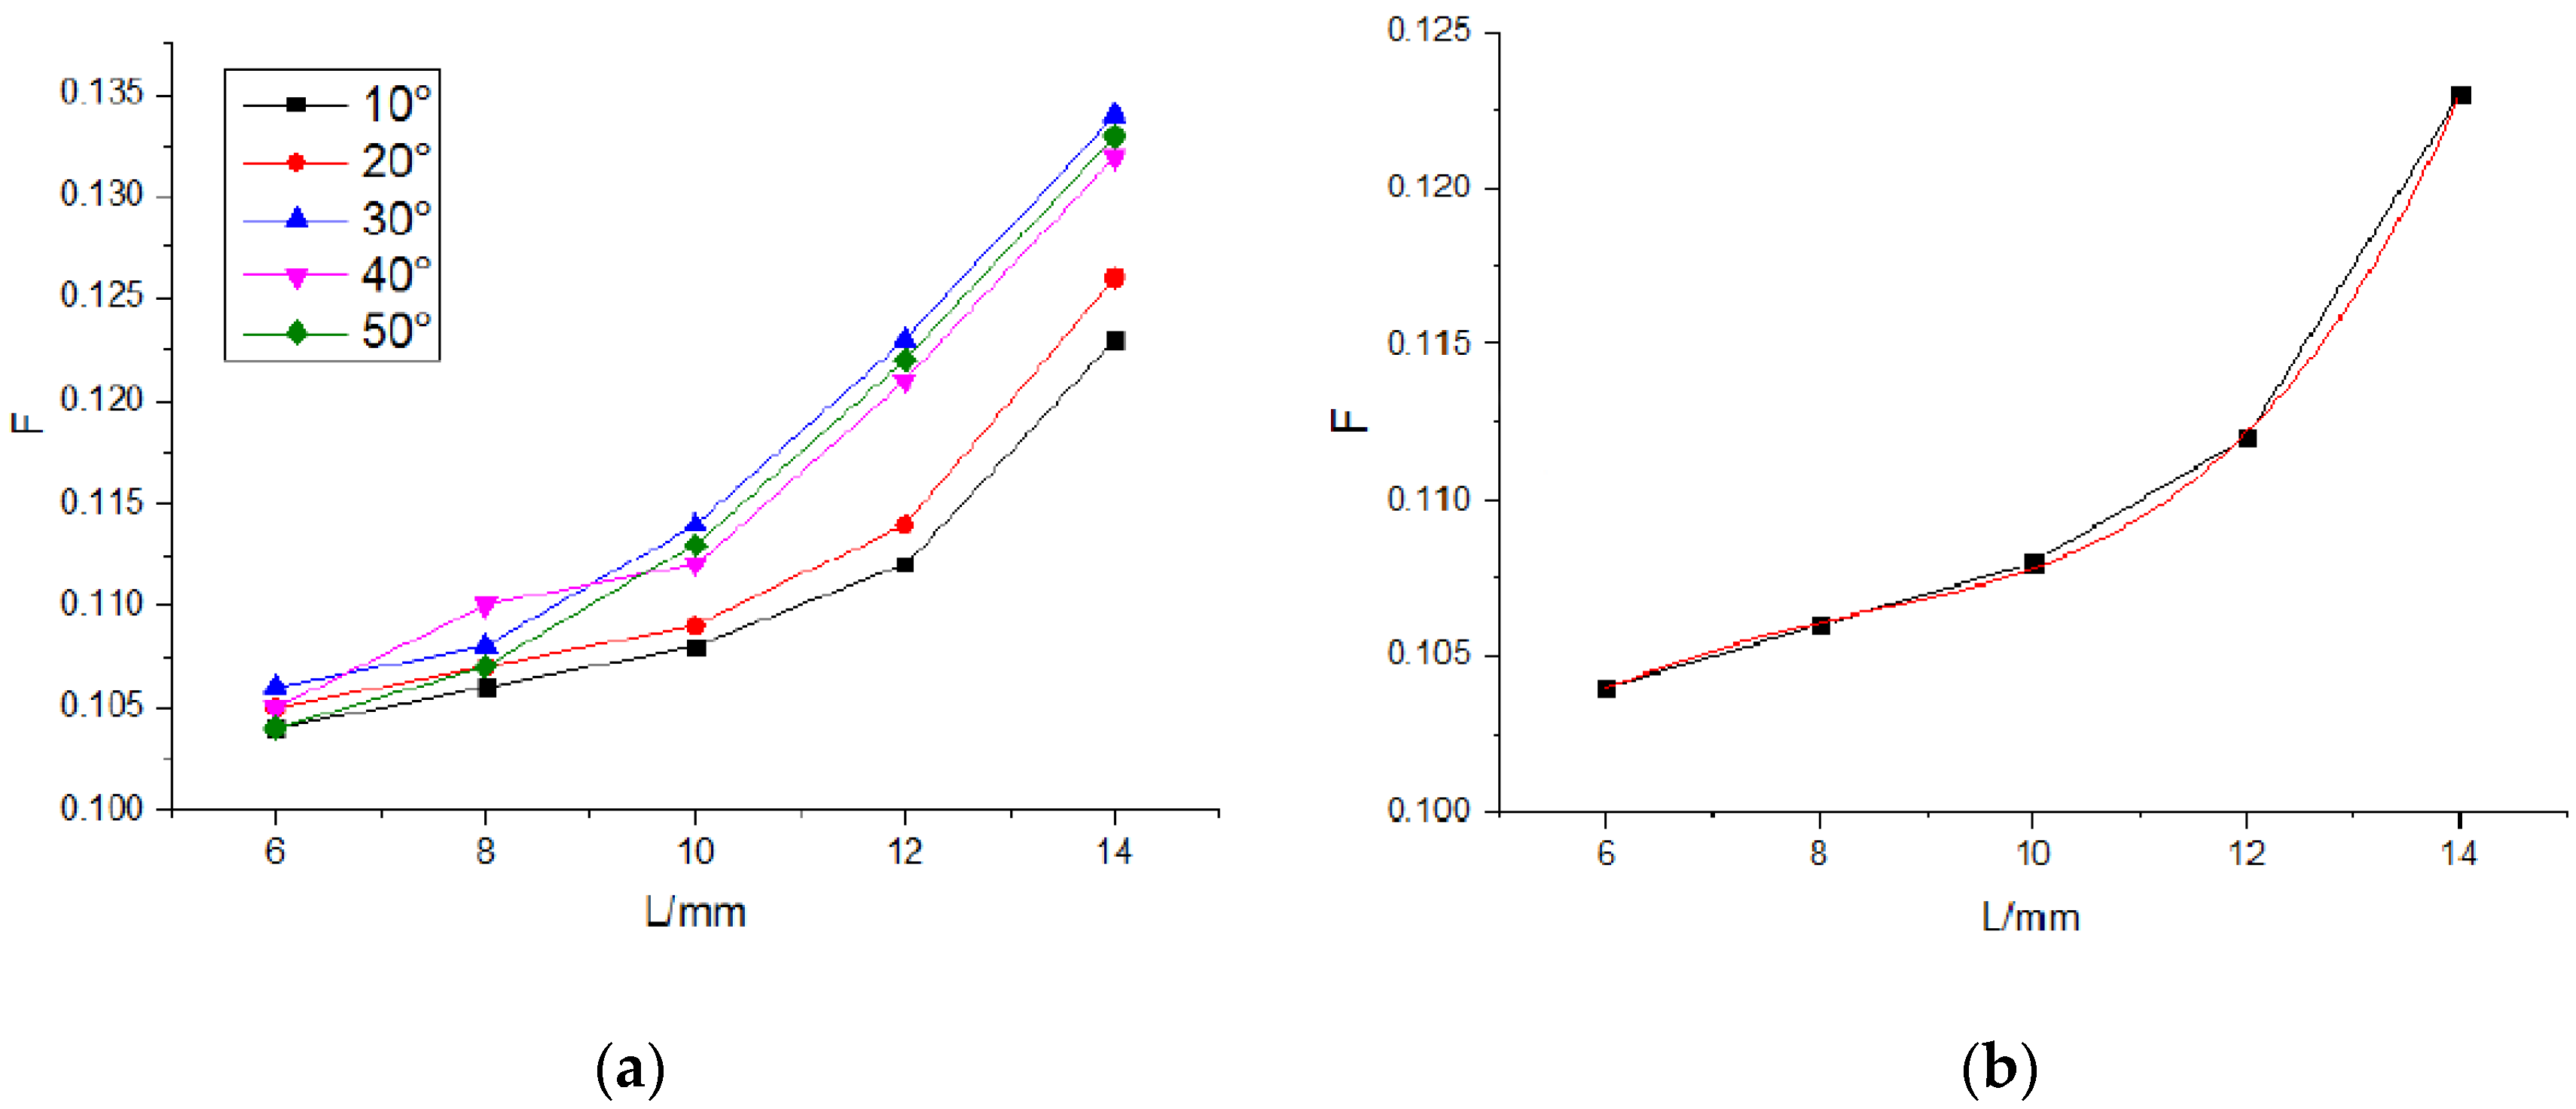
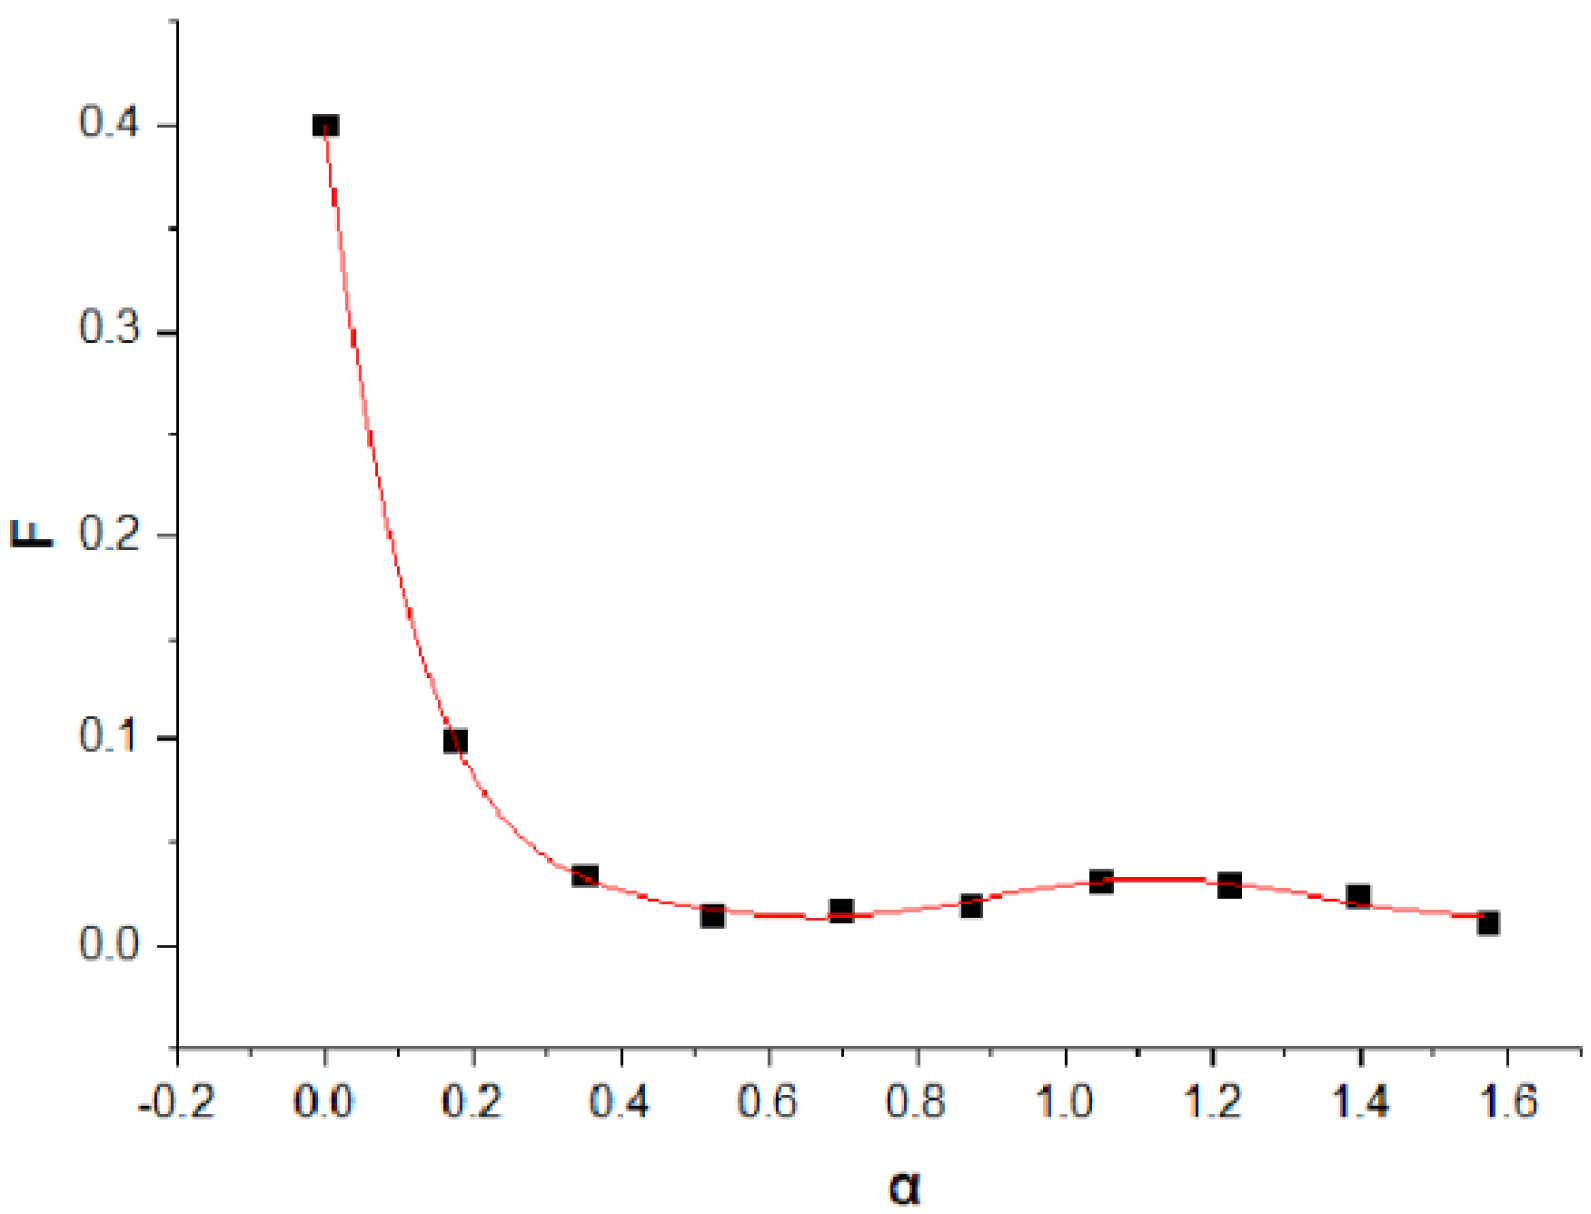
3.3. Analysis of the Influencing Factors
4. Establish a Crack Growth Model Based on Correction Factor F
5. Verification
6. Conclusions
Author Contributions
Funding
Informed Consent Statement
Conflicts of Interest
References
- Akhi, A.H.; Dhar, A.S. Stress intensity factors for external corrosions and cracking of buried cast iron pipes. Eng. Fract. Mech. 2021, 250, 107778. [Google Scholar] [CrossRef]
- Zvyagin, A.V.; Luzhin, A.A.; Smirnov, N.N.; Shamina, A.A.; Shamin, A.Y. Stress intensity factors for branching cracks in space structures. Acta Astronaut. 2021, 180, 66–72. [Google Scholar] [CrossRef]
- Dong, Q.; Yang, P.; Xu, G.; Deng, J. Mechanisms and modeling of low cycle fatigue crack propagation in a pressure vessel steel Q345. Int. J. Fatigue 2016, 89, 2–10. [Google Scholar] [CrossRef]
- Sarkar, A.; Kumawat, B.K.; Chakravartty, J.K. Low cycle fatigue behavior of a ferritic reactor pressure vessel steel. J. Nucl. Mater. 2015, 462, 273–279. [Google Scholar] [CrossRef]
- Mora, D.F.; Niffenegger, M. A new simulation approach for crack initiation, propagation and arrest in hollow cylinders under thermal shock based on XFEM. Nucl. Eng. Des. 2022, 386, 111582. [Google Scholar] [CrossRef]
- Ayhan, A.O. Stress intensity factor solutions and equations for radial surface cracks contained in rotating hollow disks. Theor. Appl. Fract. Mech. 2021, 112, 102828. [Google Scholar] [CrossRef]
- Tang, H.Z.; Huang, J.Z.; He, J.Y.; Hua, W.; Dong, S.M. Stress intensity factors for a centrally cracked Brazilian disk under non-uniformly distributed pressure. Theor. Appl. Fract. Mech. 2021, 114, 103001. [Google Scholar] [CrossRef]
- Zhu, Y.Q.; Yan, B.; Cai, D.D.; Wu, K.W.; Zhang, X.M. Structural parameter study on stress intensity factors of interfacial crack in thermal barrier coatings. Ceram. Int. 2021, 47, 14354–14365. [Google Scholar] [CrossRef]
- Shen, Q.Q.; Rao, Q.H.; Li, Z.; Yi, W.; Sun, D.L. Interacting mechanism and initiation prediction of multiple cracks. Trans. Nonferrous Met. Soc. China 2021, 31, 779–791. [Google Scholar] [CrossRef]
- Zhang, B.; Xu, W.; Wu, X.R.; Yu, Y.; Dong, D.K. Stress intensity factors and plastic zones of stiffened panels with multiple collinear cracks. Theor. Appl. Fract. Mech. 2020, 110, 102816. [Google Scholar] [CrossRef]
- Wang, X.; Chen, K.Y. Determination of complex stress intensity factors for interface cracks in bi-material specimens subjected to ununiform stresses. Eng. Fract. Mech. 2021, 246, 107619. [Google Scholar] [CrossRef]
- Shen, W.; Choo, Y.S. Stress intensity factor for a tubular T-joint with grouted chord. Eng. Struct. 2012, 35, 37–47. [Google Scholar] [CrossRef]
- Wang, X.; Schiavone, P. A crack on a cycloid rough bimaterial interface. Mech. Mater. 2021, 158, 103842. [Google Scholar] [CrossRef]
- Ishimoto, J.; Sato, T.; Combescure, A. Computational approach for hydrogen leakage with crack propagation of pressure vessel wall using coupled particle and Euler method. Int. J. Hydrogen Energy 2017, 42, 10656–10682. [Google Scholar] [CrossRef]
- Zhou, B.; Zhou, L.; Chang, L.; Zhou, C.; Ye, C.; Zhang, B. Investigation on fatigue crack propagation law of the crack perpendicular to interface for Zr/Ti/steel composite plate. Int. J. Press. Vessel. Pip. 2022, 195, 104594. [Google Scholar] [CrossRef]
- Sih, G.C. Strain-energy-density factor applied to mixed mode crack problems. Int. J. Fract. 1974, 10, 305–321. [Google Scholar] [CrossRef]
- Paris, P.; Erdogan, F. A critical analysis of crack propagation laws. J. Basic Eng. 1963, 85, 528–533. [Google Scholar] [CrossRef]


| Density (kg/m3) | Elastic Modulus E (GPa) | Poisson’s Ratio | Linear Expansion Coefficient (/°C) |
|---|---|---|---|
| 7800 | 210 | 0.3 | 1.35 × 10⁻⁵ |
| Temperature (°C) | Elastic Modulus (105 MPa) | Yield Strength (MPa) |
|---|---|---|
| 20 | 1.95 | 172.00 |
| 200 | 1.83 | 120.70 |
| 400 | 1.69 | 101.30 |
| 550 | 1.55 | 91.03 |
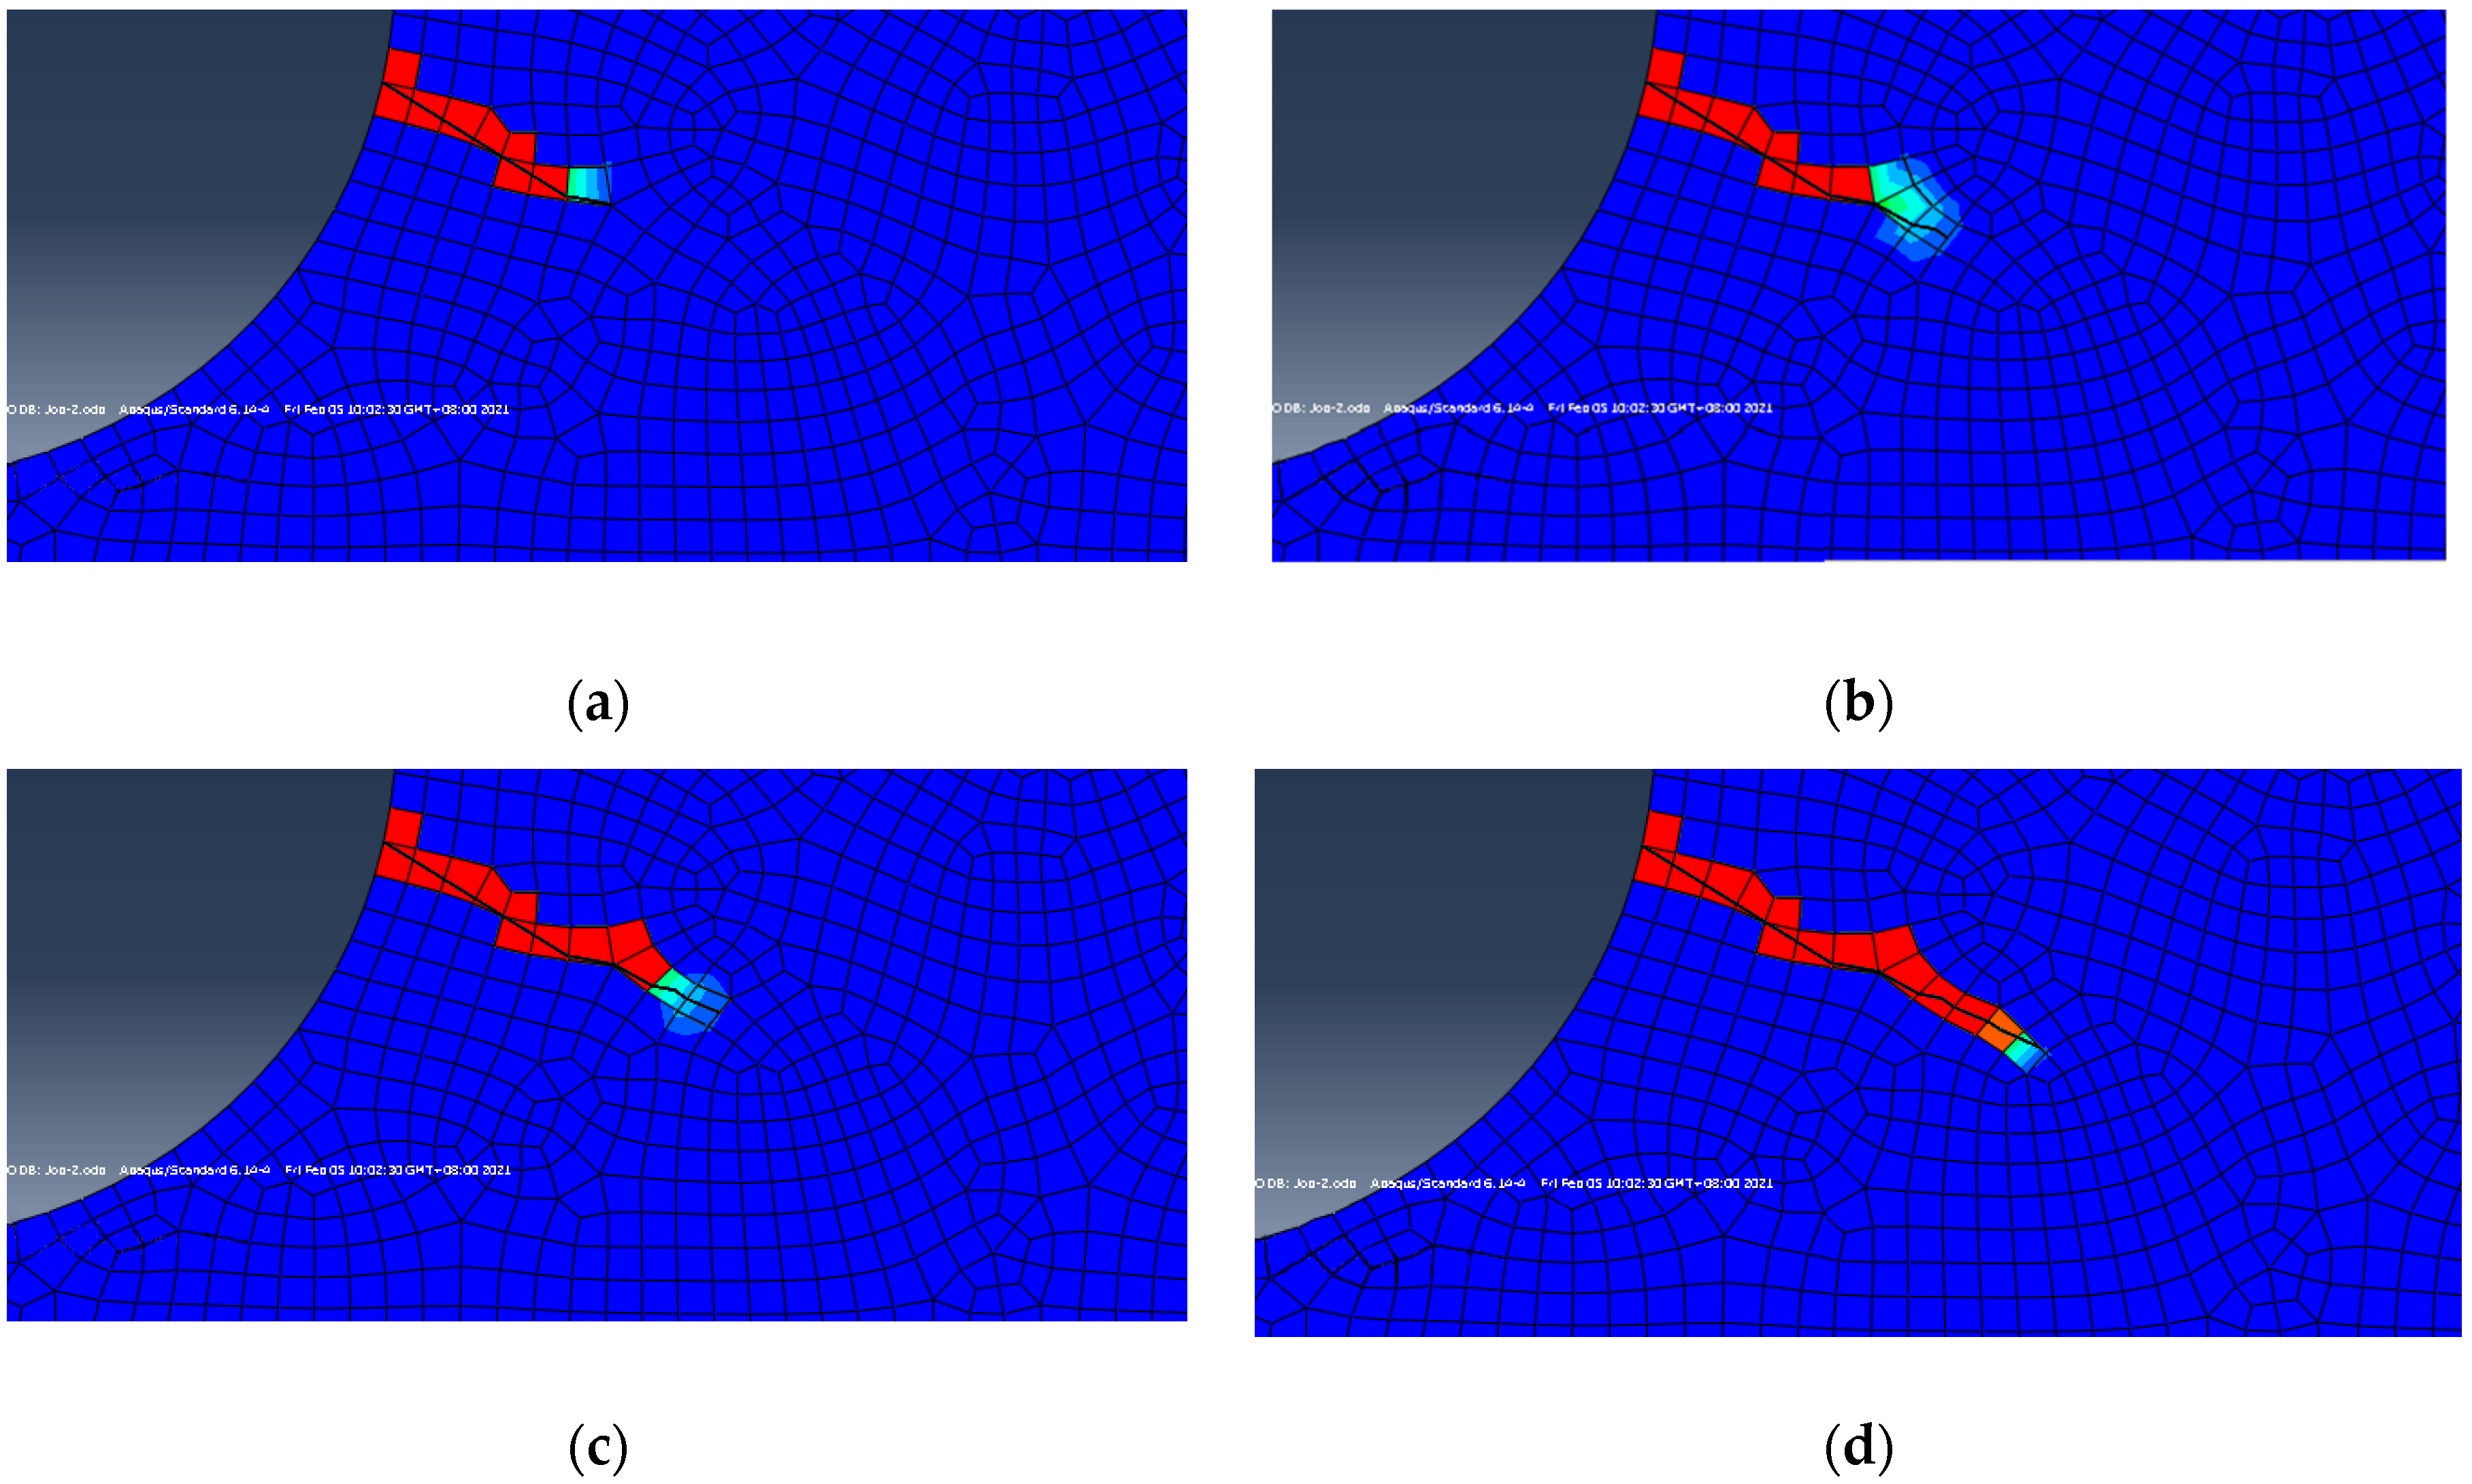
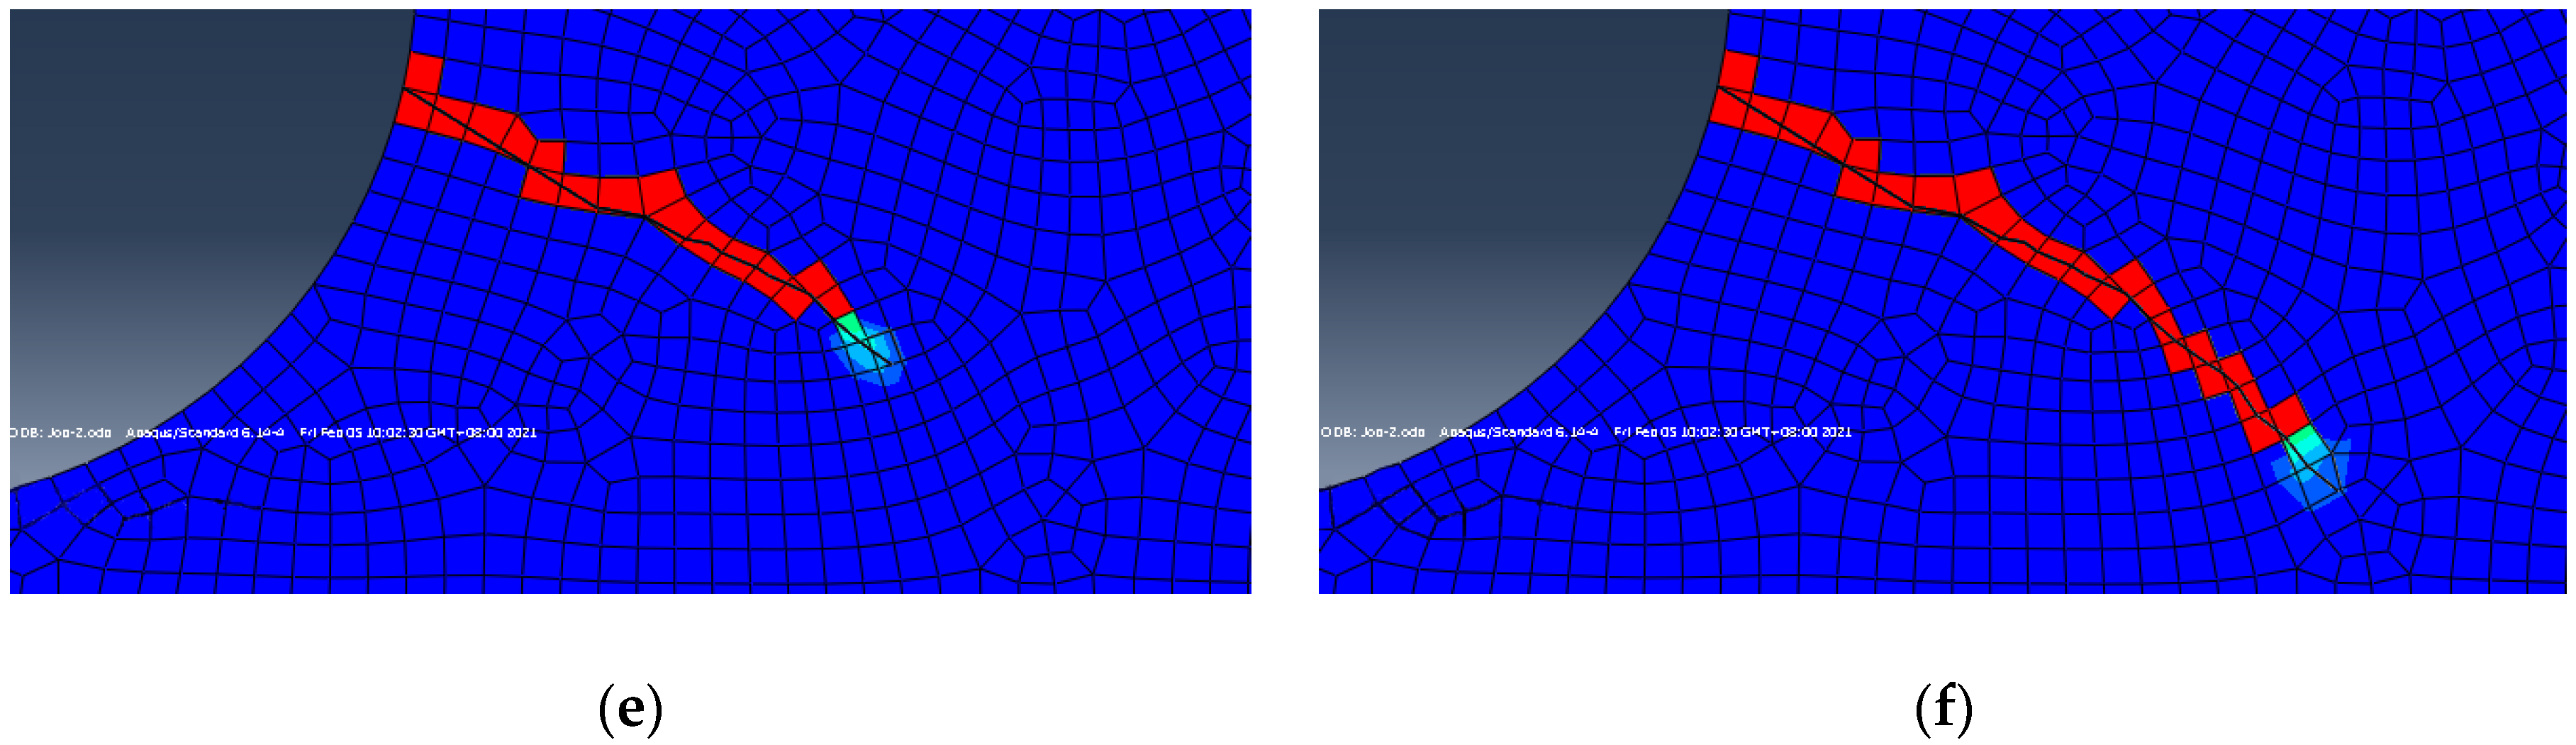
| Crack Angle | Cycle Period | α/° | Crack Growth Length/mm |
|---|---|---|---|
| 30° | 50 | 30 | 1.388 |
| 150 | 37 | 1.583 | |
| 250 | −8 | 1.792 | |
| 40° | 50 | 40 | 1.417 |
| 150 | −18 | 1.739 | |
| 250 | 9 | 2.042 |
| Material Properties | Geometric Size (mm) | Internal Pressure (Mpa) |
|---|---|---|
| L = 10 D = 100 | 1 MPa |
| Temperature °C | Fatigue Crack Growth Rate Equation |
|---|---|
| 36 | |
| 200 | |
| 400 | |
| 550 |
Publisher’s Note: MDPI stays neutral with regard to jurisdictional claims in published maps and institutional affiliations. |
© 2022 by the authors. Licensee MDPI, Basel, Switzerland. This article is an open access article distributed under the terms and conditions of the Creative Commons Attribution (CC BY) license (https://creativecommons.org/licenses/by/4.0/).
Share and Cite
Zhou, X.; He, R.; Zhou, T.; Liu, Z. Crack Propagation on the Surface of the Bottleneck of a Pressure Vessel Considering the Initial Crack Angle. Appl. Sci. 2022, 12, 3913. https://doi.org/10.3390/app12083913
Zhou X, He R, Zhou T, Liu Z. Crack Propagation on the Surface of the Bottleneck of a Pressure Vessel Considering the Initial Crack Angle. Applied Sciences. 2022; 12(8):3913. https://doi.org/10.3390/app12083913
Chicago/Turabian StyleZhou, Xiuyun, Ruijie He, Ting Zhou, and Zhen Liu. 2022. "Crack Propagation on the Surface of the Bottleneck of a Pressure Vessel Considering the Initial Crack Angle" Applied Sciences 12, no. 8: 3913. https://doi.org/10.3390/app12083913
APA StyleZhou, X., He, R., Zhou, T., & Liu, Z. (2022). Crack Propagation on the Surface of the Bottleneck of a Pressure Vessel Considering the Initial Crack Angle. Applied Sciences, 12(8), 3913. https://doi.org/10.3390/app12083913